Article

Raman-Laser System for Absolute Gravimeter Based On 87Rb Atom Interferometer

National Institute of Metrology, Beijing 100029, China
*
Author to whom correspondence should be addressed.
Photonics 2020, 7(2), 32; https://doi.org/10.3390/photonics7020032
Submission received: 21 January 2020 / Revised: 1 May 2020 / Accepted: 12 May 2020 / Published: 15 May 2020

Abstract

:
The paper describes a Raman-laser system with high performance for an absolute gravimeter that was based on 87Rb atom interferometer. As our gravimeter is a part of the standard acceleration of gravity of China, the Raman lasers’ characteristics should be considered. This laser system includes two diode lasers. The master laser is frequency locked through the frequency-modulation (FM) spectroscopy technology. Its maximum frequency drift is better than 50 kHz in 11 h, which is measured by home-made optical frequency comb. The slave laser is phase locked to the master laser with a frequency difference of 6.8346 GHz while using an optical phase lock loop (OPLL). The phase noise is lower than −105 dBc/Hz at the Fourier frequency from 200 Hz to 42 kHz. It is limited by the measurement sensitivity of the signal source analyzer in low Fourier frequency. Furthermore, the power fluctuation of Raman lasers’ pulses is also suppressed by a fast power servo system. While using this servo system, Raman lasers’ pulses could be fast re-locked while its fast turning on again in the pulse sequence. The peak value fluctuation of the laser power pulses is decreased from 25% to 0.7%, which is improved over 35 times. This Raman-laser system can stably operate over 500 h, which is suited for long-term highly precise and accurate gravity measurements.

1. Introduction

As a novel inertial sensor, atom interferometry (AI) technique has developed into an ultra-precise measurement tool for fundamental constants [1,2,3,4] and rotations [5,6,7]. After the first demonstration of the pulsed atom gravimeter by Chu [8], it became a new method for the measurement of earth’s gravity field with high performance in both stability and accuracy [9,10,11,12,13]. In an AI gravimeter, a cold atom cloud realizes atom interference by interacting with a pair of Raman lasers to coherently split and later recombined while it is free falling down. Accordingly, it is directly impacted by the gravity measurement result by laser system’s characteristics, such as noise-level, stability, reliability, accuracy, and long-term continuous operation. Since our AI gravimeter is a part of the standard acceleration of gravity of China, its laser system’s performance must be firstly considered. In this paper, we describe a Raman-laser system based on 87Rb AI gravimeter and introduces its performance in phase noise, frequency and power stability, and long-term operation.

2. Principle of Atom Gravimeter

As said above, the principle of an atom gravimeter causes that the gravity measurement is directly impacted by laser system’s characteristics, such as its noise-level, stability, reliability, accuracy, and long-term continuous operation. More details are introduced below.
The working principle of an AI gravimeter has been reported in detail by Achim Peters [8]. To perform absolute gravity measurement, a couple of lasers with a frequency difference matching the atom ground-state hyperfine level splitting is used to realize the two-photon Raman transitions [14]. The free falling cold atom cloud interacts with Raman lasers with a pulse sequence of Pi/2, Pi, Pi/2 to realize interference. The relative phase of the Raman lasers provides the reference against which all interferometer phase shifts are measured [8]. The frequency difference of the Raman lasers should be scanned linearly neglecting the gravity gradient in order to compensate the Doppler shift induced by the motion of atoms. Accordingly, the final interference phase (atomic state) includes the information of local gravity and the relative phase of Raman lasers, which can be expressed as:
ϕ = ϕ g r a v i t y + ϕ R a m a n = k e f f g T 2 α T 2
where g is the local gravitational acceleration due to the Earth, α is the chirp rate of the Raman lasers frequency difference, k e f f , the effective wave vector, is defined as k 1 k 2 , k 1 , and k 2 are the wave vectors for two Raman lasers, and T is the free evolution time. That means that the characteristics of Raman lasers are critical to the interferometer phase noise.

3. Function of Raman-Laser System

3.1. Phase Noise

The gravity noise expression g = Φ n o i s e / k e f f T 2 according to Equation (1), shows that the phase noise introduced by Raman lasers will translate directly into the noise of gravity measurement. Φ n o i s e , the phase noise of the interferometer can be expressed as   Φ n o i s e 2 = 0 | H ( 2 π f ) | 2 S Φ ( f ) d f , where S Φ ( f ) is the relative phase noise power spectral density (PSD) of the Raman lasers. The weighting function of Raman lasers H ( ω ) is [15],
| H ( ω ) | 2 = 16 ( 1 ( ω / Ω ) 2 ) 2 sin 2 ( ω T 2 ) sin ( ω ( T 2 τ ) 2 ) + ω Ω cos ω T 2 ) 2
where   τ is duration of Raman pulses and T is the time interval between them, named as free evolution time. Ω = π 2 τ is the Rabi oscillation frequency of the Raman transition [16]. Hence, | H ( ω ) | 2 indicates a band-pass behavior whose effective lower cutoff frequency scales with 1 / T , whereas the upper cutoff frequency scales with 1 / τ [17]. In our system with τ = 24 µs and T = 80 ms, the sensitivity of the gravimeter will be limited by Raman lasers’ relative phase noise in the Fourier frequency range from 12.5 Hz to 42 kHz. Thus, the Raman lasers’ relative phase noise in this frequency range need to be considered.
As introduced in Expression 1, α is the chirp rate of the difference frequency between the pair of Raman lasers while they are phase stabilized. This is for compensating the Doppler shifts, which is induced by atoms free falling, then the gravity acceleration can be obtained by the expression g = k e f f / α . In Beijing, China, α is estimated about 25 MHz/s. Furthermore, for eliminating systematic shifts independent on the direction of k e f f , (such as magnetic field gradient and one-photon light shift [18]), we lock the chirping rate of the Raman lasers to the cross point of two fringes with different directions of effective wave-vectors k e f f and k e f f [18]. That means that the frequency difference between Raman lasers should be swept from 6.829 GHz to 6.840 GHz back and forth to meet the different resonance conditions for ± k e f f . Accordingly, in the whole process of interference, the frequency difference between two Raman lasers needs to be swept about 11 MHz with very low phase noise.
In addition, the expression   g = Φ n o i s e / k e f f T 2 presents that the same amount of phase noise corresponds to a smaller amount of acceleration noise at longer interferometer pulse spacings T . The free evolution times T in our gravimeter system is 80 ms due to the free falling configuration, which is much shorter than the fountain ones’. That means that the relative phase noise of our Raman lasers must be at a very low level, since our gravimeter is more sensitive to the noise.
Raman laser sources can be implemented by different methods such as optical phase locking (OPLL) [19], acousto-optic modulators (AOM) [20], and electro-optic modulators (EOM) [21]. Different from OPLL technologies, the EOM and AOM methods can realize Raman-laser from a single laser source, which make the laser system more compact and robust. Since the sidebands and the carrier are never spatially separated, the EOM phase modulation method has a high immunity to mechanical vibration and temperature fluctuation. However, the drawback of this method is that it would present redundant sidebands due to EOM’s double sideband (DSB) modulation spectrum. These additional laser frequencies that are mixed in the Raman laser beam perturb the atom interferometer [22]. In addition, the power stability of two Raman lasers affects AC-Stark shift in atom interferometry, and the stability of the modulator’s sideband to carrier ratio (SCR) must be considered [23].
When compared with phase modulation methods, the OPLL technology makes the Raman lasers have better spectrum characteristics and easier controllability for their intensity ratio. 
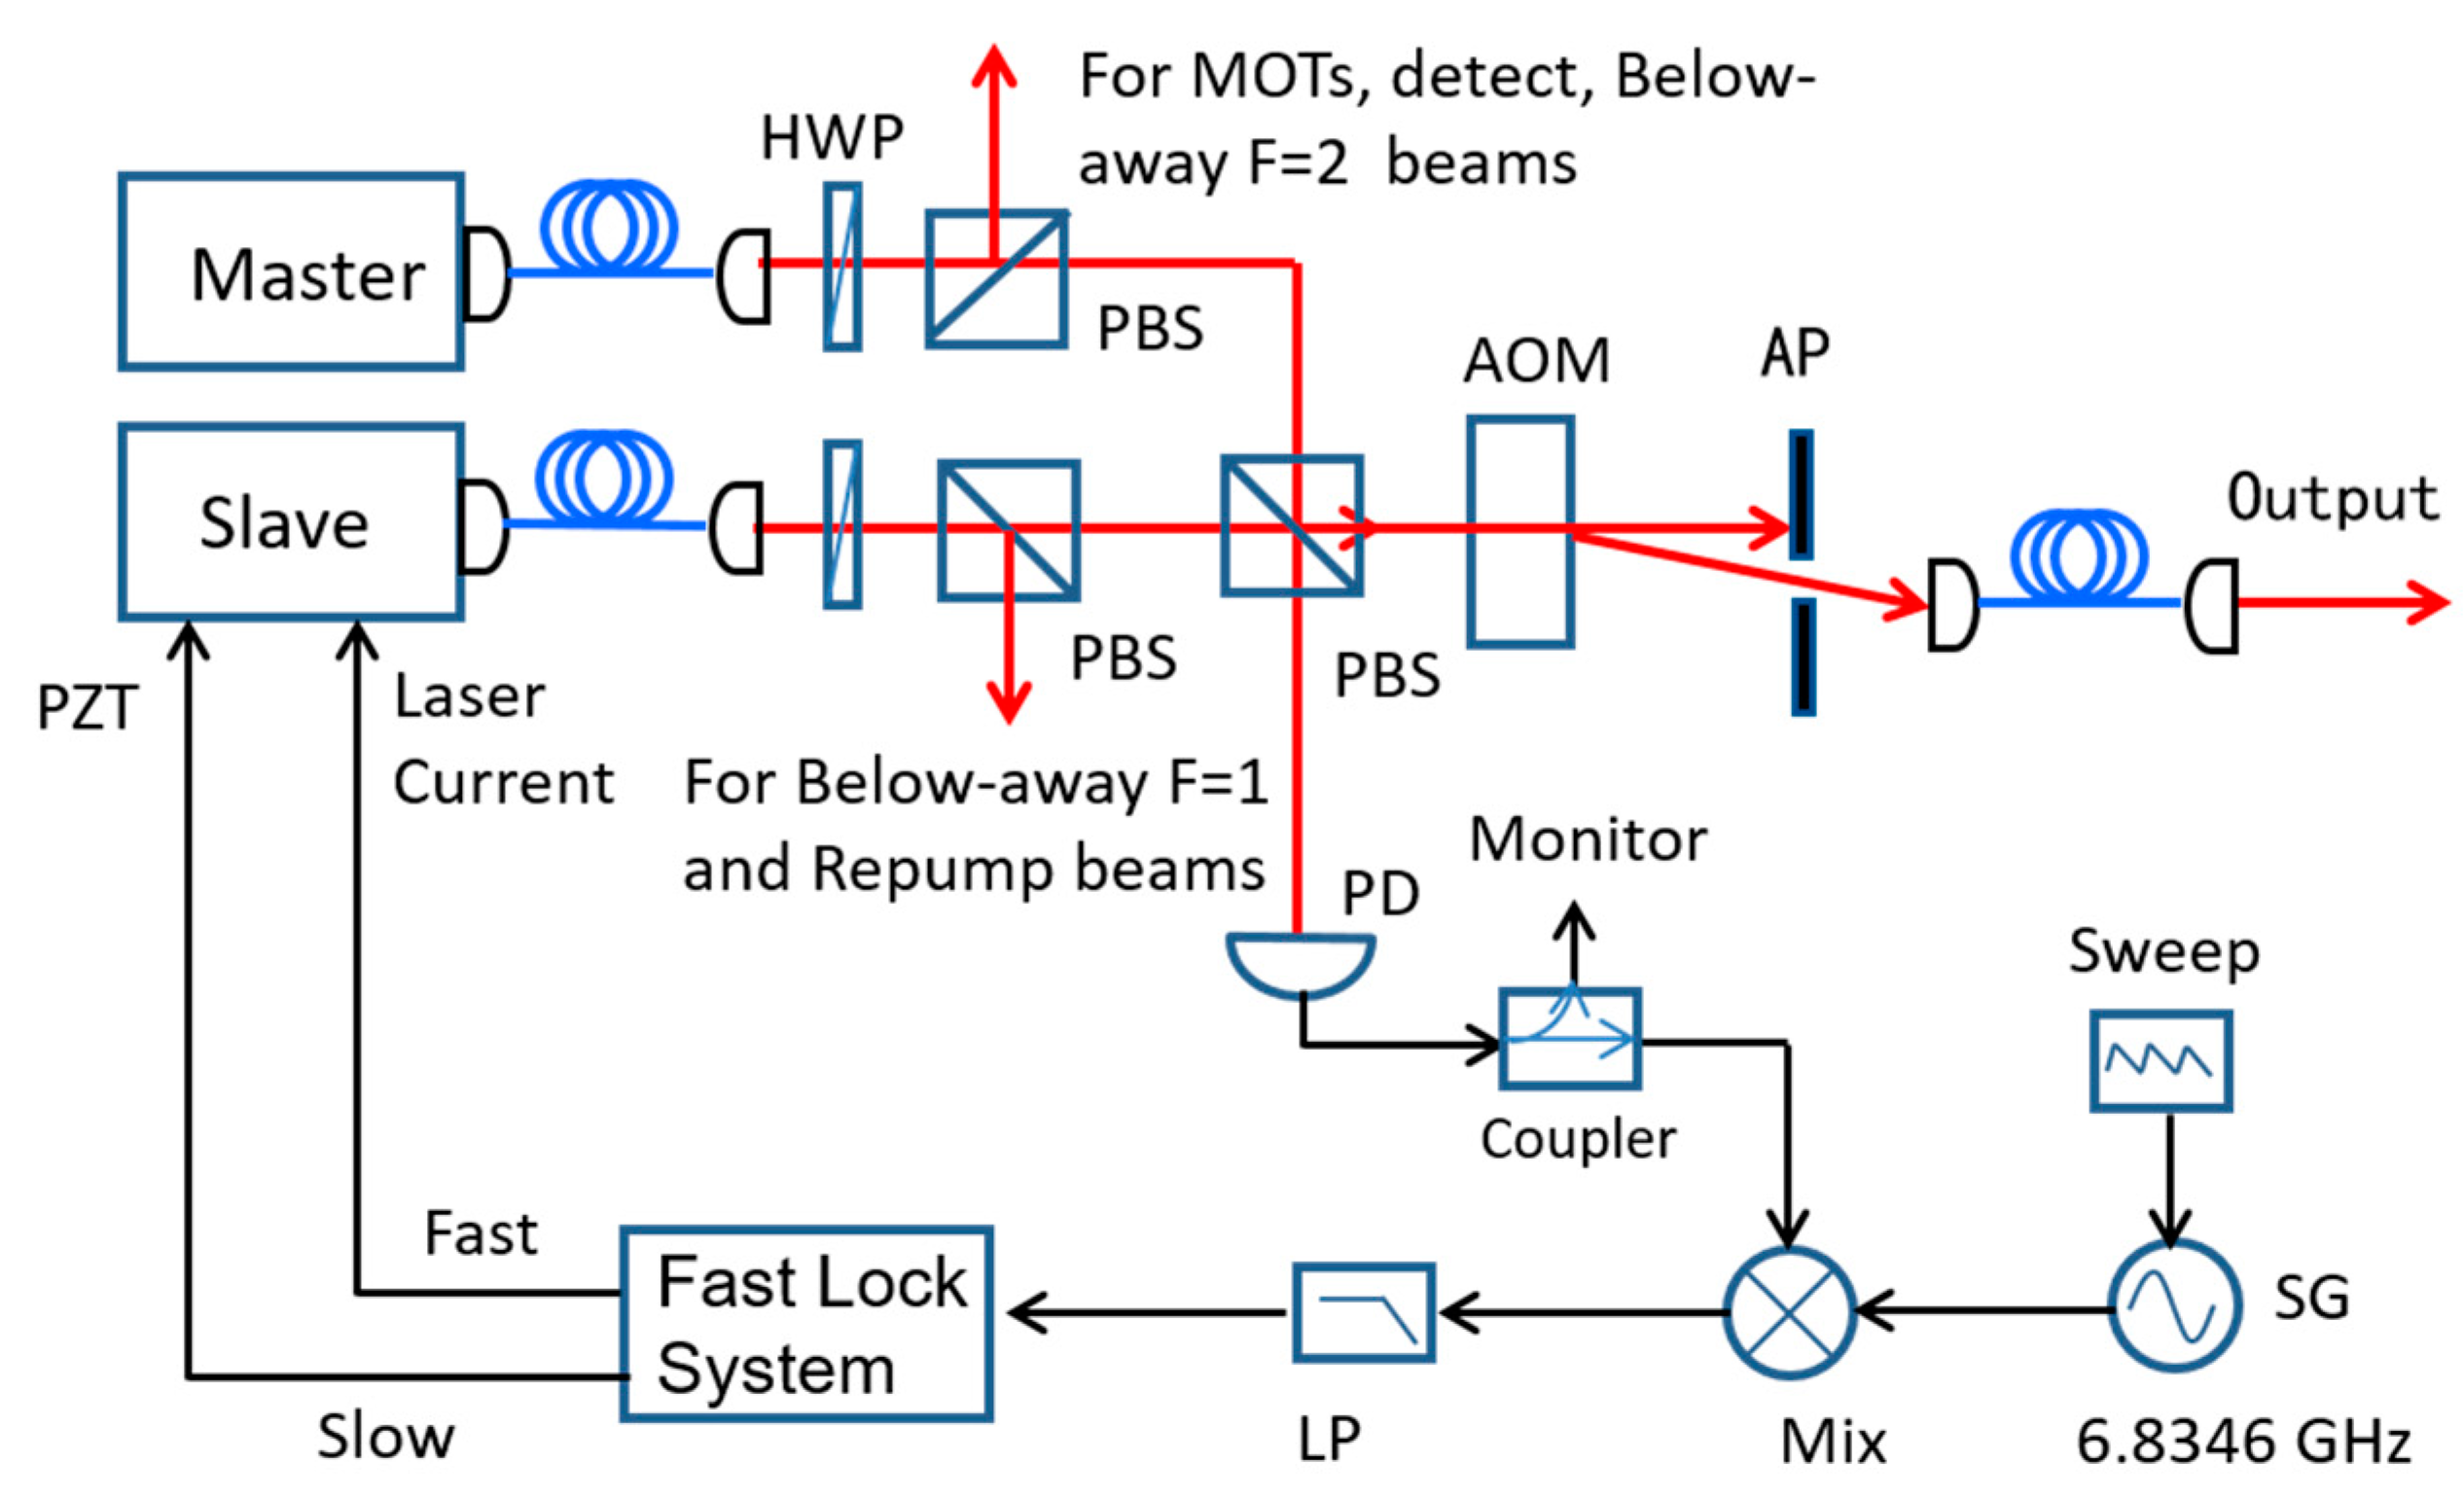
Figure 1 illustrates the scheme of the OPLL system. Two tapered amplifier lasers (TA Pro 780, Toptica Photonics AG, Graefelfing (Munich), Germany) with a wavelength of 780 nm as the master and slave laser, respectively, are overlapped using a polarizing beam-splitting cube. One fraction passes through an AOM for generating Raman pulses. The powers of each Raman beams can be independently adjusted by respective HWPs. Another collimated beam is sent to a fast photodiode (PD) to detect the beat note for the phase locking. A coupler divides the signal, and the coupled signal is sent to a spectrum analyzer (SA) or a signal source analyzer (SSA) for monitoring when the gravimeter is working. The output signal from the coupler is mixed with a reference signal with a frequency of 6.8346 GHz (Rb-1 signal generator, SpectraDynamics, Inc. (SDI), Louisville, CO, United States) to generate the error signal. This reference signal is swept from 6.829 GHz to 6.840 MHz with a chirping rate of 25.12 MHz, as mentioned above. After a low pass filter (LP), the error signal put into a fast servo system (FACL, Toptica Photonics AG, Graefelfing (Munich), Germany). It is divided into two different feedback paths: fast one and slow one. The fast circuit branch of the system generates a fast feedback signal, and then it feeds to laser’s diode current for suppressing the fast phase noise between two lasers. The slow circuit branch is an integrator loop. Its output is fed back to slave laser’s PZT for maintaining a long time locking and compensating laser frequency chirping in a large scale (11 MHz). The locking system maintains the phase stabilization between two lasers with a low noise level, while the beatnote frequency sweeping over 500 h.
Before coupling into the fiber, the combined beam passes through a AOM with a modulating frequency of 1.34 GHz to realize red detuned frequency approximately 0.95 GHz from F’ = 0→F = 2 (master laser) and F’ = 0→F = 1 (slave laser), respectively. It is beneficial to reduce the effect of spontaneous emission due to the off-resonant single-photon excitation. This AOM is also employed for Raman lasers quick shutoff and power stabilization during the interferometer pulse sequence (will be introduced below).
We detect the beat note of the Raman laser beam diffracted by the AOM (as shown in Figure 1) with an out-of-loop detector (not shown in Figure 1), as the out-of-loop results can more accurately present the laser’s characteristic. 
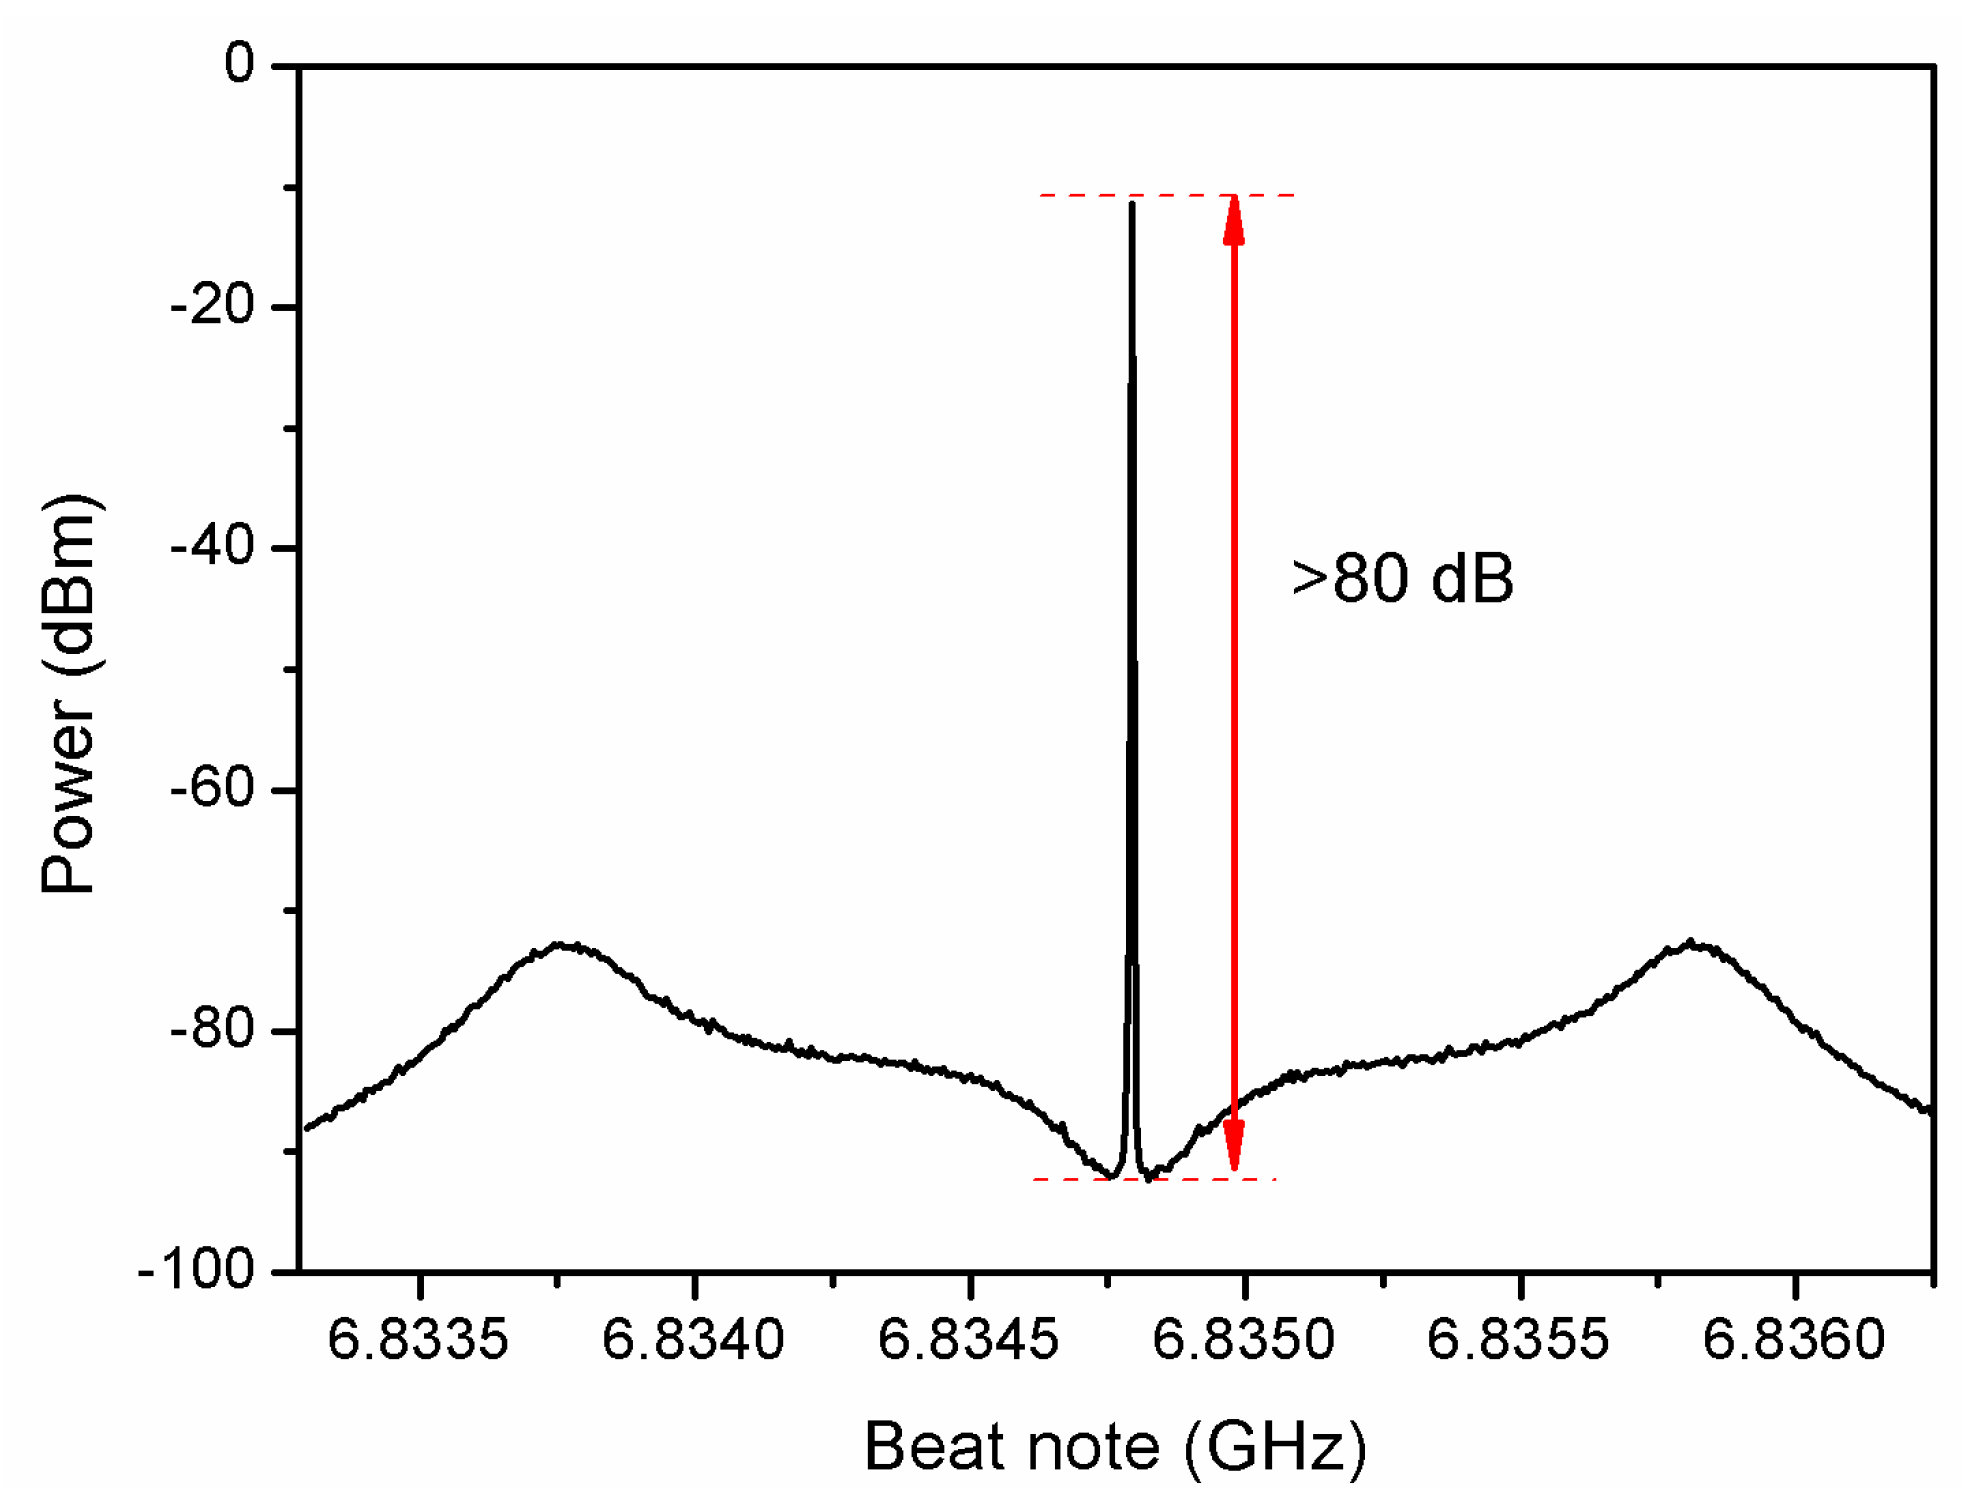
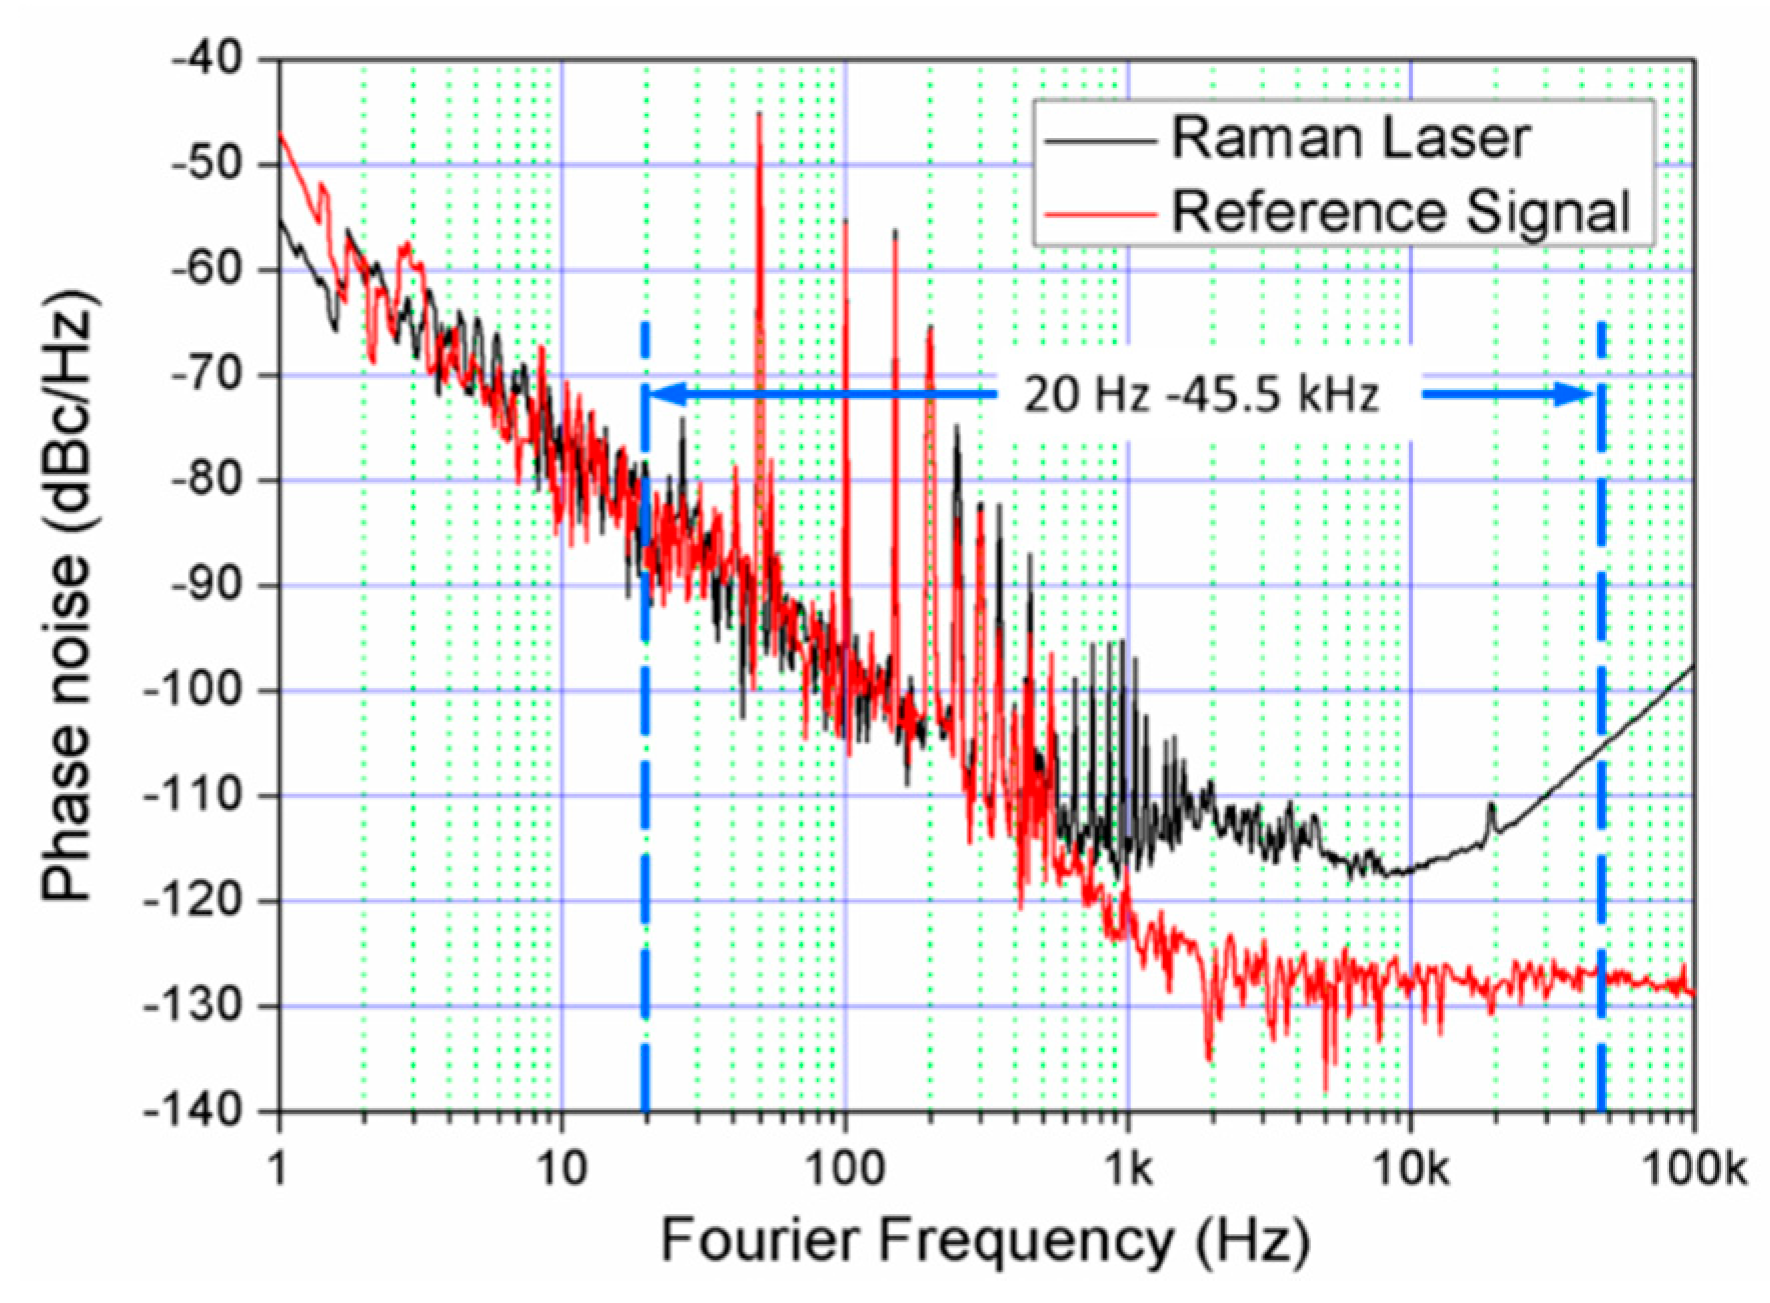
Figure 2 shows the Raman lasers’ beatnote by a spectrum analyzer with a resolution of 1 Hz. It proves that the relative noise has been reduced over 80 dB and the servo bandwidth of the locking system is about 900 kHz corresponding to the broad resonance. The phase noise power spectrum destiny (PSD) is also measured by a signal source analyzer (SSA, E5052B, Keysight Technologies, Santa Rosa, CA, United States), as shown in Figure 3, which is limited by SSA’s sensitivity in low Fourier frequency [24]. We consider the Fourier frequency range of 12.5 Hz to 42 kHz because of the bandpass filter behavior of transfer function. At Fourier frequency below 500 Hz, the relative phase noise is same as the reference signal, which means that the Raman lasers’ relative phase noise is limited by the reference resource with a noise characteristic of 1/f frequency noise. In the Fourier frequency range of 500 Hz to 42 kHz, the phase noise is lower than −105 dBc/Hz, even lower to −117 dBc/Hz at 10 kHz, corresponding to the noise contribution better than 3   μ Gal / Hz . During the interferometer pulse sequence, the Raman laser beam that is delivered to the vacuum chamber is no longer suitable for phase locking monitor as it is in pulse mode. Therefore, we have to detect the coupled signal output from the coupler (Figure 1) for locking monitor when the gravimeter is working.
The phase slip is inevitable in a phase lock system, and it will cause the gravity measurement spoiled if it happens during a Raman pulse. Fortunately, it is easy to be distinguished and deleted as a gross error in the measurement data. The phase slip of our Raman-laser phase lock loop will not affect the gravity measurement result.

3.2. Frequency Stability

The gravity can be calculated as g = α 0 / k e f f , ( α 0 is the chirp rate of the Raman lasers frequency difference at which the interference phase equals zero), in which the absolute frequency of Raman lasers ( k e f f = k 1 k 2 ) contribute, according to Expression (1). Accordingly, the exact value of the Raman lasers frequency and their stability have direct impact on the measured gravitational acceleration’s accuracy and uncertainty. The maximum frequency variation of Raman lasers must be smaller than 380 kHz for 87Rb atom interferometer in order to realize the measurement result in order of µGal.
The master laser determines the stability of the Raman-laser system. Through the technique of frequency modulation (FM) saturation absorption spectroscopy, the master laser frequency is referenced to the crossover resonance of F’ = 2 and F’ = 3. 
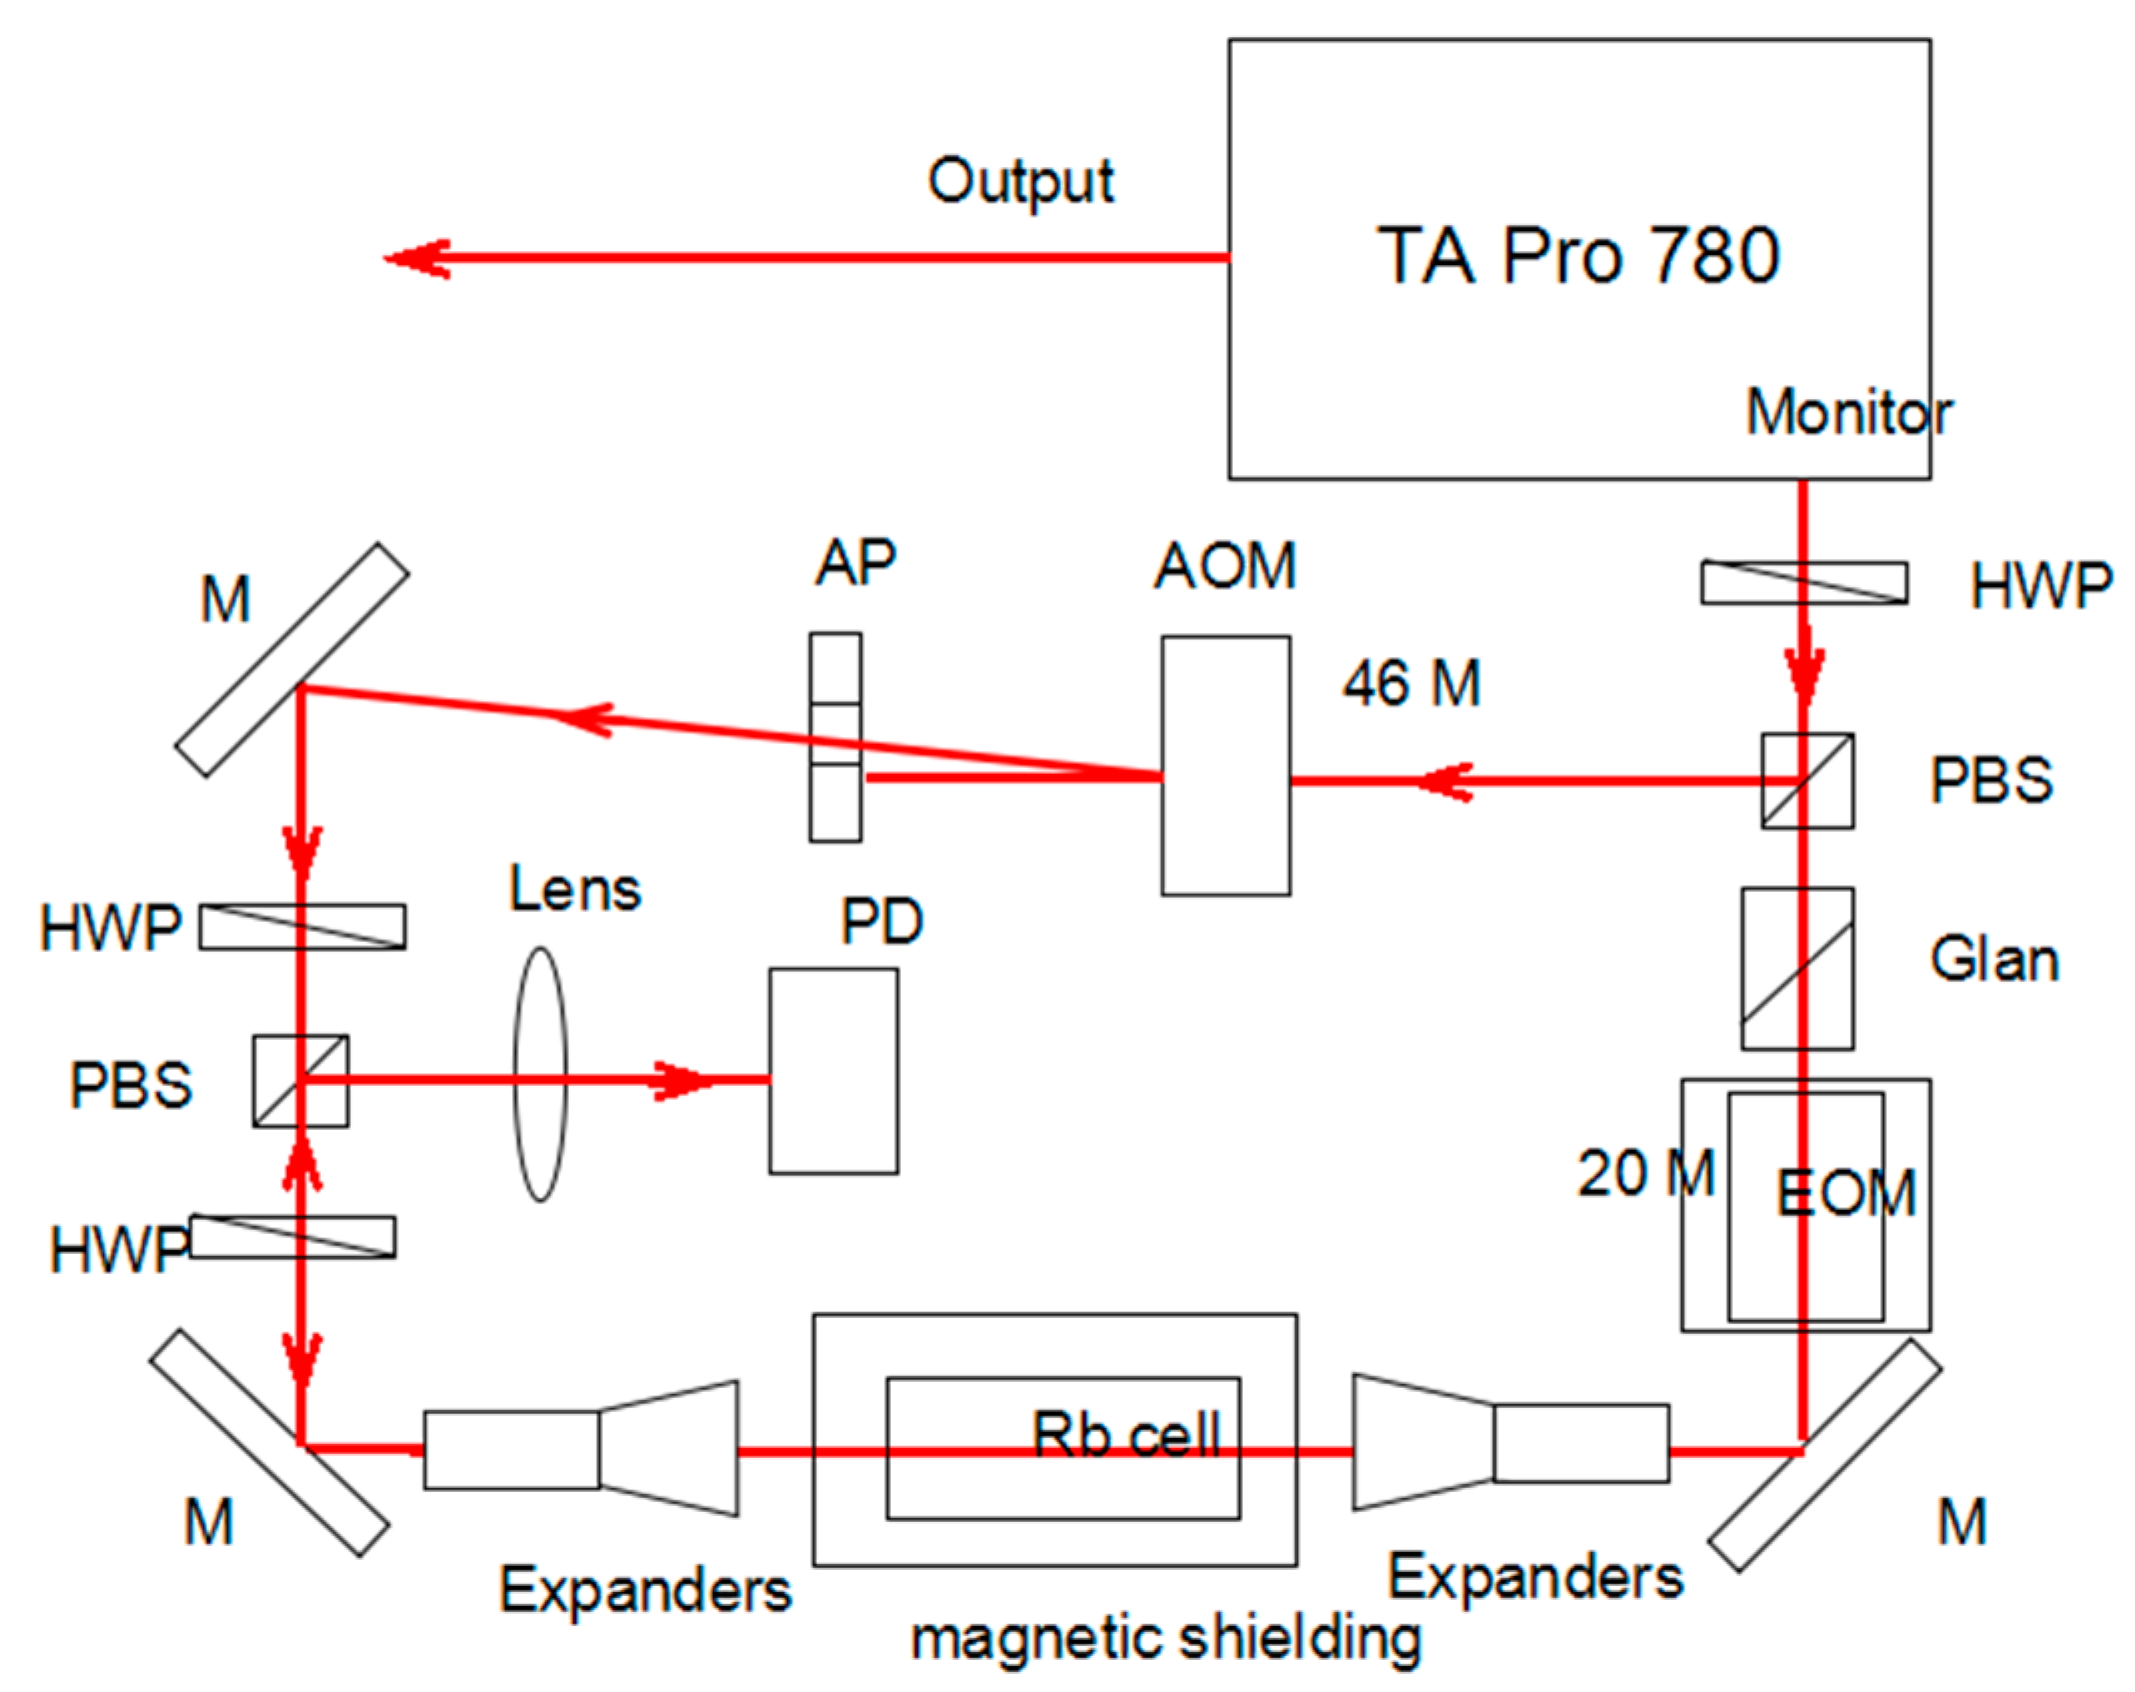
Figure 4 shows the scheme of a laser frequency stabilization system. The light from monitor port is used for laser frequency locking. It is divided into two parts with adjustable power ration by a half wave-plate (HWP) and polarizing beam-splitting (PBS) cube. The reflection portion, serving as the pump beam, is frequency shifted by a 46 MHz AOM in order to avoid the interference effect. The transmitted portion of the PBS is used as the probe beam, whose frequency is modulated by a 20 MHz electro-optic modulator (EOM). The pump and probe beams are expanded and overlapped in opposite directions in the Rb cell. The photo diode (PD) is employed to generate the error signal for stabilization. Therefore, a laser’s frequency is stabilized to the crossover of F’ = 2 and F’ = 3 with a detuning of 23 MHz by a servo system for feeding back to the PZT. For minimizing the fluctuation of residual amplitude modulation (RAM) introduced by the EOM, a Glan prism is inserted in order to align the polarization of the probe beam to the axis. In addition, the temperature of EOM is also controlled for preventing RAM fluctuating during the circumstance of temperature changing.
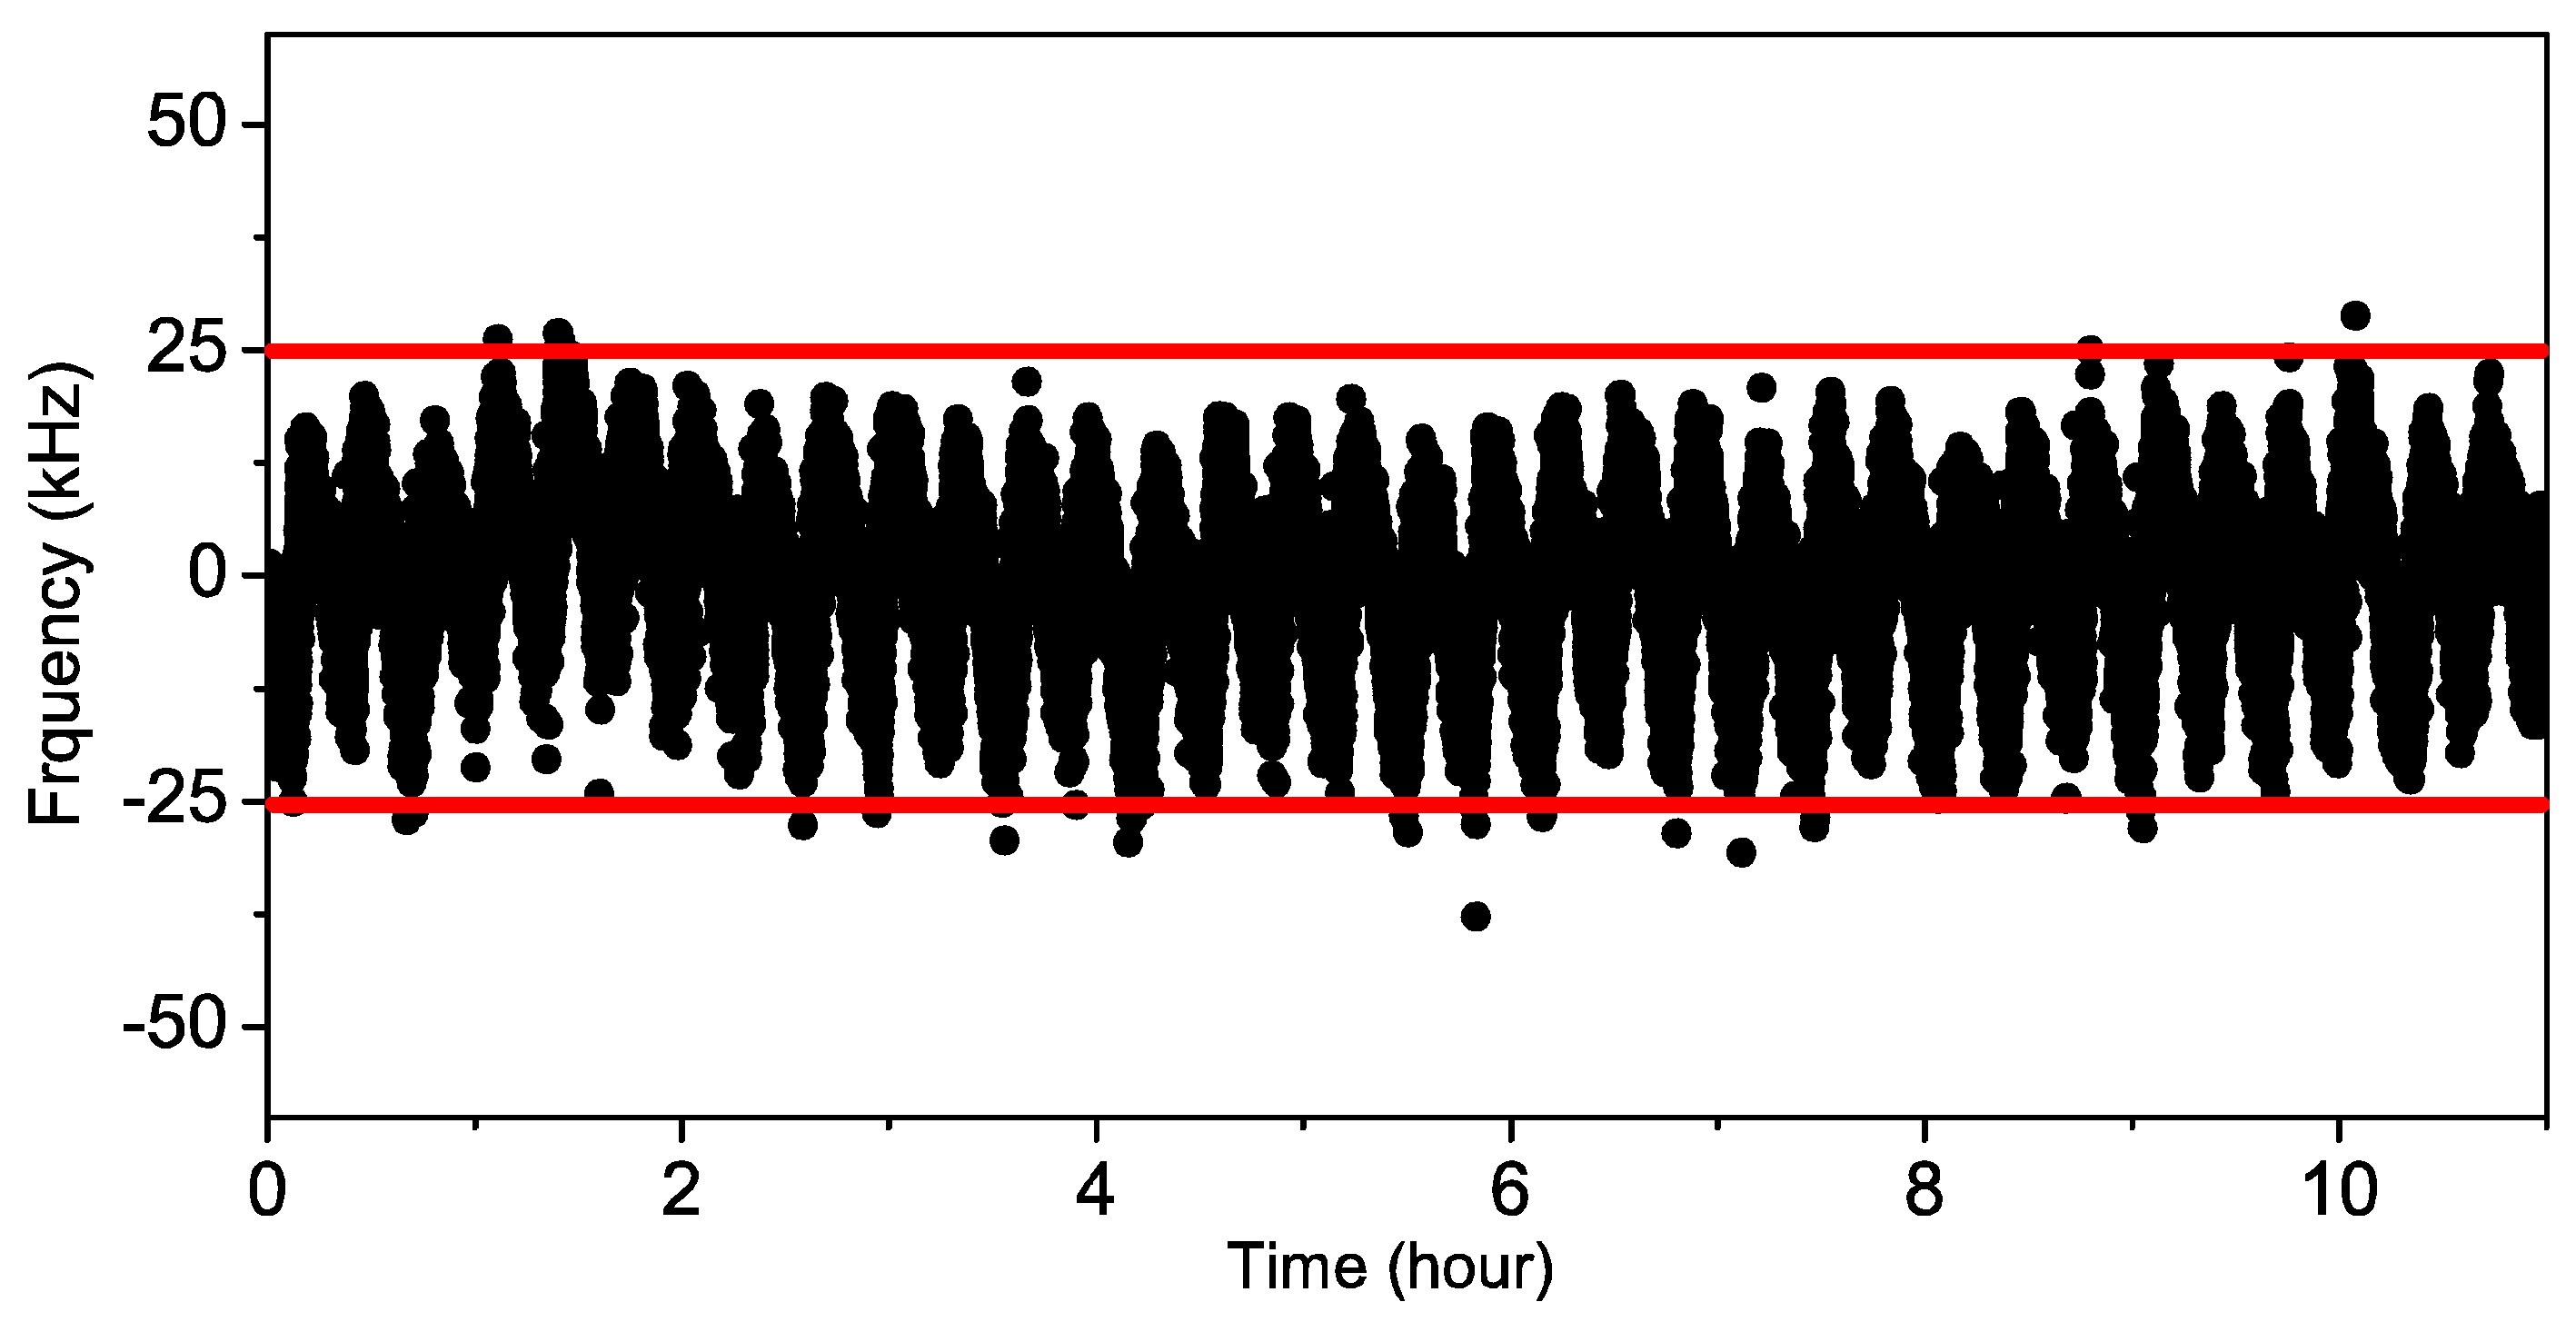
The Raman laser’s frequency is measured by a home-made optical frequency comb referred to as the GPS signal. The discrepancy between the measured actual laser frequency (384. 228 005 044 THz) and the nominal value of the transition frequency (red detuning 23 MHz from the F = 2 to F’ = 2/3 crossover) is 330 kHz with a peak-to-peak fluctuation of 50 kHz in 11 h (in Figure 5). The frequency drift with a period of 15 min because of the temperature fluctuation is the same as the air condition’s operation time. Therefore, the gravity offset is owing to the Raman laser frequency being 1 µGal with an uncertainty of 0.15 µGal.

3.3. Power Stability

The power stabilization of the pair of Raman lasers is also vital for gravity measurement. The fluctuation of Raman lasers’ power directly changes in the Rabi frequency affect the interferometer signal, which leads to interference phase noise [
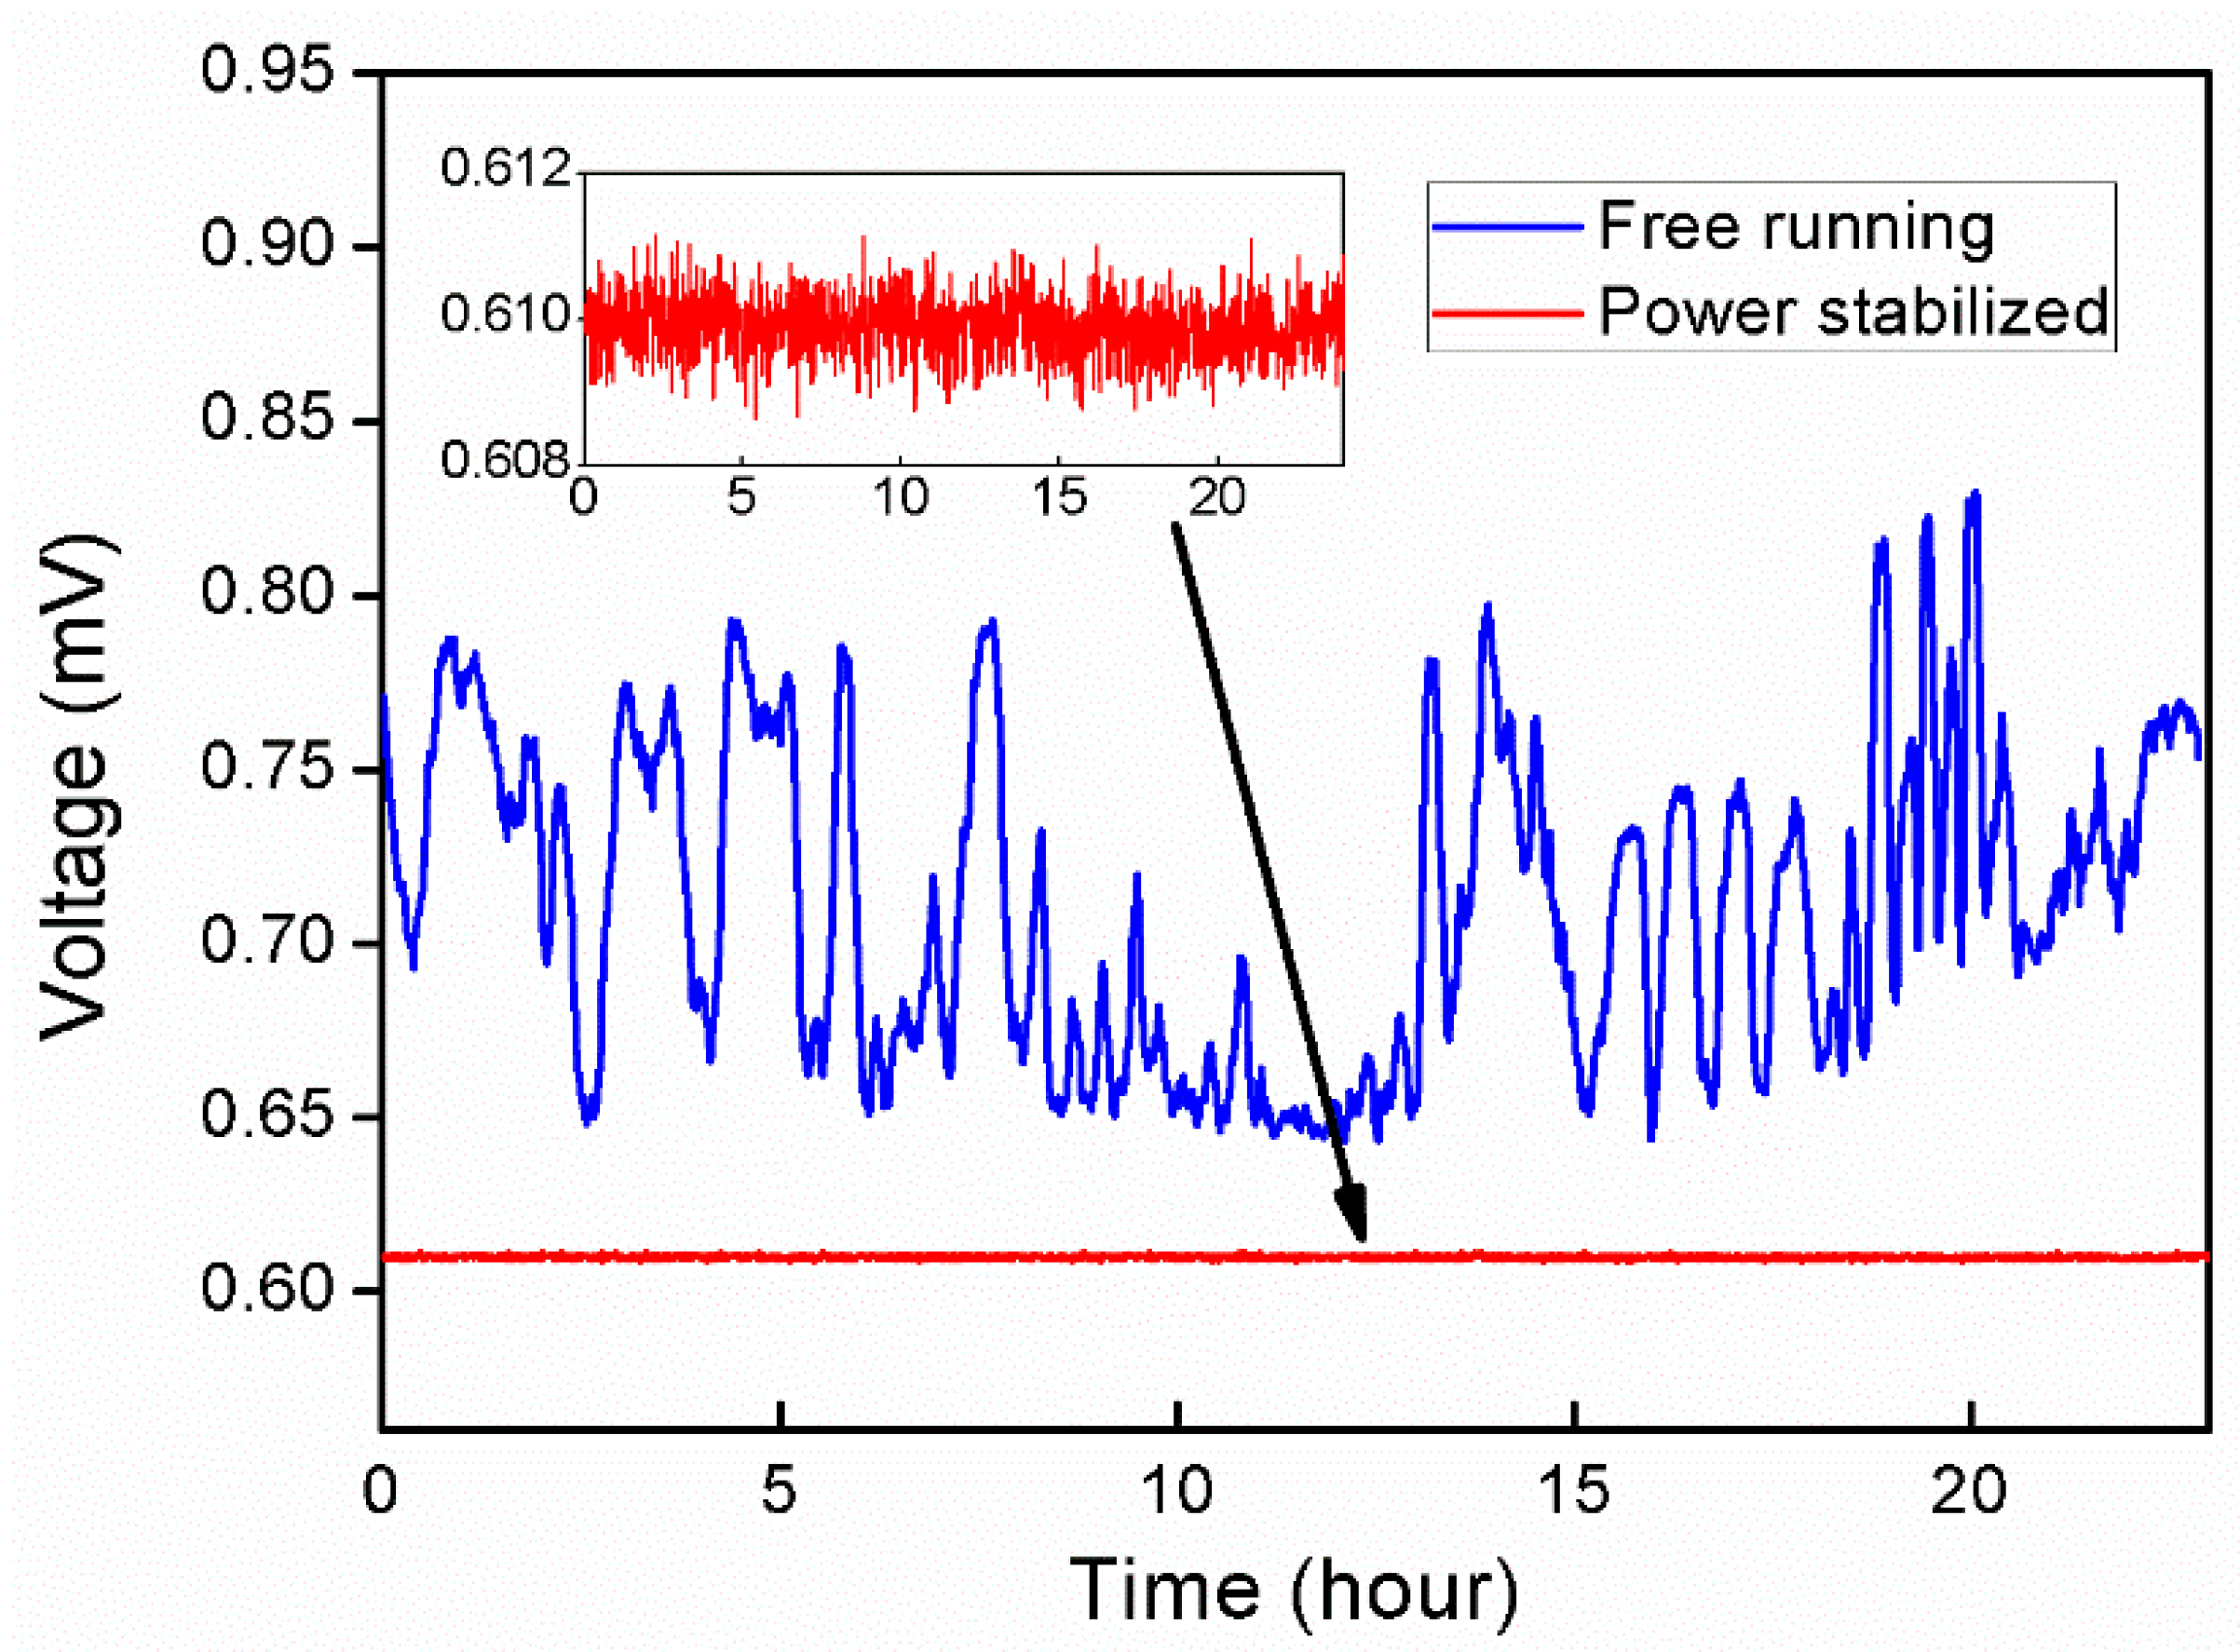
8]. In our laser system, before these two Raman lasers combined, they pass through two different optical fibers for spatial filtering, respectively, for optimizing the quality of the beams from TAs. The combined beams are coupled into another fiber for beam combining and spatial filtering again before passed through a free space AOM with a high frequency shift of 1.34 GHz (as mentioned above), which increases the AOM’s diffraction efficiency. However, the drawback is that the fibers are easy to be disturbed by the acoustic noise and thermal fluctuation, such as the air flow, the air conditioning, etc. It is not easy to fix well in order to reduce the influence of the environment noise for the fiber guided the Raman laser beam towards the atoms. We monitor the Raman lasers pulses in long-term in order to evaluate the power stability. The power stabilization is 25% in free running, as shown in Figure 6. Accordingly, we introduce a fast power stable system to control the Raman laser power as the very short pulse width of Raman lasers (τ = 24 µs).
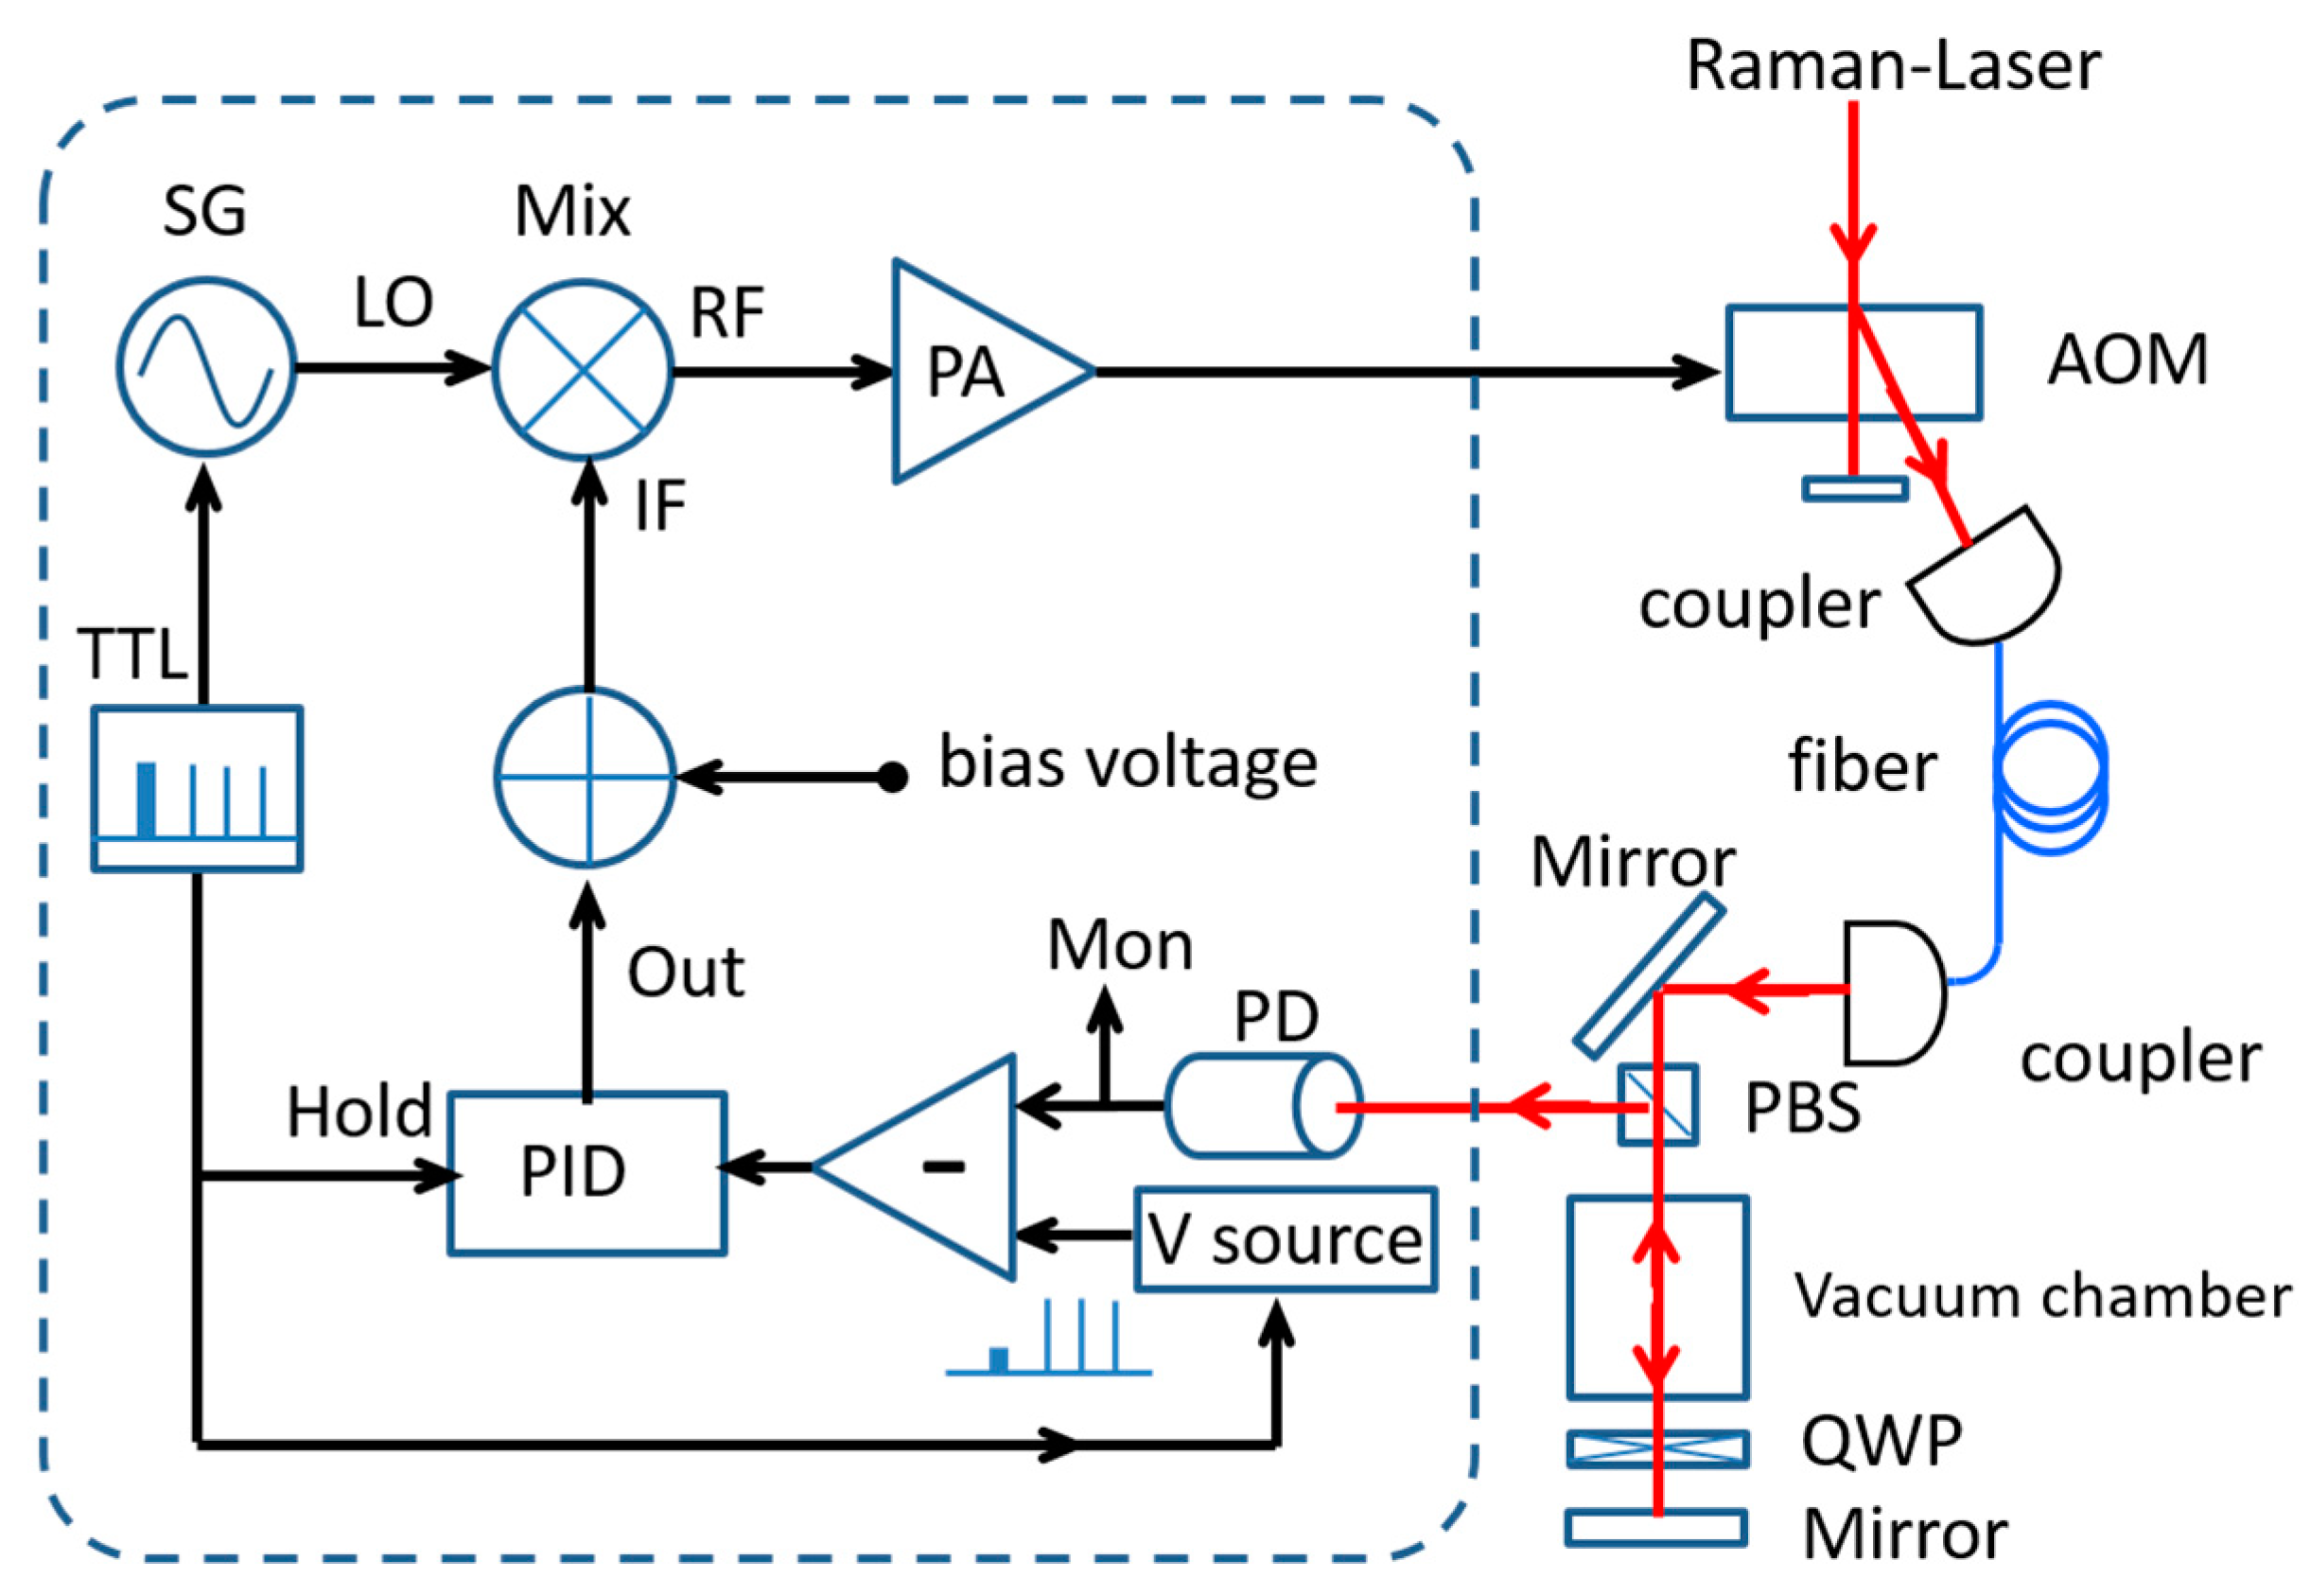
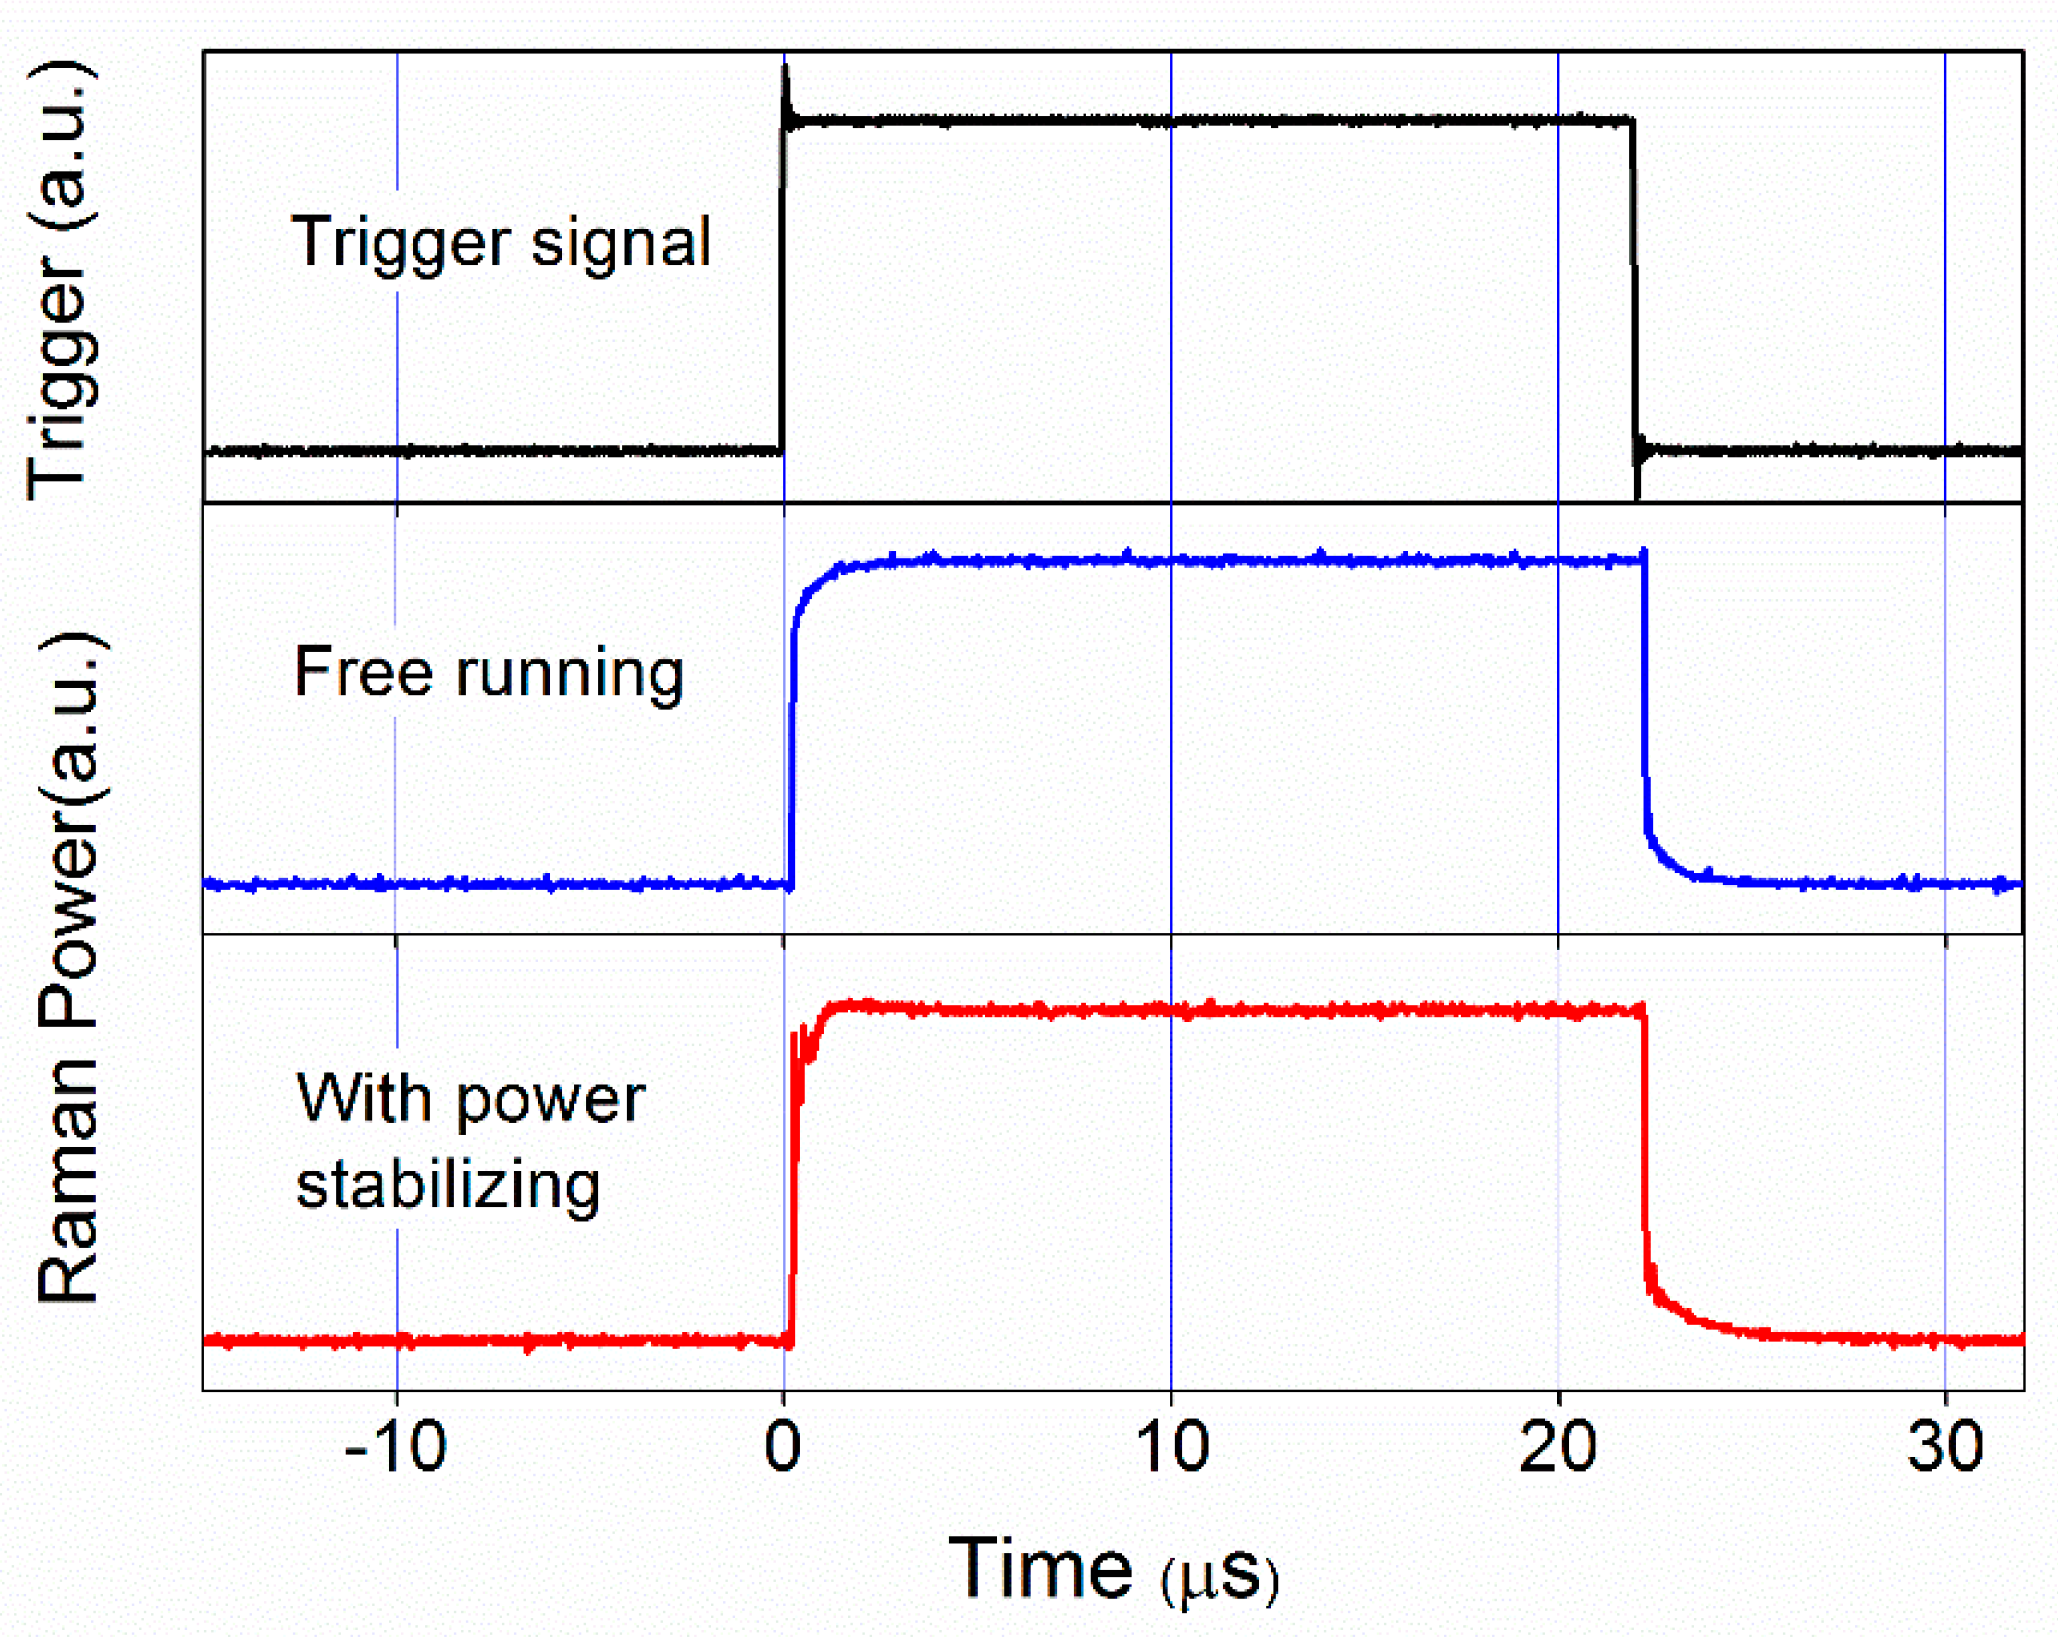
Figure 7 shows the scheme of the power stabilization system. Raman lasers beam is diffracted by the AOM, and then it is delivered to the vacuum chamber with an optical fiber. It is retro-reflected upward and is combined with downward beam for atom interference. We directly detect the power of retro-reflected beams through the vacuum chamber, which exactly obtain the power stability of Raman-laser beam interacted with the atoms. The signal is divided into two parts, one is for monitor and the other one is compared with a reference voltage. A PID system generates feedback voltage signal put into a mixer’s IF port to control the RF signal’s output power from the mixer. After amplified by a power amplifier (PA), it drives the AOM for Raman lasers’ power stabilization. A TTL signal triggers the signal generator (SG) of 1.34 GHz and it toggles the servo system’s hold/lock situation to realize fast re-lock, while the Raman lasers fast turning on and off in the pulse sequence. It effectively prevents the control system into an unrecoverable state, since the error exceeds a specified limit when the Raman lasers shutoff. The trigger signal toggles the reference voltage at the same time. It is easy to precisely control the power of Raman pulses in different requirements. 
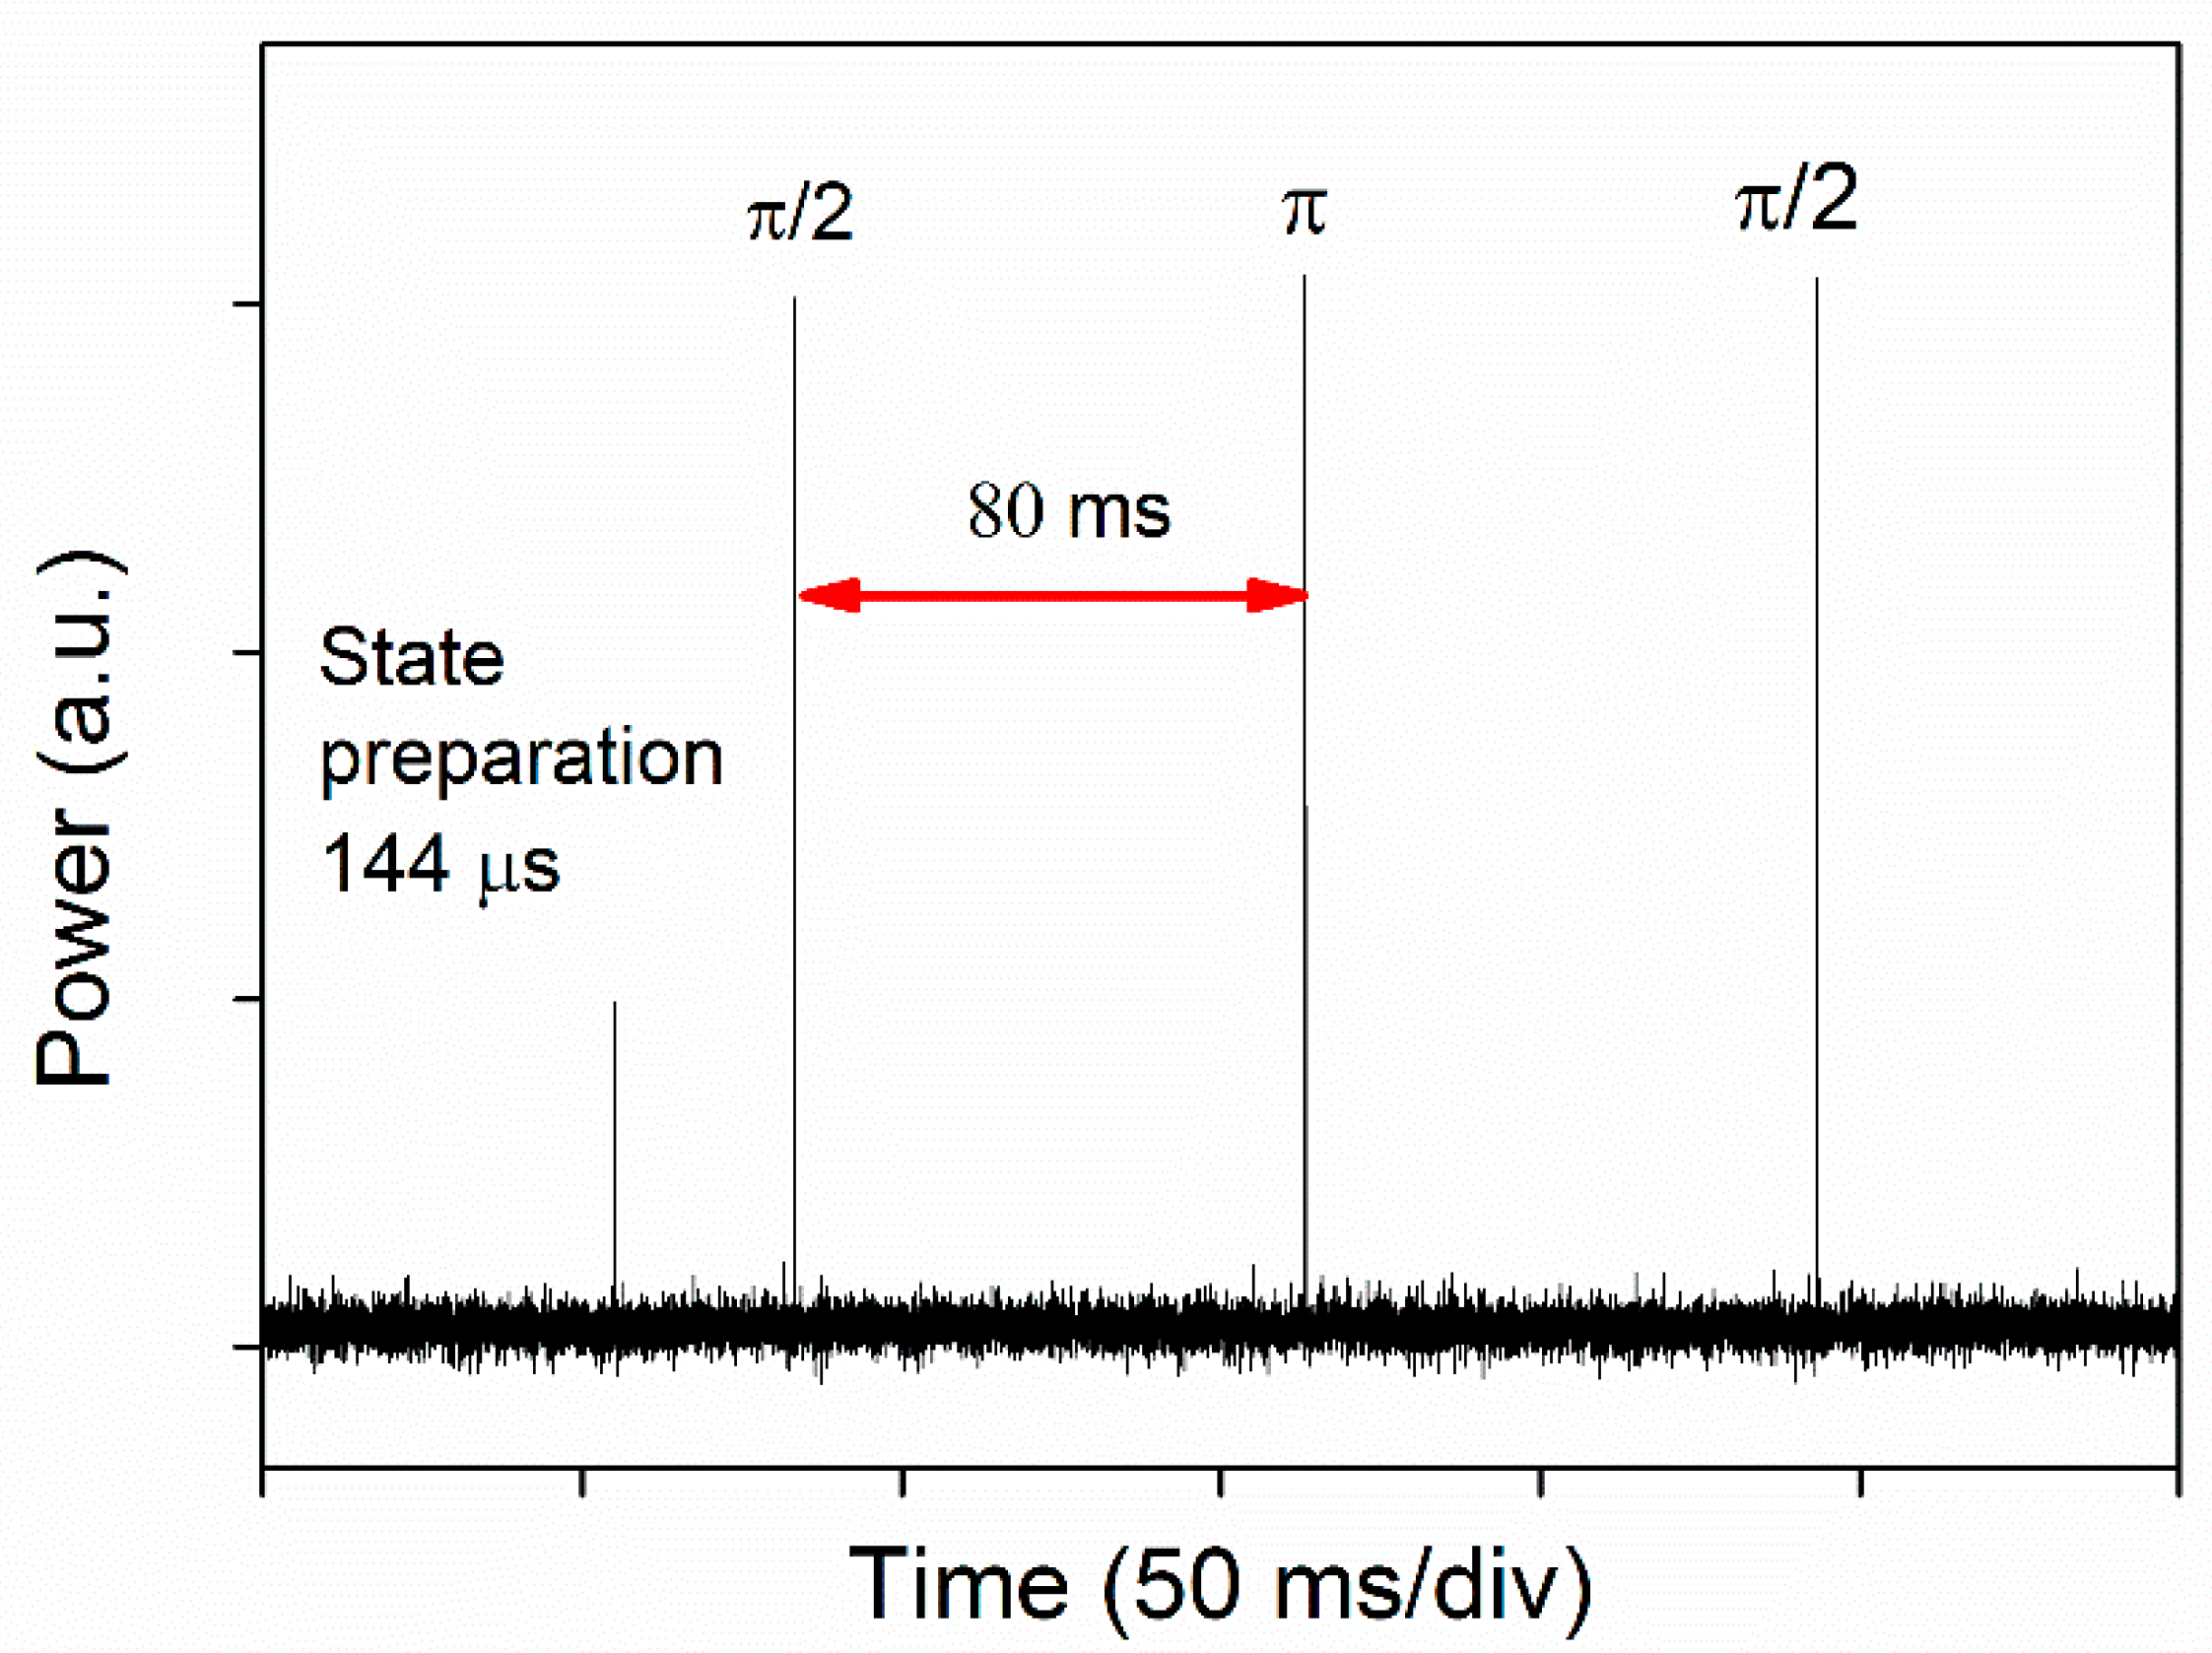
Figure 8 shows the Raman laser pulse power when the sequence turns on. It is convenient to evaluate the two-photon light by setting different power levels [25].
It must consider the time delay introduced by the power stabilization system in a pulse laser system. Figure 9 displays the on-off time comparison of trigger signal and Raman lasers pulse in free running and with power stabilization. The power monitor is recorded the pulse power in a certain time of one period. The laser opening time and shutoff time are delay 250 ns when compared to the trigger signal, respectively. The delay time is the same as the condition without the power controlling. Therefore, the power stabilization system does not introduce any extra time delay. The long-term in loop power stabilization of Raman lasers pulses is improved from 25% to 0.5%, as shown in Figure 10.
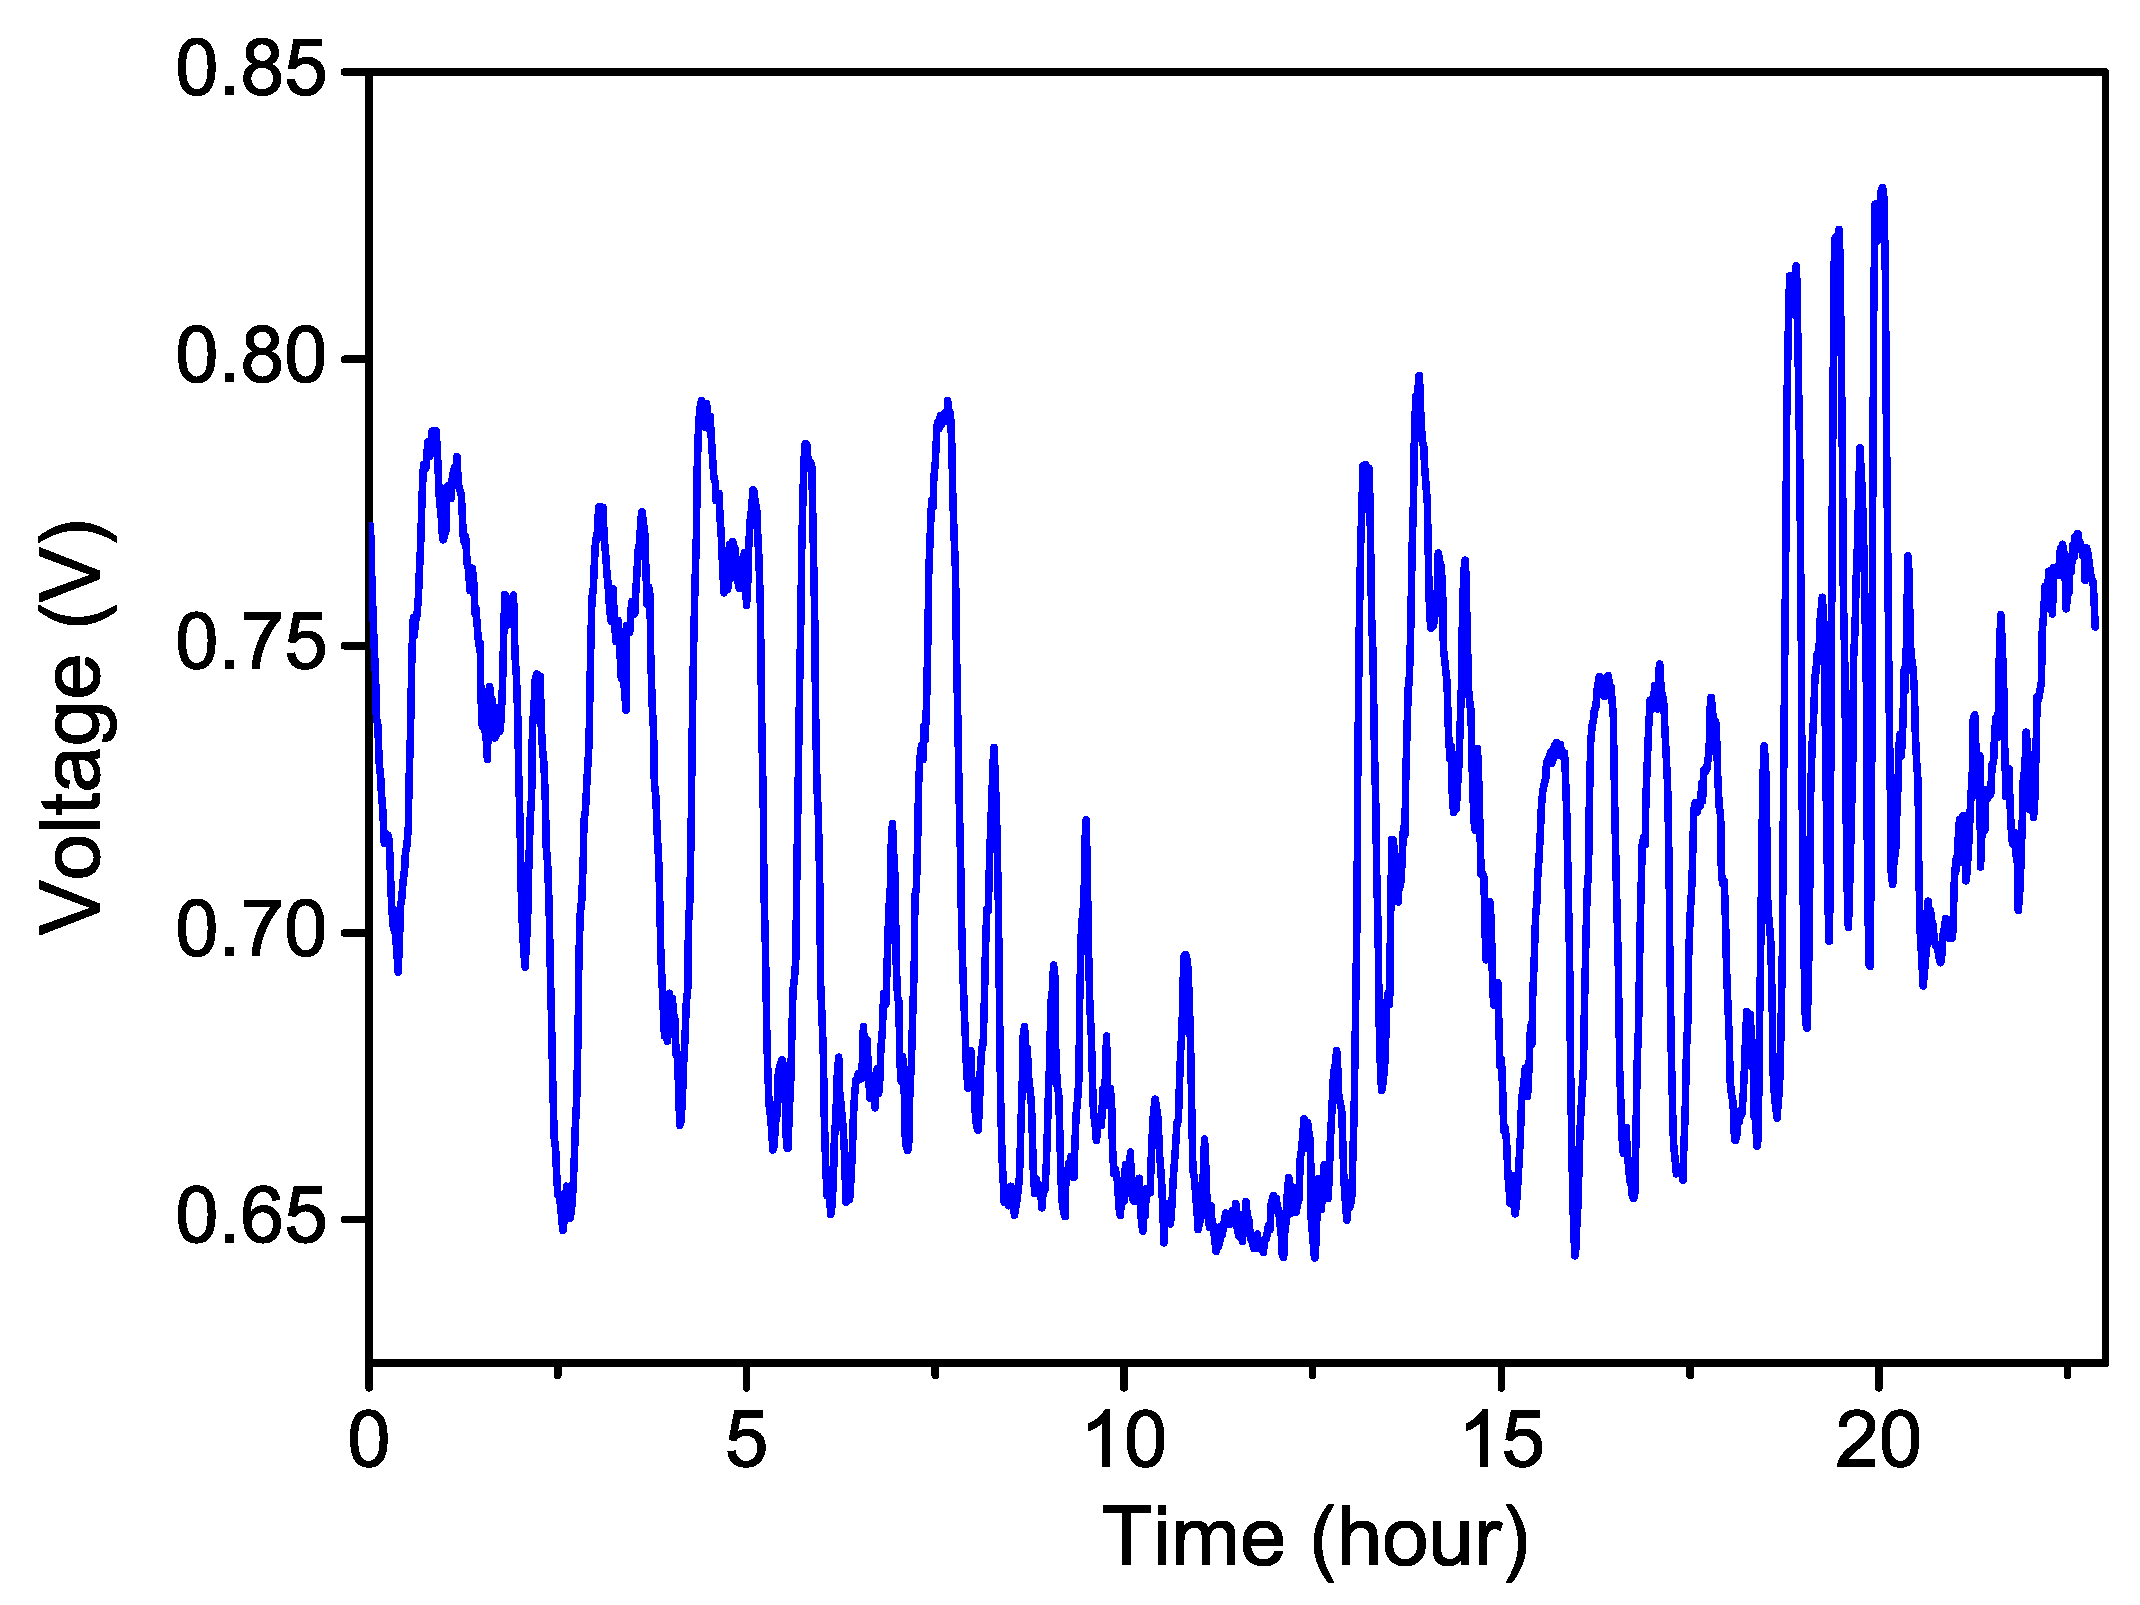
The air flow and the temperature fluctuation will affect the sensitivity of the detector for power stabilization, which will induce the power variation and could not be monitored by the in-loop signal. Therefore, we cover the detector (on the top of the gravimeter) by a plexiglass shield to reduce the environment influence and measure the power stabilization by another out-off-loop detector, as shown in Figure 11. It presents the same period in Figure 5, which is induced by the air condition. The power stabilization out-off-loop is not seriously spoiled and it maintains about 0.7%.

3.4. Continuous Gravity Measurement

When compared to the optical gravimeter, long-term continuous absolute gravity measurement is another advantage of the AI gravimeter because of its no-loss. It is non-irreplaceable in the standard acceleration of gravity for the gravity observation and the superconducting gravimeter calibration. Accordingly, the reliability and stability of the gravimeter system’s, especially for the laser system’s is also a key characteristic to evaluate our system. Figure 12 gives a continuous measurement of more than 500 h [12]. Each data is the result of 180 drops (three minute) average. It shows the experimental data (red points) and the theoretical prediction produced by Tsoft [26], including the ocean loading effect (black solid line), and the difference between the theoretical data and the experimental data.
We conducted our AI gravimeter NIM-AGRb-1 and a commercial FG5X-249 simultaneously [12], and present the Allan deviation in Figure 13. The black squares are the Allan deviation of ours and red dots is the FG5X’s. The NIM-AGRb-1 has a sensitivity of 44   μ Gal / Hz , as shown of the curve fitting (blue dash line). Thanks to its good long-term stabilization, the stability of the AI gravimeter reaches to 0.2 µGal when averaged to 30,000 s.

4. Conclusions

In this letter, we present the Raman-laser system for an absolute gravimeter that is based on 87Rb atom interferometer. The frequency of master laser is locked to 87Rb atom transition spectrum by FM spectroscopy technology. The maximum frequency drifting of the beat note between two independent lasers is lower than 50 kHz during a period of 11 h measured by an optical frequency comb. Raman lasers are realized by OPLL with a sweeping frequency range of 11 MHz and chirp rate of 25.12 MHz/s. According to the transfer function of the Raman lasers’ relative phase noise, the system noise is influenced by phase noise in Fourier frequency range of 14 Hz to 42 kHz. In the frequency range of 14 Hz to 500 Hz, their relative phase noise is limited by the sensitivity of the SSA and, in the Fourier frequency between 200 Hz and 42 kHz, the noise is lower than −105 dBc/Hz. We use a fast power control system to realize fast re-lock while the Raman lasers fast turning on and off in the pulse sequence. Therefore, the Raman lasers pulse power stabilization is improved from 25% to 0.7%. Employed this Raman laser system, the gravimeter has been proved with a measurement sensitivity of 44   μ Gal / Hz and long-term (30,000 s) stability of 0.2 µGal with a continuous measurement of more than 500 h.

Author Contributions

Conceptualization, T.L.; methodology, Y.Z., S.W.; software, W.Z.; validation, T.L.; formal analysis, Y.Z., S.W.; data curation, Y.Z.; writing—original draft preparation, Y.Z.; writing—review and editing, S.W.; supervision, T.L. All authors have read and agreed to the published version of the manuscript.

Funding

This work is supported by the National Key R&D Program of China (Grant No 2016YFF0200200, 2016YFF0200206).

Conflicts of Interest

The authors declare no conflict of interest.

References

  1. Young, B. A Measurement of the Fine-structure Constant Using Atom Interferometry. Ph.D. Thesis, Stanford University, Stanford, CA, USA, 1997. [Google Scholar]
  2. Wicht, A.; Hensley, J.M.; Sarajlic, E.; Chu, S. A preliminary measurement of the fine structure constant based on atom interferometry. In Condensation and Coherence in Condensed Matter; Royal Swedish Academy of Sciences: Stockholm, Sweden, 2014. [Google Scholar]
  3. Cadoret, M.; Mirandes, E.D.; Pierre, C.; Julien, L.; Biraben, F.; Guellati-Khélifa, S. Atom interferometry based on light pulses: Application to the high precision measurement of the ratio h/m and the determination of the fine structure constant. Eur. Phys. J. Spec. Top. 2009, 172, 121–136. [Google Scholar] [CrossRef] [Green Version]
  4. Plotkin-Swing, B.; Gochnauer, D.; Mcalpine, K.E.; Cooper, E.S.; Jamison, A.O.; Gupta, S. Three-path atom interferometry with large momentum separation. Phys. Rev. Lett. 2017, 121, 133201. [Google Scholar] [CrossRef] [PubMed] [Green Version]
  5. Gustavson, T.L.; Bouyer, P.; Kasevich, M.A. Precision rotation measurement with an atom interferometer. Phys. Rev. Lett. 1997, 78, 2046–2049. [Google Scholar] [CrossRef] [Green Version]
  6. Takase, K. Precision Rotation Rate Measurements with a Mobile Atom Interferometer. Ph.D. Thesis, Stanford University, Stanford, CA, USA, 2008. [Google Scholar]
  7. Holmgren, W.F.; Revelle, M.C.; Lonij, V.P.A.; Cronin, A.D. Absolute and ratio measurements of the polarizability of Na, K, and Rb with an atom interferometer. Phys. Rev. A 2010, 81, 90. [Google Scholar] [CrossRef] [Green Version]
  8. Peters, A.; Chung, K.; Chu, S. High-precision gravity measurements using atom interferometry. Metrologia 2001, 38, 25. [Google Scholar] [CrossRef]
  9. Freier, C.; Hauth, M.; Schkolnik, V.; Leykauf, B.; Schilling, M.; Wziontek, H.; Scherneck, H.-G.; Müller, J.; Peters, A. Mobile quantum gravity sensor with unprecedented stability. J. Phys. Conf. Ser. 2016, 723, 012050. [Google Scholar] [CrossRef]
  10. Fang, B.; Dutta, I.; Gillot, P.; Savoie, D.; Lautier, J.; Cheng, B.; Garrido-Alzar, C.L.; Geiger, R.; Merlet, S.; Dos Santos, P.F.; et al. Metrology with atom interferometry: Inertial sensors from laboratory to field applications. J. Phys. Conf. Ser. 2016, 723, 012049. [Google Scholar] [CrossRef] [Green Version]
  11. Hu, Z.-K.; Sun, B.-L.; Duan, X.-C.; Zhou, M.-K.; Chen, L.-L.; Zhan, S.; Zhang, Q.-Z.; Luo, J. Demonstration of an ultrahigh-sensitivity atom-interferometry absolute gravimeter. Phys. Rev. A 2013, 88, 043610. [Google Scholar] [CrossRef]
  12. Wang, S.-K.; Zhao, Y.; Zhuang, W.; Li, T.-C.; Wu, S.-Q.; Feng, J.-Y.; Li, C.-J. Shift evaluation of the atomic gravimeter NIM-AGRb-1 and its comparison with FG5X. Metrologia 2018, 55, 360–365. [Google Scholar] [CrossRef]
  13. Fu, Z.; Wang, Q.; Wang, Z.; Wu, B.; Cheng, B.; Lin, Q. Participation in the absolute gravity comparison with a compact cold atom gravimeter. Chin. Opt. Lett. 2019, 17, 011204. [Google Scholar] [CrossRef]
  14. Malossi, N.; Bodart, Q.; Merlet, S.; Landragin, A.; Dos Santos, P.F. Double diffraction in an atomic gravimeter. Phys. Rev. A 2010, 81, 013617. [Google Scholar] [CrossRef] [Green Version]
  15. Zhou, M.K. Experimental Demonstration of an Atom Interferometry Gravimeter. Ph.D. Thesis, Huazhong University of Science and Technology, Wuhan, China, 2011. [Google Scholar]
  16. Cheinet, P.; Canuel, B.; Dos Santos, F.P.; Gauguet, A.; Yver-Leduc, F.; Landragin, A. Measurement of the sensitivity function in a time-domain atomic interferometer. IEEE Trans. Instrum. Meas. 2008, 57, 1141. [Google Scholar] [CrossRef] [Green Version]
  17. Malte, S. A Mobile High-Precision Gravimeter Based on Atom Interferometry. Ph.D. Thesis, Humboldt-Universität zu Berlin, Berlin, Germany, 2011. [Google Scholar]
  18. Louchetchauvet, A.; Farah, T.; Bodart, Q.; Clairon, A.; Landragin, A.; Merlet, S.; Dos Santos, P.F. The influence of transverse motion within an atomic gravimeter. New J. Phys. 2011, 13, 2007–2009. [Google Scholar]
  19. Cheinet, P.; Dos Santos, P.F.; Petelski, T.; Le Gouët, J.; Kim, J.; Therkildsen, K.T.; Clairon, A.; Landragin, A. Compact laser system for atom interferometry. Appl. Phys. B Lasers Opt. 2006, 84, 643–646. [Google Scholar] [CrossRef] [Green Version]
  20. Bouyer, P.; Gustavson, T.L.; Haritos, K.G.; Kasevich, M.A. Microwave signal generation with optical injection locking. Opt. Lett. 1996, 21, 1502–1504. [Google Scholar] [CrossRef] [PubMed]
  21. Shahriar, M.S.; Turukhin, A.V.; Tan, Y.L.; Hemmer, P.R. Demonstration of injection locking a diode laser using a filtered electro-optic modulator sideband. Opt. Commun. 2000, 184, 457–462. [Google Scholar] [CrossRef]
  22. Zhu, L.; Lien, Y.-H.; Hinton, A.; Niggebaum, A.; Rammeloo, C.; Bongs, K.; Holynski, M. Application of optical single-sideband laser in Raman atom interferometry. Opt. Express 2018, 26, 6542–6553. [Google Scholar] [CrossRef] [PubMed]
  23. Zhu, L.; Zhong, J.Q.; Chen, X.; Song, H.W.; Zhang, X.W.; Tang, B.; Gao, F.; Wang, J.; Zhan, M.S. Measurement and control of the sideband to carrier ratio of an electro-optic modulator used in atom interferometers. Opt. Express 2017, 25, 11365. [Google Scholar] [CrossRef] [PubMed]
  24. E5052B Signal Source Analyzer. Available online: https://www.keysight.com/us/en/assets/7018-01528/data-sheets/5989-6388.pdf (accessed on 20 March 2020).
  25. Gauguet, A.; Mehlstäubler, T.E.; Lévèque, T.; Le Gouët, J.; Chaibi, W.; Canuel, B.; Clairon, A.; Dos Santos, P.F.; Landragin, A. Off-resonant raman transition impact in an atom interferometer. Phys. Rev. A 2008, 78, 043615. [Google Scholar] [CrossRef] [Green Version]
  26. Camp, M.V.; Vauterin, P. Tsoft: Graphical and interactive software for the analysis of time series and Earth tides. Comput. Geosci. 2005, 31, 631–640. [Google Scholar] [CrossRef]
Figure 1. Scheme of optical phase locking for Raman-laser system. HWP: half wave-plate; PBS: polarizing beam splitter cube; AOM: acousto-optical modulator; AP: aperture; PD: photo detector; SG: signal generator; Mix: mixture; LP: Low pass.
Photonics 07 00032 g001
Figure 2. Beatnote between two Raman lasers with a phase noise reduction over 80 dB.
Photonics 07 00032 g002
Figure 3. Raman lasers’ relative phase noise power spectrum destiny. Red line is the phase noise power spectrum destiny (PSD) of the reference signal and the black one is the Raman lasers’.
Photonics 07 00032 g003
Figure 4. Scheme of reference laser frequency stabilization. (M: mirror. HWP: half wave-plate; PBS: polarizing beam splitter cube; EOM: electro-optic modulator; AOM: acousto-optical modulator; Expander: beam expander; AP: aperture).
Photonics 07 00032 g004
Figure 5. Beat note between the reference laser and the optical frequency comb.
Photonics 07 00032 g005
Figure 6. Power of the Raman laser in free running.
Photonics 07 00032 g006
Figure 7. Scheme of the power stabilization system of Raman-laser pulse.
Photonics 07 00032 g007
Figure 8. Raman-laser pulse power when the sequence turns on.
Photonics 07 00032 g008
Figure 9. On-off time comparison of trigger signal and Raman lasers pulse (in free running and with power stabilizing).
Photonics 07 00032 g009
Figure 10. Power both of the Raman laser in free running (upper) and in stabilization (lower).
Photonics 07 00032 g010
Figure 11. Power of Raman laser out-off-loop.
Photonics 07 00032 g011
Figure 12. Continuous tidal signal measured for 500 h. Each dot is the result of 180 drops, three minutes average. (a) Red points represent experiment data; black solid line represents the theoretical tide model; (b) the residuals of the measured and theoretical data.
Photonics 07 00032 g012
Figure 13. Allan deviations of NIM-AGRb-1 and FG5X-249.
Photonics 07 00032 g013

