1. Introduction
Currently, building consumption contributes to more than 40% of CO
2 emissions, which are mainly caused by heating, air conditioning, and power systems in general. Therefore, the improvement of the performances of such systems represents a relevant aspect that needs to be taken into account toward the sustainable development of our planet, reducing the global emissions by up to 80% by the year 2050, according to the requirements imposed by the European Union (EU) [
1,
2,
3].
In this scenario, buildings should be refurbished and technologically improved in order to optimize their energy efficiency and sustainability. Typically, this can be achieved by means of two main methodologies: passive methods, finalized to reduce the energy demand in terms of both cooling and heating, and active methods, which are focused on the development of innovative active and green technologies integrated into the building, capable of generating electrical energy in a sustainable way. For instance, the replacement of traditional windows or glass walls with renewable energy systems, such as photovoltaic (PV) innovative structures, could provide a significant reduction in terms of energy consumption of the building [
4,
5,
6]. The third-generation PV systems, namely dye-sensitized solar cells (DSSC), are suitable for architectural integration [
7,
8]. Moreover, due to their bifacial features, the DSSC cells can replace glass windows, converting the light of both the indoor and outdoor environments [
9,
10].
In this context, this work presents a technical and economical comparison of the performances of different vertical-mounted innovative and integrated photovoltaic systems.
Section 2 further describes the current background concerning building-integrated PV technology.
The experimental investigation is extended for the DSSC and thin-film silicon technologies, reported in
Section 3.
Section 3 also describes the experimental set-up employed to evaluate the performances of the classes of cells considered. The technical and economical performance comparisons in terms of cost, efficiency, and fill factor are discussed in
Section 4 and
Section 5.
2. Building-Integrated Photovoltaic Technology
Due to the mandatory requirement for a global reduction of pollutants, zero-energy and self-powered buildings represent an attractive solution in future urban scenarios. Therefore, BIPV (building-integrated photovoltaic) technology was increasingly developed in the last few years. The main idea of this technological solution is the adoption of PV materials in place of the bulky structural elements conventionally presented by buildings. Non-integrated PV systems are, therefore, likely to be soon overtaken by BIPV systems, due to the double role played by this innovative solution. Indeed, BIPV technology can be employed both as a building material and as a power generator, thus avoiding additional space for PV module installation. The description of PV technology’s evolution and its respective use for building integration is provided in
Section 2.1,
Section 2.2 and
Section 2.3.
2.1. The First Generation of Solar Cell Technology in BIPV Systems
Single-junction cells based on silicon wafers represent the first generation of solar cells developed for BIPV systems. This technology consists of crystalline silicon (c-Si) structures, which are roughly and rigidly placed on the building’s roof, as shown in
Figure 1. They are generally characterized by the following aspects: high thickness (0.2–0.5 mm), which clashes with architectural integration; a 10–16% efficiency range, guaranteed from 20 to 30 years, which gained attention in a period of low cost of electrical energy; very solid know-how, due to its commercial spread since the 1970s; overall approximate cost of 3000–4500 €/kWp installed, which requires an incentive policy for its diffusion.
The polycrystalline silicon (poly-Si) technology was thereafter developed to reduce the associated costs. Despite the novelty represented by the upgraded technology in the purification process of poly-Si (metallurgical material in place of a chemical one), the PV modules based on this material are not perfectly suitable for building integration due to their non-uniform tonality.
2.2. The Second Generation of Solar Cell Technology in BIPV Systems
The second generation PV technology presents single junction devices, employing amorphous silicon (a-Si), polycrystalline-Si (p-Si), copper indium gallium diselenide (CIGS), cadmium telluride/cadmium sulphide (CdTe/CdS), or deposited on low-cost substrates, such as glass. CdTe, CIGS and a-Si feature a higher solar spectrum absorption with respect to that of c-Si and poly-Si, so that an active material reduction is possible at the same efficiency as that of first generation solar cells.
Therefore, second generation BIPV panels are more flexible than first generation ones, featuring the following aspects: low thickness (10–100 μm); integration is no longer a sum of dissimilar elements; a 6–10%, efficiency range guaranteed from 15 to 20 years; in spite of an efficiency reduction, the use of larger surfaces, allows compensation even though with a lower visual impact; consolidated know-how, due to a commercialization for over fifteen years; high level of consumer confidence.
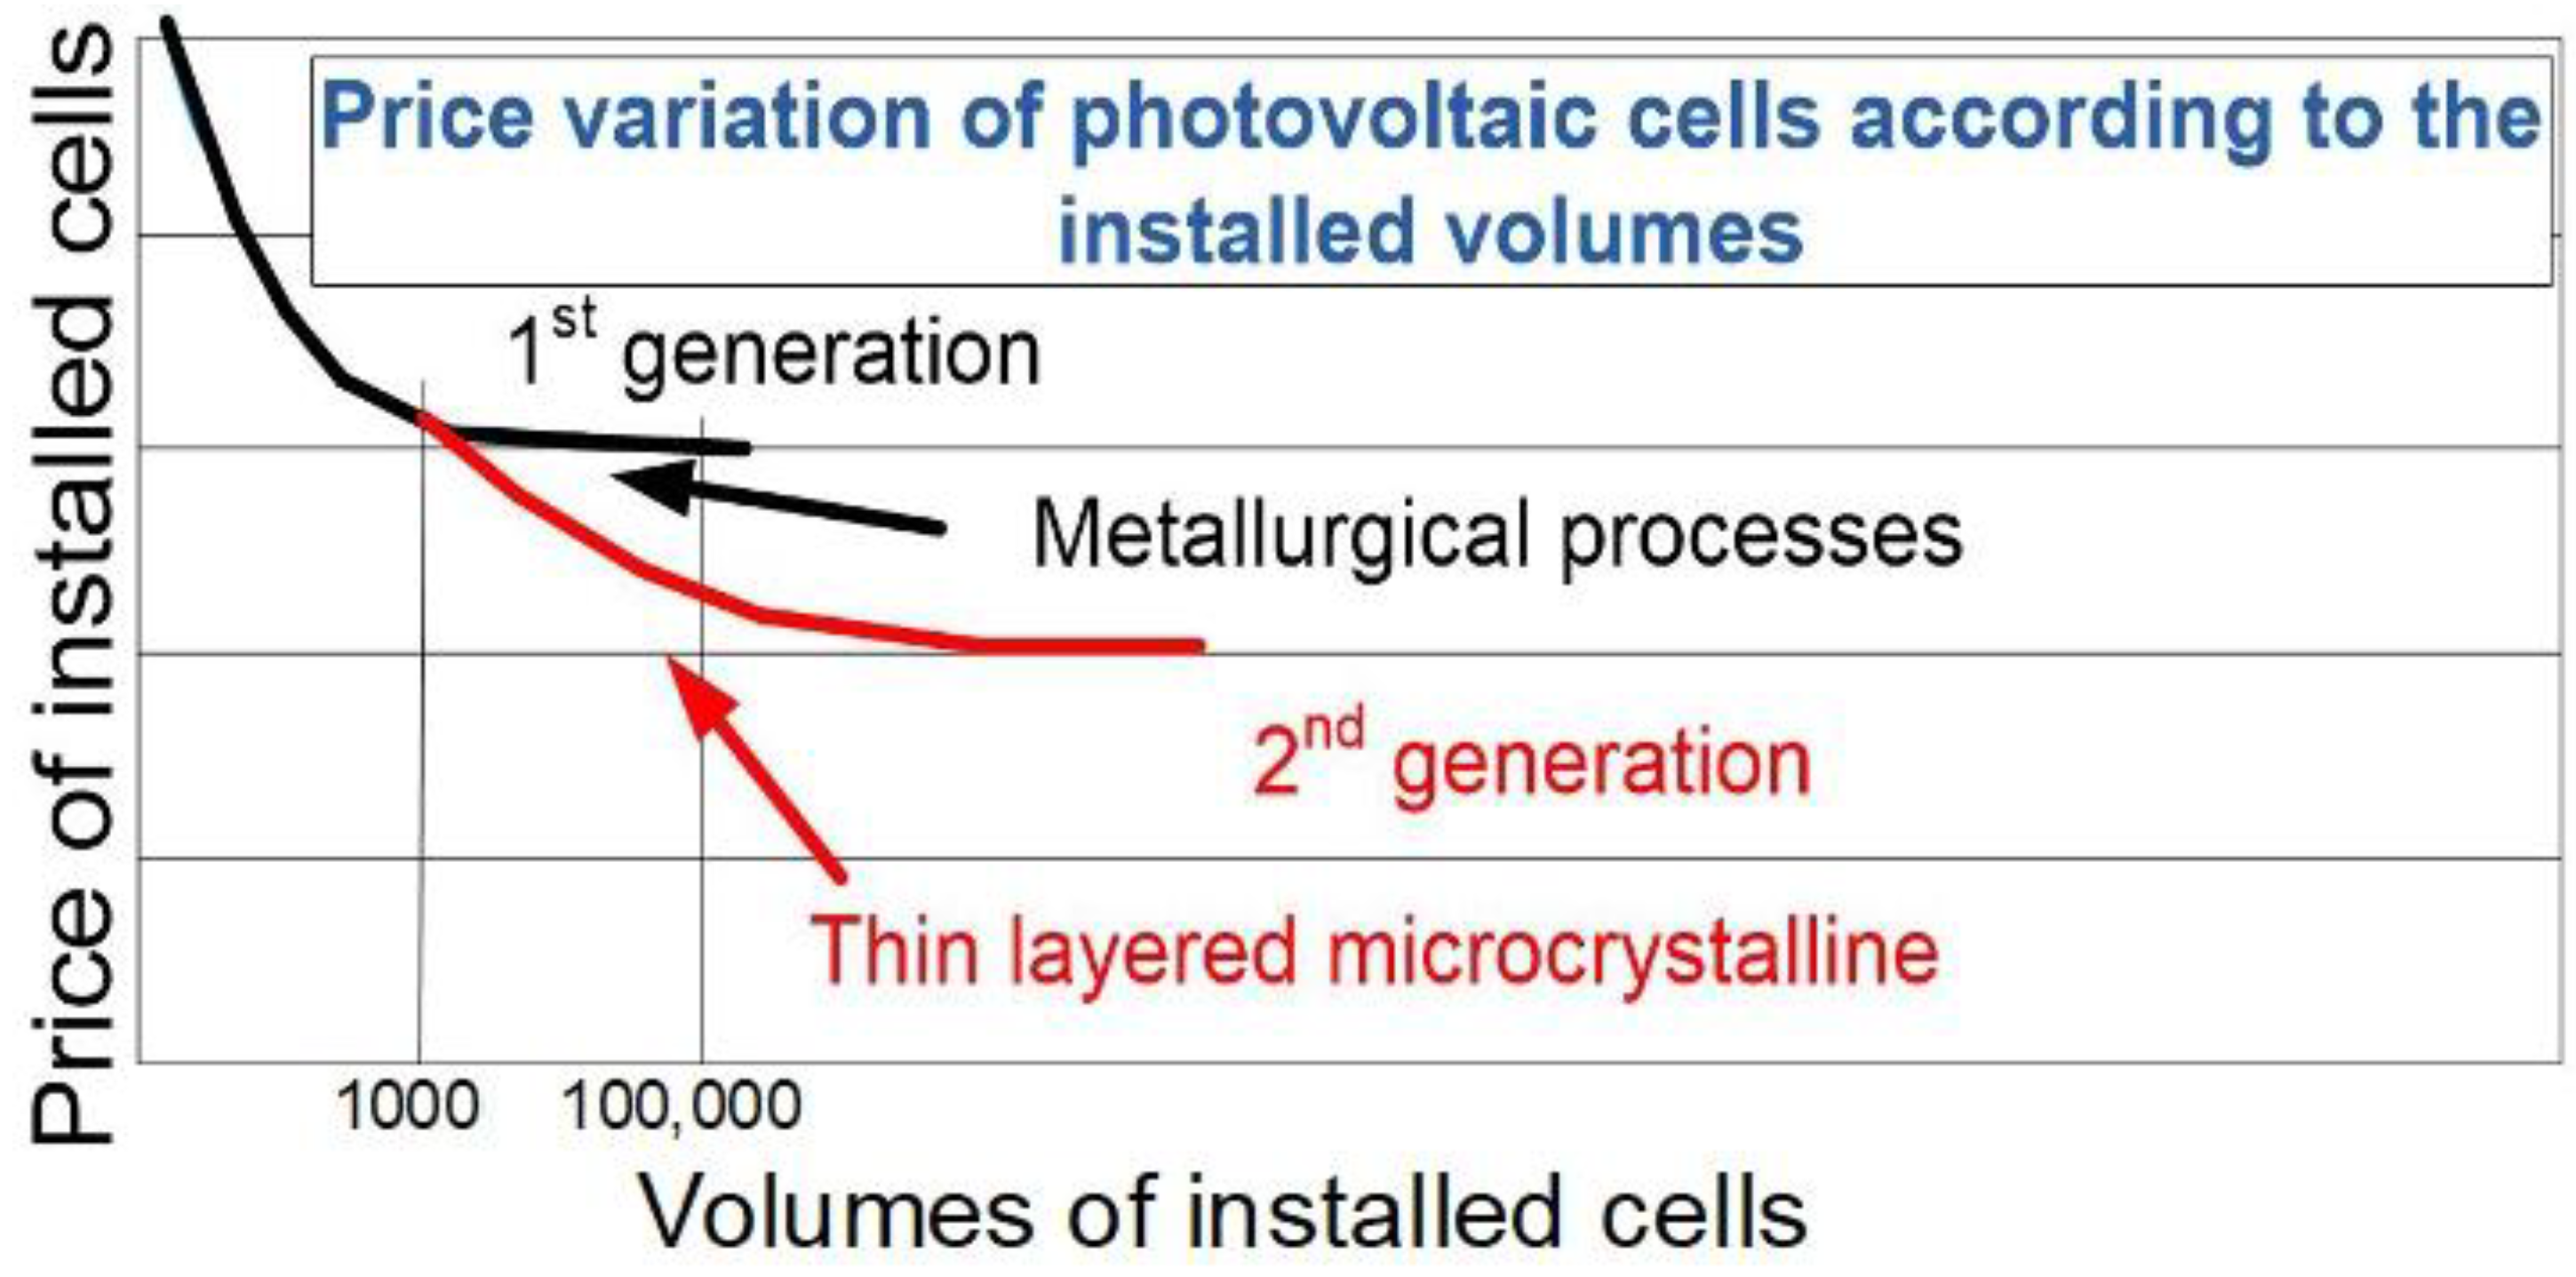
The low-cost metallurgical process remarkably contributed to cost reduction, especially for high volumes of cells, as highlighted in
Figure 2, where the price of installed cells as a function of their number is reported, for the two solar cell generations. It is well known that the second generation is introduced at the inflection point of the first one.
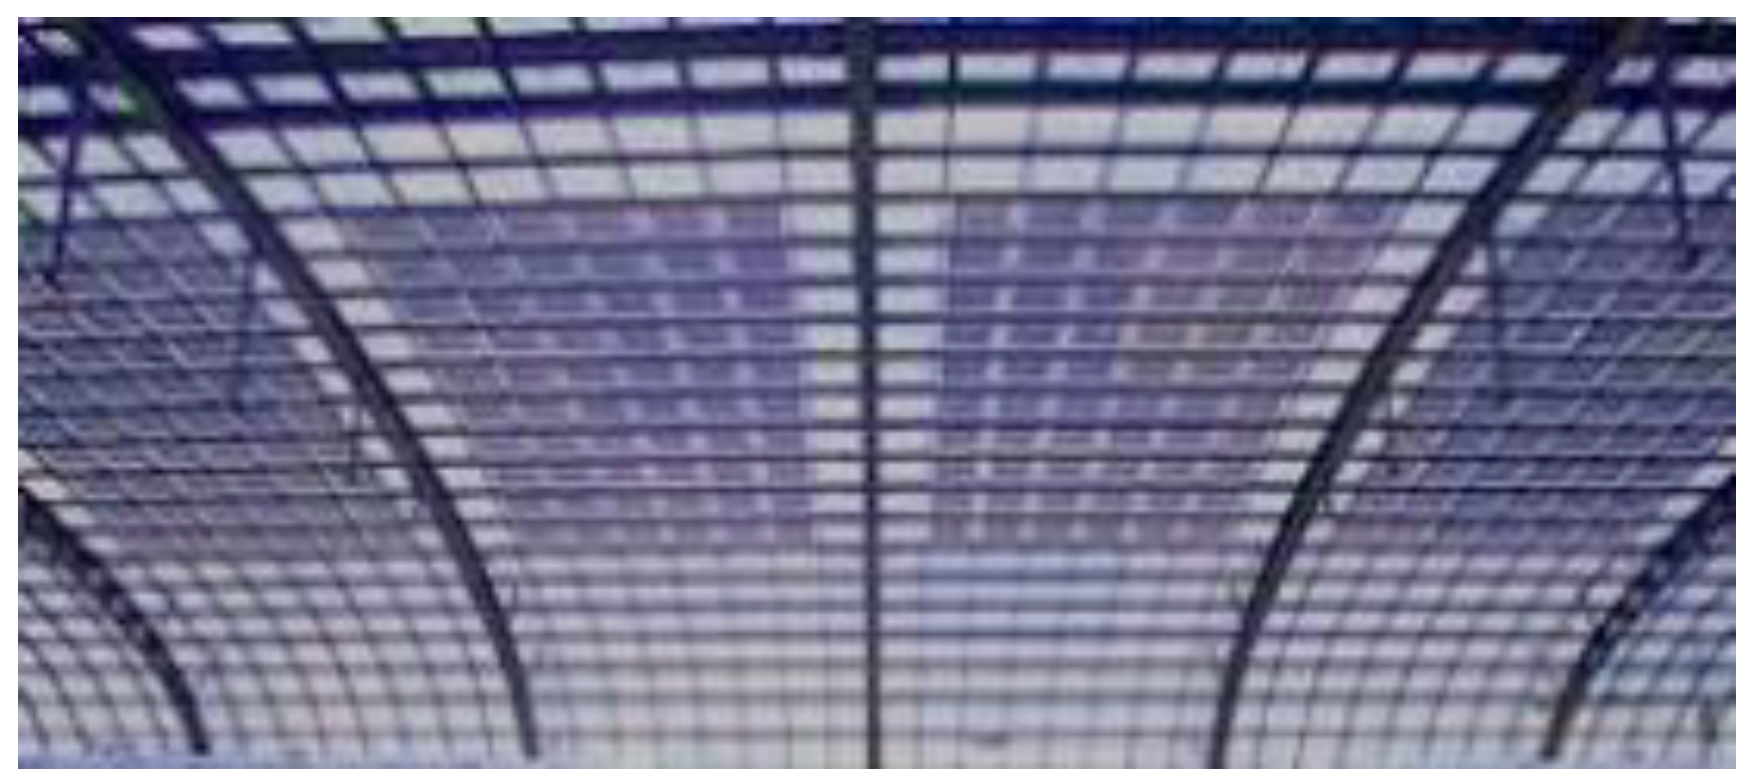
By depositing onto a substrate several layers of photovoltaic solar cell materials, an a-Si thin film is obtained. This deposition can occur at temperature values which are low enough to be also compliant with plastic supports, so that bent structures can be realized, as the one shown in
Figure 3.
2.3. The Third Generation of Solar Cell Technology in BIPV Systems
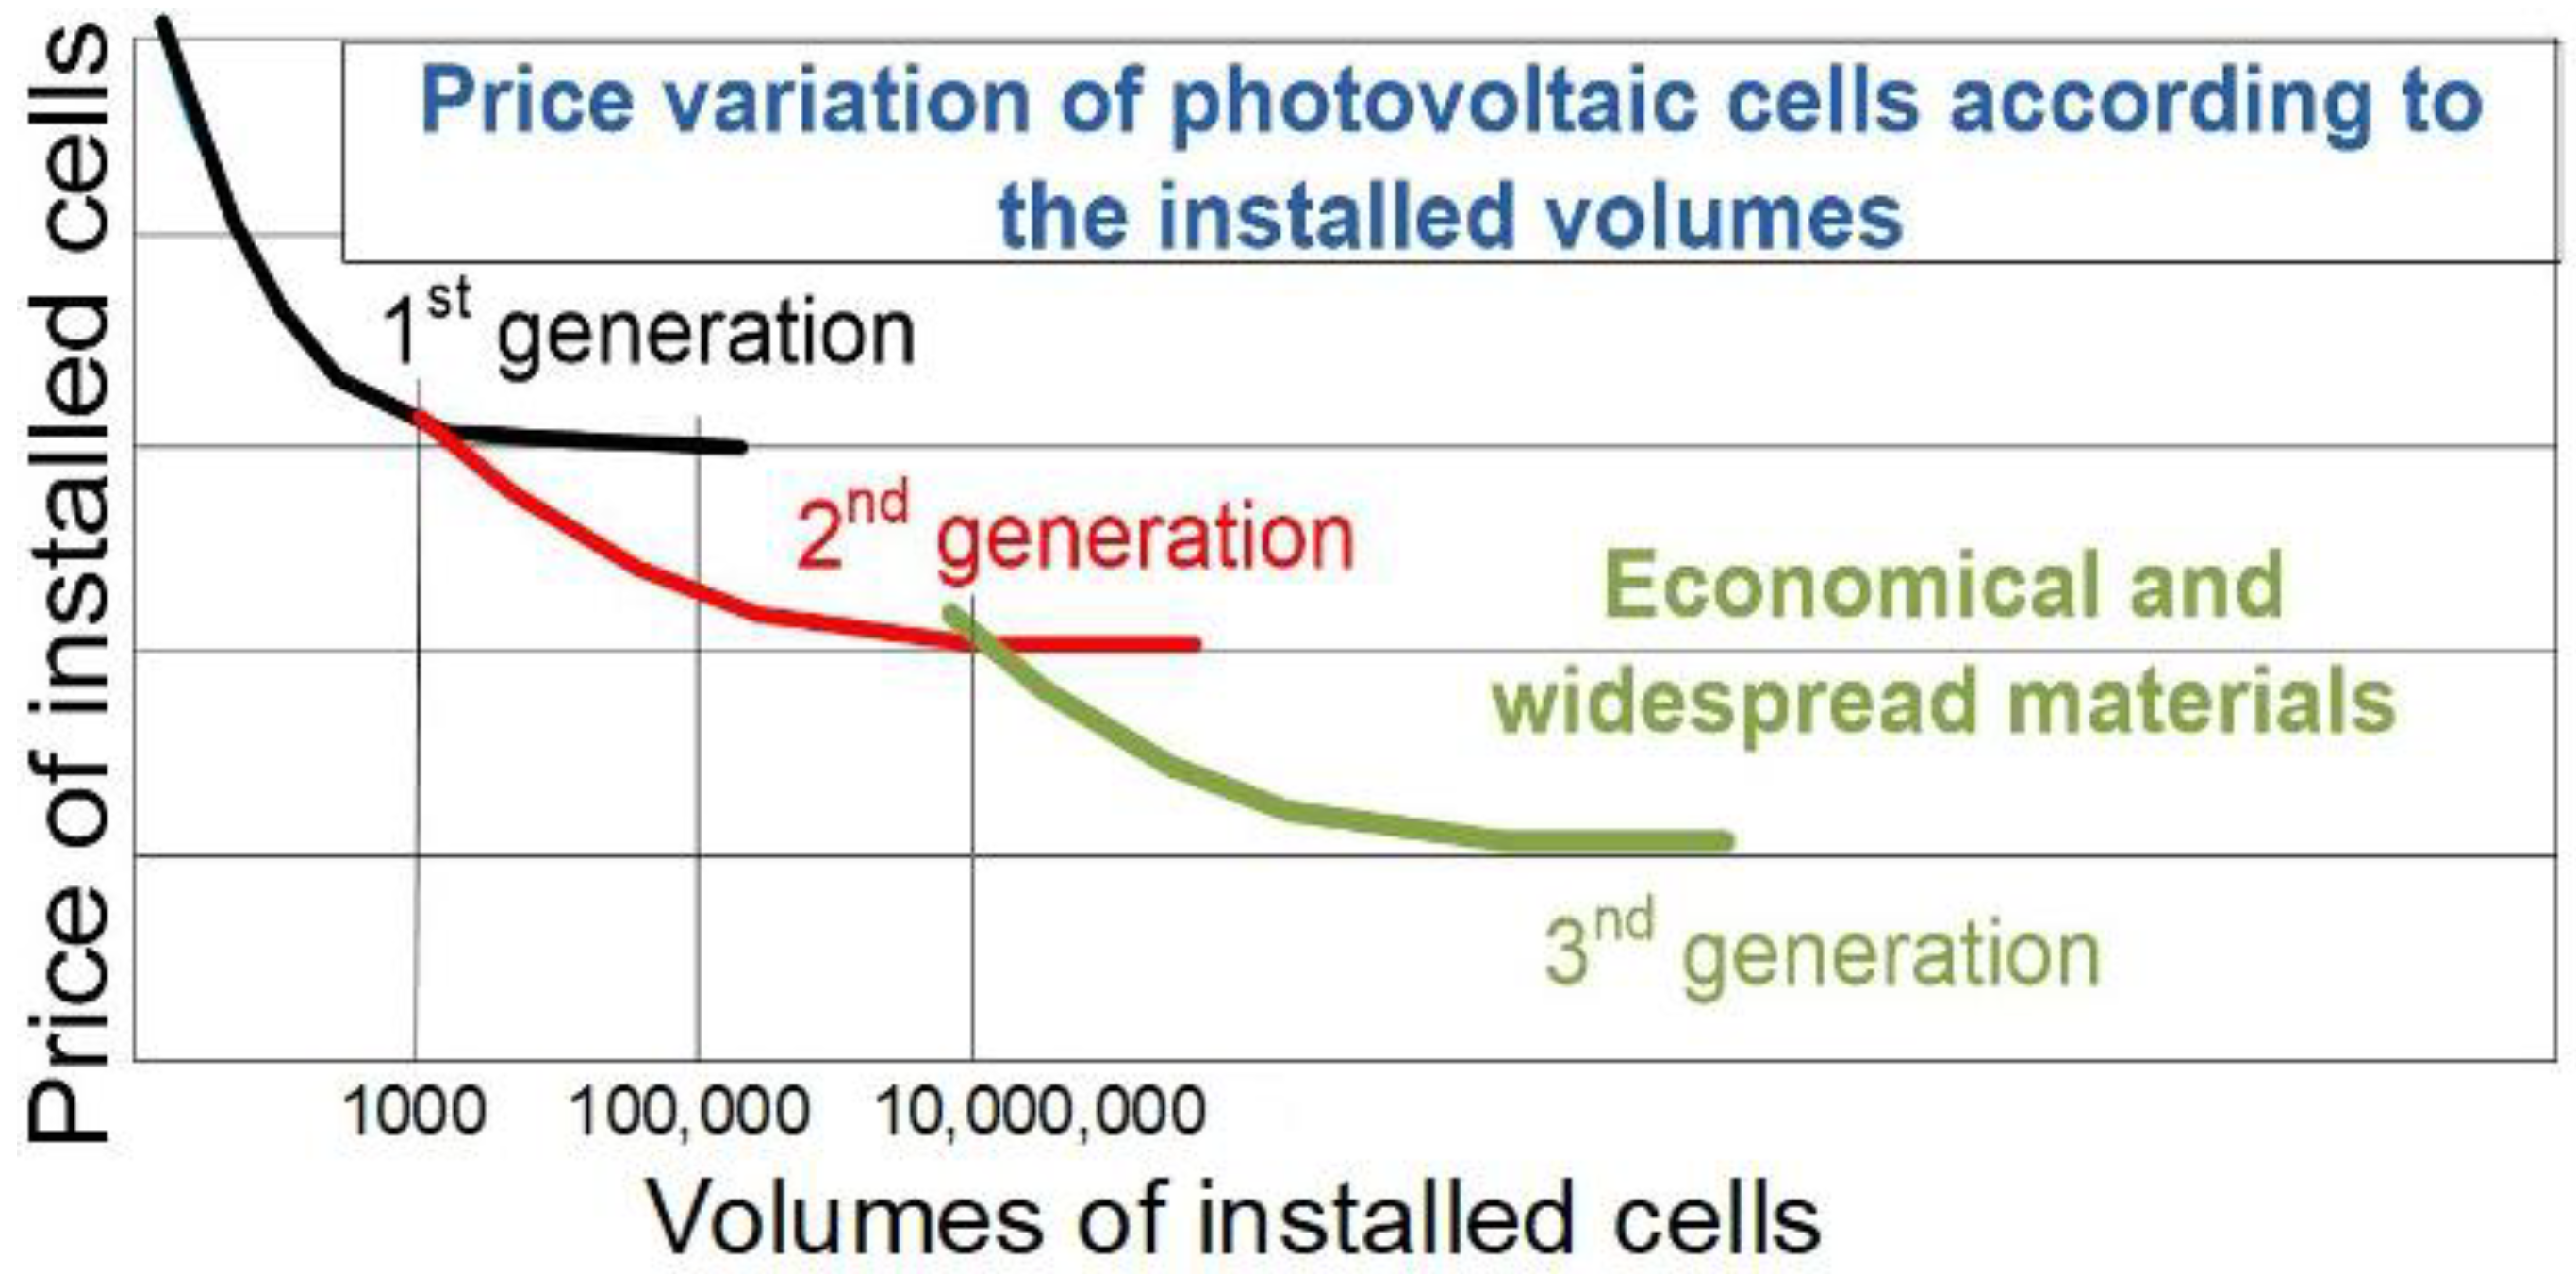
The BIPV systems of the third generation are characterized by the same deposition and thin-film processes used for the second generation cells. Nevertheless, manufacturing costs are decreased by opting for low-cost non-toxic materials and by increasing the active materials surface. This technology is characterized by the following aspects: a theoretically obtainable efficiency of around 25%; adoption of inorganic materials presumably used.
Figure 4 highlights the goal of the third generation PV: in order to increase the spread of generation systems, by the conversion of each surface into an improved surface, price reduction should lead to increase the occupied area. It can be noted that the third generation is introduced at the inflection point of the second one.
2.3.1. DSSC (Dye-Sensitized Solar Cells)
The DSSC (dye-sensitized solar cell) is a solar cell featuring low cost and belonging to the family of thin film solar cells, conceived in 1991 by Brian O’Regan and Michael Gratzel [
7]. The features of this technology can be summarized as follows: semi-flexibility and semi-transparency, which allow high integration levels; adoption of low-cost materials, which are abundant in nature; short-circuit current density, namely Jsc, almost equal to 20 mA/cm
2; open circuit voltage, namely V
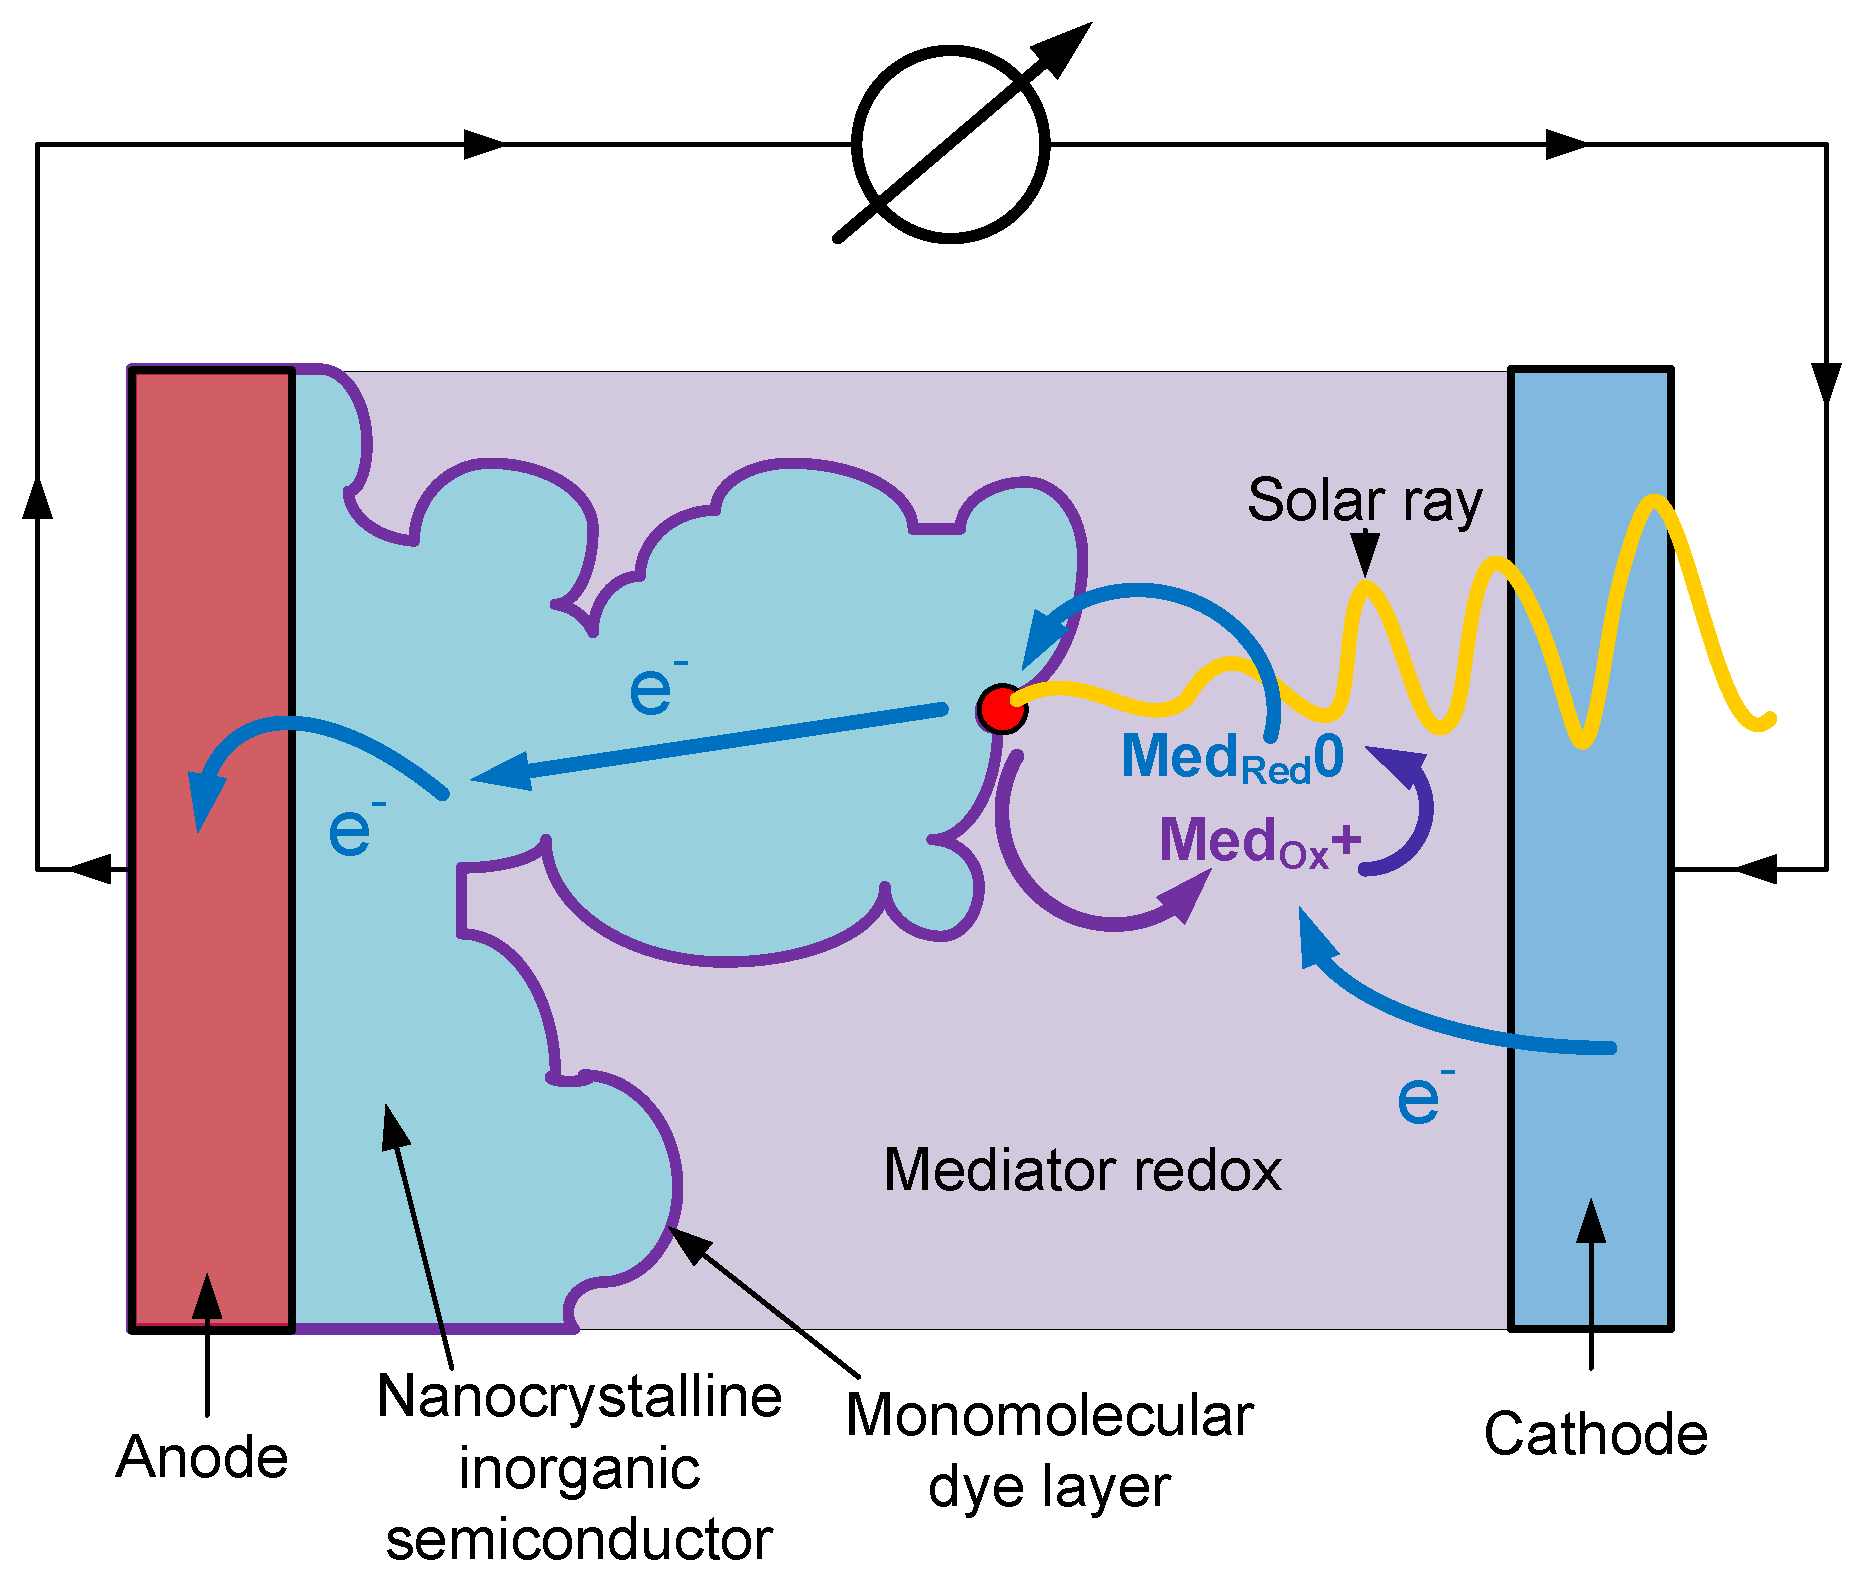
oc, equal to 0.7 V; efficiency in the range between 10–12%, values traditionally used; stability up to 60–65 °C, which can be limiting in some applications; suitable for low-cost and high-volume production; more than 20% expected efficiency over 5–10 years; good results even with diffused light. The principle of operation for a DSSC cell is schematically represented in
Figure 5.
A nanocrystalline material of inorganic semiconductor is deposited on a transparent electrode and covered with an organic layer of monomolecular dye. All these materials are immersed in an electrolyte liquid, in which a mediator of oxidoreduction is dissolved.
A dye of organic material generates an excited state (electron + hole), whenever hit by the sun’s radiation; the electron is led to the inorganic semiconductor conduction band, while the hole stays on the dye. The mediator gives the electron which is missing in the dye and therefore it is oxidized. The electron that was directed to the semiconductor arrives at the anode and at the electric circuit to supply the load. An electron closes the circuit flowing from the cathode to reduce the oxidized mediator.
The DSSCs dye can feature different colors to guarantee a proper integration with the architectural structure. Further details on characterization and modelling carried out on DSSC cells can be found in [
11,
12,
13,
14,
15,
16]. In order to provide a good comparison among the different PV systems, the Green’s tables should be considered. The mean performances such as efficiency, fill factor and open circuit voltage are reported [
17].
2.3.2. BIPV Structures
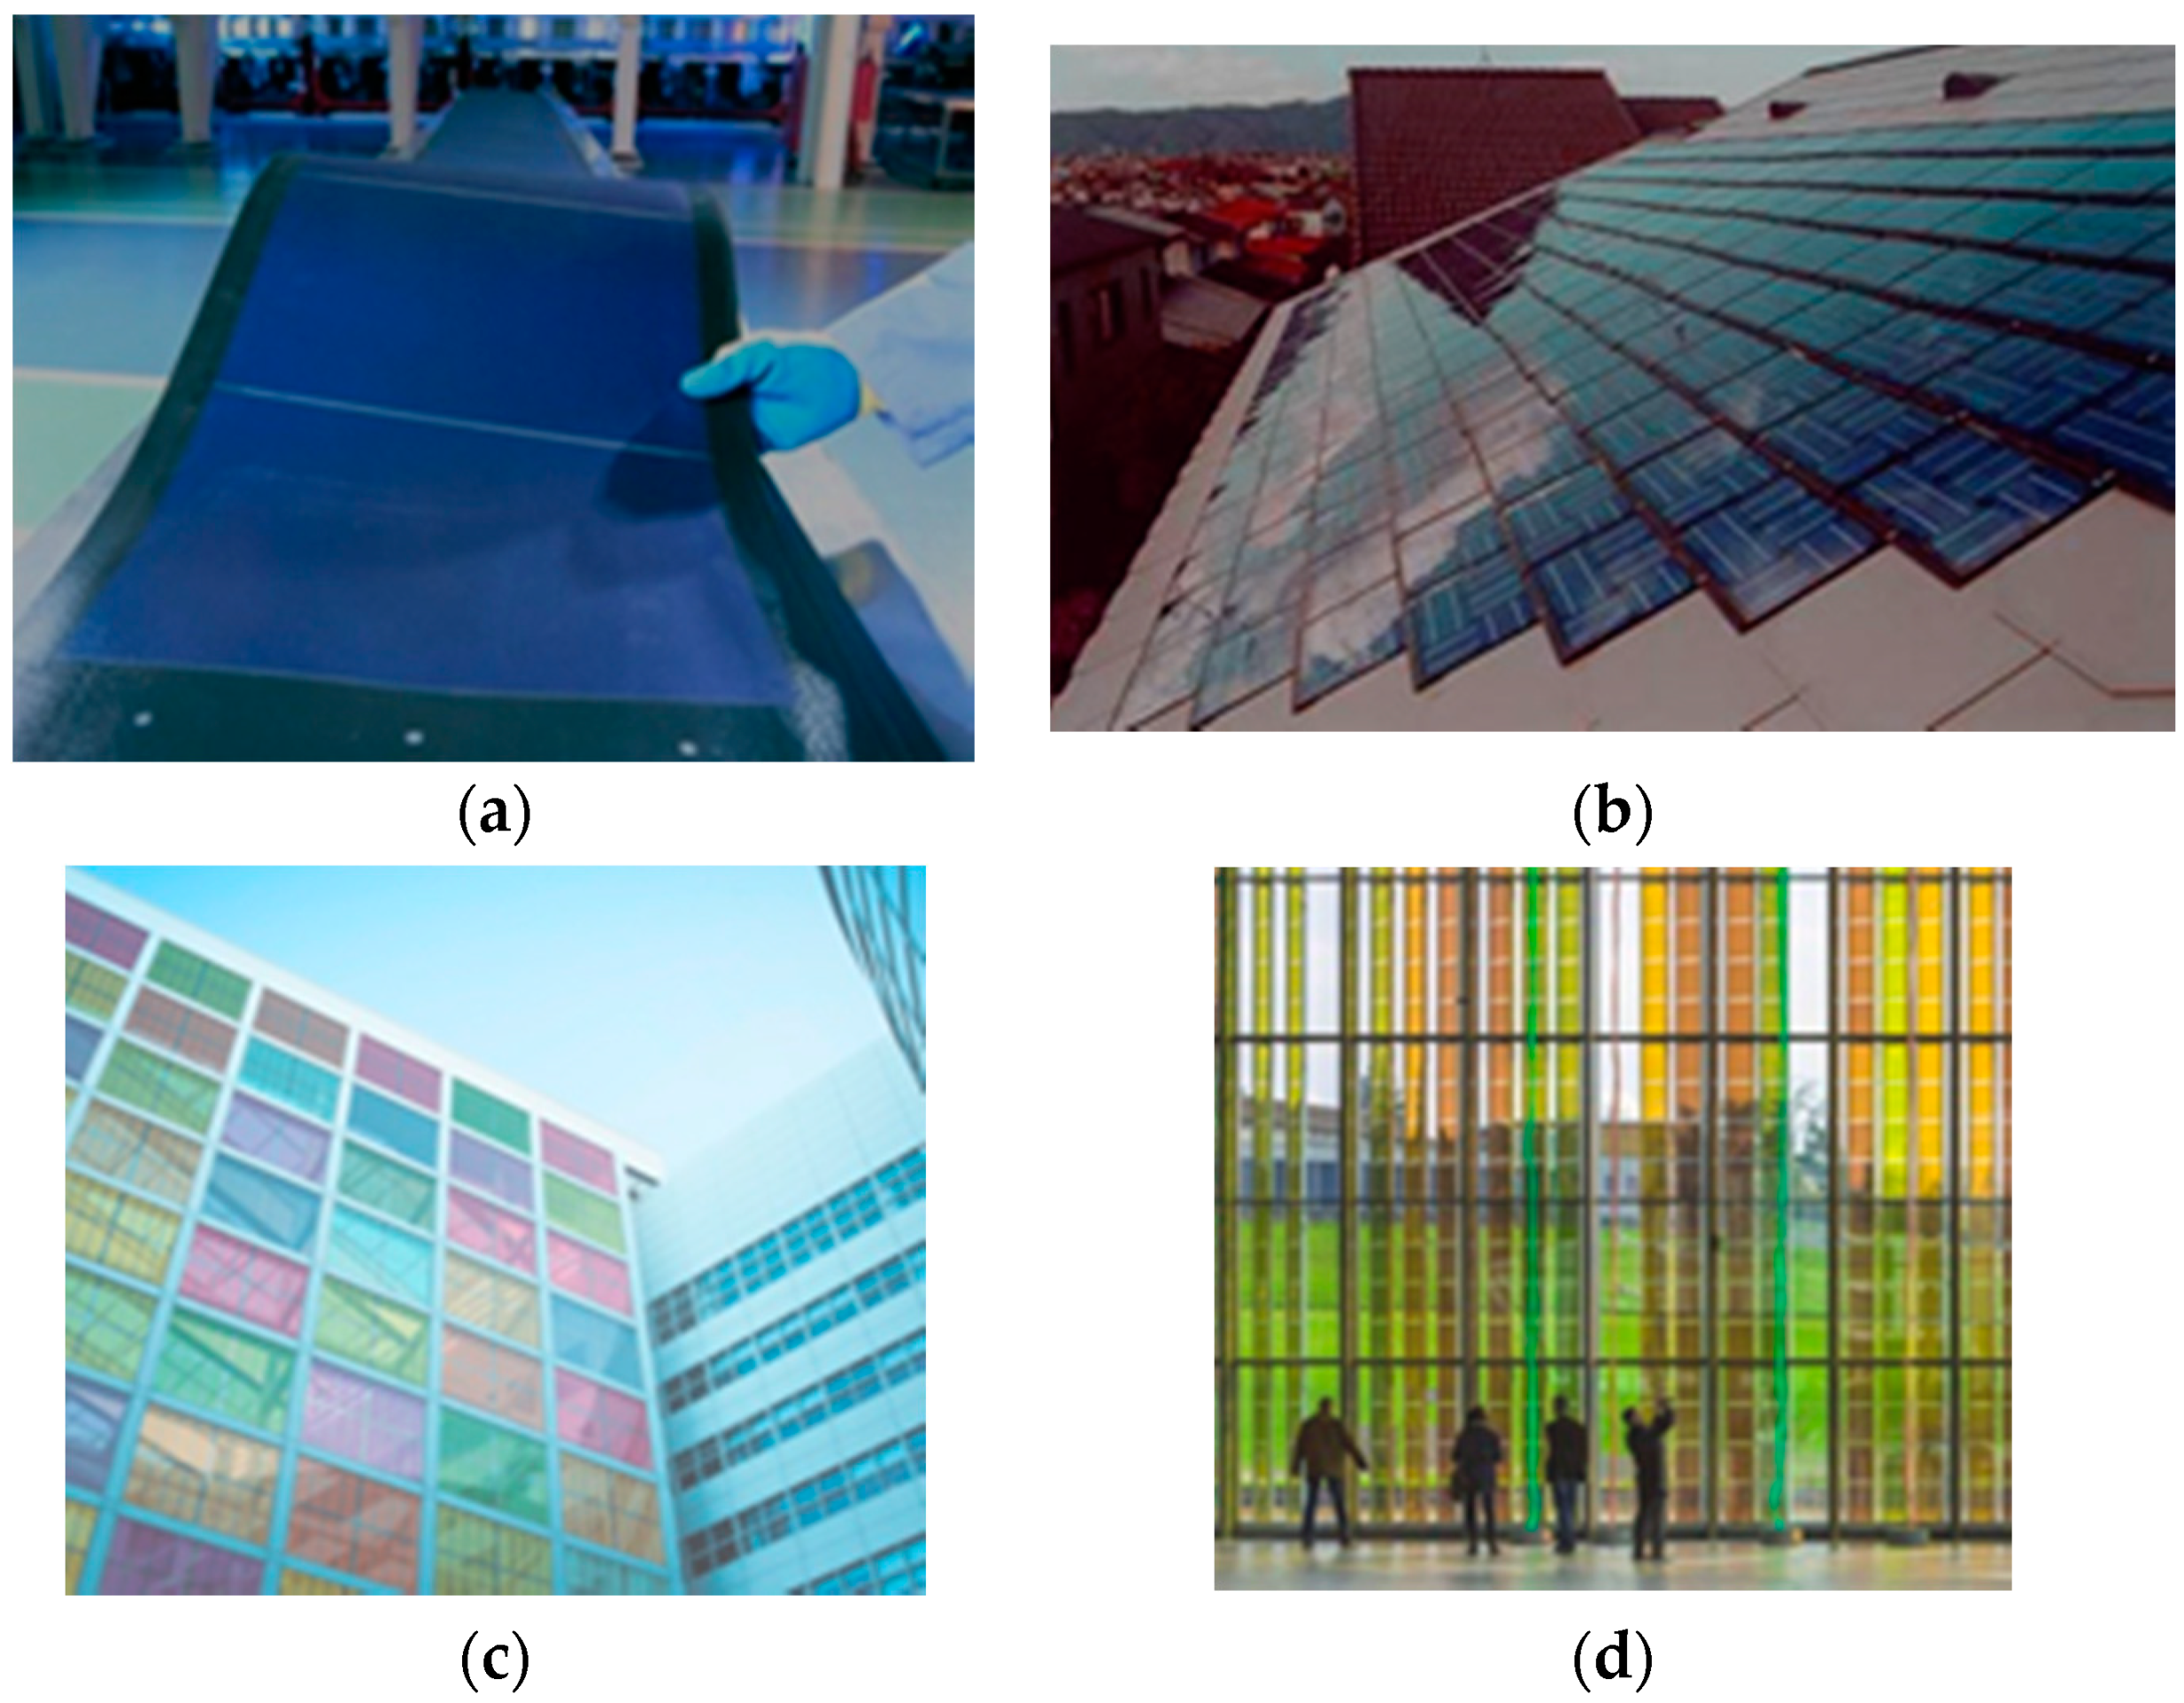
Several structures are allowed by the use of third generation PVs, such as foil, tile, module and solar glazing. Foil products are notably lightweight, flexible and particularly suitable for being placed on the roofs. Tiles can be successfully employed to partially or totally cover the roof. Thanks to flexibility and chromatic variability provided by third generation PV modules, appreciable results in terms of geometries and colors can be achieved by the use of these tiles.
Due to several levels of color and transparency offered by the PV cell glazing products, an unrestricted selection of solutions for windows, facades, glassed and roofs is possible, so that the targets in terms of both energy production and aesthetics can be reached. Furthermore, the PV cell glazing modules spread the sunlight and provide protection from natural elements like a conventional window.
Figure 6 shows some examples of the different products.
3. Experimental Setup
As introduced in the previous Sections, PV vertical structures have a triple aim: production of electrical energy, transmission of light in the building and regulation of heat transmission. The use of technology is the filament connecting these different pieces. The introduction of an electrical power generation surface actually changes the transmittance properties of the window, for both light radiation and heat transfer.
The realization of shading solution can be achieved by integrating semi-transparent modules inside a glass shell. In order to maximize both energy savings and generation of electrical energy, transparency should be accurately balanced, as reported in [
18,
19,
20].
The vertical structures compared in this work are shown (during their installation) in
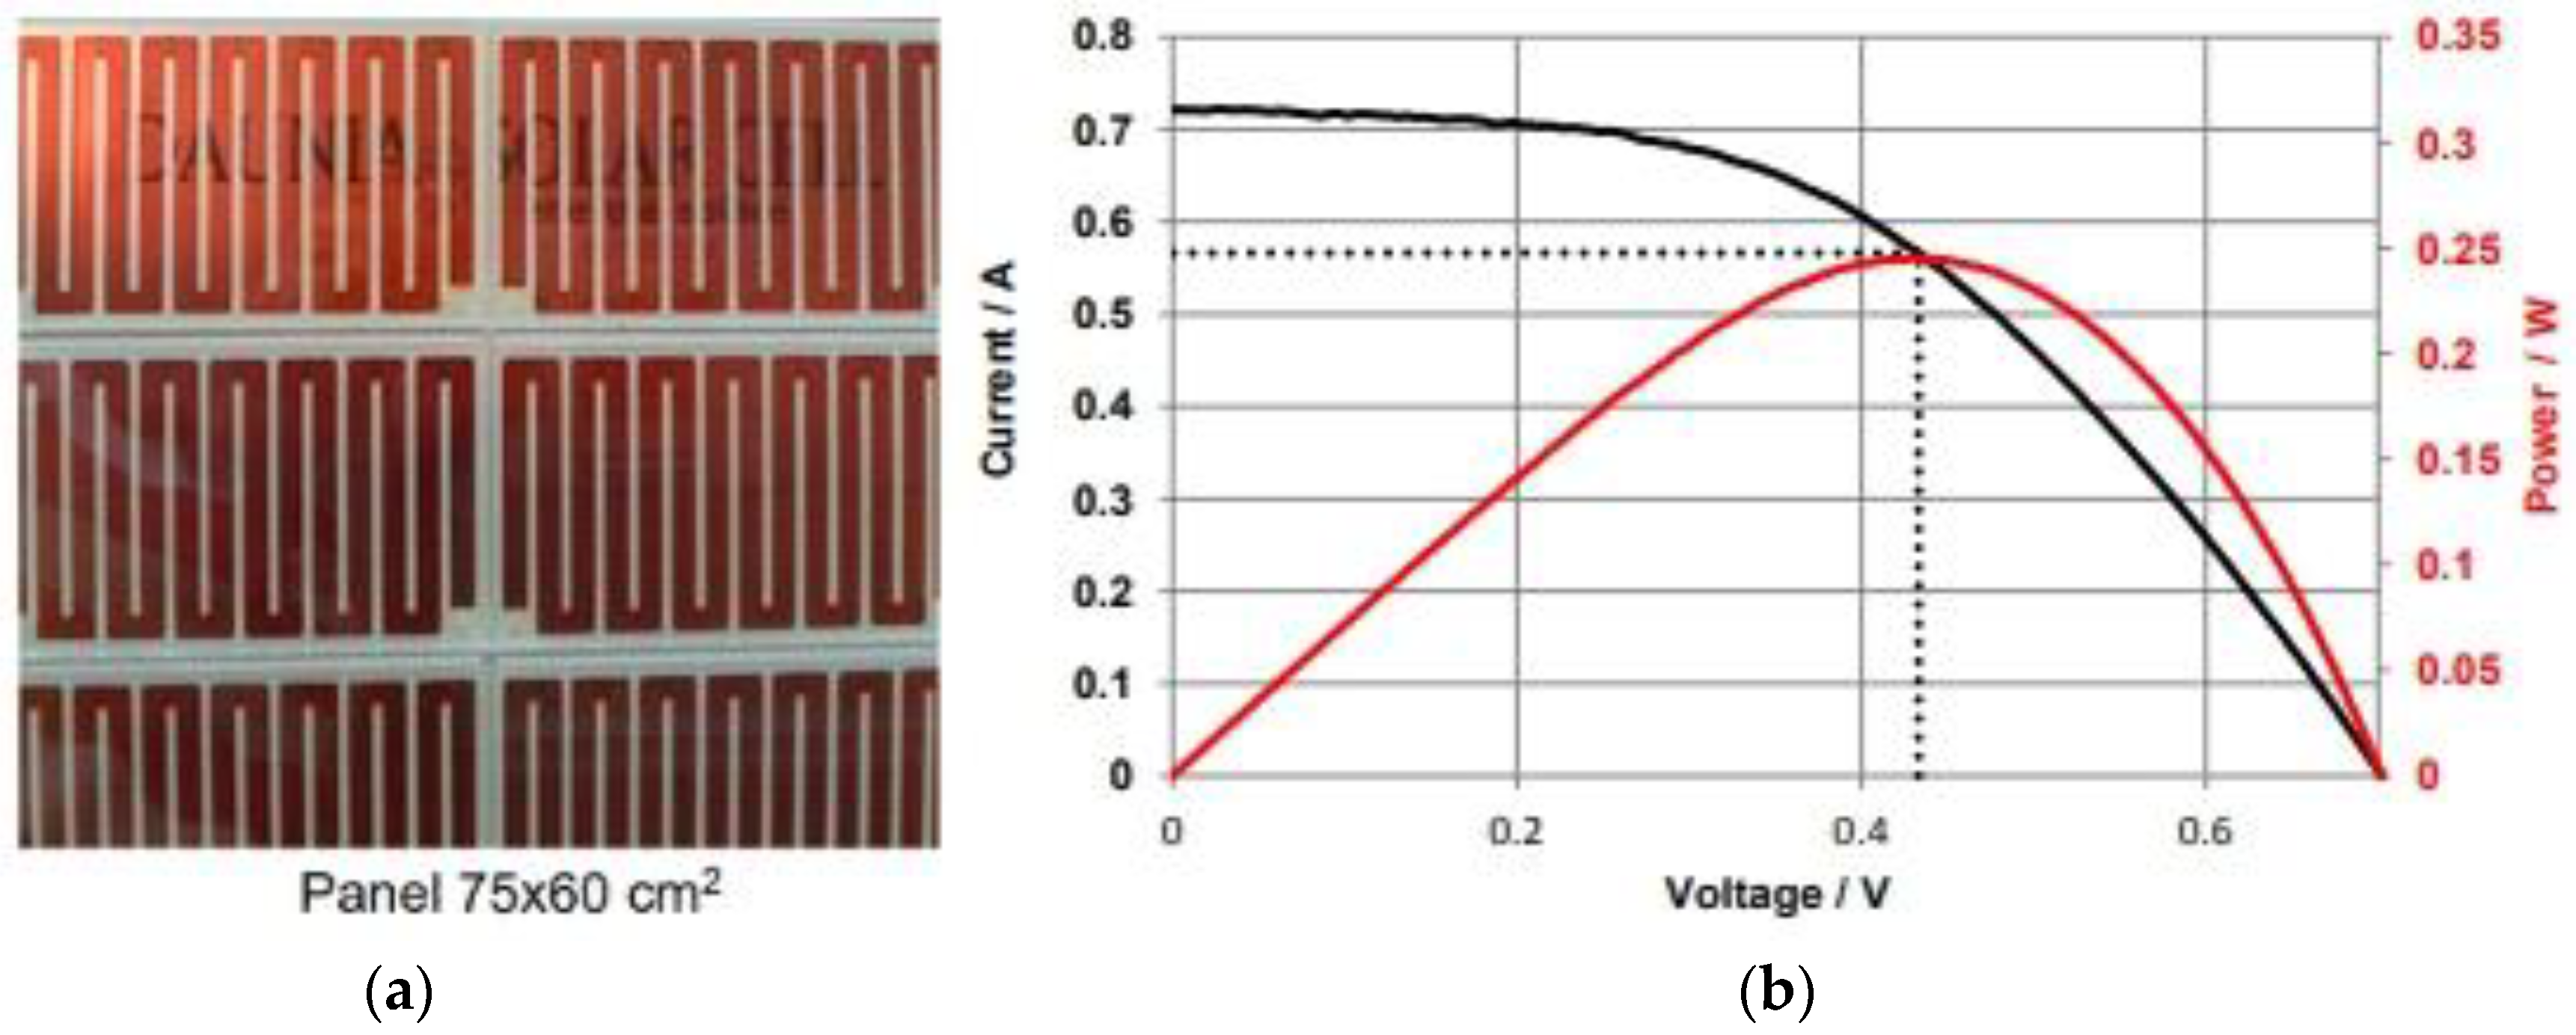
Figure 7; the location is University of Palermo, Italy. With regards to the DSSC panel, 8 modules (30 × 30 cm, Daunia Solar Cell Inc., Tozzi Renewable Energy, Mezzano, RA, Italy) are connected in a series, composed by a narrow lined and wide striped design, as shown in
Figure 8.
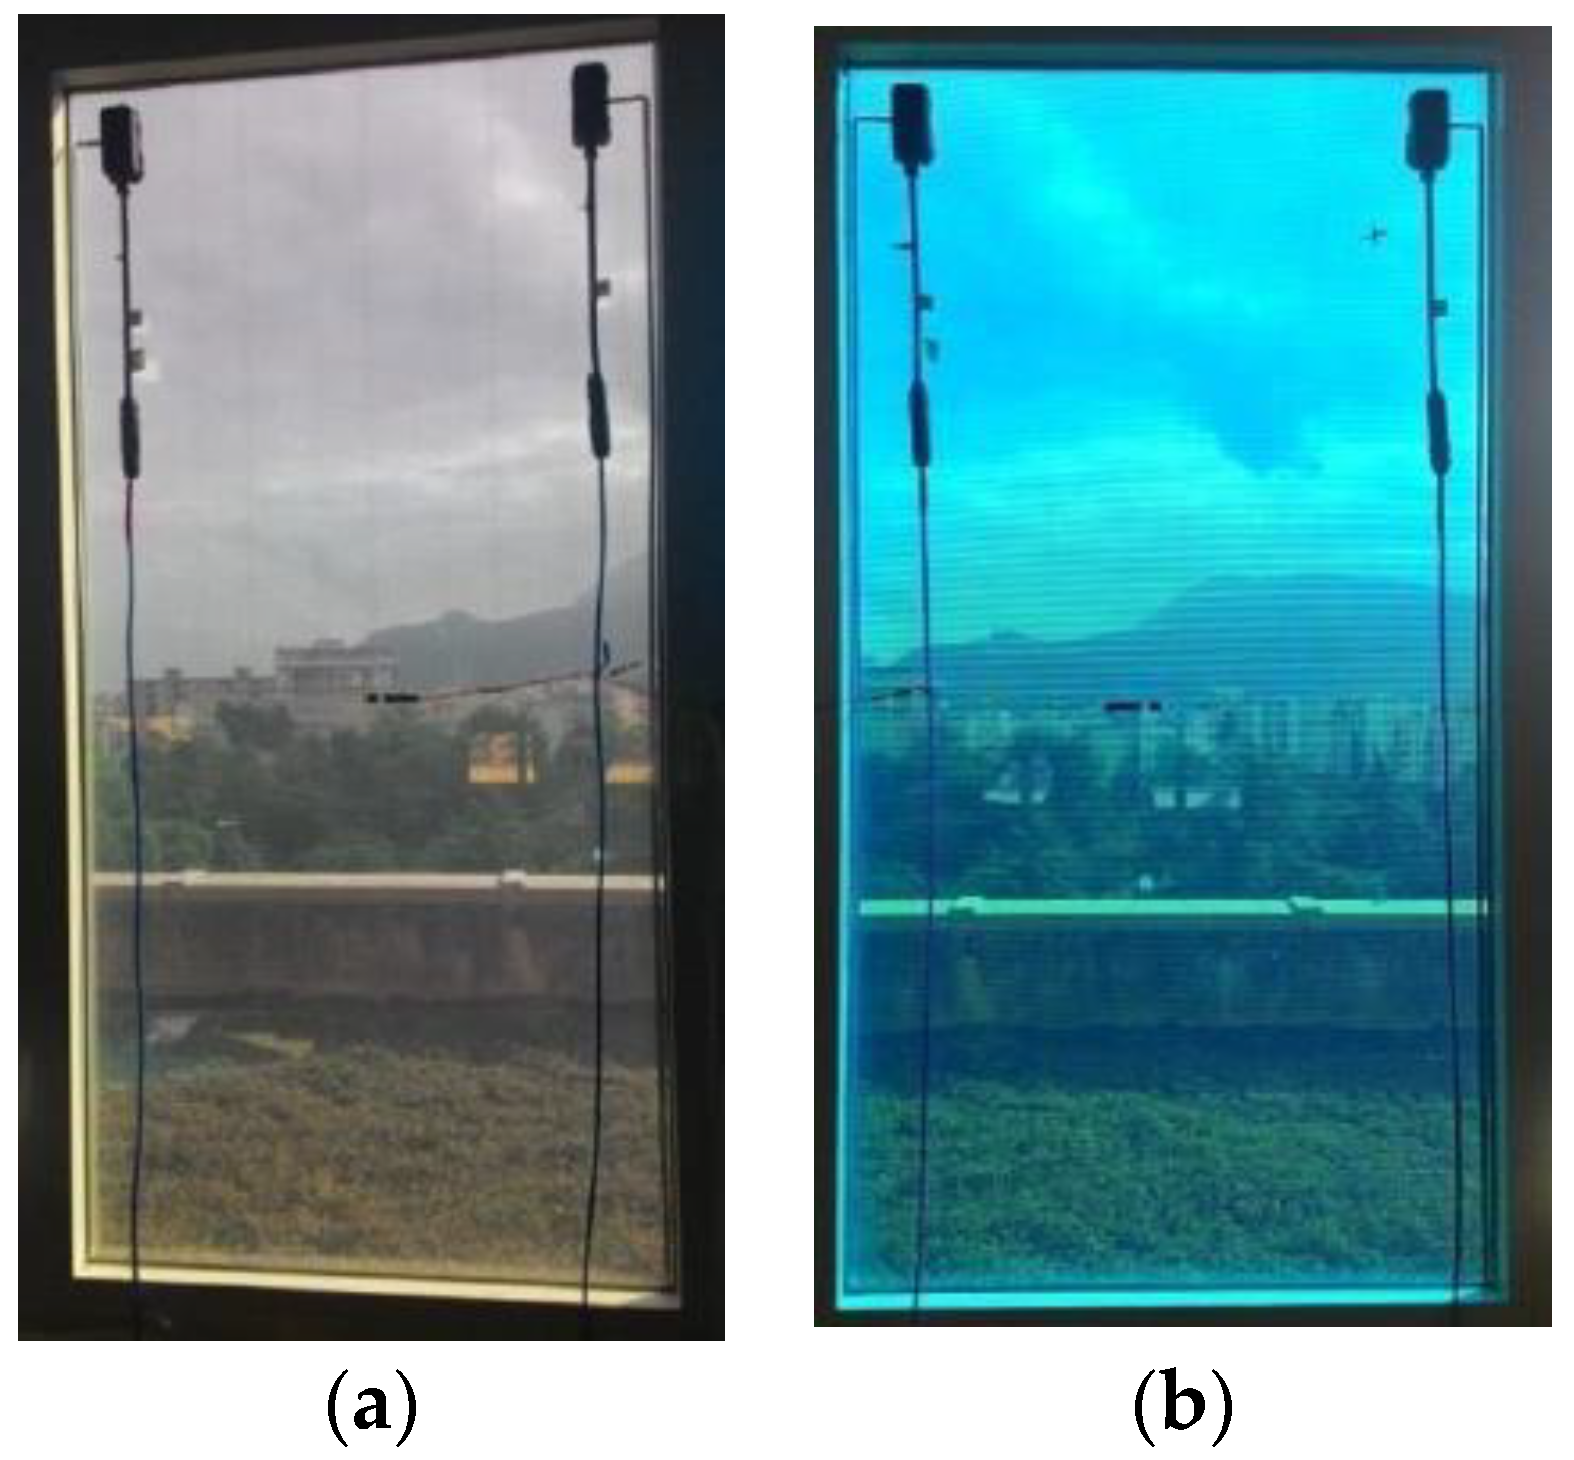
In addition to the DSSC structure, another two PV windows were taken into account (see
Figure 9), composed by thin film amorphous silicon (Onyx Solar panels, Onyx Solar Energy S.L., Ávila, Spain) and with the same transparency degree.
For DDSC and a-Si PV windows, the open circuit voltages are equal respectively to 23 V and 48 V. Although these values are suitable for DC loads, they are still far from DC levels employed in DC/AC converters for domestic use. The three panels have the same size; the DSSC area has a little reduction, due to the used frames. Each vertical structure is subject to shade in the afternoon, receiving only scattered light. The DSSC is mounted inside a vertical glass block for the architectonical integration of the PV structures [
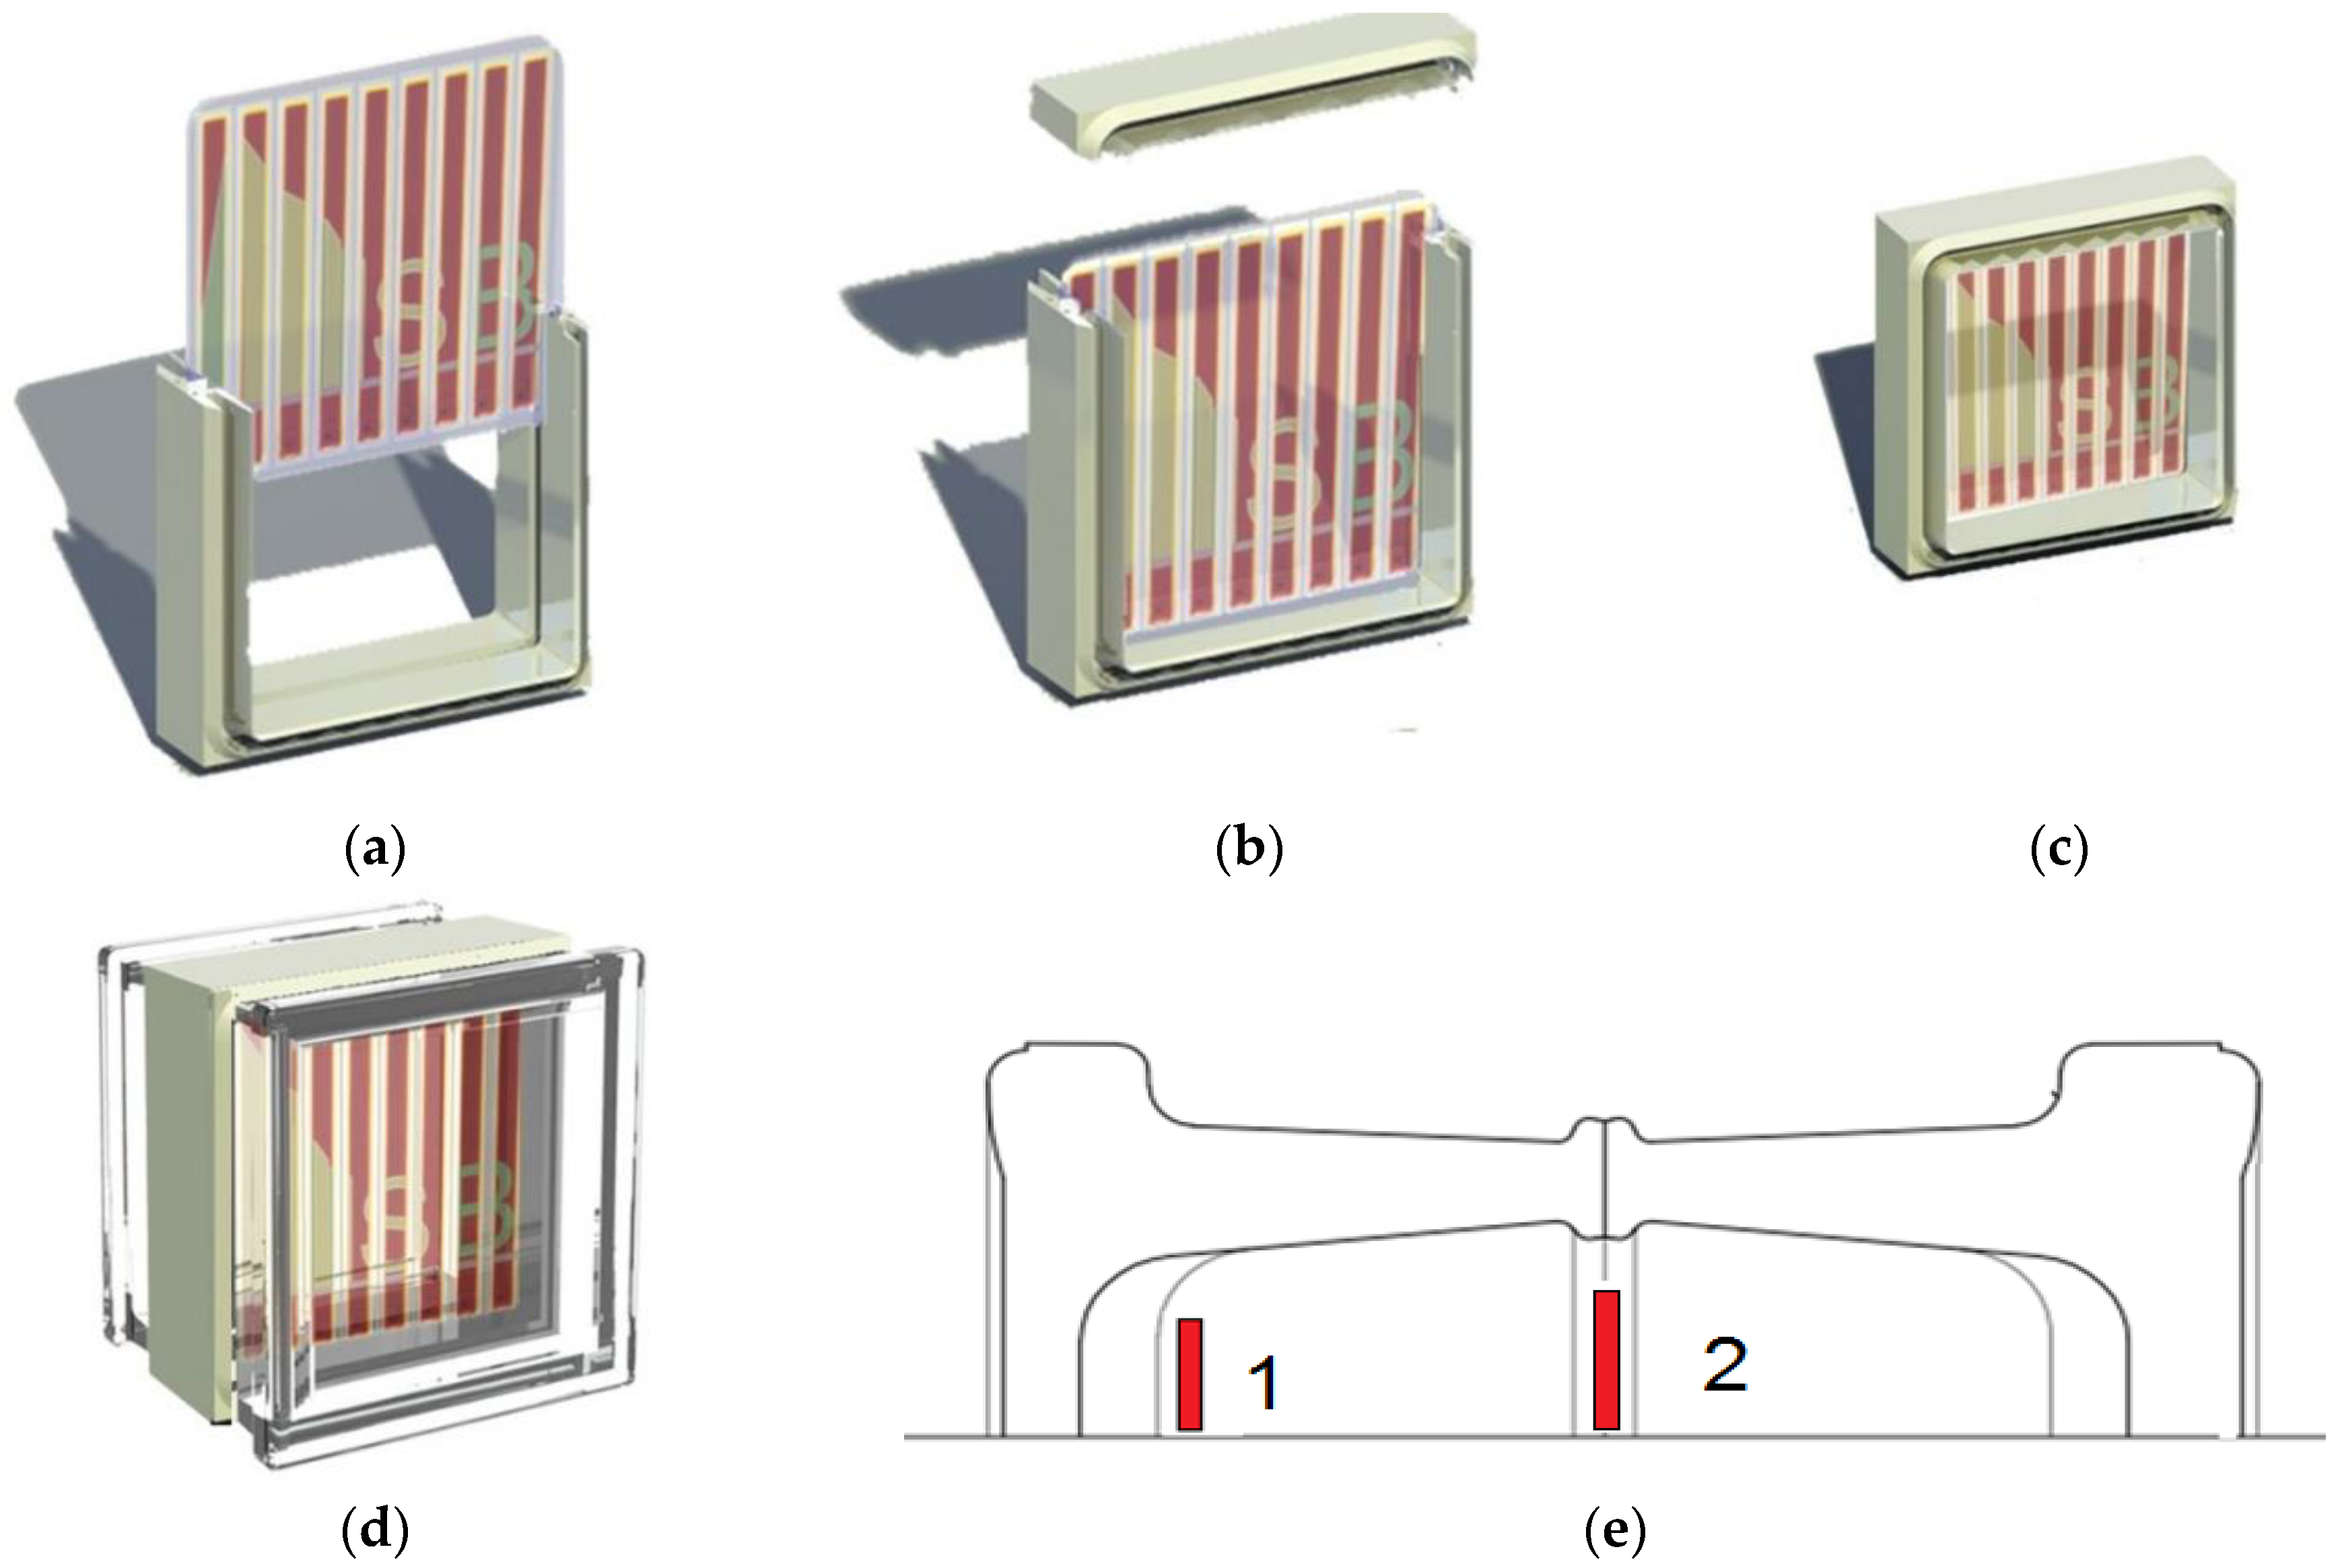
21,
22]. This block, which ensures transparency to radiation, is composed by two shells of transparent glass joined together with an opaque frame, as shown in
Figure 10. Performances of the cells are reduced due to the adoption of such glass block, which decreases the radiation effect on the surface of the DSSC.
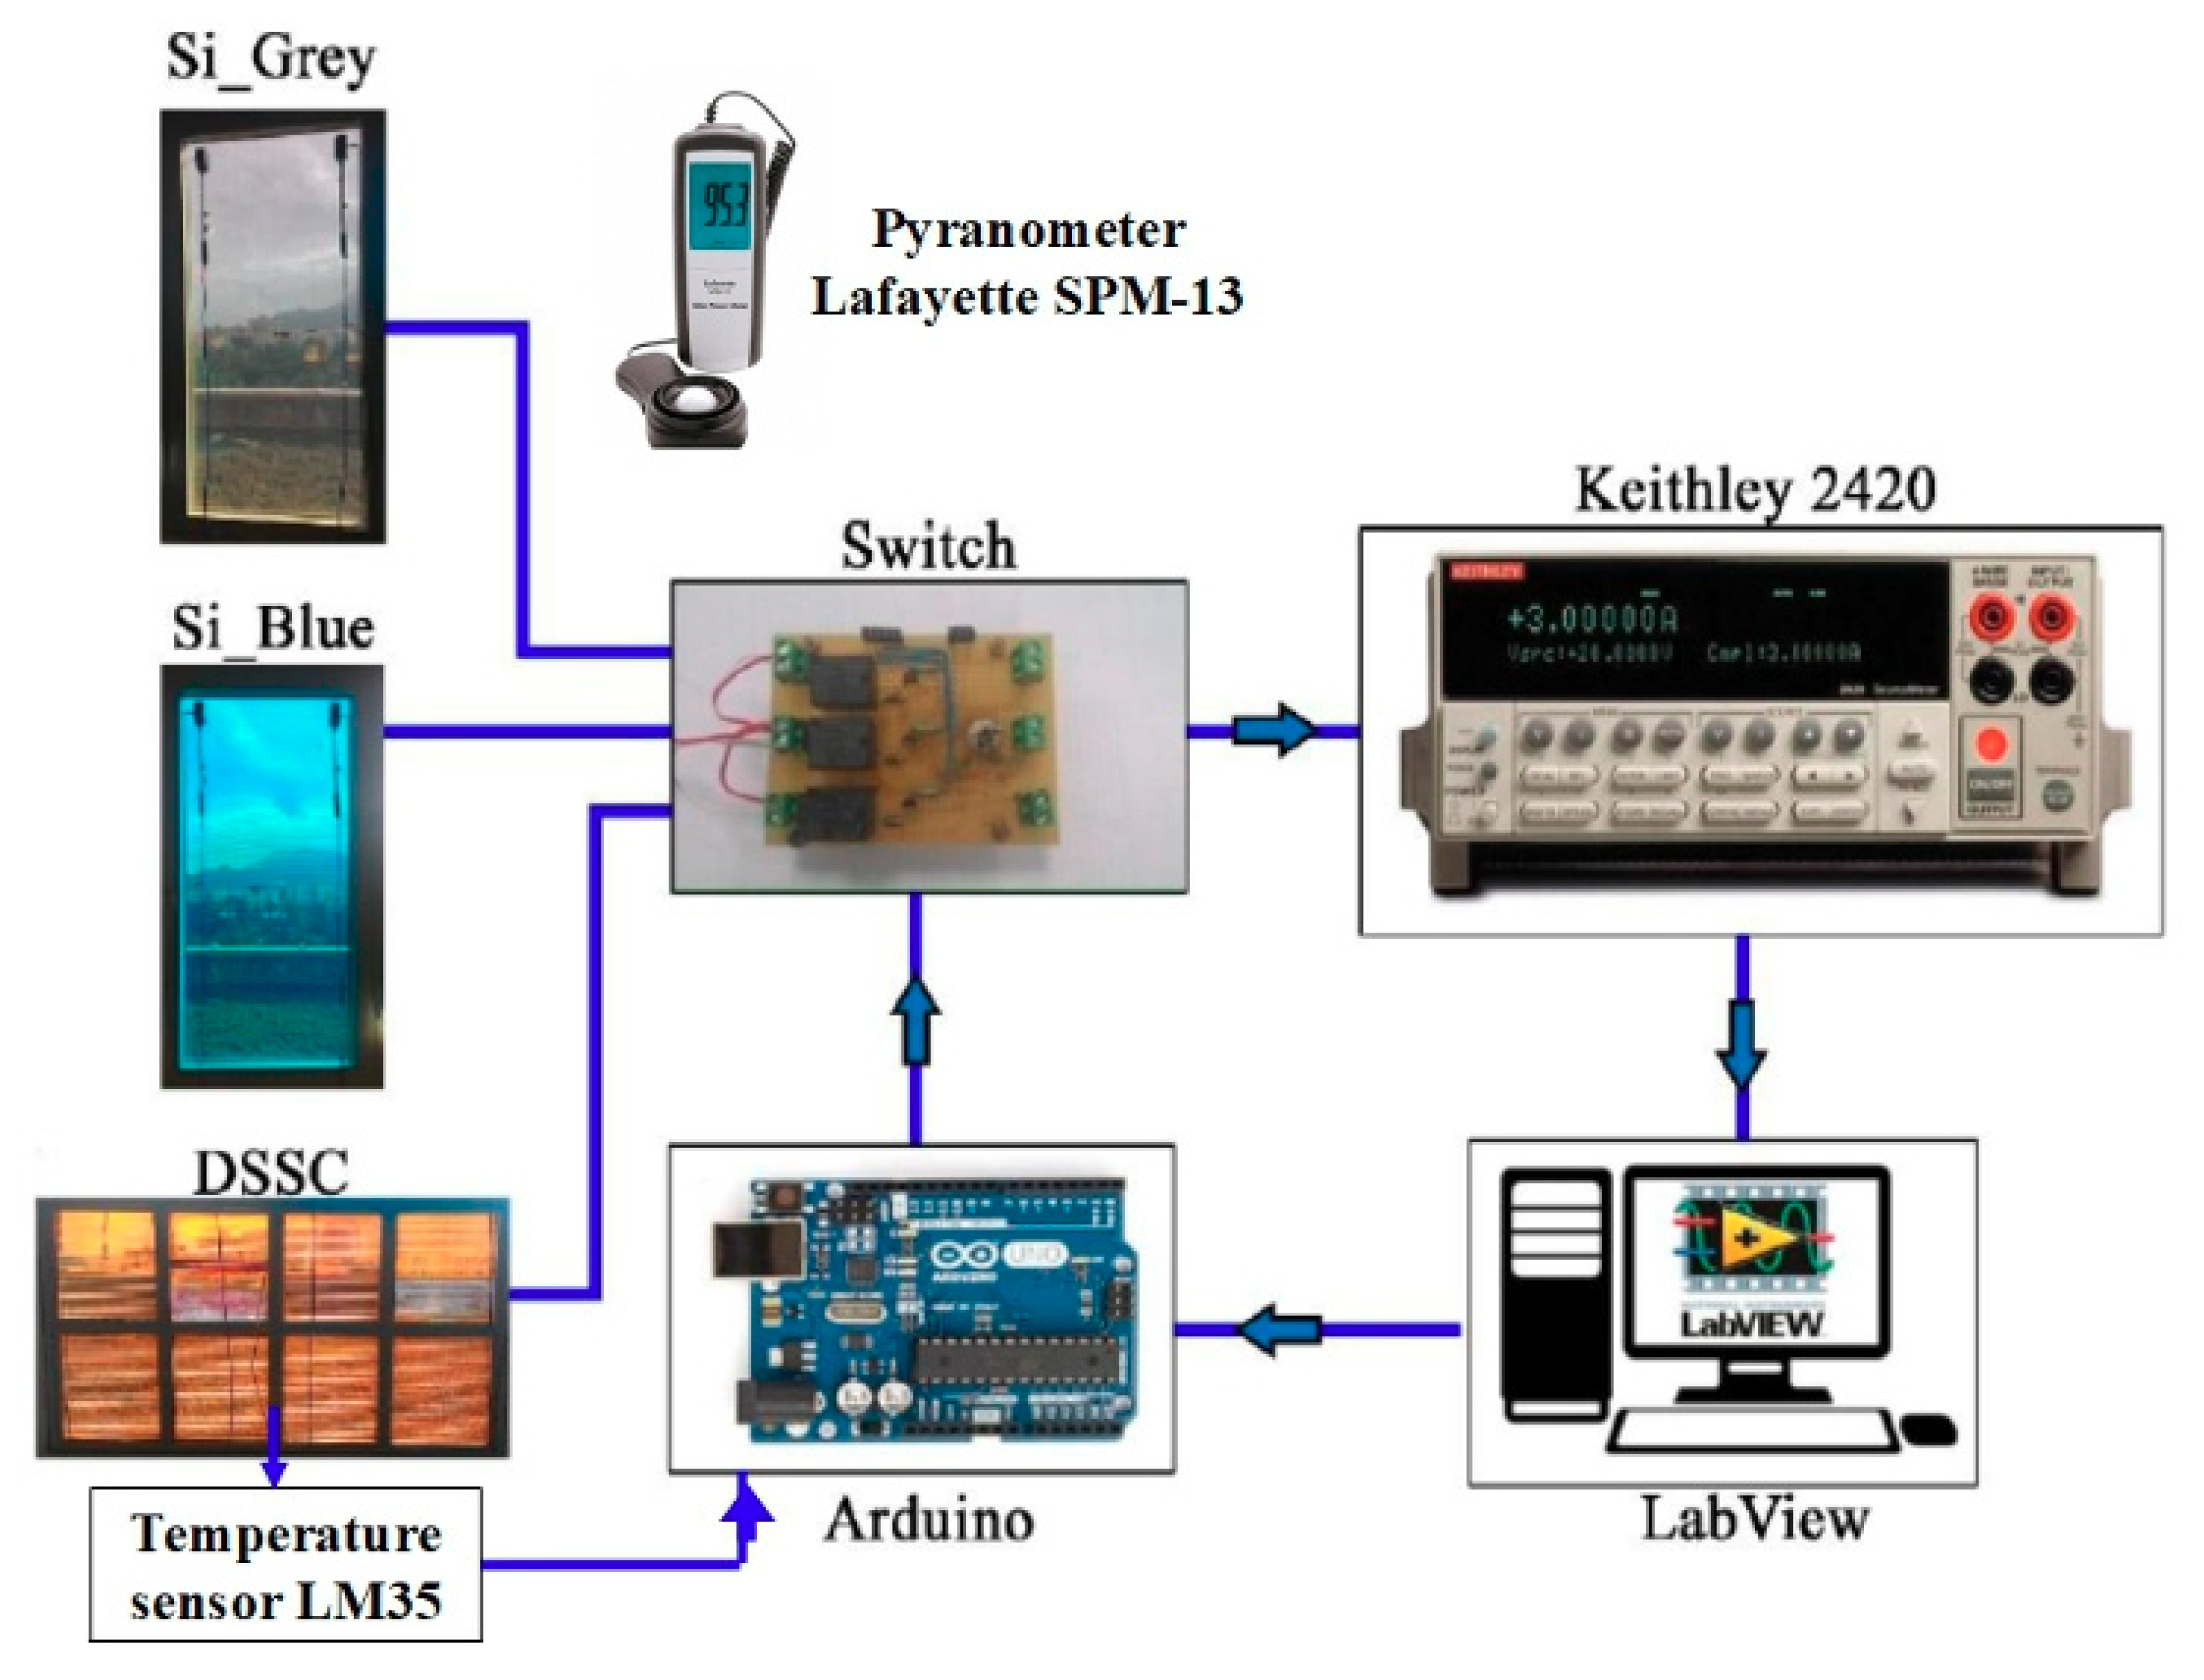
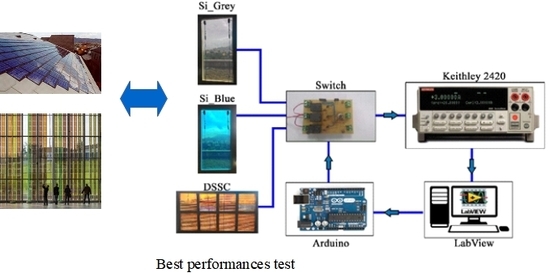
Performances of the proposed and described systems were experimentally evaluated by means of a measurement setup for data acquisition of currents and voltages. The test bench, whose schematic representation is shown in
Figure 11, is mainly composed by: a Source-Meter (Keithley 2420, Keithley-Tektronix company, Solon, OH, USA) featuring low noise and high precision, so that a stable DC voltage can be set (12 mV source voltage accuracy, 1.5 mA measurement current accuracy); LabView
® interface, to which the Source-Meter is directly connected; a homemade switch, in order to properly select which one among the three different PV vertical structures has to provide power; a pyranometer for irradiance measuring (Lafayette SPM-13: irradiance measure range: 0–1999 W/m
2, 1 W/m
2 precision; Lafayette Electronic Supply, Inc., Lafayette, IN, USA); temperature sensors (by Texas Instruments, Boulevard, Dallas, TX, USA) LM35 placed on the back of the panels (Precision Centigrade Temperature Sensors with 0.5 °C temperature accuracy); an Arduino
® UNO microcontroller (Arduino S.r.l., production in Strambino, TO, Italy), which is mainly used to set measurements timing during the day and adequately control the on/off commands to the switch. The microcontroller is also connected to the Labview
® interface.
For each prototype, the open-circuit voltage is measured by means of the source meter and all the data are processed by the Labview® interface, which controls a cycle of measurements that starts from the open circuit voltage, decreased step-by-step until the minimum voltage level. For each module a set of measurements based on 100 acquisitions is detected, so that the voltage range is divided into 100 equal parts. The settlement of the modules is helped by delaying the acquisition system. The employment of this automated measurement system for PV modules characterization was carried out over several months. The vertical structures have been exposed towards east, so that the highest production of power is reached during the first hours of the day. In addition to electrical parameters, other significant ones, such as irradiation, glass surface and room temperatures, were detected by means of the Arduino board as well.
4. Experimental Results
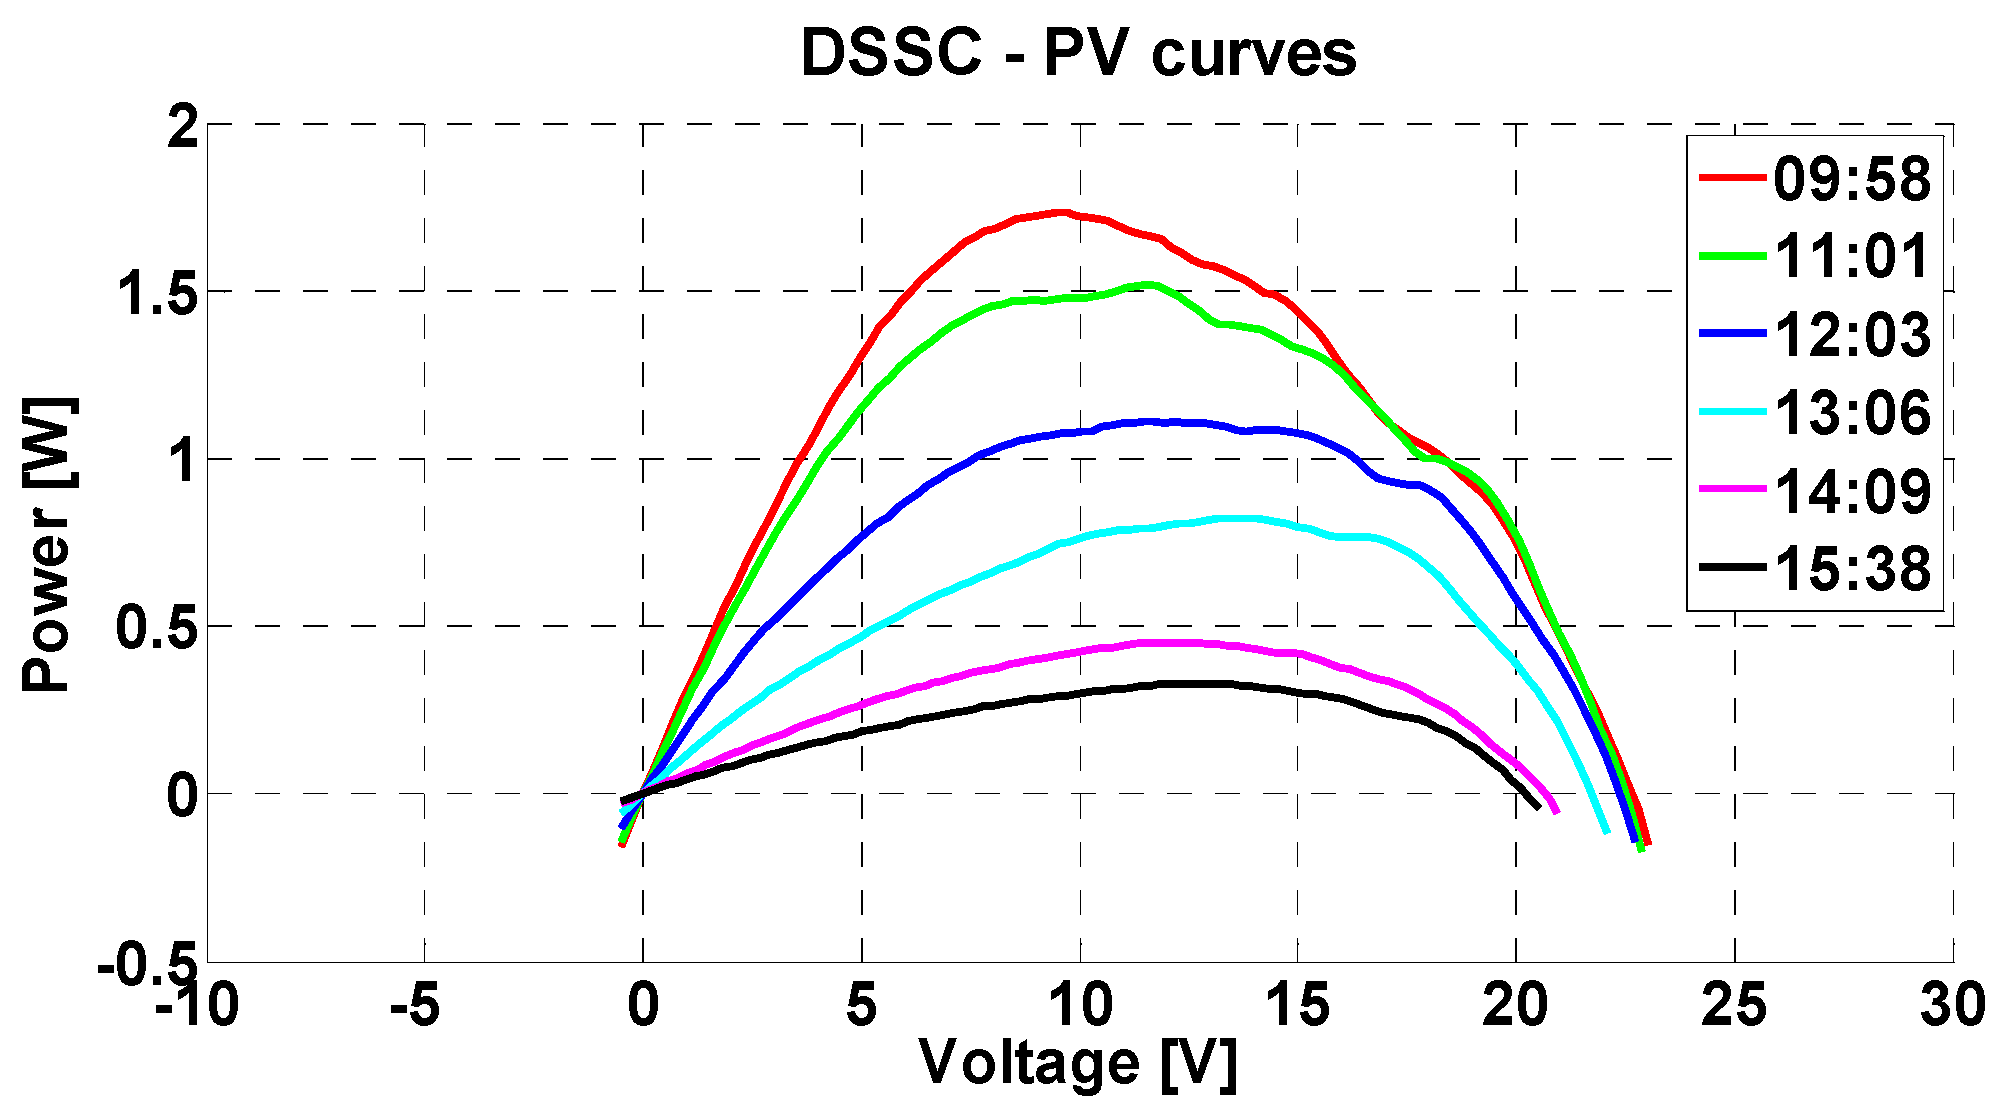
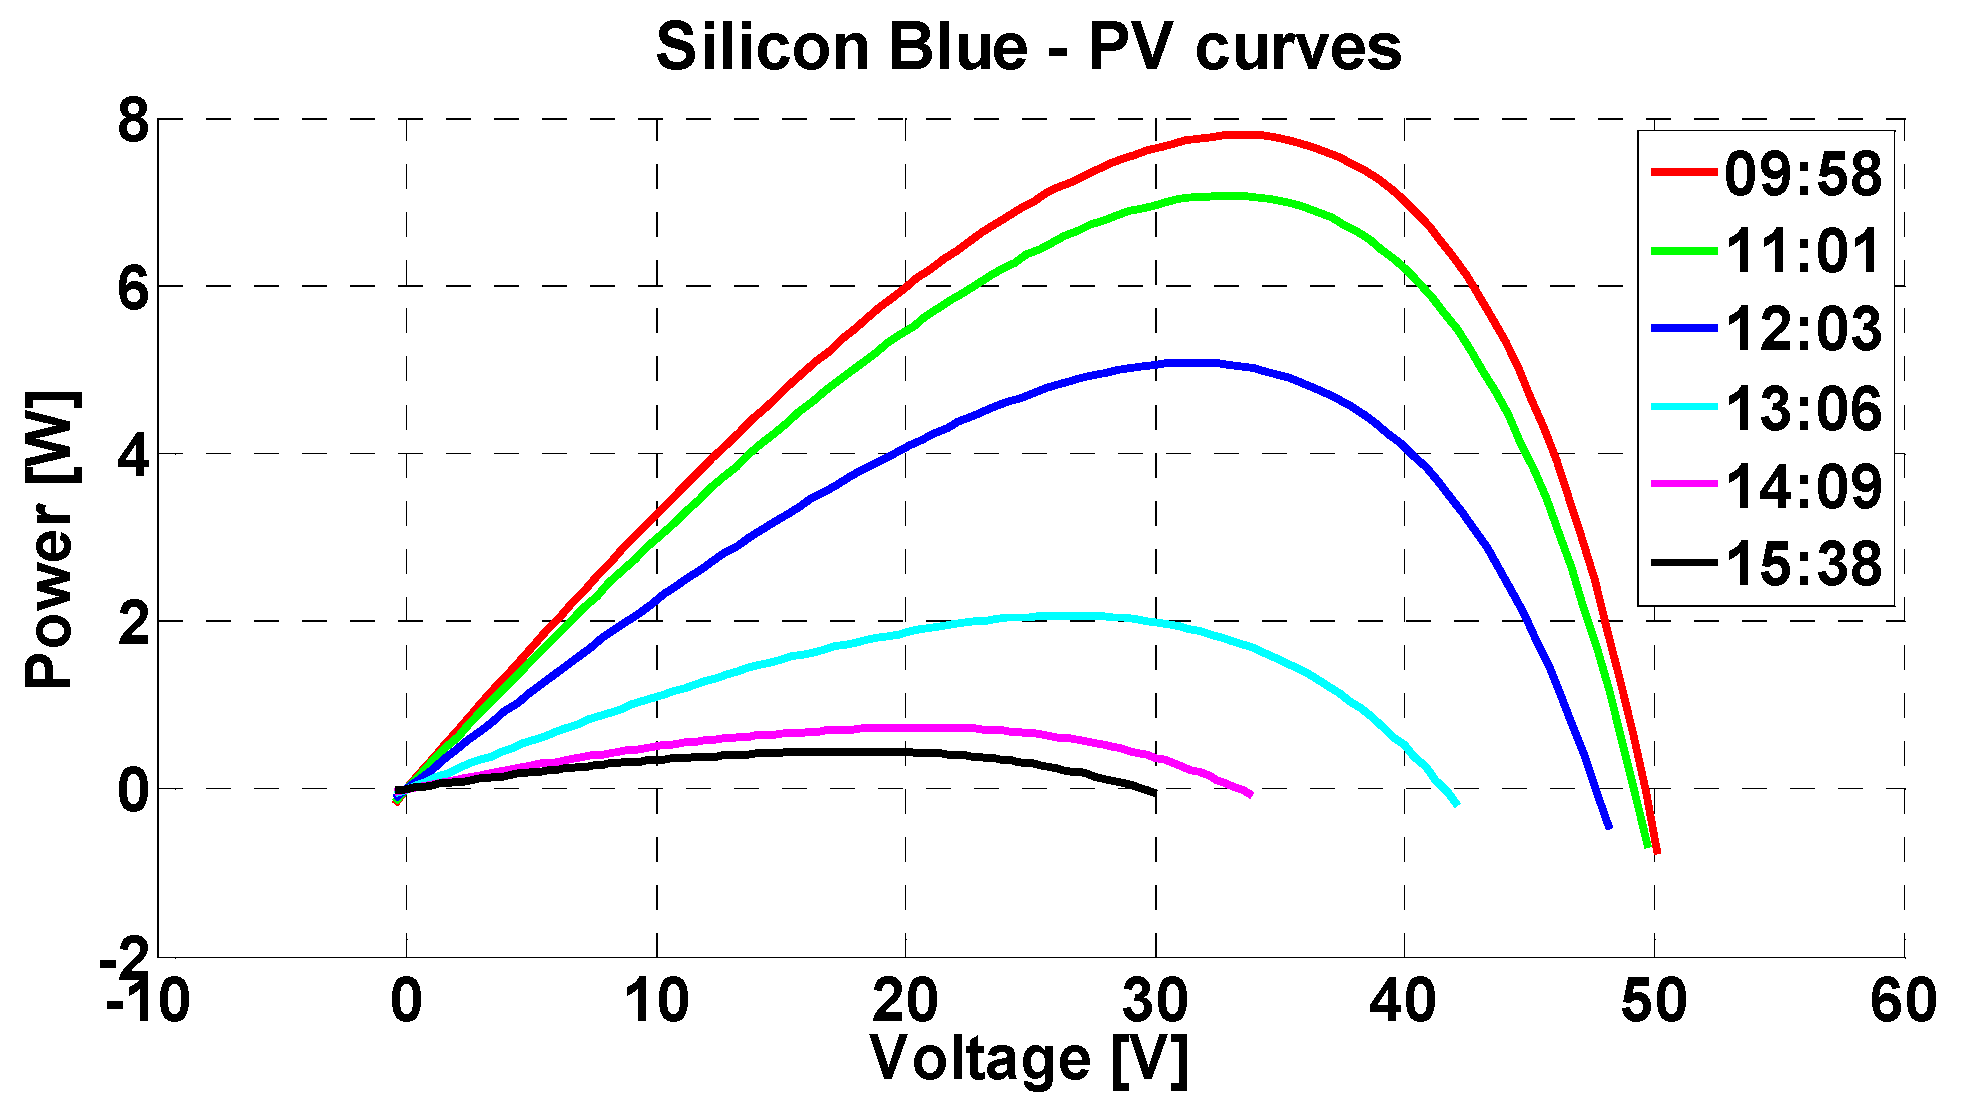
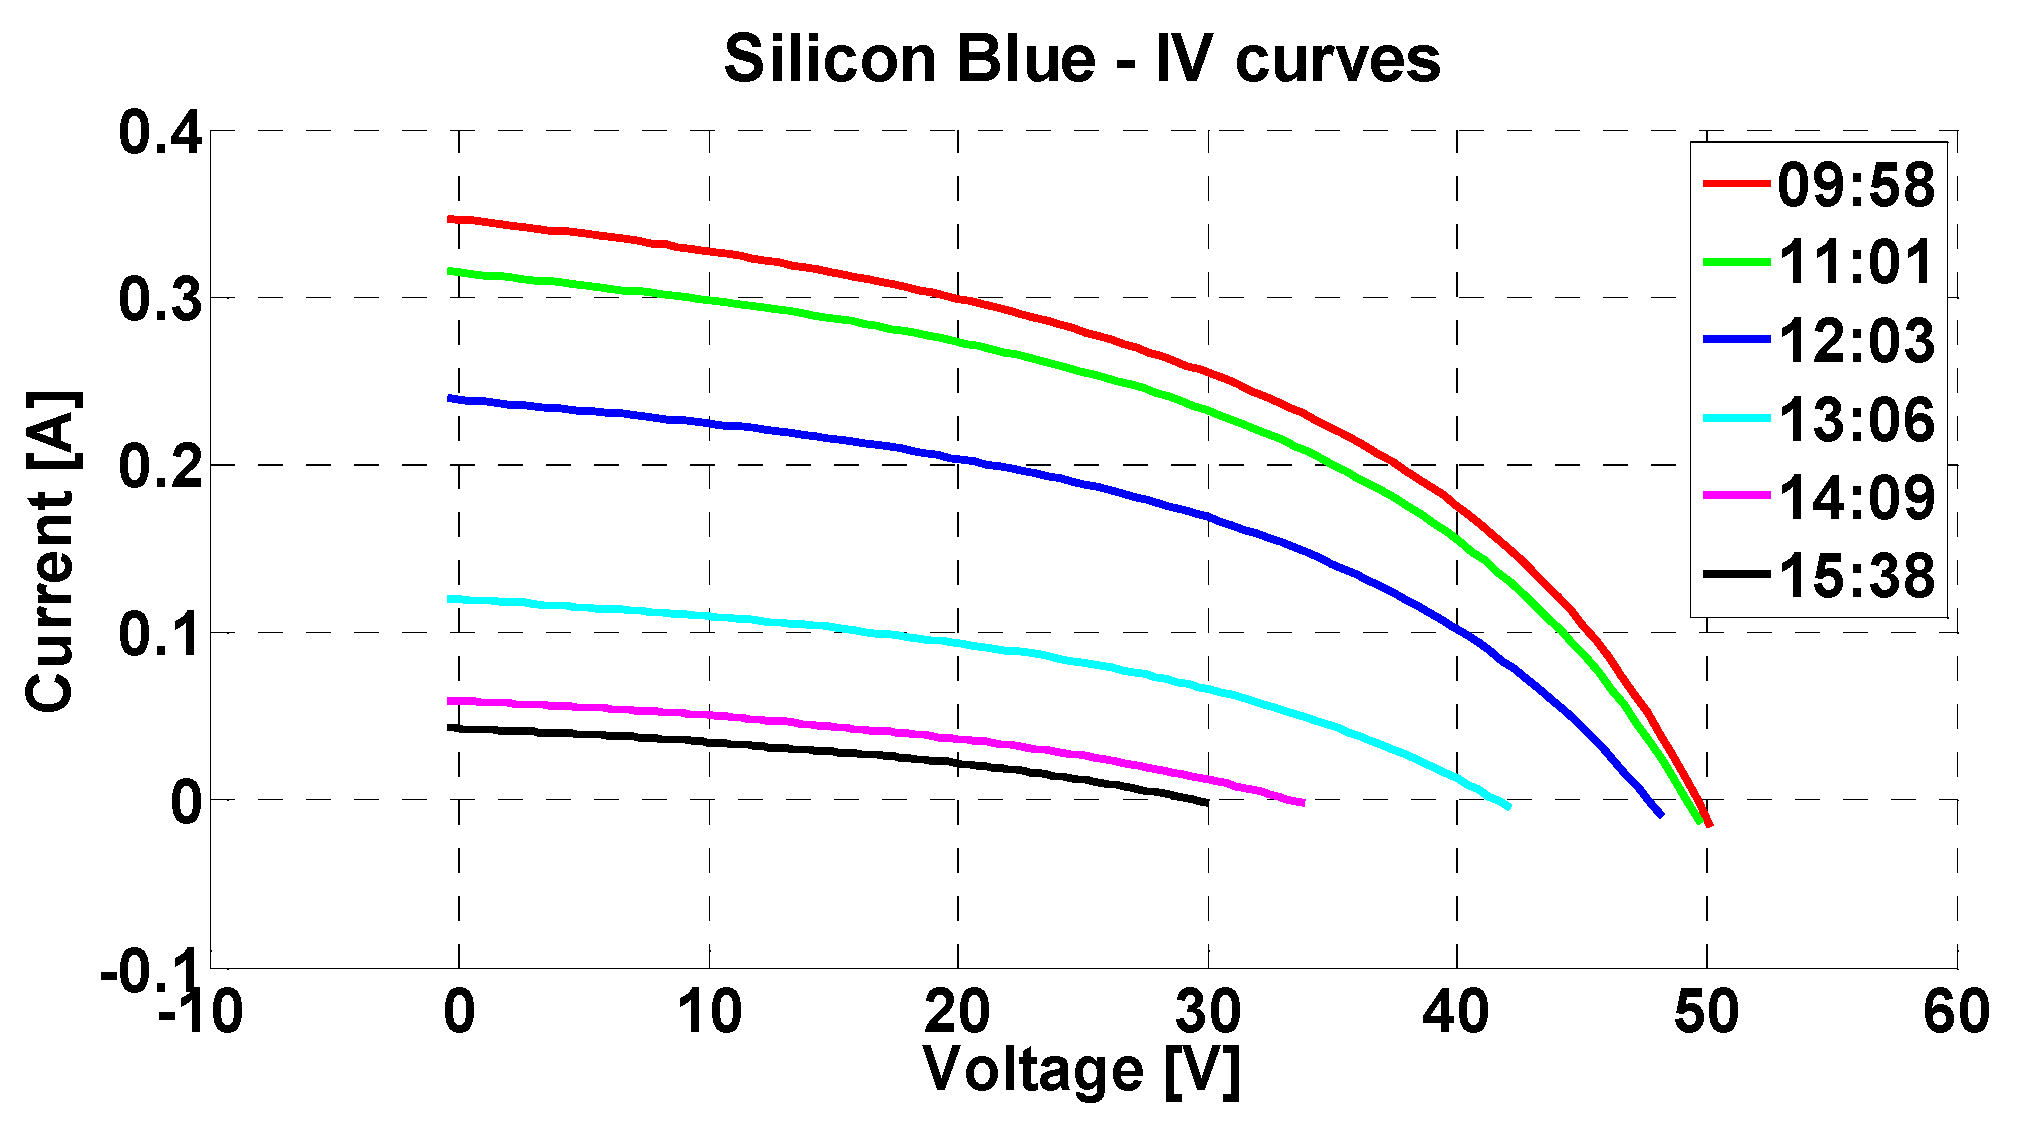
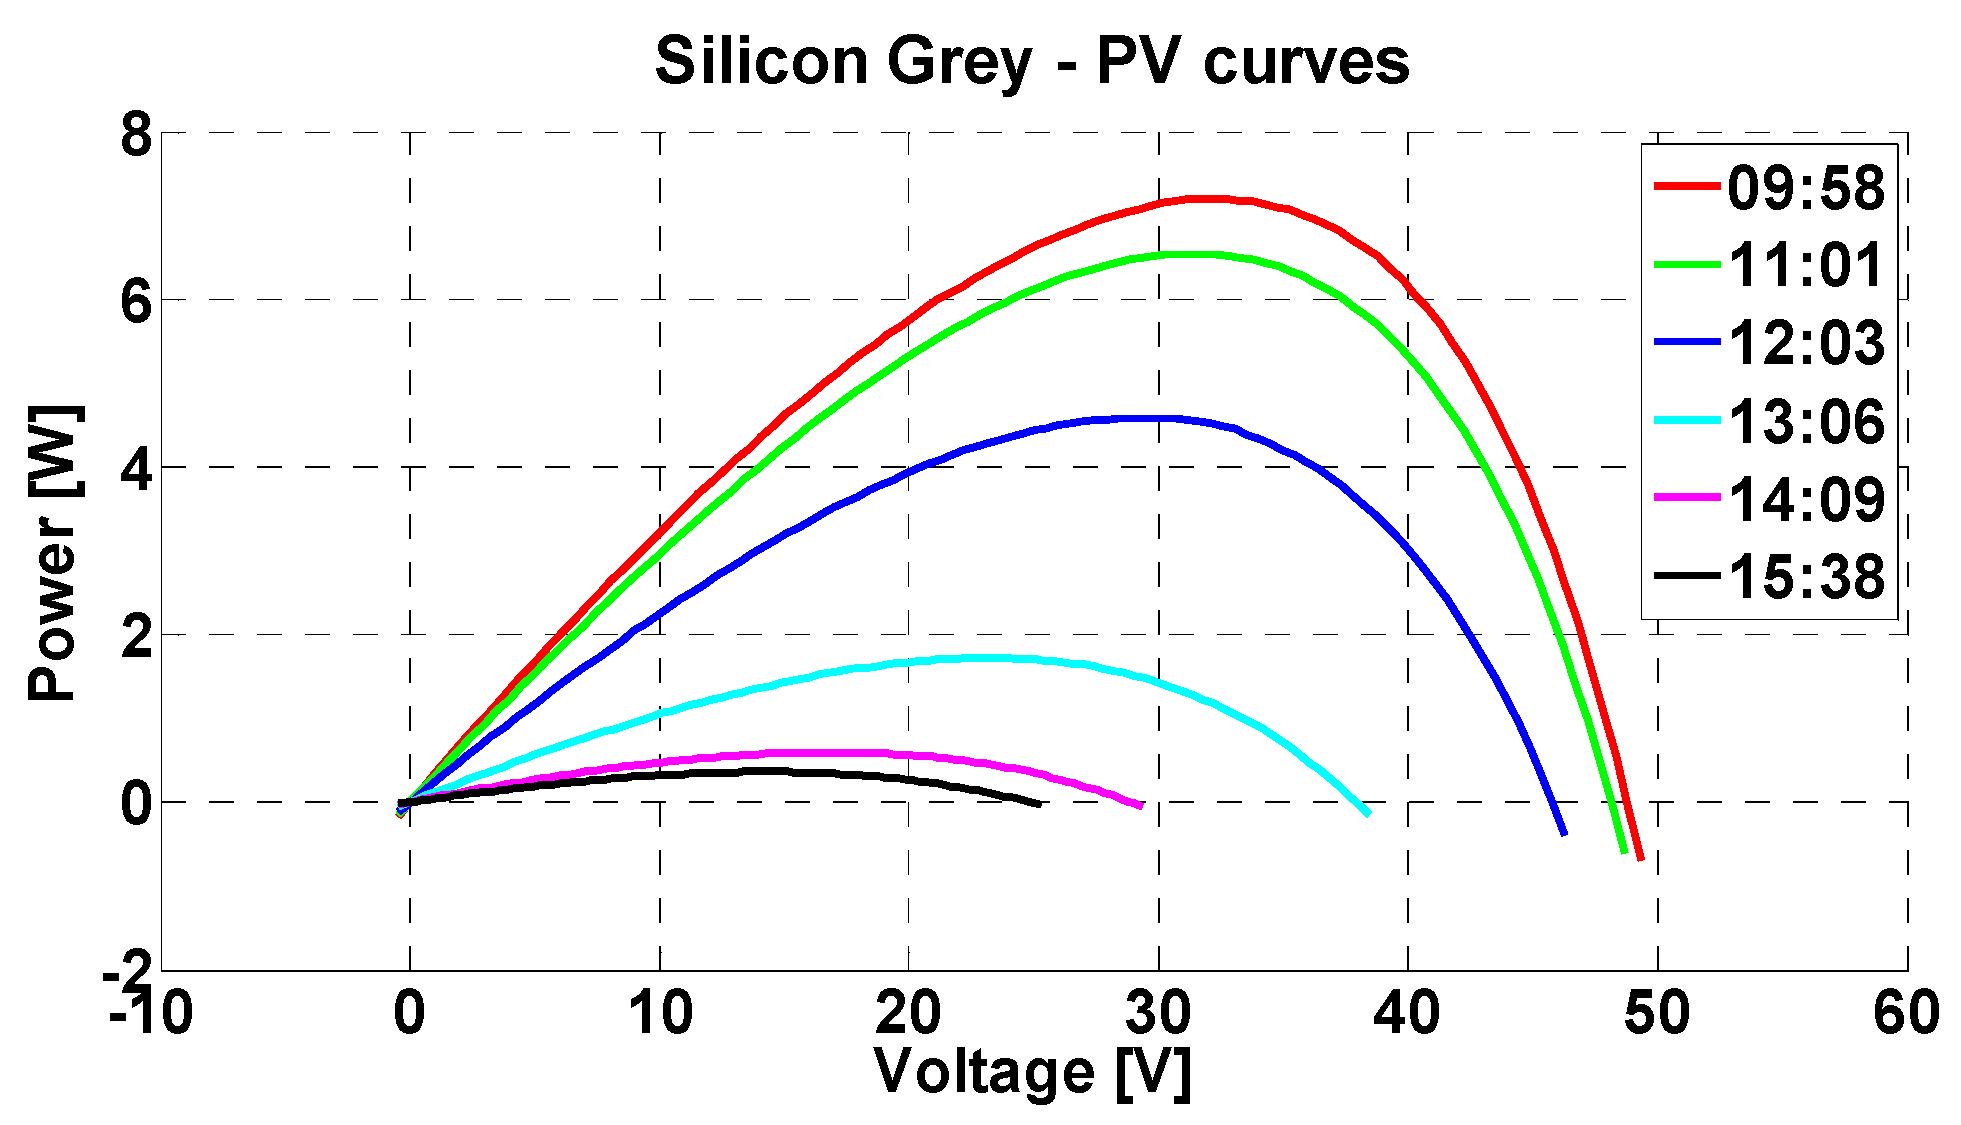
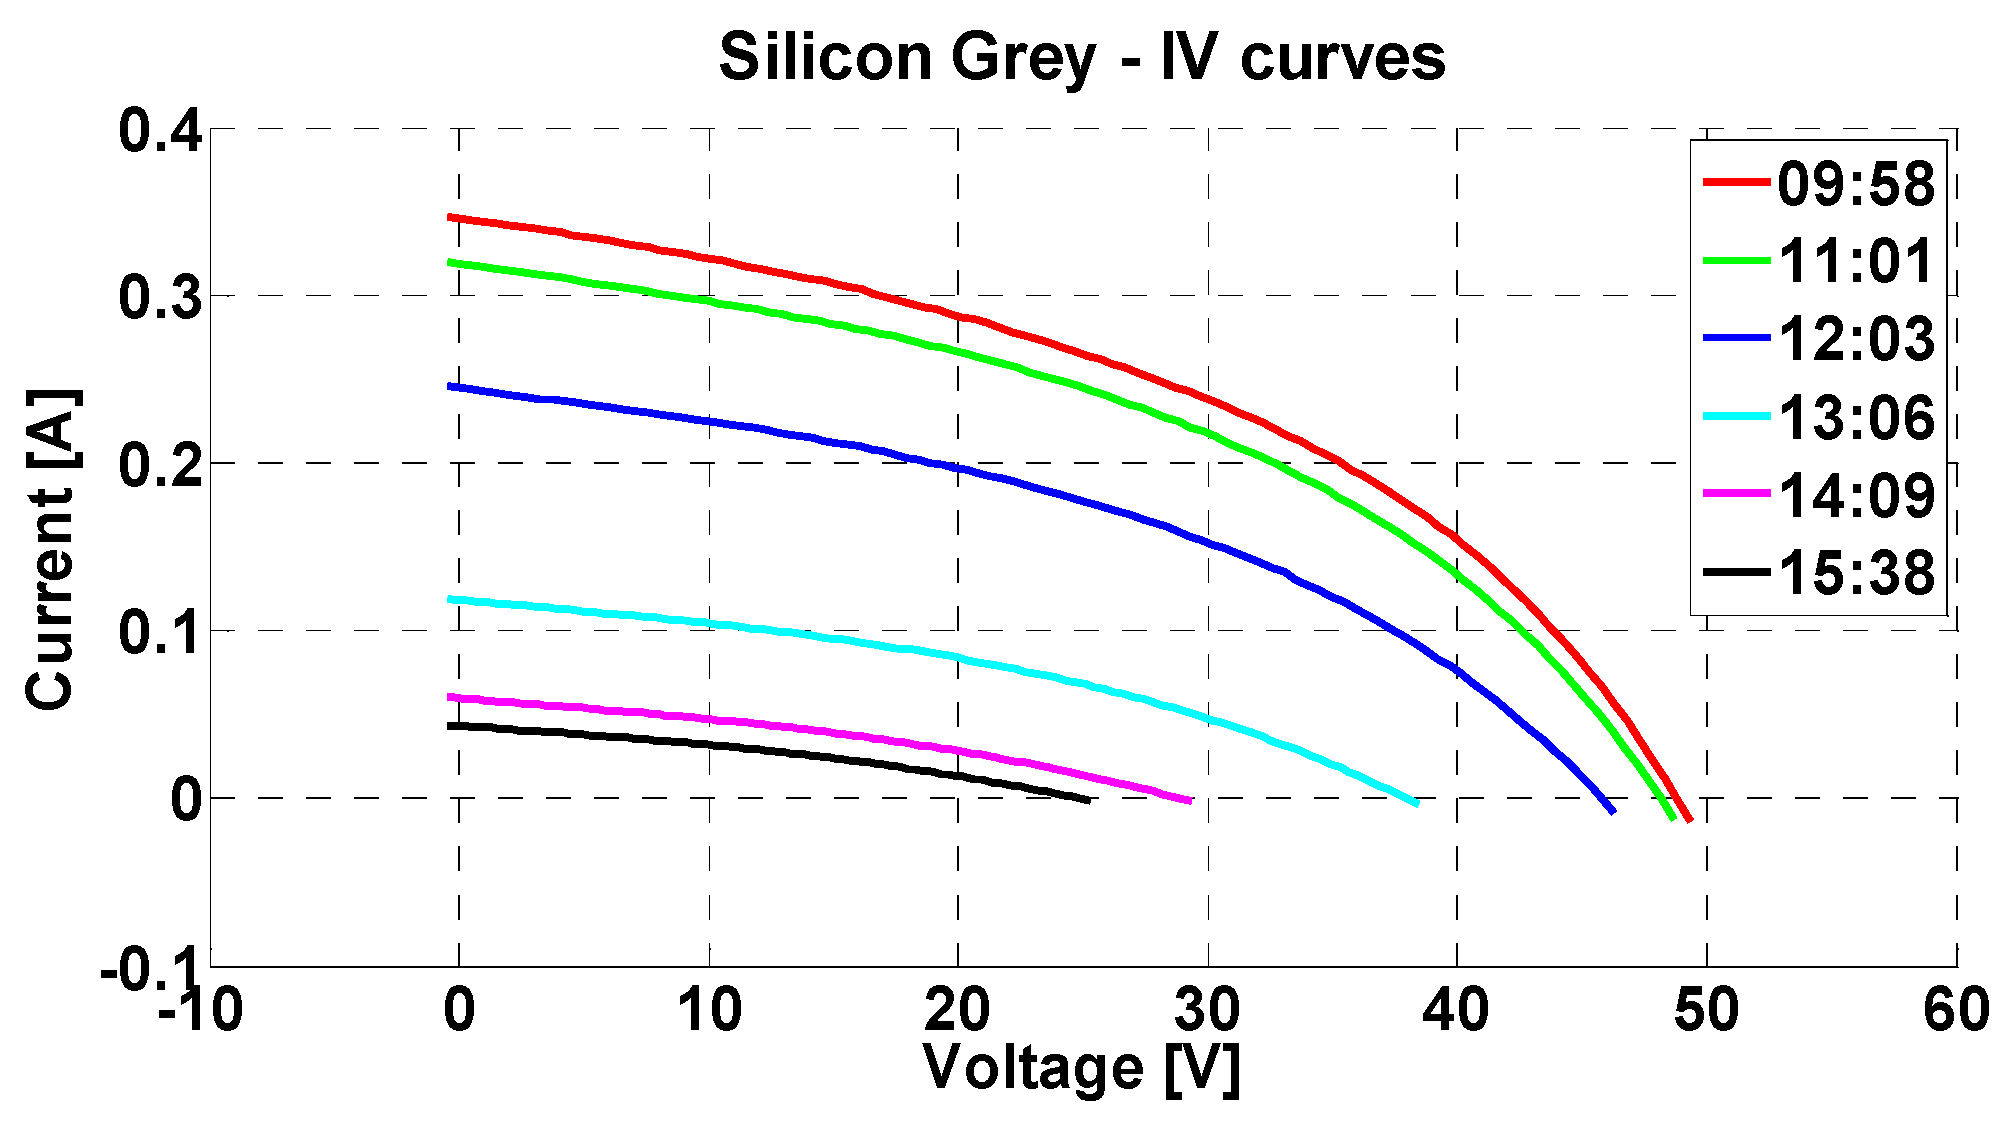
By processing the experimental data obtained from the previously reported tests, I-V and P-V characteristics were determined for each proposed technology and plotted in
Figure 15,
Figure 16,
Figure 17,
Figure 18,
Figure 19 and
Figure 20. The measured data refer to different days and different irradiance levels.
To gain high power output and trustworthy current-voltage curves, the measurements concern a sunny day of July with a remarkable sun radiation (1700 W/m2 on soil surface). The values of 715 W/m2 and 68 W/m2 refer to the starting and final detected values of vertical irradiance, respectively. Windows belong to the Loox laboratory of University of Palermo.
The reported results show that the power produced by the DSSC module is lower than those produced by the silicon cells, which have also a higher open circuit voltage. More in particular, for the highest irradiance values the a-Si technology shows an about 50 V open circuit voltage, which is a proper value for DC power supply with respect to the 23 V presented by the DSSC generation system, which will need additional boost converters.
Comparison of the Results
Several experimental tests were carried out in order to provide a comparison among the performances achieved by the three systems in terms of produced power, efficiency and fill factor. By measuring both voltages and currents for each technology, the produced power was computed. Consequentially, the daily power profile was determined, evaluating the daily value of the maximum produced power.
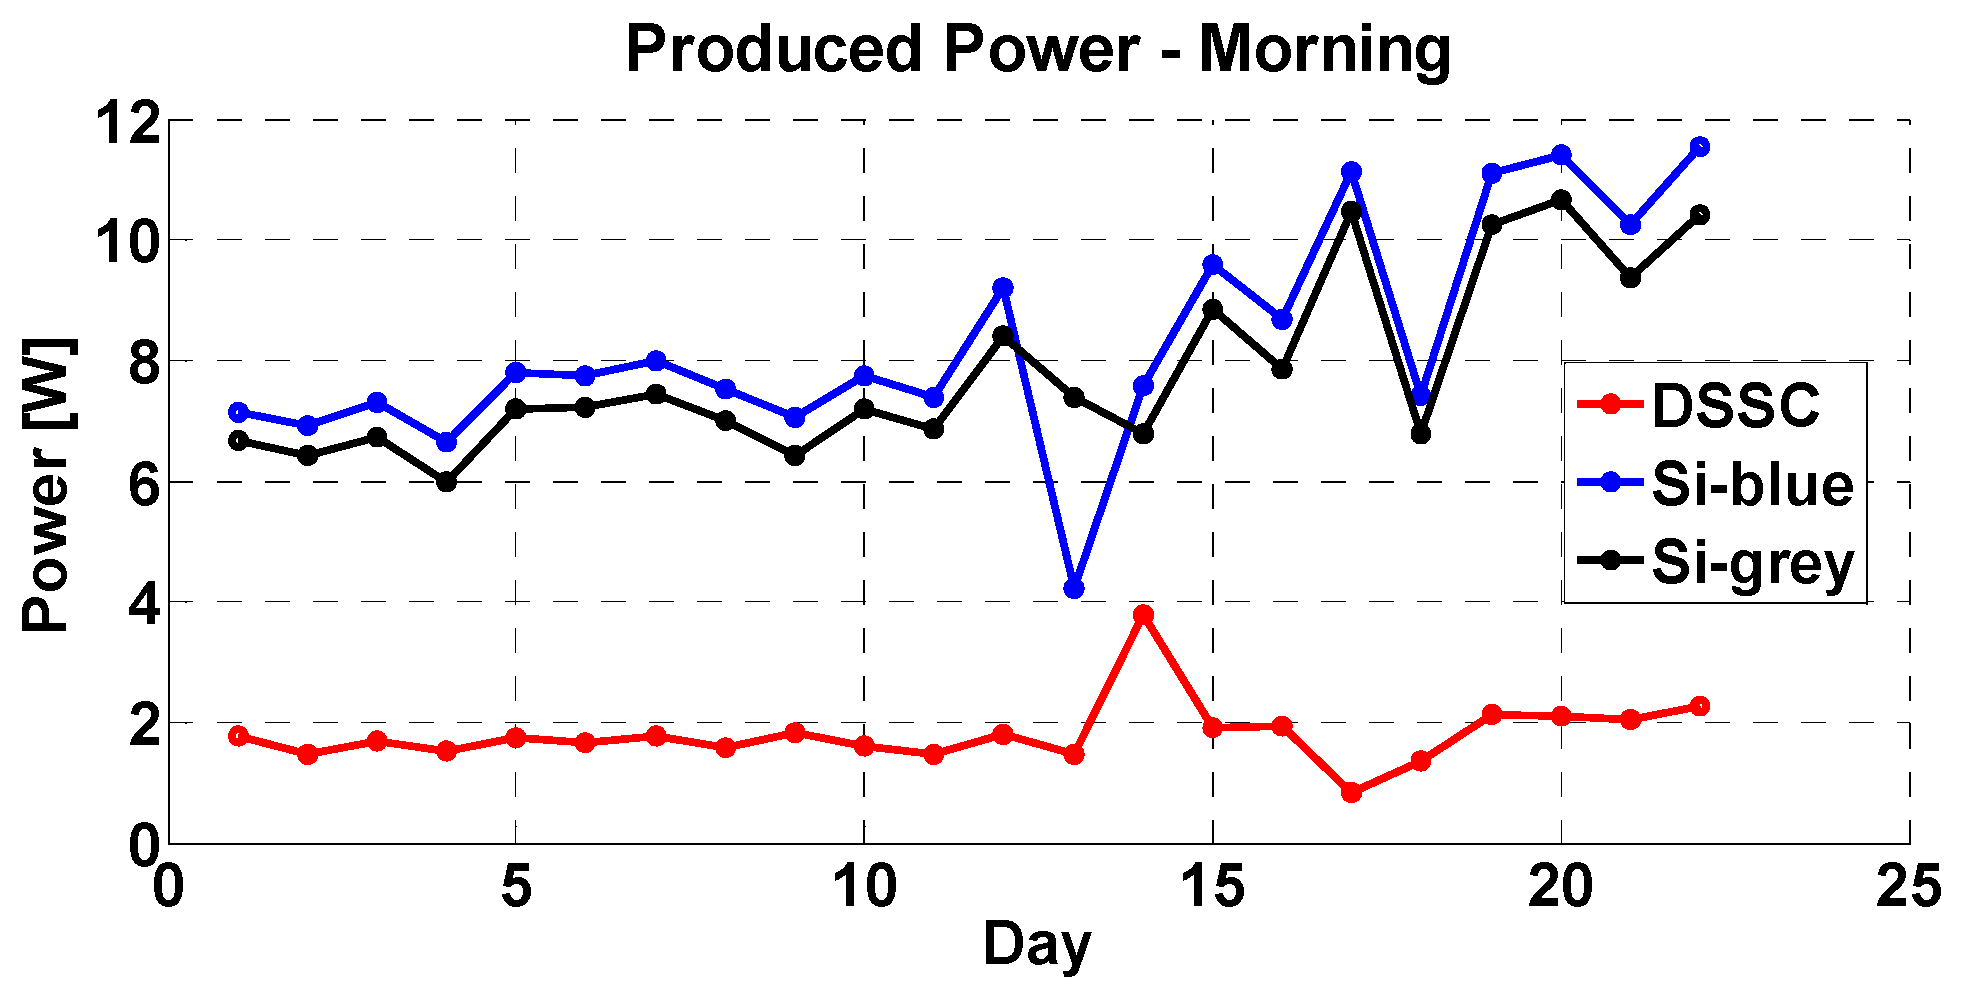
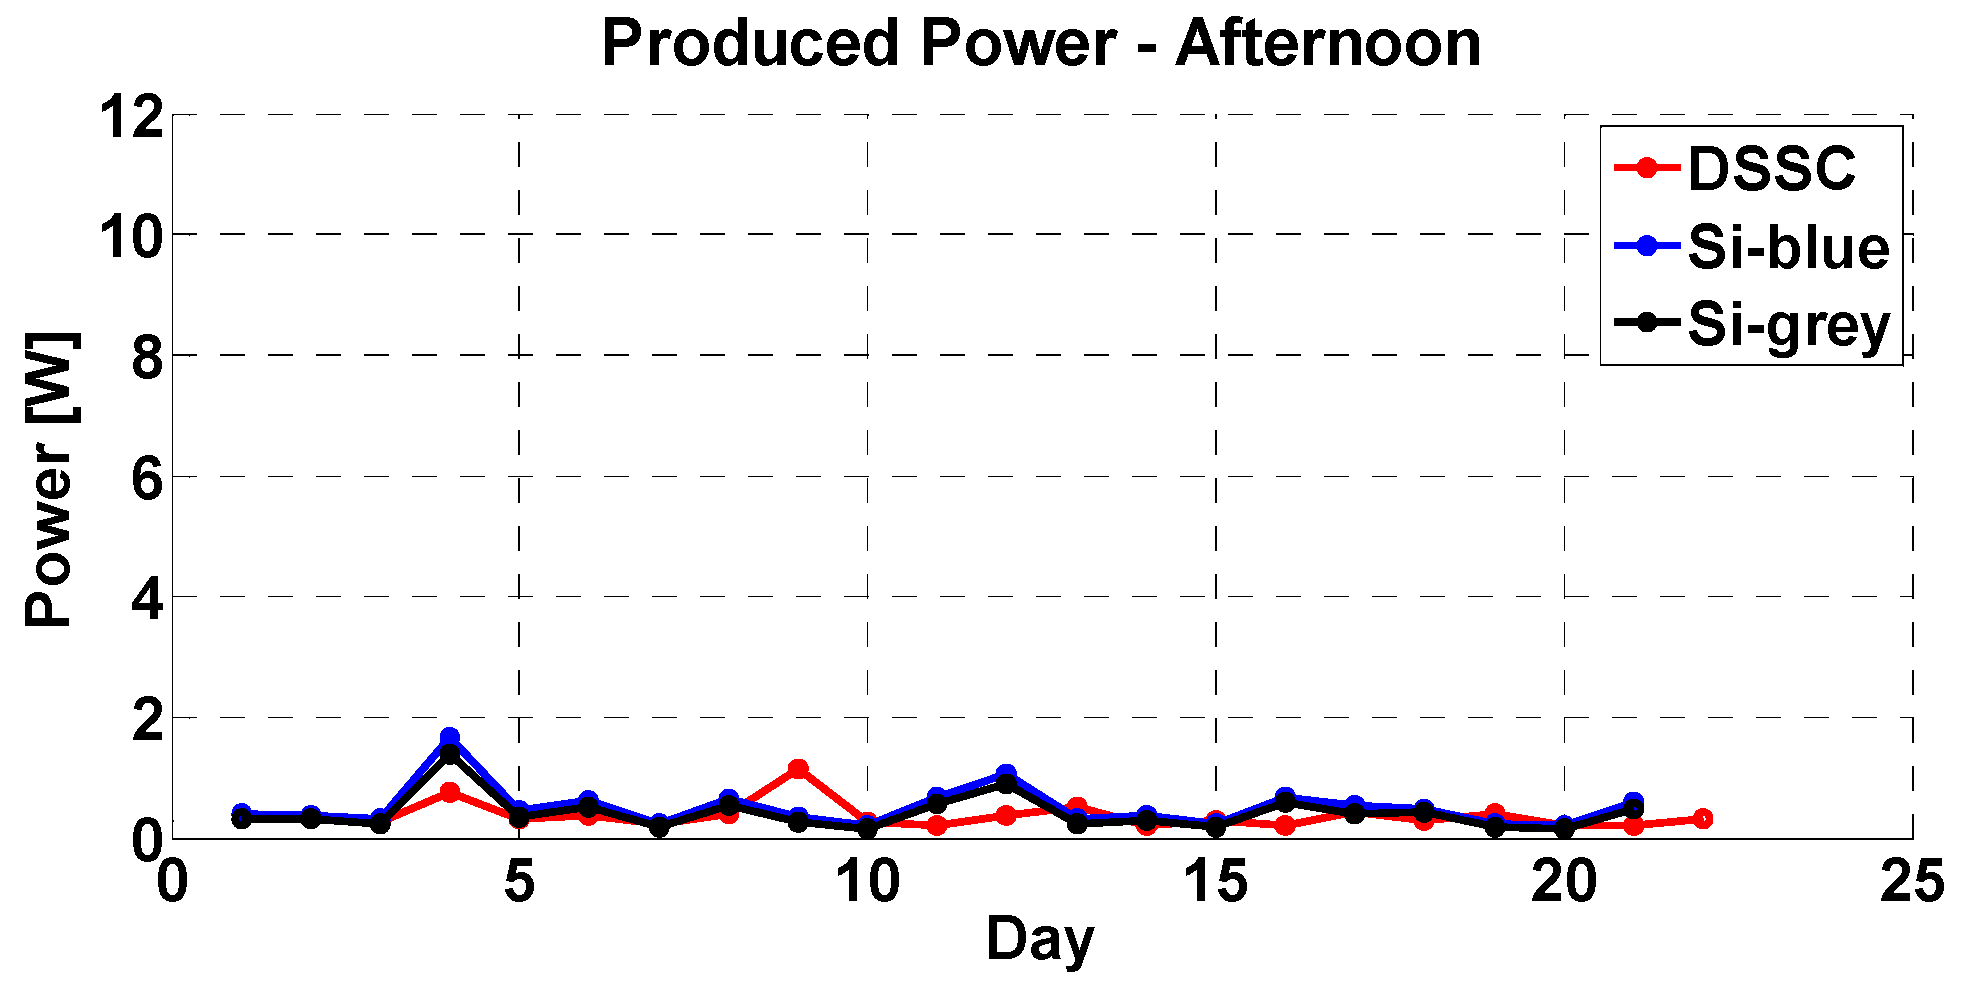
The trends of the produced power during both morning and afternoon hours for each of the proposed systems are plotted in
Figure 21 and
Figure 22, respectively. It can be noticed that the DSSC power is lower than the other 2 technologies during the morning. However, the values are comparable during the afternoon hours.
It is well known that the Fill Factor (FF) characterizes the cell in terms of quality, by comparing the maximum obtainable power with the theoretical one:
where V
oc is the open-circuit voltage and I
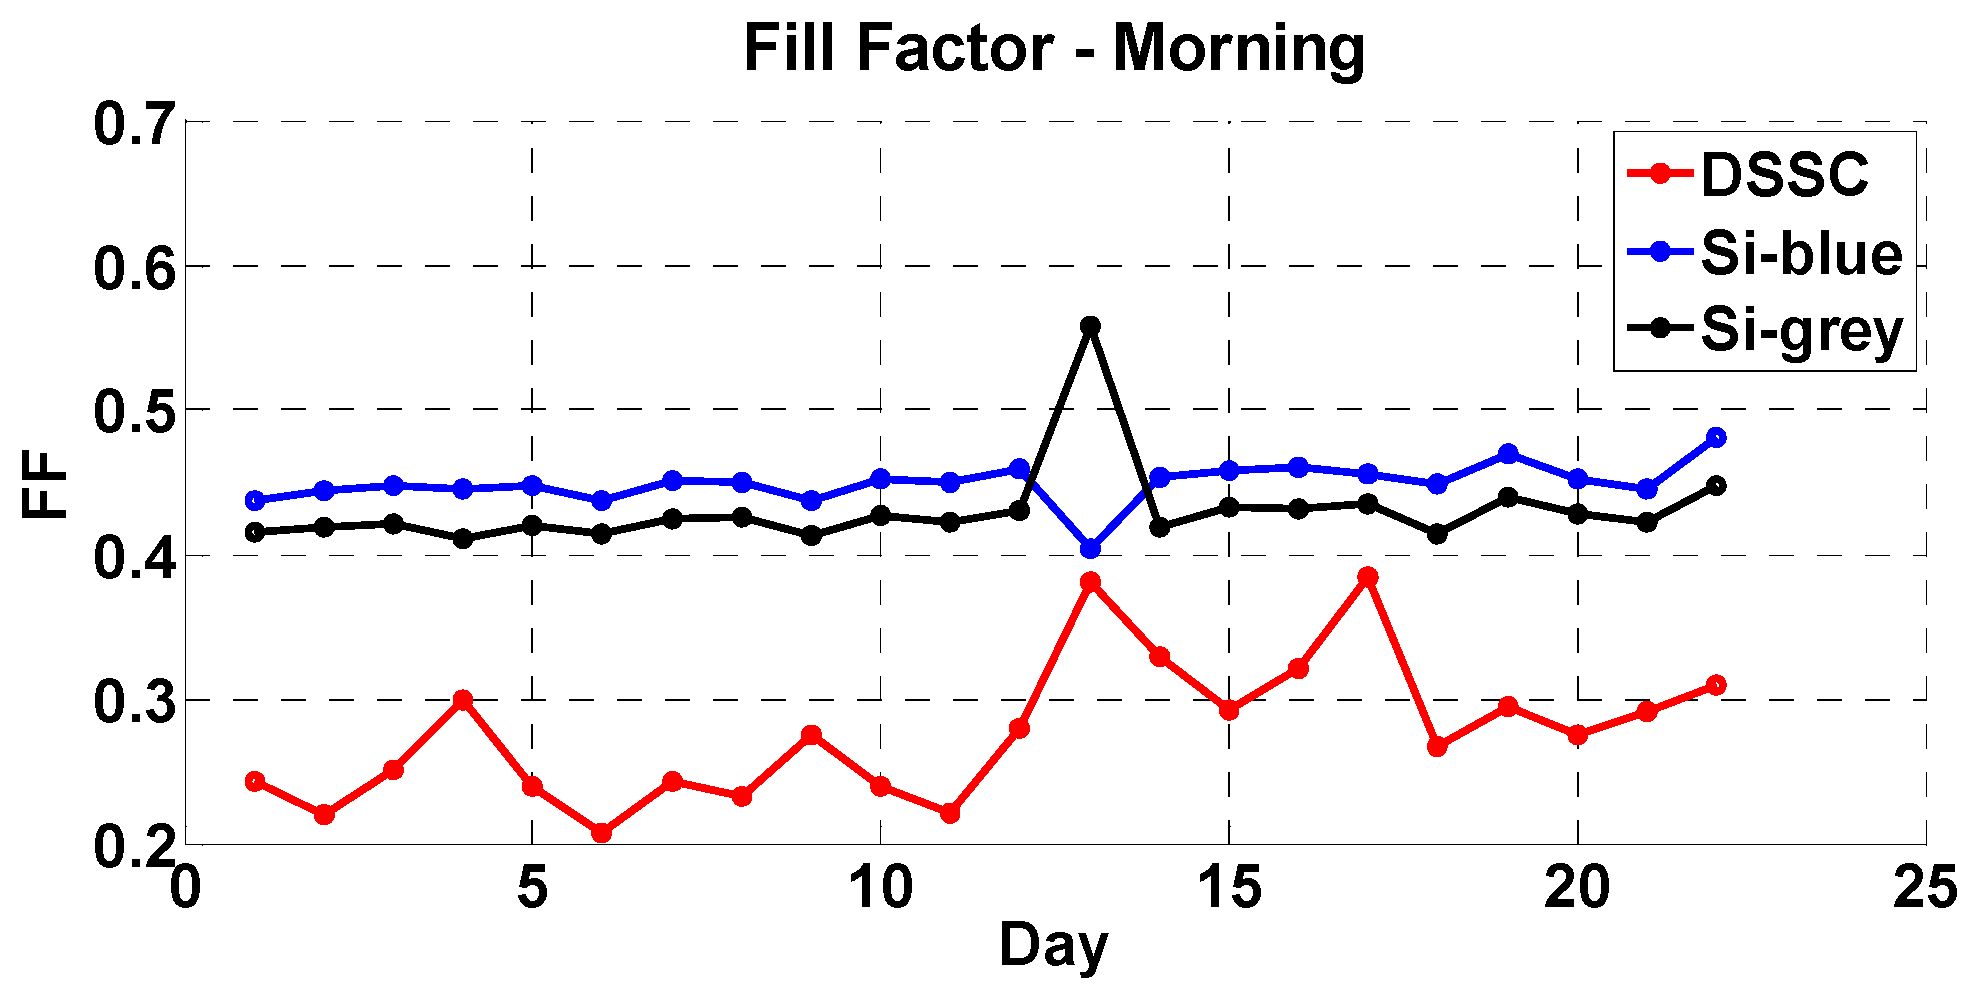
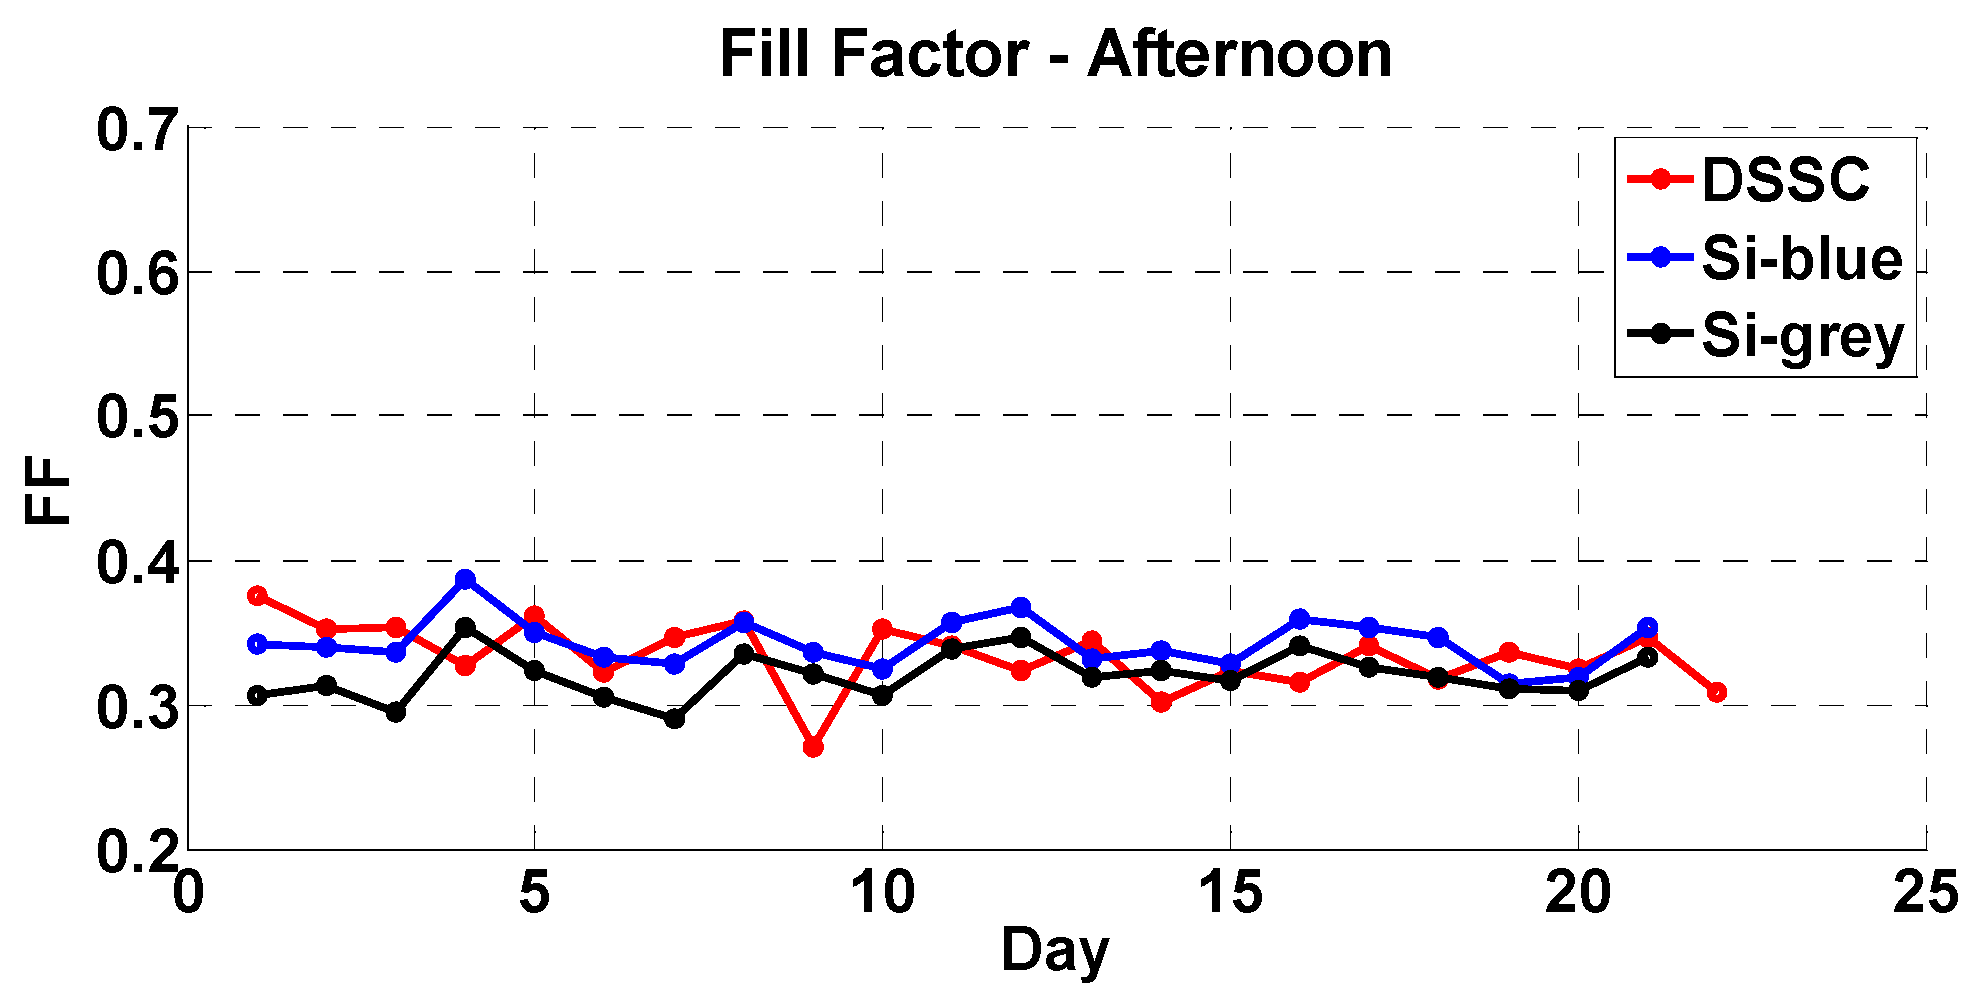
sc is the short-circuit current. For each of the proposed systems, the FF was determined and plotted in
Figure 23 and
Figure 24, which refer to morning and afternoon hours, respectively. In accordance with the previous reported trends, it can be observed that the profiles of DSSC and the Si technologies are comparable during the afternoon hours.
Through the following equation the efficiency is determined:
where P
M is the maximum power, and P
in is the irradiance power. The latter arises from the product between panel total area (0.72 m
2) and irradiance level.
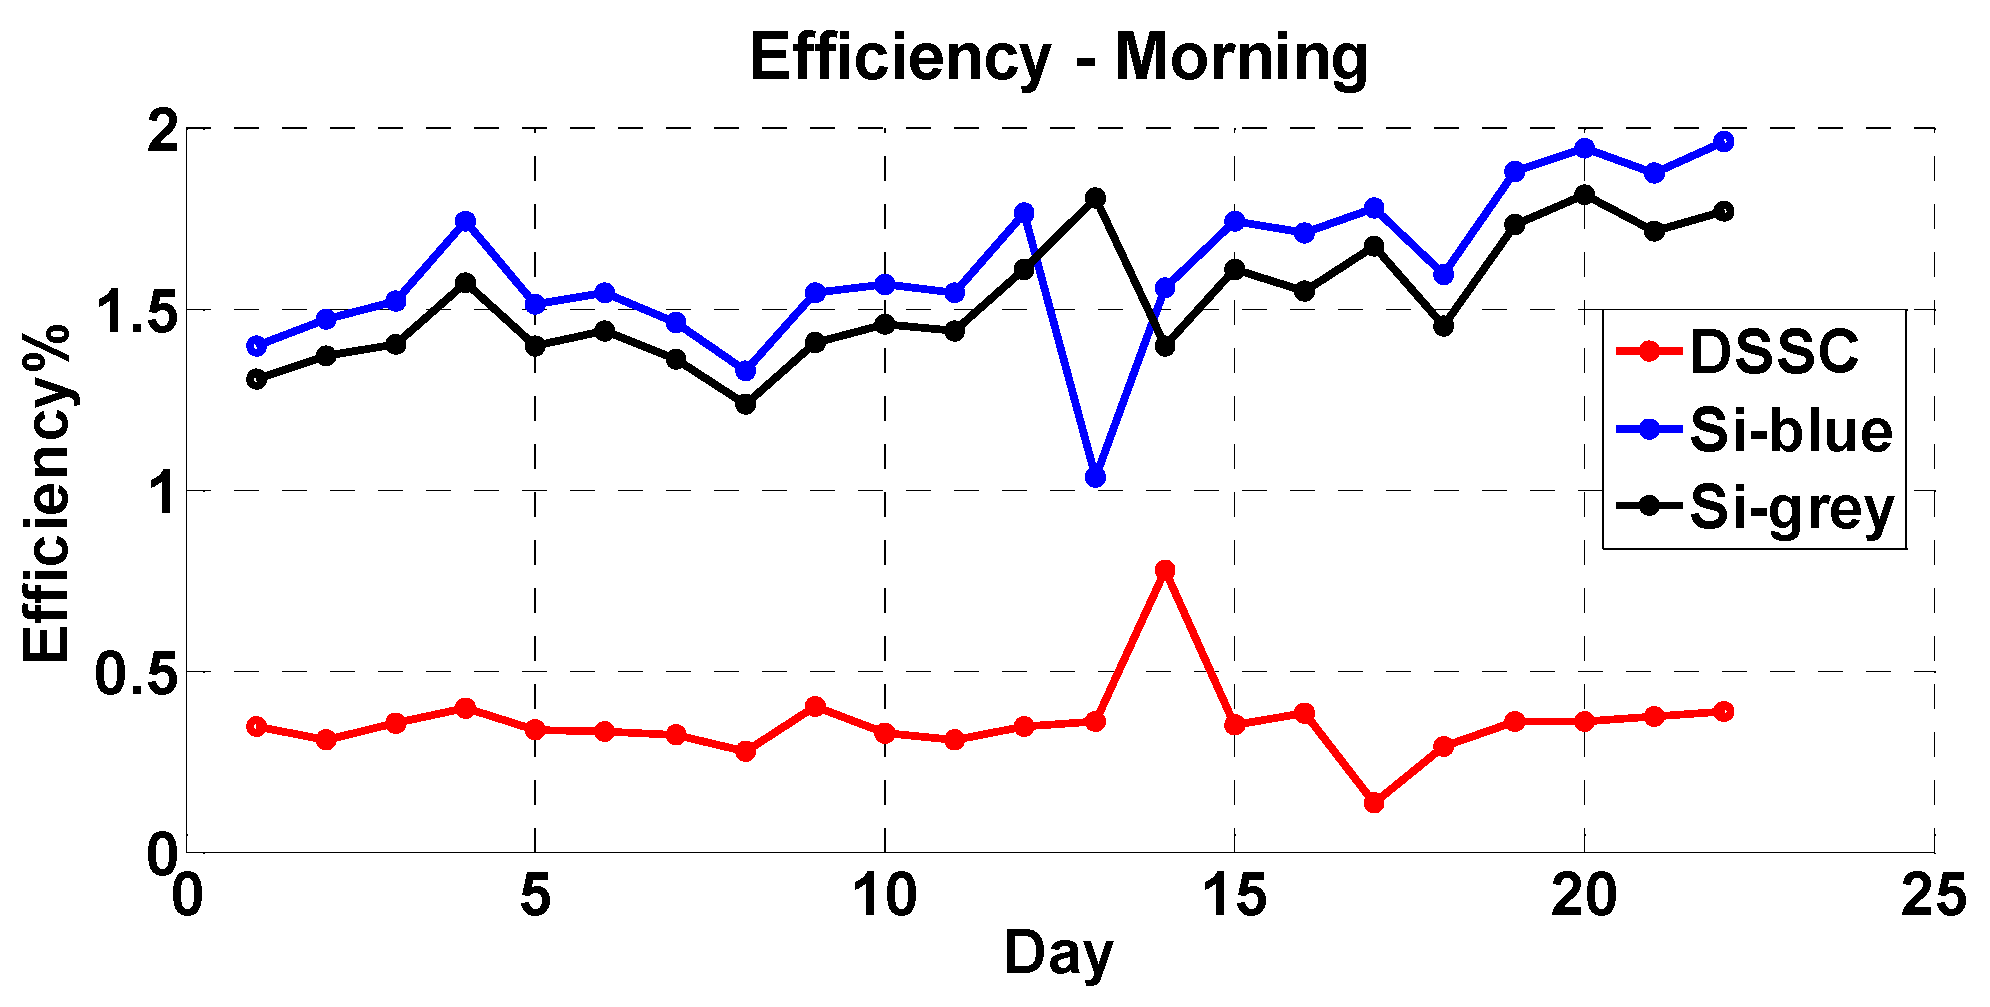
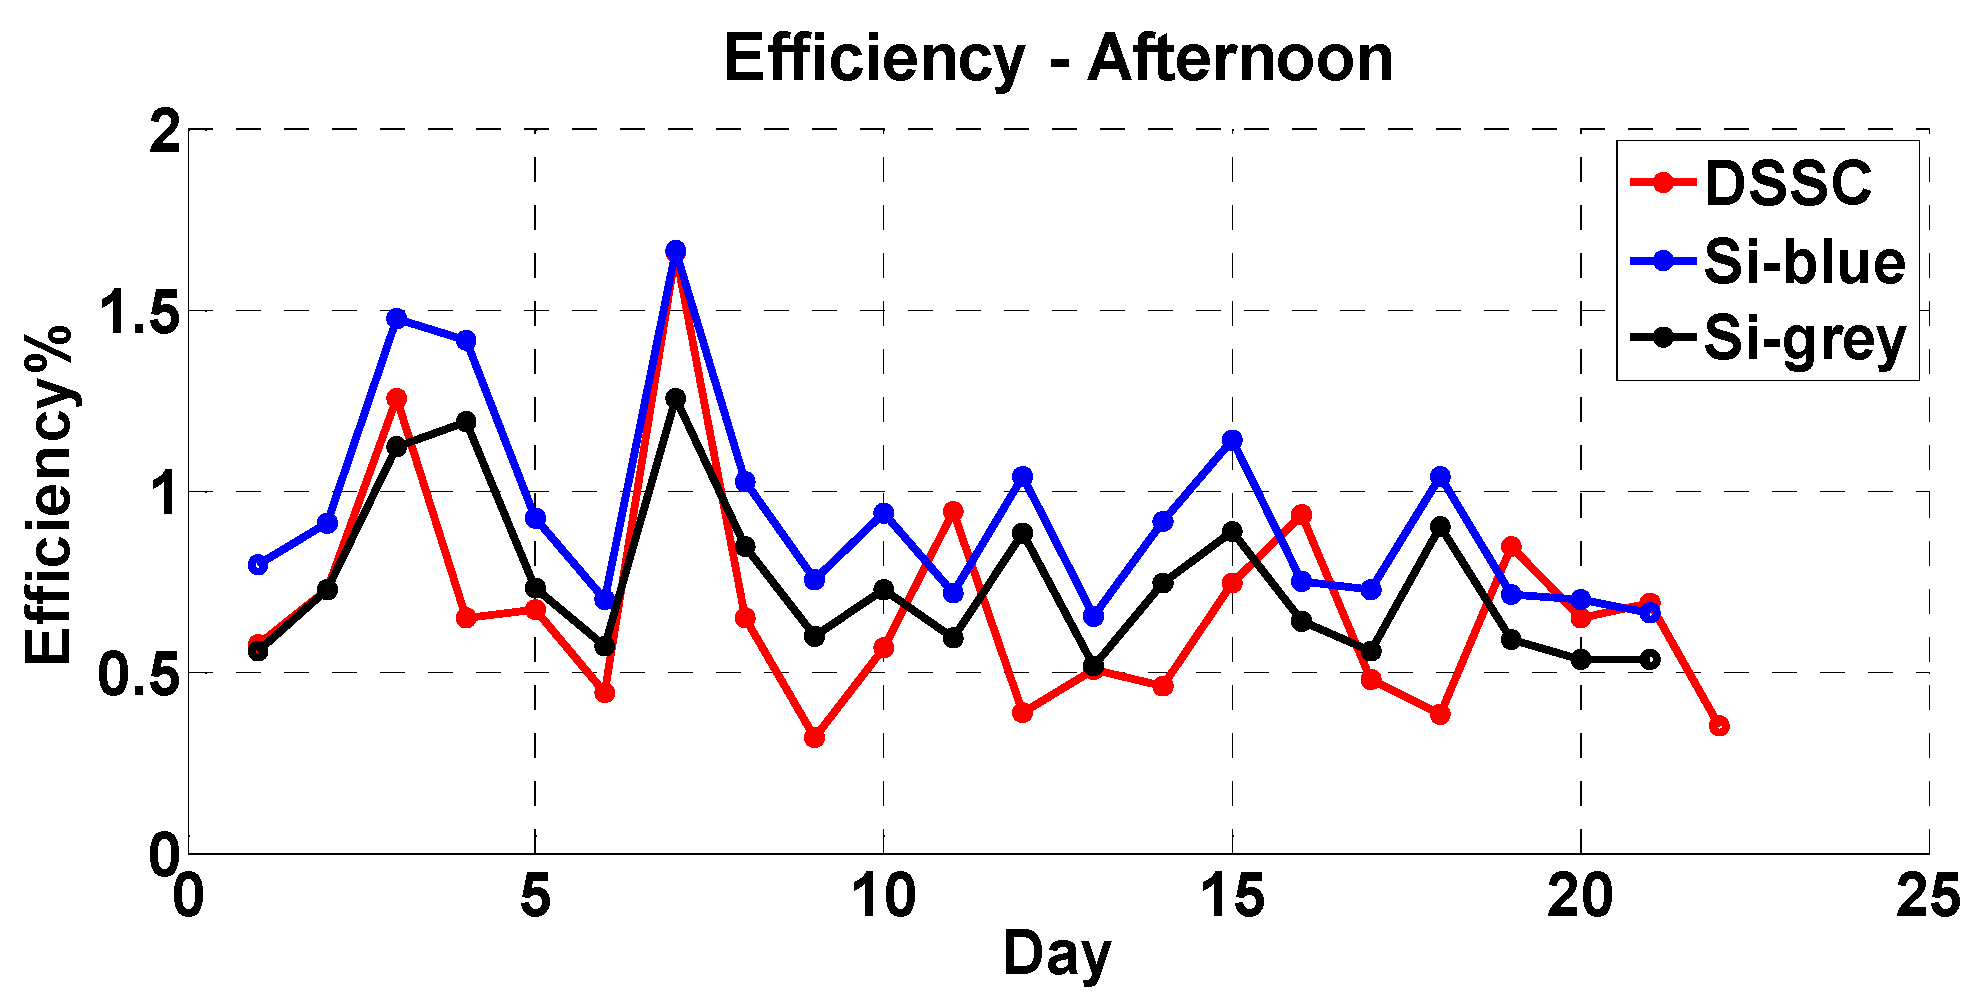
For each of the proposed systems, the efficiency was computed and plotted in
Figure 25 and
Figure 26, corresponding to the morning and to the afternoon hours, respectively. As well as for the previous profiles, it can be noticed that the DSSC values are comparable with those obtained by the Si technology during the afternoon hours.
More in detail, an efficiency in the 1–1.5% range (afternoon–morning) was measured for the Si structures, whereas the performances of the DSSC cells in diffuse light in the afternoon are improved if compared to the case of direct light in the morning. The low value of efficiency measured from the a-Si vertical structure, referred to a traditional panel (in general equal to 10% for azimuth inclination), can be explained by two factors: the first one is the vertical inclination, decreasing efficiency from its maximum value to a 0.40 factor, as reported in [
24]; secondly, efficiency is further decreased due to a reduction of the active material above the glass holder, in order to gain transparency.
The experimental results obtained from the DSSC technology can be validated by considering the works presented in [
10,
24,
25,
26] (without taking into account the vertical disposition). More in detail, Fill Factor values found by Han et al. [
10], Kwak [
24], Peng [
25] and Wang [
27] were equal to 70%, 63%, 55.5–77.7% (depending on the color) and 55.5–73.1%, respectively (according to electrolyte properties). The DSSC performances experimentally obtained by the Authors were also confirmed by the work presented in [
9].
With regards to the degradation aspects, the DSSC cell revealed a progressive color degradation, becoming even transparent during the last period of tests. This phenomenon was due to a photo-induced electrophoresis that occurred between adjacent cells and caused by the non-hermetic sealing between the strips.
However, this degradation phenomenon did not cause a significant decrease of the related electrical performances, in spite of some aesthetic alteration, as shown in
Figure 27, which compares the cells throughout four months of measurements. In order to avoid this widely reported phenomenon [
10,
26], different efforts were addressed to the development of stable electrolytes [
27].
5. Discussions
This section provides a discussion in terms of both technical and economical parameters needed for the feasibility of a PV vertical structure, either with opaque panels (corresponding to the first and second generation prototypes) or with transparent windows (corresponding to the third generation prototypes). From the technical point of view, it can be noticed that the DSSC cell realization is less troublesome with respect to a traditional silicon one, mainly because of the lower number of processes needed for their fabrication. Moreover, the DSSC cells require less energy for high-temperature processes, which are only confined in the sintering process.
On the contrary, the fabrication of a silicon cell requires a relevant number of high-temperature processes, such as purification, doping and deposition of the anti-reflective coating. In addition to that, since an extremely clean working environment is required, the silicon cell production process is more complex. Therefore, by considering the previously mentioned observations, it can be stated that fabrication costs for DSSC technology should be lower than those needed for the a-Si one.
On the other hand, it must be considered that the latter is an already well-developed technology, while the DSSC has just started its evolution. As a consequence, the technologies required for the DSSC production are not fully developed in other industrial sectors. Thus, the processes are not energy-efficiently optimized in order to reduce the payback time for any investment.
From the economical point of view, the costs related to the DSSC fabrication are not easily determinable, as also reported in the recent literature. More in detail, the work proposed by Meyer [
28] estimates the production costs to 2.2
$/Wp, whereas Smestad [
29] estimates their costs to 0.8
$/Wp. This information was then updated in [
30]. In terms of costs/m
2, Smestad estimated at 64
$/m
2 (58.9 €/m
2), while Mayer computed a value equal to 110.6
$/m
2 (101.7 €/m
2). Finally, with regards to the efficiency of the DSSC cells, Smestad suggested a value of 25%, while Mayer deducted a 5% of overall efficiency.
Although the polycrystalline silicon cell production is rapidly becoming cheaper, estimated costs for innovative structure are about 1.78 $/Wp and 267 $/m2 (245.5 €/m2). A quantitative analysis was carried out and, for this purpose, a 1.0 kWp vertical structure was considered for the related analysis. Both data reported in literature and experimentally obtained were considered for the proposed investigation.
Mayer’s cell was taken into account for the DSSC comparison, since the suggested yield was the closest one, compared to that of the investigated system. Moreover, a second generation opaque a-Si panel is used as reference test, whose cost is equal to 1 €/Wp, or 150 €/m2. Furthermore, a first generation c-Si panel for the vertical structure is considered, with cost doubled with respect to the a-Si panel.
The overall costs of vertical BIPV systems and the main parameters for a 1.0 kWp vertical structure are shown in
Table 1. The cheapest technology is not applicable to a window, being based on the opaque amorphous silicon panel. As far as the Mayer’s cell (M DSSC) is concerned, although its cost is similar to the conventional opaque panel, the efficiency values given by the experimentally evaluated systems are still far from the theoretical ones.
The system realization costs are slightly increased by the employment of a glass block, due to the yield reduction because of the shade of the frames [
23]. From
Table 1 it appears evident that the effectiveness of the productivity for the innovative vertical structures is strictly dependent on its extremely accurate design, by also considering the optimal exposure of the solar panels.
The DSSC technology is suitable for the realization of transparent windows, in order to provide indoor lighting for the related environments. However, the adoption of this transparent technology leads to technically poorer performances and higher costs and spaces, if compared with those obtained with opaque panels, such as c-Si or a-Si.
By referring to [
31], green buildings provide increased water and energy efficiency, reduced consumption of natural and material resources, as well as improved health for human and environment. However, no mention was addressed in terms of costs. Therefore, the proposed work could be an important aid for the discussion and support to the thesis of a green building cost premium [
32], even though further research on BIPV technology must be accurately developed [
33,
34,
35,
36,
37,
38,
39].
6. Conclusions
This paper presented an experimental investigation on the performances of solar generating vertical structures, leading also to their technical and economical comparison. DSSC and a-Si thin film solar windows were compared, experimentally testing three systems, such as DSSC and blue and grey solar cells.
It should be emphasized that the photovoltaic window does not aim at replacement of normal photovoltaic systems (azimuth inclined). The idea presented in [
40] consisted in smart windows exceeding the traditional window. On the other hand, as stated in [
41], smart windows will be characterized also for other several advantages offered, if compared to traditional ones, with a neat money saving for air-conditioning, heating, lighting, and curtains.
The electrical power generated during several hours of a day by each of the PV vertical structures was measured, as well as the fill factor and related efficiency. The performance comparison between the proposed systems determined a higher power production and efficiency by the silicon cells among the daily hours. Nevertheless, during the hours of late afternoon under scattered light conditions, the performances given by the DSSC cells were almost comparable with the silicon ones.
Thus, it can be stated that the three technologies proposed in this work, even if their performances are still far from satisfying the power requests, exhibited an adequate degree of architectural integration in buildings. In such a way, the main objective, as previously explained, is not to feed the building but to create an energy harvesting [
42].

