Article

Proposal for a Quad-Elliptical Photonic Crystal Fiber for Terahertz Wave Guidance and Sensing Chemical Warfare Liquids

by
Izaddeen Yakasai
1,*,
Pg Emeroylariffion Abas
1,
Shubi F Kaijage
2,
Wahyu Caesarendra
1,3 and
Feroza Begum
1,*
1
Faculty of Integrated Technologies, Universiti Brunei Darussalam, Jalan Tungku Link BE1410, Brunei Darussalam
2
School of Computational and Communication Science and Engineering, Nelson Mandela African Institution of Science and Technology, Arusha 23311, Tanzania
3
Department of Mechanical Engineering, Diponegoro University, Jl. Prof. Soedharto, SH, Tembalang, Semarang 50275, Indonesia
*
Authors to whom correspondence should be addressed.
Photonics 2019, 6(3), 78; https://doi.org/10.3390/photonics6030078
Submission received: 27 May 2019 / Revised: 29 June 2019 / Accepted: 4 July 2019 / Published: 8 July 2019

Abstract

:
A porous-core photonic crystal fiber based on a cyclic olefin homopolymer (Zeonex) is proposed; it shows high birefringence, high core power fraction, low losses, and near-zero flat dispersion. The fiber’s core was designed with quad-elliptical (QE) air holes with its center occupied by bulk background material. The superiority of the QE design over the commonly adopted tri- and penta-elliptical (TE and PE) core designs is demonstrated. The presence of the bulk material at the core center and the geometrical configuration cause a broad contrast in phase refractive indices, thereby producing high birefringence and low transmission losses. A high birefringence of 0.096 was obtained at 1.2 THz, corresponding to a total loss of 0.027 cm−1 and core power fraction of approximately 51%. The chromatic dispersion and effective area of the reported fiber were also characterized within a frequency range of 0.4–1.6 THz. The QE air holes were then filled with chemical warfare agents, namely, tabun and sarin liquids. Then, the relative sensitivity, confinement loss, fractional power flow, and effective material loss (EML) of the sensor were calculated. Nearly the same relative sensitivity (r = 64%) was obtained when the QE core was filled with either liquid. Although the obtained EML for tabun was 0.033 cm−1 and that for sarin was 0.028 cm−1, the confinement loss of the fiber when it was immersed in either liquid was negligible. The proposed fiber can be fabricated using existing fabrication technologies. Moreover, it can be applied and utilized as a THz radiation conveyor in a terahertz time domain spectroscopy system for remote sensing of chemical liquids in the security and defense industries.

1. Introduction

The terahertz (THz) spectral region is within 0.1–10 THz, equivalent to 3000–30 µm in the electromagnetic spectrum [1]. THz radiation has a wide range of applications, such as remote sensing of toxic chemicals in the petrochemical industry [2], sensing of drug integrity in the pharmaceutical industry [3], and basal cancer detection in the medical industry [4].
Research and development has since picked up in terms of devising efficient THz waveguides for successful industrial integration. As a departure from free space propagation [5] and metallic waveguides [6], hollow- and solid-core photonic crystal fibers (PCFs) were introduced as ohmic loss-free THz waveguides [7,8,9]. Hollow-core PCFs guide THz radiation by anti-resonant effects or a photonic band-gap mechanism and produce negligible effective material loss (EML) due to their predominantly air core. However, hollow-core PCFs are usually inflexible and operate in only a narrow predesigned window, so they are not suitable for guiding broad THz spectra. Meanwhile, solid-core waveguides suffer from structural rigidity, high EML, and frequency-dependent dispersion [10]. Air holes were later introduced in the core to reduce the presence of bulk material; the EML and dispersion were significantly reduced, thus paving the way for intensive research into the THz waveguiding characteristics of this PCF class, which is now popularly known as porous-core PCFs (PC-PCFs) [10,11,12,13]. Apart from EML and dispersion, confinement loss, power fraction, bending loss, and birefringence are properties of PC-PCFs. All of the above properties can be pre-engineered by optimizing the core and cladding air hole sizes and positions. High birefringence is particularly essential for polarization-demanding applications, such as THz imaging. Birefringence is achieved by breaking the fiber’s structural symmetry; one of the most convenient ways to achieve this is by introducing elliptical air holes in the core.
A number of PC-PCFs with elliptical air holes have been reported in the past. In 2018, Islam et al. introduced nine elliptical air holes in the core to achieve a birefringence of 0.086 and EML of 0.065 cm−1, but crucial parameters that give insights into the modal propagation characteristics, such as the power fraction, effective area, and total loss, were not reported [14]. The same group [15] proposed a rectangular cladded fiber comprising five elliptical core air holes with a birefringence of 0.063 and EML of 0.06 cm−1. In 2019, Paul et al. proposed a hexahedron-core PC-PCF with a numerical aperture (NA) of 0.52 and EML of 0.066 cm−1. However, the authors did not examine birefringence despite the fact that the hexahedron core lattice seems to create structural asymmetry [13].
An optical fiber sensor is a device that can measure the intensity of electromagnetic waves or can convert light rays into electrical signals which can be used to detect changes and responses in ambient conditions. These sensors are used to sense quantities relating to temperature, pressure, vibrations, displacements, rotations, or concentration of chemical substances [16]. PCFs have so many uses in the field of remote sensing because they require no electrical power at the remote location and they are tiny in size. PCF sensors can easily be deployed in small areas and can be installed correctly wherever flexible fibers are needed. The frequency/wavelength shift and time delay of such fibers can be configured using time and frequency domain reflectometry [17,18]. The generic working principle of a PCF sensor consists of an optical source (e.g., broadband source, laser, and laser diode), PCF, sensing element, PCF detector, and end processing devices (e.g., optical spectrum analyzer, oscilloscope) [19]. Moreover, a PCF sensor can be classified based on its operating principle (intensity based, phase based, or polarization based), sensor location (intrinsic or extrinsic type), or based on its intended application (chemical, physical, or biomedical sensing). Interferometers such as Michelson, Mach Zhender, Sagnac, and fiber grating are examples of phase-based PCF sensors [16]. Algorri et al. details several forms of infiltrated PCF sensors that have emerged over the years. PCFs can be infiltrated with solids, liquids, or gas [20]. A liquid chemical sensor is a device which is used to transform chemical information into the form of a measurable physical signal that is associated with the concentration of a certain chemical liquid [19].
The refractive index of a chemical liquid is an essential parameter for the in situ measurement and identification of materials in fields such as the chemical industry [21], petrochemical industry [22], and quality control industry [23], etc. Initially, refractive index sensors were mainly developed by using large-mode-area (LMA) PCFs. For example, Minkovich et al. experimentally characterized an LMA tapered PCF with collapsed air holes [24]. Advanced sensing systems are achieved by combining PCFs with different interferometric techniques. For example, several PCFs have been combined with interferometric techniques to serve as improvised sensing probes [25,26]. The sensitivity of PCF-based refractive index sensors has also been integrated with the surface plasmon resonance effect, in which the resonance peak shift is used to determine the sensitivity [27,28,29].
In the THz regime, sensing of toxic and nontoxic chemical liquids has been theoretically conducted with PC-PCFs in the past by using the intrinsic refractive index properties of the respective chemicals [23,30,31,32]. Among liquids, alcohols have been mostly studied because of their free flow and colorlessness [23,30,31]. Rana et al. recently proposed a PC-PCF for sensing water and ethanol [31]. The sensor showed relative sensitivity and birefringence of 73.5% and 0.013, respectively, but the EML of the proposed optical fiber sensor was not investigated. The authors also did not examine the properties of their fiber in the absence of liquid in its core. The relative sensitivity of cyanide has been extensively studied by using a penta-elliptical-core (PE) PC-PCF [32].
A Zeonex-based quad-elliptical (QE) PC-PCF is proposed in this work. First, a performance comparison was conducted to show the superiority of the QE design over the commonly known tri-elliptical (TE) and PE designs. Then, the QE PCF was further probed. Finally, the proposed fiber is suggested for sensing liquid chemical warfare agents dimethylphosporamidocyanidate (tabun) and isopropyl methylphosphonofluoridate (sarin).

2. Design Geometry and Material

The cross-sectional geometry of the proposed QE PC-PCF and a PE PC-PCF is presented in Figure 1 with an enlarged view of the core region. The cladding comprises 18 equally spaced circular air holes with diameter d following a ring rhythm of {6r: r = 1, 2}. The QE design has four elliptical air holes distributed symmetrically with respect to the y axis of the core area. The center of the core is solid, whereas the remainder of the core is filled with the elliptical air holes. The major axes of each ellipse in each set of two from the middle to its edge are a1 = 0.38 Λ and a2 = 0.46 Λ, respectively. The minor axis b of all the ellipses is 0.073 Λ, and the pitch between any two adjacent ellipses is Λc = 0.19 Λ. The solid material in the core center is replaced with an ellipse with major axi0s a* = 0.65 Λ and minor axis b to create the PE design. All the dimensions of the proposed fiber are defined in terms of an optimized cladding pitch of Λ = 300 µm. This choice is a convenient way to define a PC-PCF and could aid in potentially scaling the geometry for different spectral regimes.
A cyclic olefin homopolymer commercially known as Zeonex grade 480R was chosen as the host material due to its unique optical properties in THz frequencies compared with other commonly used polymer materials. Zeonex has a low absorption rate of 0.2 cm−1 at 1 THz frequency and a flat refractive index of approximately 1.53 in the 0.1–2 THz spectral range [33,34], which translate into negligible dispersion [35]. It is also not water-absorbent [36], is insensitive to humidity [37], and has chemical inertness with bio-sensing properties [36]. Although Zeonex and Topas have many similar properties, Zeonex has higher bio-compatibility and chemical resistivity than Topas. A unique advantage of Zeonex is its strong chemical resistance even at high temperatures and higher glass transition temperature of 138 °C, which make it more amenable to fabrication. Moreover, Zeonex has a lower refractive index than Topas, specifically in such grades as 330R, 480R, and 480, which could help in reducing the EML [38].
An anisotropic cylindrical perfectly matched layer (PML) was imposed to maximize the modal confinement in the fiber by preventing mode reflection. A simulation was conducted using finite-element-method-based multiphysics software COMSOL v5.3a. The finite element method solves Maxwell’s equations by discretizing the fiber into small solvable triangles using extremely fine meshes. The entire geometry consisted of 149,372 triangular elements, 8704 edge elements, and 384 vertex elements. The average element quality was 0.97.

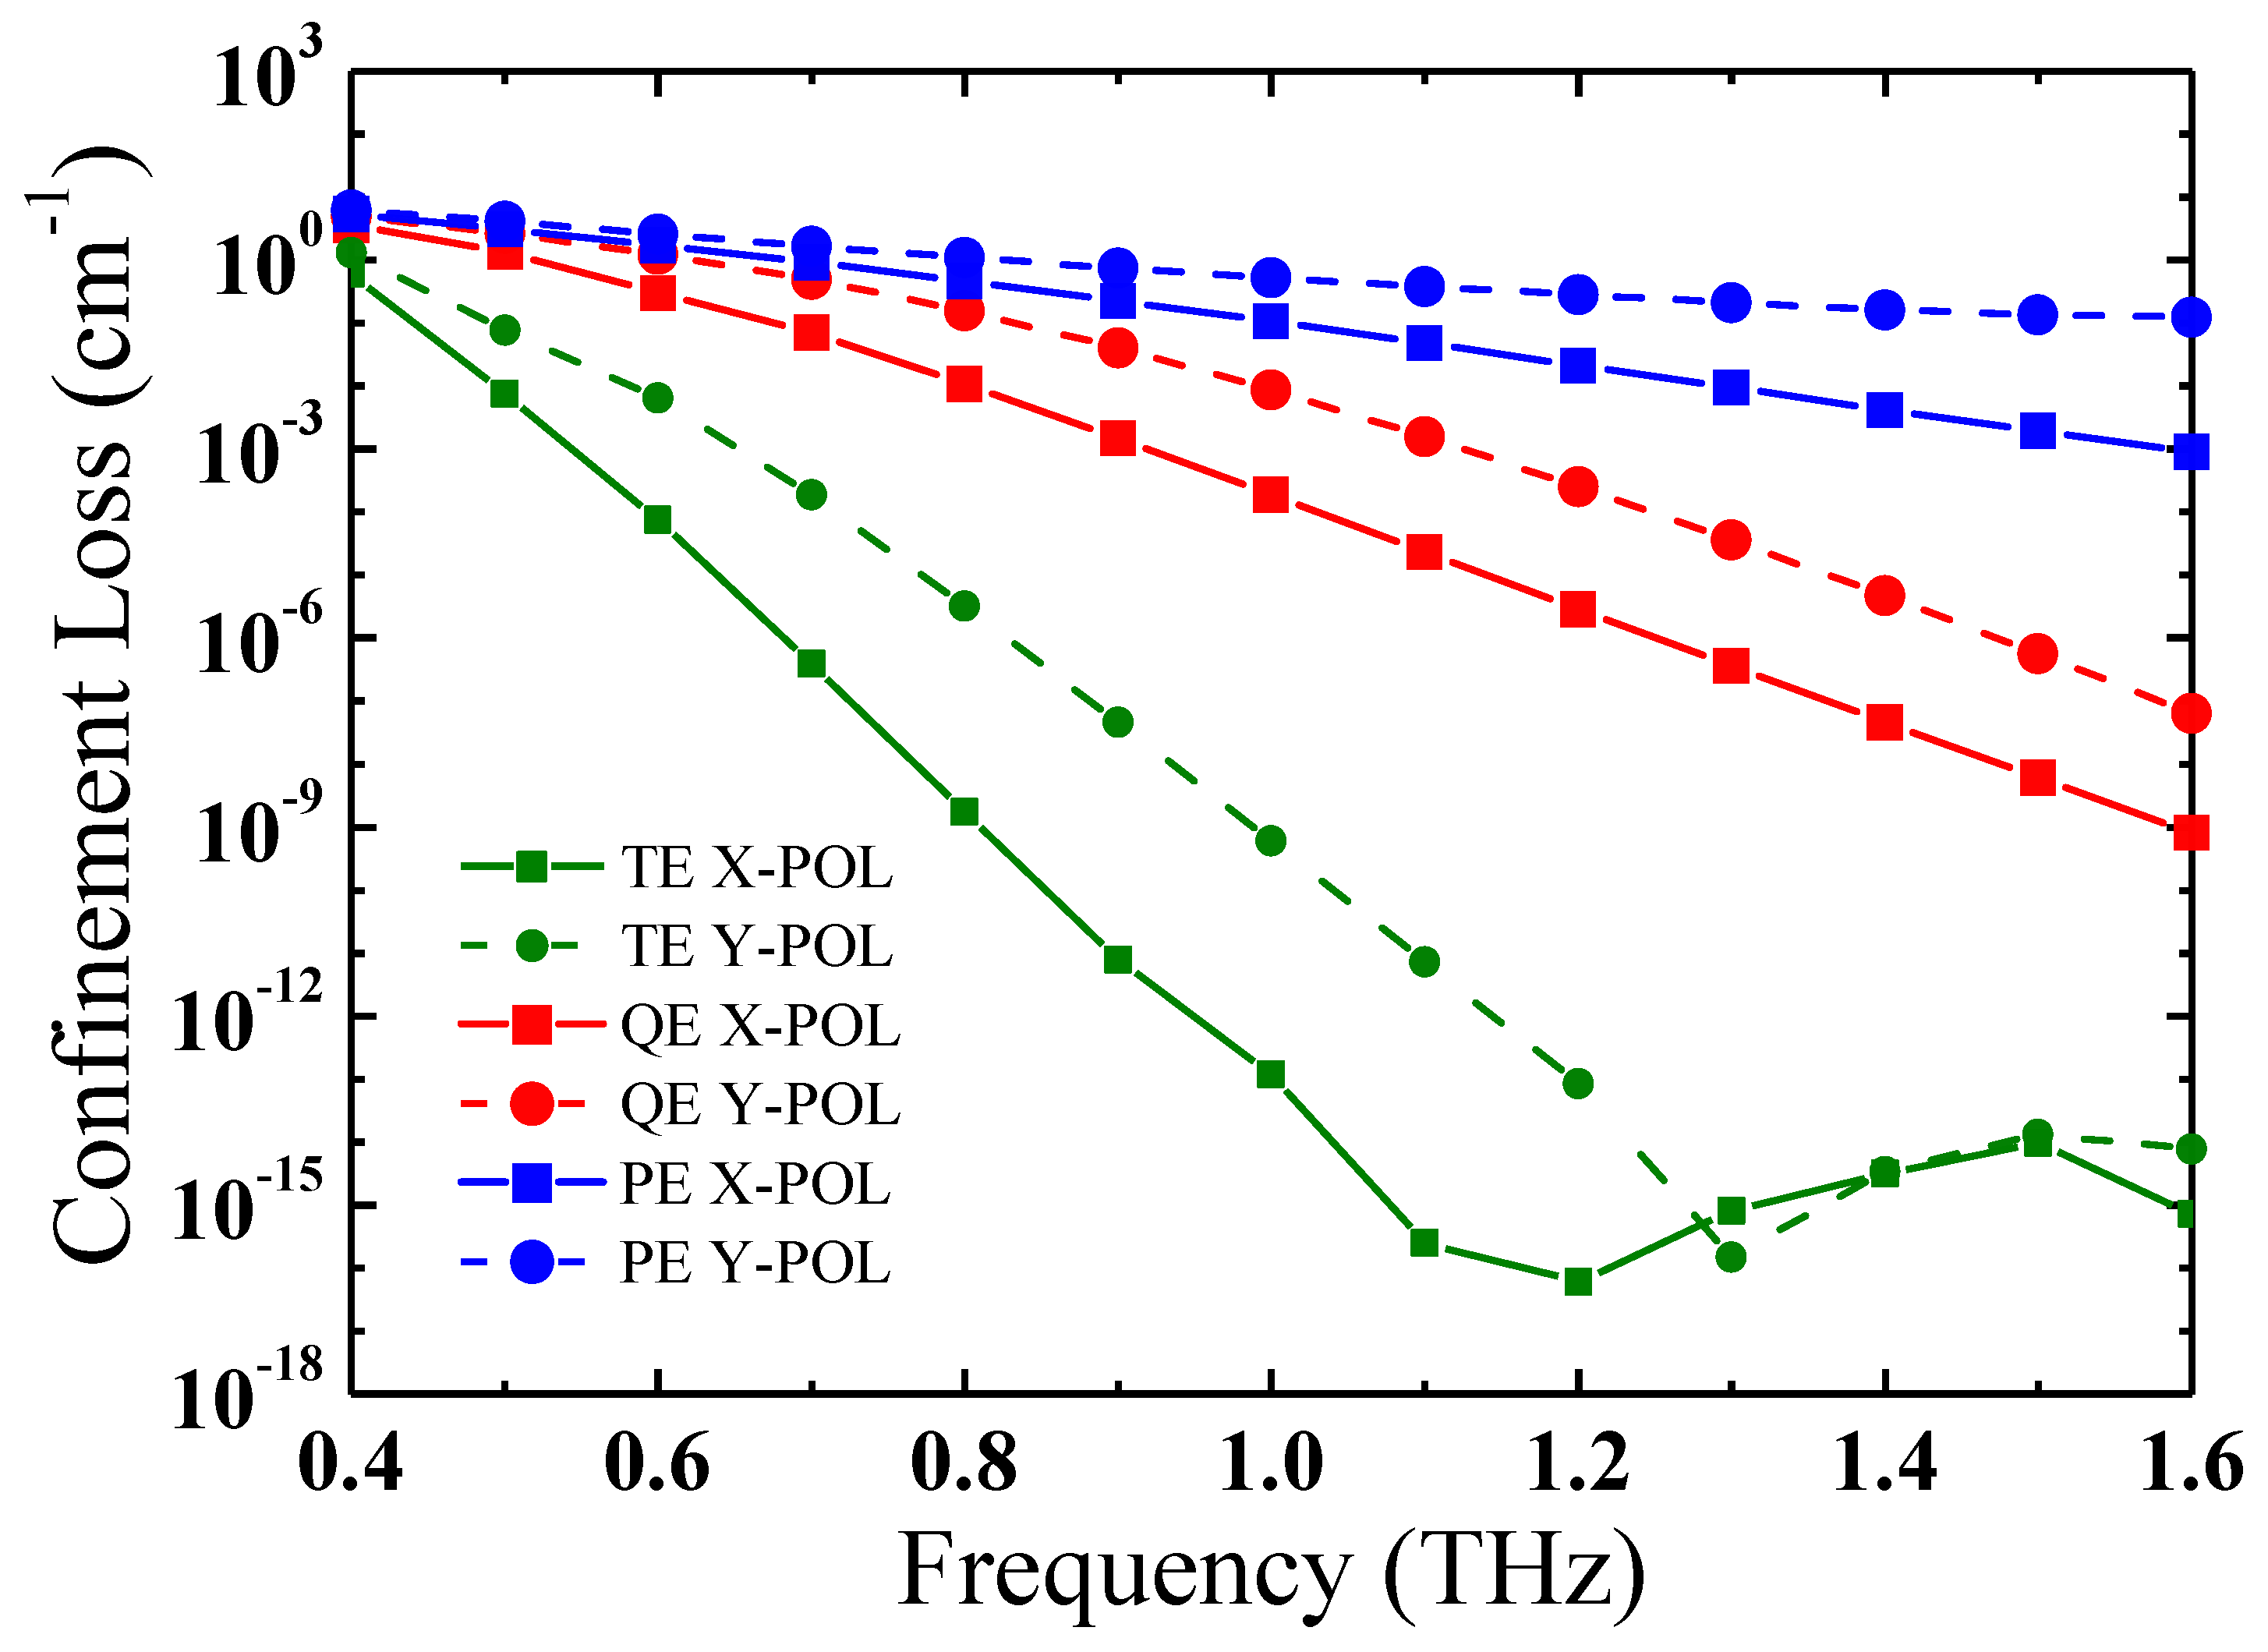
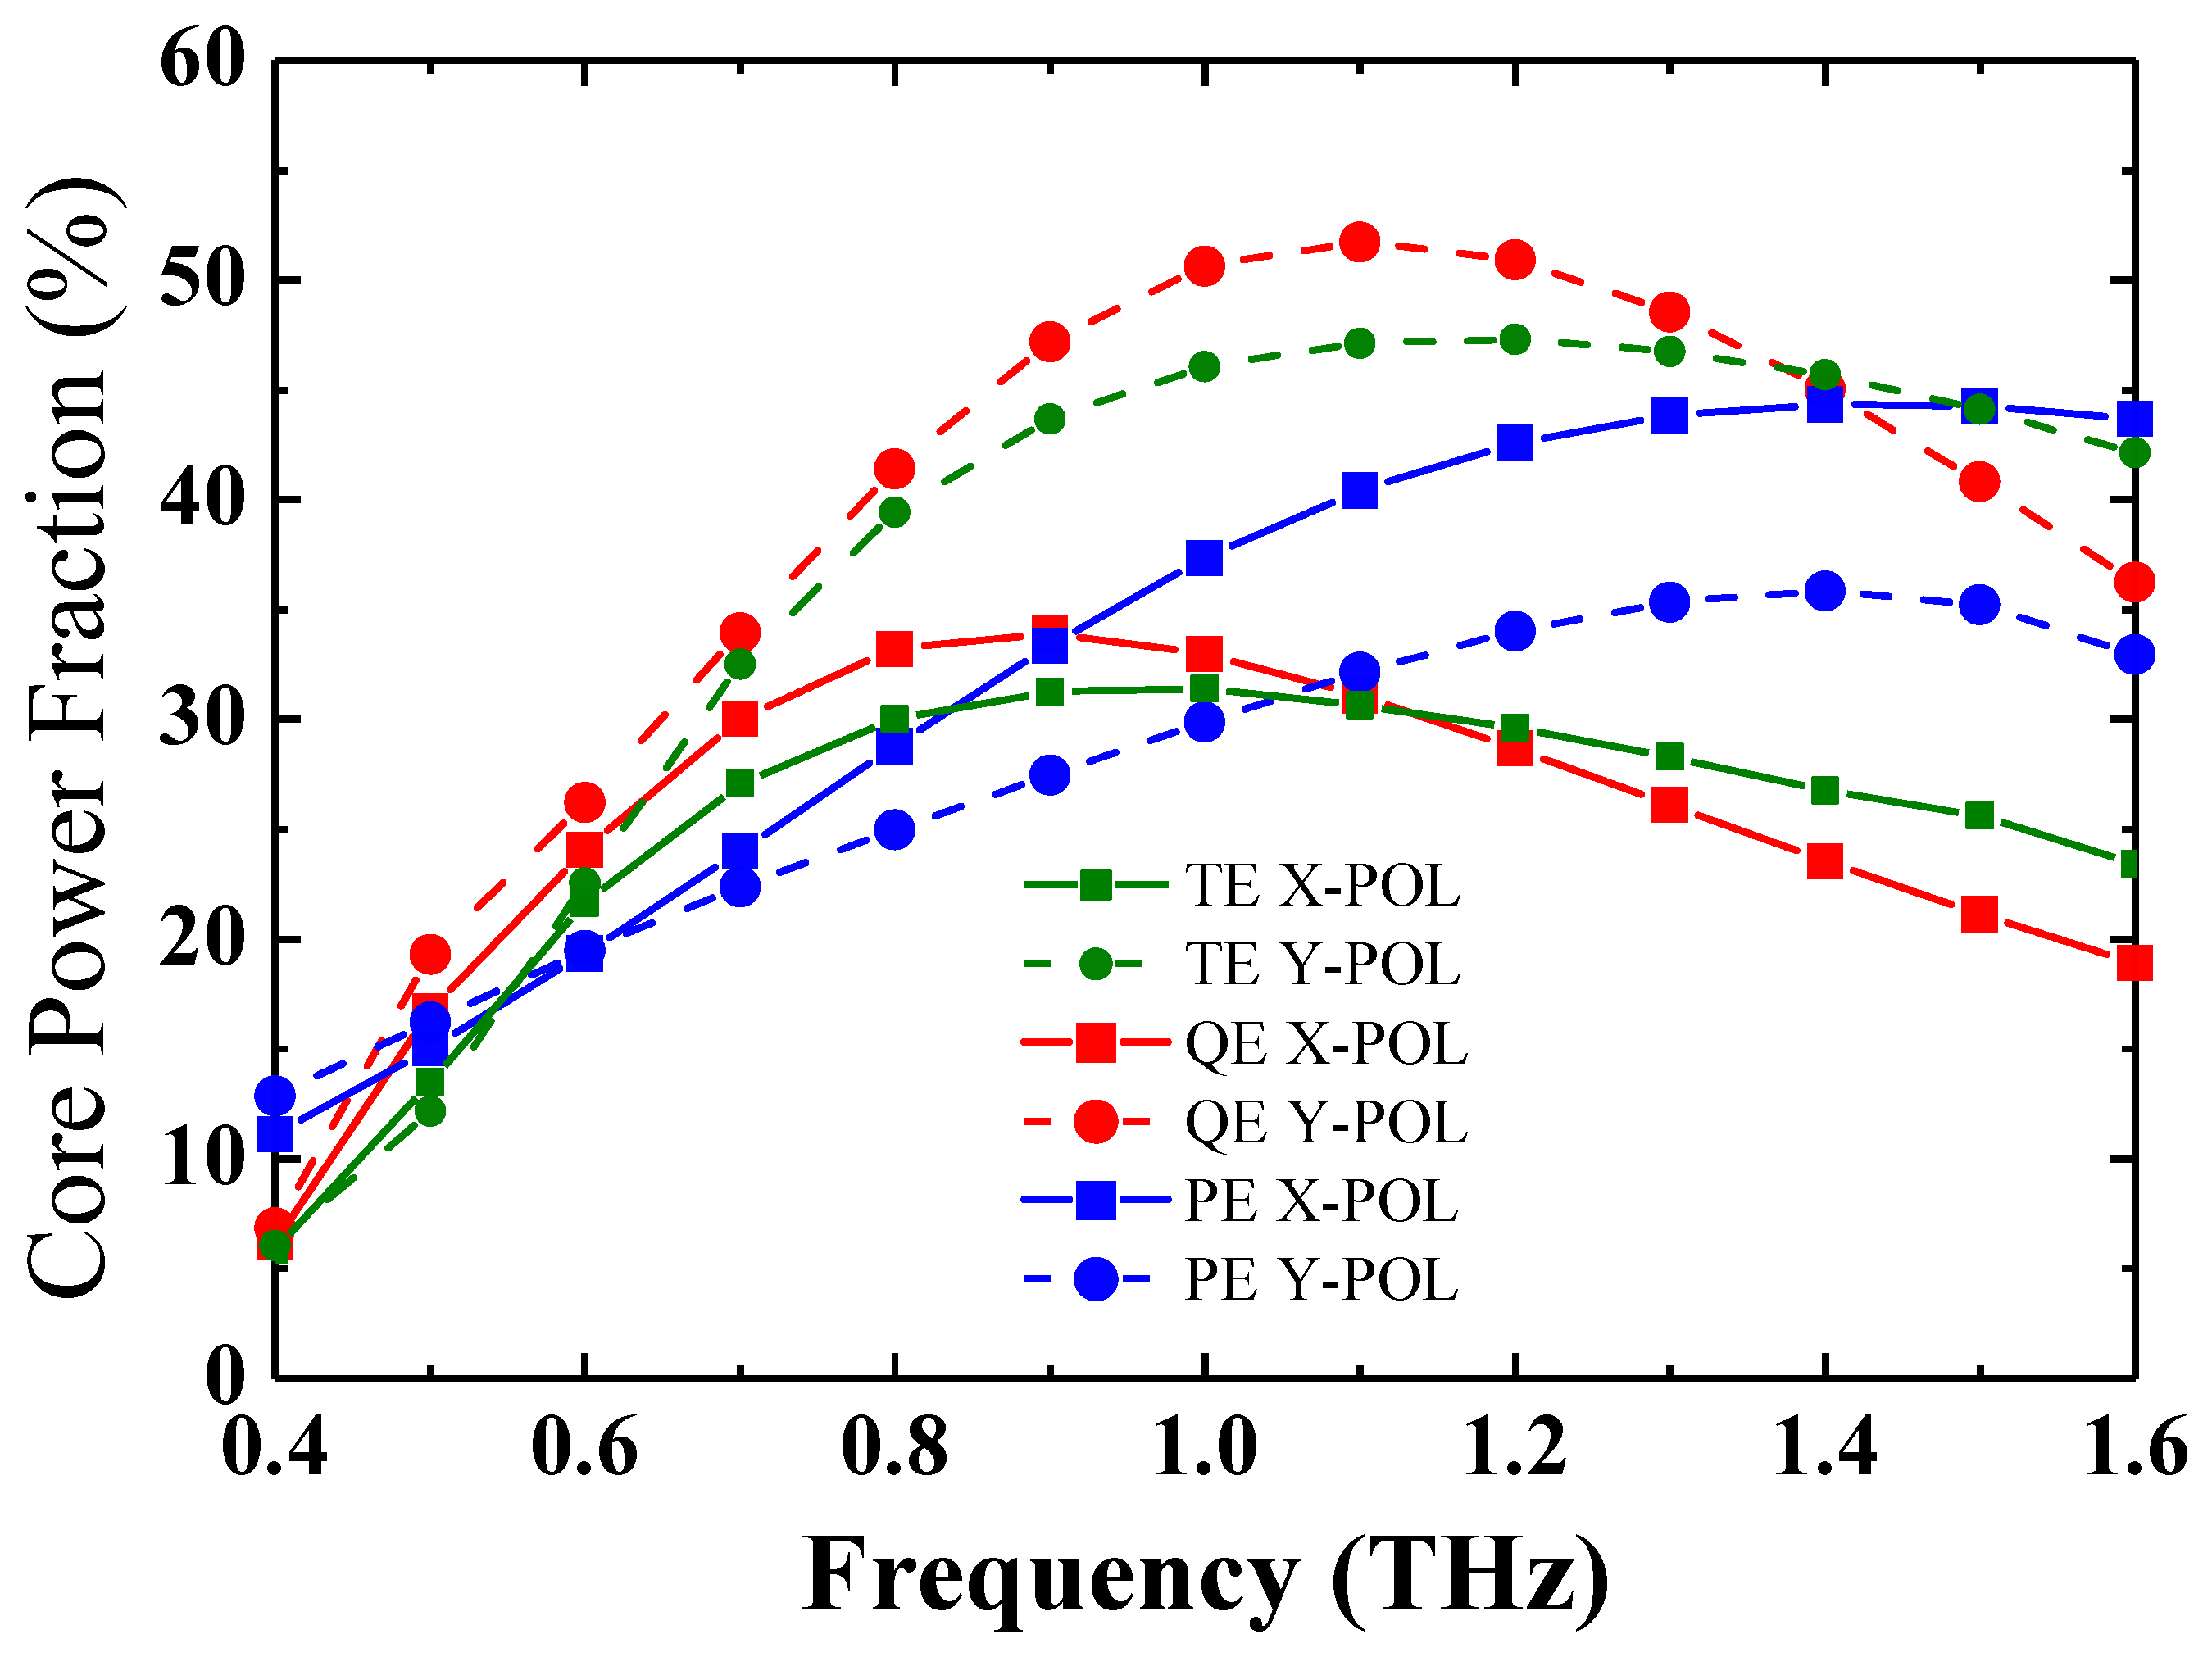
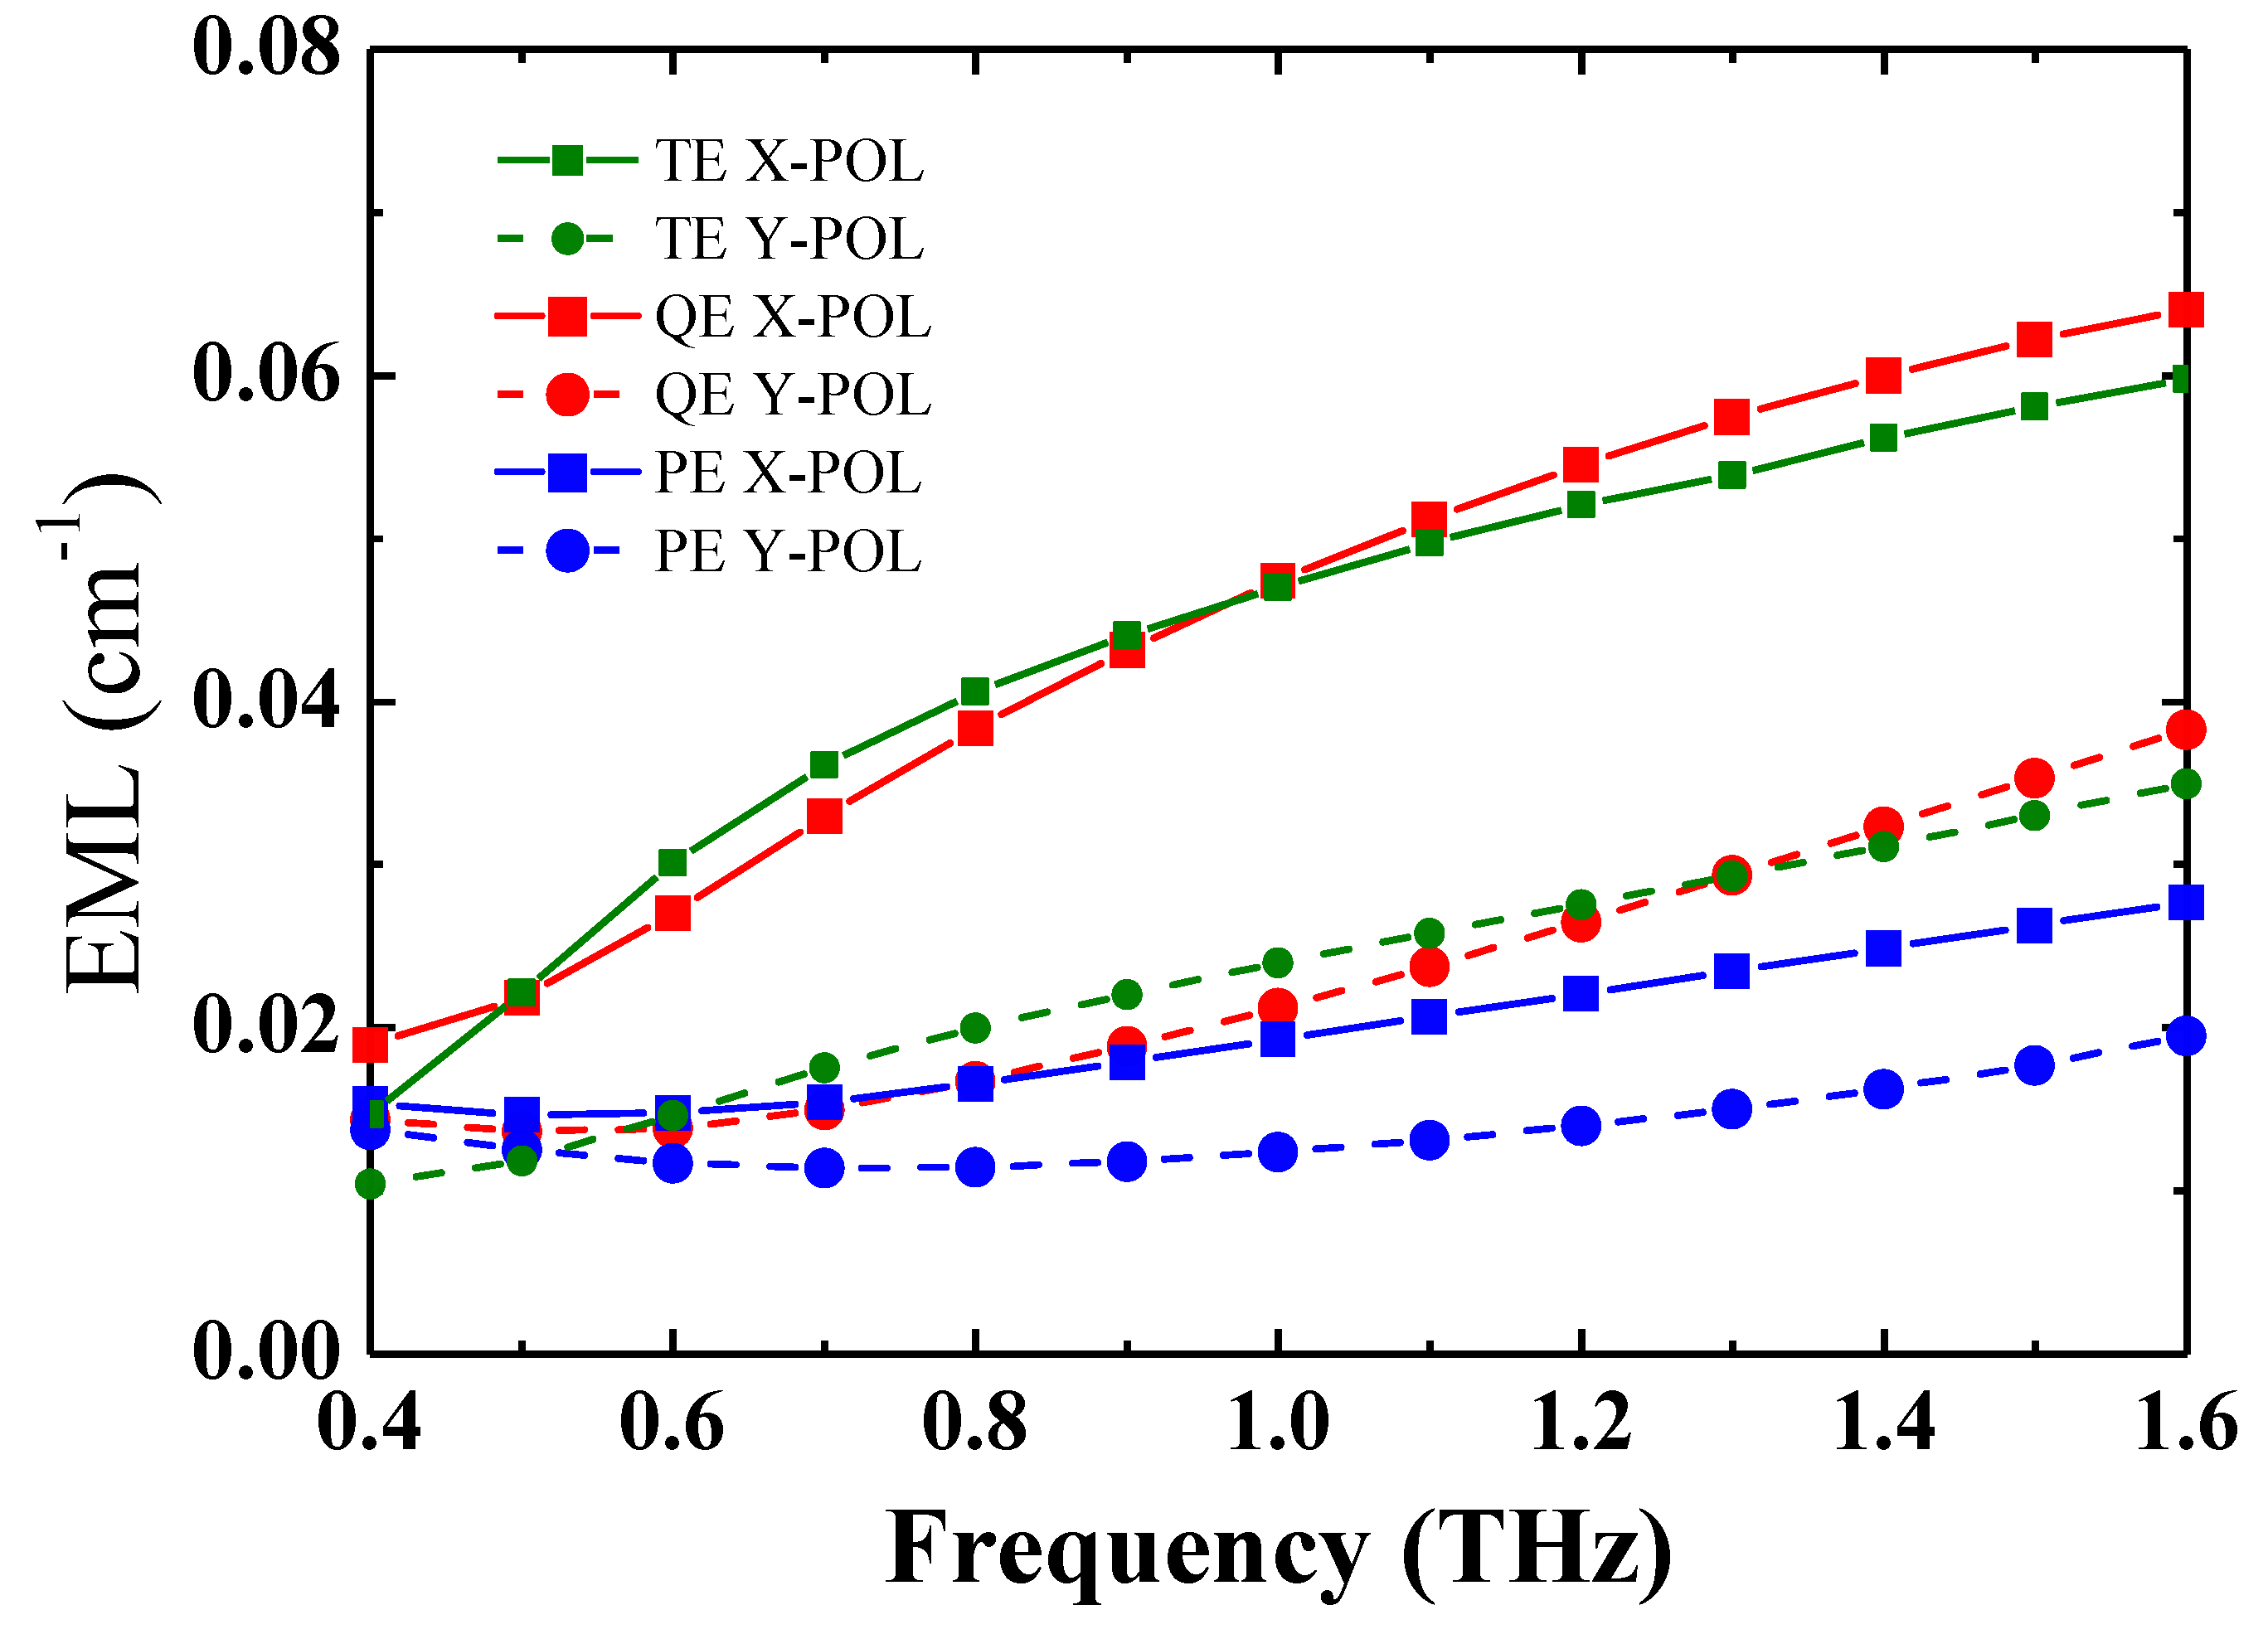
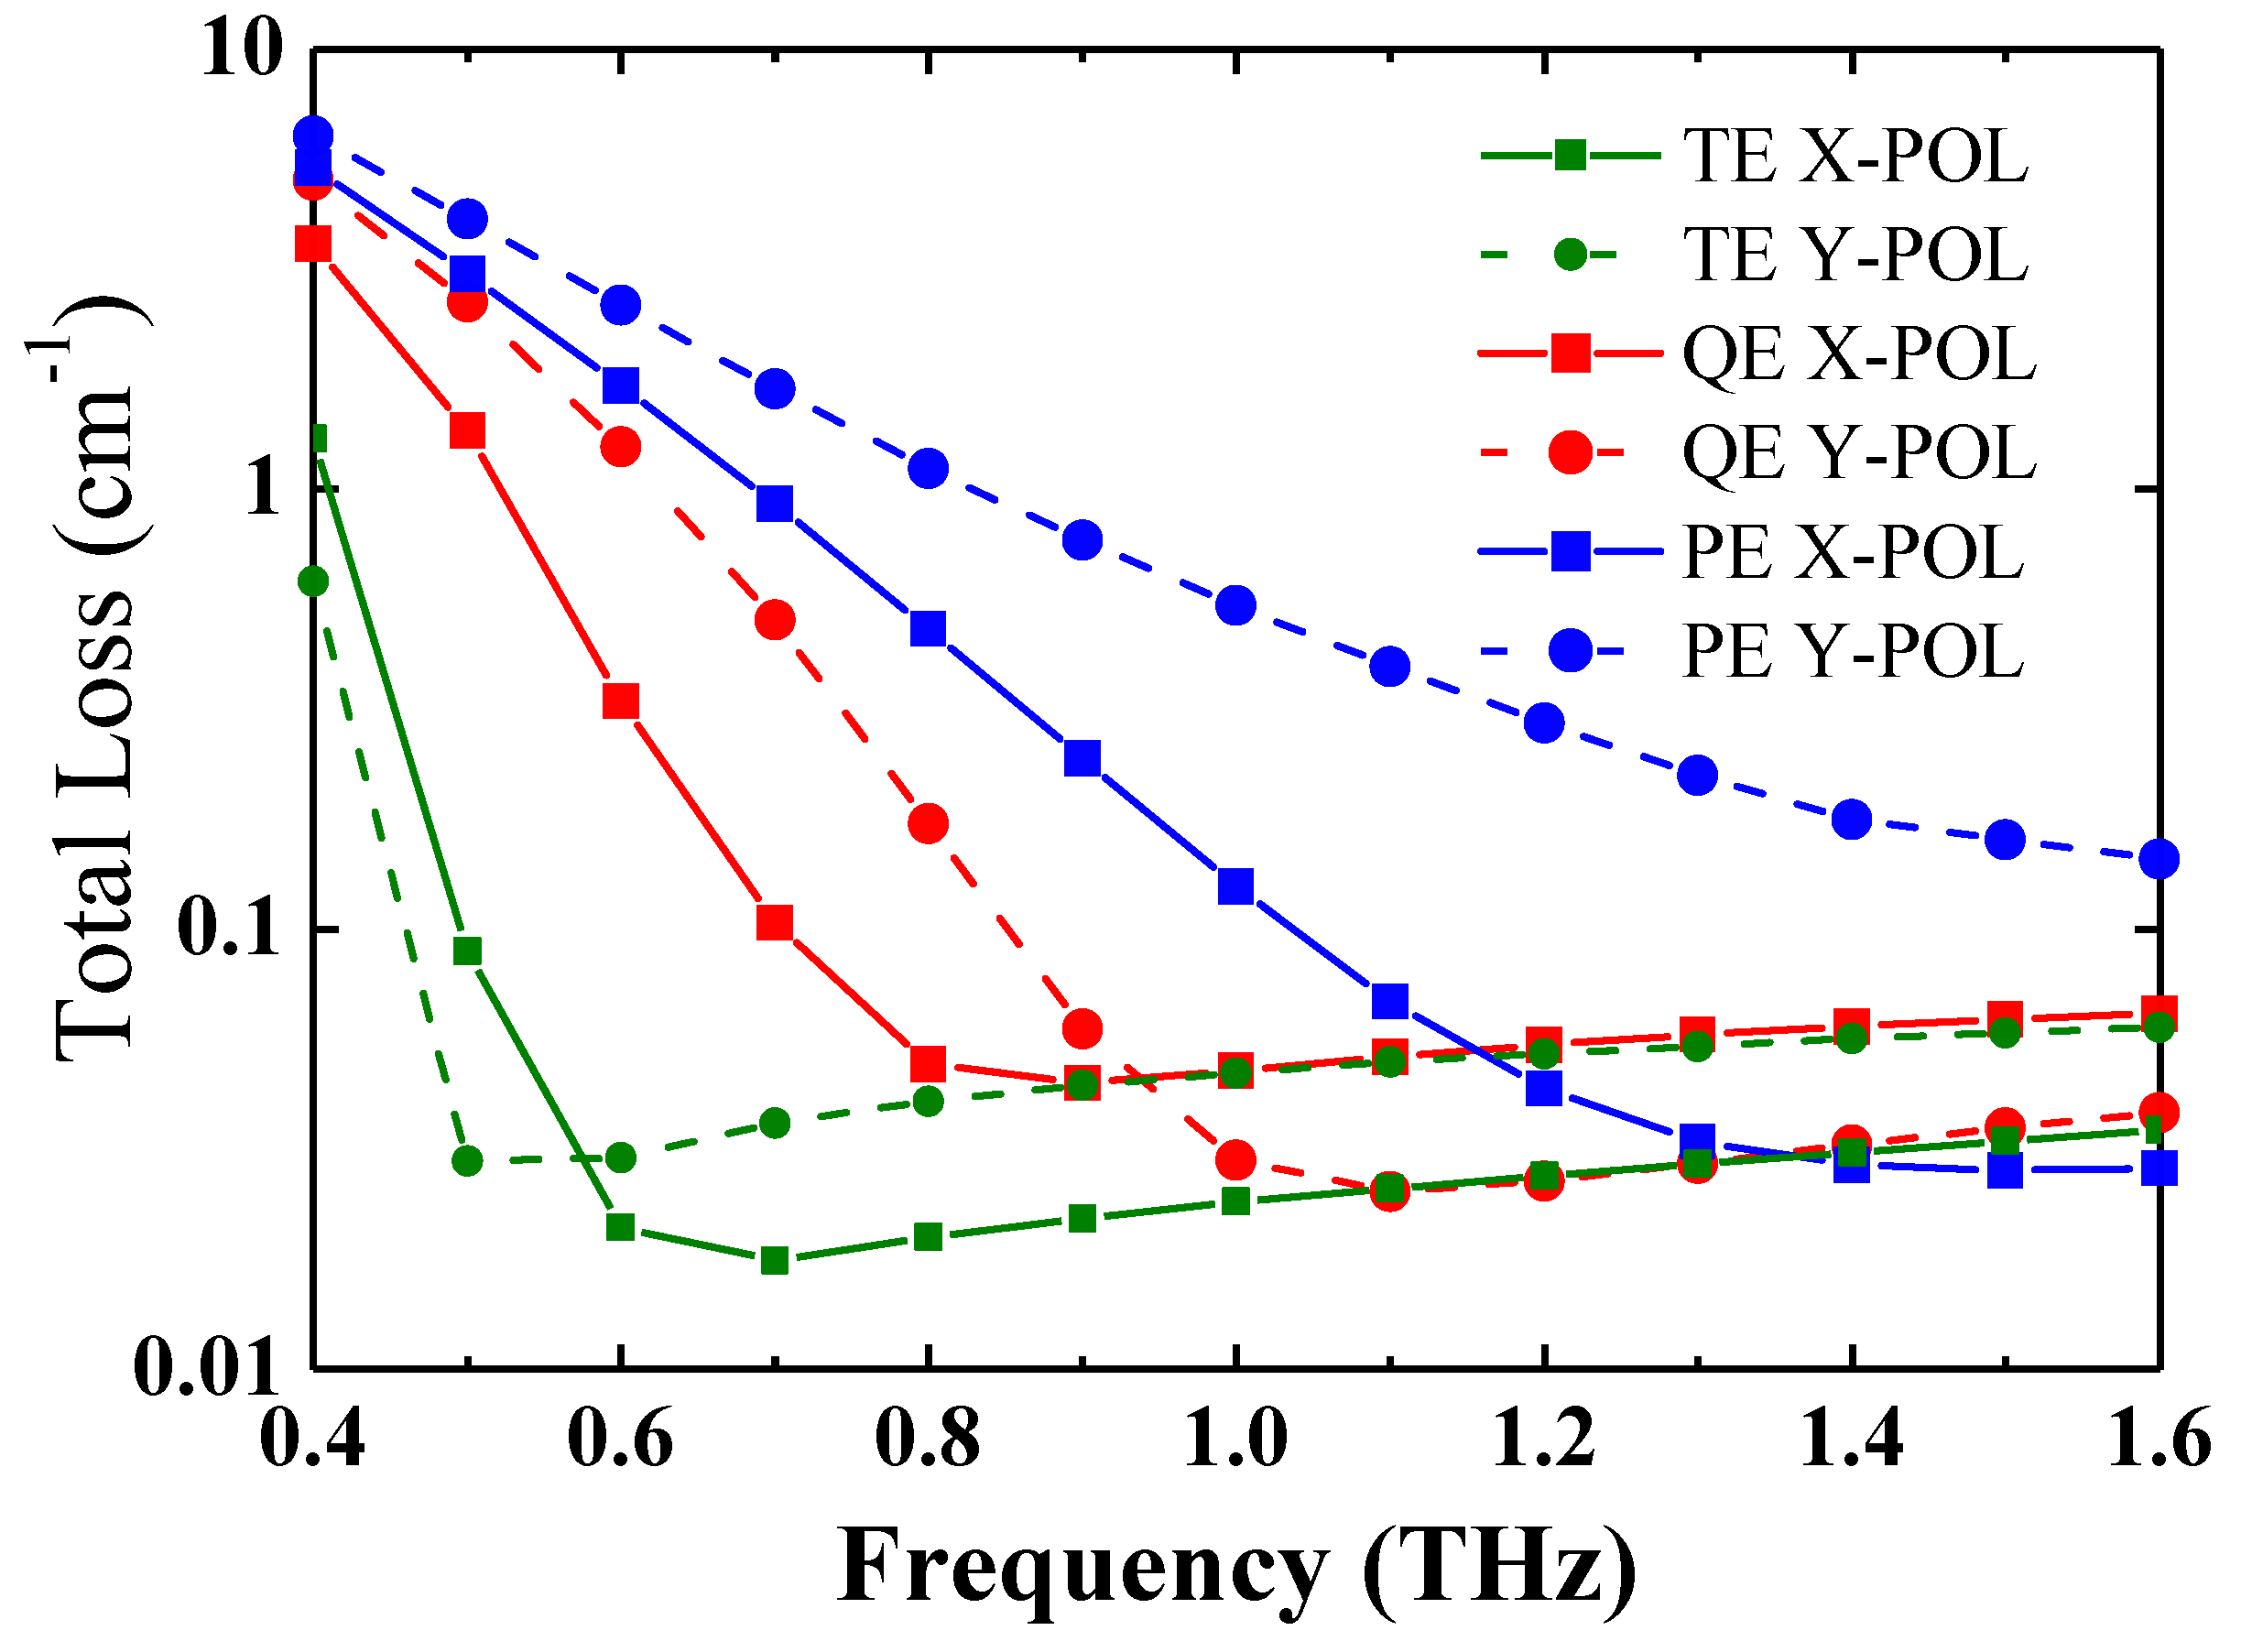
3. Comparison of TE, QE, and PE Geometries

First, a simulation was performed to demonstrate the superiority of the QE geometry over the commonly adopted TE and PE geometries. The PE design was attained simply by adding an ellipse with optimized dimensions a = 0.65 Λ and b = 0.073 Λ to the corresponding QE geometry. The TE design was attained by adding two identical elliptical air holes to both sides of the center ellipse. The electric field distributions in the core area of the TE, PE, and QE designs are shown in Figure 2 for the X-polarization (XP) and Y-polarization (YP) modes at 1.2 THz operating frequency. As illustrated in Figure 2, overall power constricts more in the TE and QE core regions than in the PE core region. Moreover, the XP modes show no apparent preference between the solid core material and elliptical air holes, whereas the YP modes are strongly confined in the elliptical air holes.
Notably, more power was distributed in the cladding in the PE design than in the TE and QE ones. These differences are owed to the increased presence of solid material in the TE and QE designs. Consequently, the core-cladding index contrast broadens, and the modified total internal reflection (MTIR) guidance improves; this condition not only reduces the confinement loss but also enhances the birefringence. Nevertheless, the graphical comparison between the TE, QE, and PE geometries shows that the QE design is superior in terms of birefringence, power fraction, and modal confinement.
The main performance determinants of the QE and PE designs, namely, birefringence, EML, Lc, and power fraction, are plotted and compared with respect to frequency in Figure 3, Figure 4, Figure 5 and Figure 6. In accordance with [39], the birefringence shown in Figure 3 is expressed as
B = | n e f f x n e f f y |
where n e f f x and n e f f y are the effective refractive indices of the x and y fundamental modes, respectively. The birefringence calculation is dominated by the real parts of the effective refractive index.
As observed in Figure 3, high birefringence was attained for all three designs, but higher birefringence was achieved with the QE design. Precisely, the birefringence was enhanced from 0.01 to 0.08, from 0.024 to 0.096, and from 0.01 to 0.031 within 0.4–1.2 THz for the TE, QE, and PE designs, respectively. At 1.2 THz operating frequency, the birefringence of the QE design was 1.2 and 3.1 times those of the TE and PE designs. The presence of solid material in the center of the QE design results in stronger geometrical asymmetry than the TE design and a higher effective index than the PE design, thereby causing higher birefringence. Moreover, an overview of the dispersion profile for TE, QE and PE designs is shown in Figure 4.
Confinement loss determines how well light is bounded within the core region. Confinement loss is generally directly related to the optical density of the core and expressed by [40]
L c ( cm 1 ) = 8.686 ( 2 π f c ) I m [ n e f f ] ×   10 2
where I m [ n e f f ] denotes the imaginary part of the refractive index of the fundamental mode, f is the transmission frequency, and c = 3 × 10⁸ ms−1 is the speed of light in free space.
The XP and YP modes of the TE and QE designs yielded visibly smaller confinement losses than did those of the PE design, as shown in Figure 5. Meanwhile, the YP modes for all designs produced high confinement loss values. The reason for the XP modes yielding much lower confinement loss than the YP modes is the former’s strong localization at the core region. As shown in Figure 2a–c, a substantial portion of the mode field is incident on both solid material and the elliptical air holes. Accordingly, their Im[neff] are infinitesimal. Figure 2d–f shows the majority of the mode field localized in the elliptical air holes; it also shows comparably weak modal confinement in the core region. Therefore, even though the Im[neff] of the YP modes are reasonably small, they are not infinitesimal. Furthermore, the presence of solid material in the center of the YP in the TE and QE designs causes the mode field propagating outside of the core region to be less than that in the YP of the PE design. This small difference in mode field localization gives rise to a larger Im[neff] value in the YP mode of the PE design than in the TE and QE designs and therefore causes the confinement loss to increase. The differences in confinement loss values between the TE, QE, and PE XP modes are due to the noticeable modal confinement difference, as shown in Figure 2a–c. Although the TE design demonstrates noticeably lower confinement loss than the QE design, the QE design also produces negligibly low confinement loss and higher birefringence.
The power fraction is a quantification of the fractional mode power propagating through the certain regions of a PC-PCF, and it is calculated as follows [41]:
η = x S z d A a l l S z d A   .
The power fractions of both modes of the TE, QE, and PE designs are shown in Figure 6. Notably, the YP modes in the TE and QE designs produced a higher core power fraction than did the XP modes. The reason for this is that more power is concentrated inside the elliptical air holes in the former than in the latter. Moreover, while the TE YP and PE XP modes reached their peak at 1.2 THz and 1.3 THz, then gradually declined, the QE YP mode peaked at 1.1 THz and also gradually declined. The reason for these gradual decreases is that mode power confinement reaches an optimum position at 1.2, 1.3, and 1.1 THz for the TE YP, PE XP, and QE YP modes, respectively. A further increase in frequency causes the mode power to leak toward the cladding and to the bulk material. A similar explanation holds for the TE XP, QE XP, and PE YP modes. At 1.2 THz operating frequency, the QE XP and YP core power fractions are 28.67% and 50.91%, respectively. Core power fractions of 29.6% and 47.3% were obtained for the TE XP and YP modes, while 42.56% and 34.02% were obtained for the PE XP and YP modes, respectively. This also shows the superiority of the QE design in terms of the core power fraction.
All materials have certain absorption losses in THz frequencies. A low EML indicates that the material substrate absorbs minimal power per unit length; the EMLs of both the QE and PE designs were calculated and shown in Figure 7 using the following expression [41]:
α e f f = ε 0 μ 0 ( mat   n mat | E | 2 α mat d A A l l S z d A )
where ε 0 and μ 0 denote the permittivity and permeability, respectively, of free space. nmat is the refractive index of the background material; in this case, 1.53 was used as the refractive index of Zeonex in the simulations. E, αmat, and Sz are the fundamental mode’s electric field, bulk material absorption loss, and Poynting vector projection in the transverse direction, respectively.
Figure 7 illustrates that the EML is higher in the XP and YP modes of the TE and QE designs than in those of the PE design. This result is due to the presence of bulk material in the core center of the TE and QE designs. Moreover, all the XP modes produced higher EML values than their corresponding YP modes because of the strong localization of power in the elliptical air holes of the YP modes, as shown in Figure 2. Even though the QE design produced higher EML values in both the XP and YP modes than did the TE and PE designs, it is clearly superior to the latter designs; this is because most of the power is propagated through the elliptical air holes in the former, thus producing superior overall mode localization. Moreover, the confinement loss was combined with the EML to produce the total loss, as shown in Figure 8. The figure clearly shows the superiority of the QE design over the PE design in terms of overall loss per unit length.
To conclude, it has been shown that the birefringence, core power fraction, and total loss of the QE design are superior to those of the TE and PE designs. The TE and QE YP mode also produce extremely low losses, particularly total losses of 0.027 cm−1 and 0.026 cm−1 at 1.2 THz operating frequency, respectively, compared to the PE YP mode, which produces a total loss of 0.29 cm−1 at the same operating frequency. Therefore, based on the demonstrated birefringence, power fraction, and total loss, subsequent simulations were based on the QE design.
The effective mode area Aeff is a quantification of the total area covered by the XP and YP modes in the transverse direction, and it is calculated using the following [40]:
A e f f = [ I ( r ) rdr ] 2 I 2 ( r ) rdr   .
Both integrations were computed over the whole fiber cross section, where I ( r ) = | E t | is the transverse electric field distribution.
The effective area is presented in Figure 9 as a function of frequency. At 1.2 THz, the effective areas for the XP and YP modes were 47,011 µm2 and 44,297 µm2, respectively. The noticeable lower effective area in the optimal mode is due to most of the light being localized at the elliptical air holes as opposed to the XP which extends further across the core region.
High dispersion reduces the information carrying capacity of PC-PCFs and must therefore be investigated. Dispersion is influenced by the waveguide and its background material. However, only waveguide dispersion is considered in this work, given that Zeonex has negligible dispersion in the frequency region of interest. The dispersion was calculated by using the following equation [41]:
β 2 = 2 c d n e f f d ω + ω c d 2 n e f f d ω 2
where ω = 2πf is the angular center frequency, c is the speed of light in free space, and neff is the effective refractive index of the fundamental mode.
The dispersion profiles of the XP and YP modes, as shown in Figure 10, are 2.28 ± 1.53 and 1.82 ± 0.51 ps/THz/cm, respectively, within the entire band of interest. Moreover, the XP and YP modes produced dispersion profiles of ps/THz/cm 1.58 ± 0.3 ps/THz/cm, and 1.96 ± 0.08 ps/THz/cm, respectively, within 0.8–1.2 THz.

4. Potential of the Proposed Fiber for Use as a Nerve Agent Sensor

The capability of the proposed QE PC-PCF for sensing chemical liquids dimethylphosporamidocyanidate (tabun n = 1.425) and isopropyl methylphosphonofluoridate (sarin n = 1.3811) was investigated. These liquids are the most toxic of chemical warfare agents; they are clear, colorless, and tasteless, thereby becoming miscible in water and most organic solvents [42,43]. The elliptical air holes were filled with the chemical warfare agents, and the fiber’s relative sensitivity was obtained by using the following expression [31]:
r ( % ) = n r n e f f × η
where nr is the liquid refractive index, neff is the effective refractive index, and η is given in Equation (3).
As explained above, the strong localization of power at the elliptical air holes is due to the presence of solid material in the core center, leading to improved MTIR light guidance. The relative sensitivity and confinement losses when the elliptical air holes were filled with tabun and sarin, for the XP and YP modes, are presented in Figure 11 and Figure 12. When the elliptical air holes were filled with tabun liquid, the fiber exhibited maximum relative sensitivities of 59.5% and 63.7% at 0.8 THz for the XP and YP modes, respectively. When filled with sarin liquid, the fiber showed maximum relative sensitivities of 54.8% and 64.4% for the XP and YP modes, respectively. Moreover, the fiber exhibited negligible confinement loss when its core air holes were filled with either nerve agent. The YP modes exhibited good relative sensitivity and negligible confinement loss. Thus, the YP mode was selected as the optimal mode of operation of the proposed sensor.
With the use of Equations (3) and (4), the EML and the fractional power flow in the chemicals for the proposed chemical sensor were calculated. The EMLs and fractional power flow in the chemicals are shown in Figure 13 and Figure 14, respectively. At 0.8 THz operating frequency, the EML values for the optimal mode when the QE core was filled with tabun and sarin liquids were 0.033 cm−1 and 0.028 cm−1, respectively. The optimal mode also exhibited the highest fractional power flow, with 59.9% and 62% of the power flowing through the tabun and sarin liquids, respectively. The noticeable difference in the EMLs and fractional power flow is due to the better MTIR guidance caused by the lower refractive index of sarin compared with that of tabun.

5. Fabrication and Practical Feasibility

Finally, it was essential to investigate the fabrication feasibility and potential applications of the proposed QE sensor. It is noteworthy that manufacturing PCFs with elliptical air holes is not a straightforward task. However, innovative technological advances in PCF fabrication have made possible the fabrication of the proposed sensor. Firstly, the QE air holes must be infiltrated with the liquid chemical such that the fiber’s functionality is unharmed. Meanwhile, the desired high relative sensitivity is obtained by maintaining as close to single-mode operation as possible. To achieve this, the cladding air holes are blocked with UV-curable adhesive using a multistep fabrication process [44]. To ensure that the cladding air holes are not infiltrated with the chemical liquids, a conventional fusion splicer can be used to thermally collapse them [44,45,46]. Some of the enabling technologies available for the fabrication of PCFs include capillary stack and draw [47], drilling [48], extrusion [49], and sol–gel casting [50]. However, capillary stack and draw, drilling, and sol–gel casting are only suitable for fabricating geometries with circular air holes [15]. Extrusion techniques, on the other hand, can be used to fabricate asymmetrical geometries. In particular, highly birefringent PCFs with elliptical air holes were experimentally characterized by Atakaramians et al. [51,52]. The first practical realization of PCFs with elliptical air holes was conducted in 2004 by Issa et al. [53]. Liu et al. [54] explored the experimental characterization of PCFs with elliptical air holes where methyl methacrylate (MMA) was employed for the fabrication. Using the extrusion method, Ruan et al. [55] and Zhang et al. [56] fabricated PCFs consisting of different sizes and shapes, including with elliptical geometry. Therefore, it is visualized that the proposed QE geometry can be experimentally characterized using any of the aforementioned fabrication methods. The proposed QE designed with air holes may be used as a fiber component of a terahertz time domain spectroscopy system for conveying terahertz pulses [57].
Similar to conventional optical fiber sensors, the performance of the proposed fiber can be assessed by its relative sensitivity and refractive index detection limit [58]. The latter is essential in refractometric sensing [20]. The refractive index of a liquid is measured using this kind of sensor by infiltrating it into the fiber’s core air holes. The refractive index of the infiltrated liquid is extracted by monitoring the variation of reflectance or transmission spectra at the operating frequency [20,59,60].

6. Conclusions

A Zeonex-based photonic crystal fiber with QE core air holes was proposed for guiding THz radiation. At 1.2 THz operating frequency, the QE core was found to be superior to the commonly known PE core structure in terms of birefringence, power fraction, and losses per unit length. Other key parameters, such as EML, effective area, and dispersion, were investigated within the 0.4–1.6 THz frequency band. Our findings showed that most of the propagated power flowed through the QE air holes in the YP mode. Moreover, the potential of the fiber for sensing chemical warfare agents was explored by filling the QE air holes with tabun and sarin liquids. The relative sensitivity, confinement loss, EML, and power fraction of the sensor were investigated for both liquids. The sensor showed highest relative sensitivity at 0.8 THz for both liquids. Therefore, the proposed fiber can be used as a THz waveguide in polarization-demanding industrial applications and as a toxic chemical liquid sensor in the security and defense industries.

Author Contributions

Conceptualization, I.Y.; methodology, I.Y.; software, I.Y., and S.F.K.; validation, I.Y., P.E.A., and F.B.; formal analysis, I.Y; investigation, I.Y., and S.F.K.; resources, W.C., P.E.A. and F.B.; data curation, I.Y.; writing—original draft preparation, I.Y.; writing—review and editing, P.E.A. and F.B.; visualization, I.Y. and S.F.K.; supervision, P.E.A. and F.B.; funding acquisition, W.C.

Funding

This research received no external funding.

Conflicts of Interest

The authors declare no conflict of interest.

References

  1. Murphy, J.; O’Sullivan, C. Terahertz Optics. Terahertz Spectroscopy and Imaging 2013, 171, 29–56. [Google Scholar]
  2. Yin, M.; Tang, S.; Tong, M. The application of terahertz spectroscopy to liquid petrochemicals detection: A review. Appl. Spectrosc. Rev. 2016, 51, 379–396. [Google Scholar] [CrossRef]
  3. Pan, R.; Zhao, S.; Shen, J. Terahertz spectra applications in identification of illicit drugs using support vector machines. Proc. Eng. 2010, 7, 15–21. [Google Scholar] [CrossRef] [Green Version]
  4. Woodward, R.M.; Wallace, V.P.; Pye, R.J.; Cole, B.E.; Arnone, D.D.; Linfield, E.H.; Pepper, M. Terahertz pulse imaging of ex vivo basal cell carcinoma. J. Invest. Dermatol. 2003, 120, 72–78. [Google Scholar] [CrossRef] [PubMed]
  5. Yang, Y. Atmospheric Effects on Free-Space THz. THz Time-Domain Spectroscopy (THz-TDS). J. Laser Opt. Photonics 2014, 1, 1–3. [Google Scholar] [CrossRef]
  6. Gallot, G.; Jamison, S.P.; McGowan, R.W.; Grischkowsky, D. Terahertz waveguides. J. Opt. Soc. Am. B 2000, 17, 851. [Google Scholar] [CrossRef]
  7. Hassani, A.; Dupuis, A.; Skorobogatiy, M. Low loss porous terahertz fibers containing multiple subwavelength holes. Appl. Phys. Lett. 2008, 92, 1–3. [Google Scholar] [CrossRef]
  8. Atakaramians, S.; Afshar, S.; Fischer, B.M.; Abbott, D.; Monro, T.M. Porous fibers: A novel approach to low loss THz waveguides. Opt. Express 2008, 16, 8845–8854. [Google Scholar] [CrossRef]
  9. Ponseca, C.S., Jr.; Pobre, R.; Estacio, E.; Sarukura, N.; Argyros, A.; Large, M.C.; van Eijkelenborg, M.A. Transmission of terahertz radiation using a microstructured polymer optical fiber. Opt. Lett. 2008, 33, 902. [Google Scholar] [CrossRef]
  10. Atakaramians, S.; Afshar, S.; Monro, T.M.; Abbott, D. Terahertz dielectric waveguides. Adv. Opt. Photonics 2013, 5, 169–215. [Google Scholar] [CrossRef]
  11. Uthman, M.; Rahman, B.M.A.; Kejalakshmy, N.; Agrawal, A.; Grattan, K.T.V. Design and characterization of low-loss porous-core photonic crystal fiber. IEEE Photonics J. 2012, 4, 2315–2325. [Google Scholar] [CrossRef]
  12. Kaijage, S.F.; Ouyang, Z.; Jin, X. Porous-core photonic crystal fiber for low loss terahertz wave guiding. IEEE Photonics Technol. Lett. 2013, 25, 1454–1457. [Google Scholar] [CrossRef]
  13. Paul, B.; Haque, M.; Ahmed, K.; Sen, S.; Kumar Paul, B.; Haque, M.A.; Ahmed, K.; Sen, S. A Novel Hexahedron Photonic Crystal Fiber in Terahertz Propagation: Design and Analysis. Photonics 2019, 6, 32. [Google Scholar] [CrossRef]
  14. Islam, M.S.; Sultana, J.; Faisal, M.; Islam, M.R.; Dinovitser, A.; Ng, B.W.-H.; Abbott, D. A modified hexagonal photonic crystal fiber for terahertz applications. Opt. Mater. (Amst) 2018, 79, 336–339. [Google Scholar] [CrossRef]
  15. Sultana, J.; Islam, M.S.; Faisal, M.; Islam, M.R.; Ng, B.W.H.; Ebendorff-Heidepriem, H.; Abbott, D. Highly birefringent elliptical core photonic crystal fiber for terahertz application. Opt. Commun. 2018, 407, 92–96. [Google Scholar] [CrossRef] [Green Version]
  16. Krohn, D.A.; MacDougall, T.W.; Mendez, A. Fiber Optic Sensors: Fundamentals and Applications; Spie Press: Bellingham, WA, USA, 2015; pp. 1–332. [Google Scholar]
  17. Chen, Z.; Hefferman, G.; Wei, T. Terahertz-Range Weak Reflection Fiber Optic Structures for Sensing Applications. IEEE J. Sel. Top. Quantum Electron. 2017, 23, 246–251. [Google Scholar] [CrossRef]
  18. Hashimoto, M.; Okada, T.; Nishina, S.; Ataka, T.; Shinohara, M.; Maehara, Y.; Irisawa, A.; Imamura, M. Failure Analysis of LSI Interconnection by Terahertz Time-Domain Reflectometry. In Proceedings of the International Symposium on the Physical and Failure Analysis of Integrated Circuits (IPFA), Marina Bay Sands, Singapore, 18–21 July 2016. [Google Scholar]
  19. De, M.; Gangopadhyay, T.K.; Singh, V.K. Prospects of photonic crystal fiber as physical sensor: An overview. Sensors (Switzerland) 2019, 19, 464. [Google Scholar] [CrossRef] [PubMed]
  20. Algorri, J.F.; Zografopoulos, D.C.; Tapetado, A.; Poudereux, D.; Sánchez-Pena, J.M. Infiltrated Photonic Crystal Fibers for Sensing Applications. Sensors (Basel) 2018, 18, 4263. [Google Scholar] [CrossRef]
  21. Islam, M.; Sultana, J.; Rifat, A.; Dinovitser, A.; Ng, B.W.H.; Abbott, D. Terahertz sensing in a hollow core photonic crystal fiber. IEEE Sens. J. 2018, 18, 4073–4080. [Google Scholar] [CrossRef]
  22. Møller, U.; Cooke, D.G.; Tanaka, K.; Jepsen, P.U. Terahertz reflection spectroscopy of Debye relaxation in polar liquids (Invited). J. Opt. Soc. Am. B 2009, 26, A113. [Google Scholar] [CrossRef]
  23. Sultana, J.; Islam, M.S.; Ahmed, K.; Dinovitser, A.; Ng, B.W.H.; Abbott, D. Terahertz detection of alcohol using a photonic crystal fiber sensor. Appl. Opt. 2018, 57, 2426–2433. [Google Scholar] [CrossRef] [PubMed]
  24. Minkovich, V.P.; Villatoro, J.; Monzón-Hernández, D.; Calixto, S.; Sotsky, A.B.; Sotskaya, L.I. Holey fiber tapers with resonance transmission for high-resolution refractive index sensing. Opt. Express 2005, 13, 7609–7614. [Google Scholar] [CrossRef] [PubMed]
  25. Wu, D.K.C.; Kuhlmey, B.T.; Eggleton, B.J. Ultrasensitive photonic crystal fiber refractive index sensor. Opt. Lett. 2009, 34, 322–324. [Google Scholar] [CrossRef] [PubMed]
  26. Luan, F.; George, A.K.; Hedley, T.D.; Pearce, G.J.; Bird, D.M.; Knight, J.C.; Russell, P.S.J. All-solid photonic bandgap fiber. Opt. Lett. 2004, 29, 2369–2371. [Google Scholar] [CrossRef] [PubMed]
  27. Ortigosa-Blanch, A.; Knight, J.C.; Wadsworth, W.J.; Arriaga, J.; Mangan, B.J.; Birks, T.A.; Russell, P.S.J. Highly birefringent photonic crystal fibers. Opt. Lett. 2000, 25, 1325. [Google Scholar] [CrossRef]
  28. Gangwar, R.K.; Bhardwaj, V.; Singh, V.K. Magnetic field sensor based on selectively magnetic fluid infiltrated dual-core photonic crystal fiber. Opt. Eng. 2016, 55, 026111. [Google Scholar] [CrossRef]
  29. Yuan, W.; Town, G.E.; Bang, O. Refractive index sensing in an all-solid twin-core photonic bandgap fiber. IEEE Sens. J. 2010, 10, 1192–1199. [Google Scholar] [CrossRef]
  30. Islam, M.S.; Sultana, J.; Ahmed, K.; Islam, M.R.; Dinovitser, A.; Ng, B.W.H.; Abbott, D. A novel approach for spectroscopic chemical identification using photonic crystal fiber in the terahertz regime. IEEE Sens. J. 2018, 18, 575–582. [Google Scholar] [CrossRef]
  31. Rana, S.; Kandadai, N.; Subbaraman, H. A Highly Sensitive, Polarization Maintaining Photonic Crystal Fiber Sensor Operating in the THz Regime. Photonics 2018, 5, 40. [Google Scholar] [CrossRef]
  32. Islam, M.S.; Sultana, J.; Dinovitser, A.; Ahmed, K.; Ng, B.W.H.; Abbott, D. Sensing of toxic chemicals using polarized photonic crystal fiber in the terahertz regime. Opt. Commun. 2018, 426, 341–347. [Google Scholar] [CrossRef]
  33. Ferraro, A.; Zografopoulos, D.C.; Missori, M.; Peccianti, M.; Caputo, R.; Beccherelli, R. Flexible terahertz wire grid polarizer with high extinction ratio and low loss. Opt. Lett. 2016, 41, 2009–2012. [Google Scholar] [CrossRef] [PubMed] [Green Version]
  34. Ferraro, A.; Zografopoulos, D.C.; Caputo, R.; Beccherelli, R. Guided-mode resonant narrowband terahertz filtering by periodic metallic stripe and patch arrays on cyclo-olefin substrates. Sci. Rep. 2018, 8, 17272. [Google Scholar] [CrossRef] [PubMed]
  35. TOPAS Advanced Polymers GmbH, TOPAS® COC (cyclic olefin copolymer). Available online: https://www.polyplastics-global.com/en/product/topas.html (accessed on 22 May 2019).
  36. Emiliyanov, G.; Jensen, J.B.; Bang, O.; Hoiby, P.E.; Pedersen, L.H.; Kjaer, E.M.; Lindvold, L. Localized biosensing with Topas microstructured polymer optical fiber. Opt. Lett. 2007, 32, 460–462. [Google Scholar] [CrossRef] [PubMed]
  37. Yuan, W.; Khan, L.; Webb, D.J.; Kalli, K.; Rasmussen, H.K.; Stefani, A.; Bang, O. Humidity insensitive TOPAS polymer fiber Bragg grating sensor. Opt. Express 2011, 19, 19731–19739. [Google Scholar] [CrossRef] [PubMed] [Green Version]
  38. Woyessa, G.; Fasano, A.; Markos, C.; Stefani, A.; Rasmussen, H.K.; Bang, O. Zeonex microstructured polymer optical fiber: Fabrication friendly fibers for high temperature and humidity insensitive Bragg grating sensing. Opt. Mater. Express 2016, 7, 286–295. [Google Scholar] [CrossRef]
  39. Luo, J.; Tian, F.; Qu, H.; Li, L.; Zhang, J.; Yang, X.; Yuan, L. Design and numerical analysis of a THz square porous-core photonic crystal fiber for low flattened dispersion, ultrahigh birefringence. Appl. Opt. 2017, 56, 6993–7001. [Google Scholar] [CrossRef] [PubMed]
  40. Begum, F.; Abas, P.E. Near Infrared Supercontinuum Generation In Silica Based Photonic Crystal Fiber. Prog. Electromagn. Res. C 2019, 89, 149–159. [Google Scholar] [CrossRef]
  41. Yakasai, I.K.; Abas, P.E.; Ali, S.; Begum, F. Modelling and simulation of a porous core photonic crystal fibre for terahertz wave propagation. Opt. Quantum Electron. 2019, 51, 122. [Google Scholar] [CrossRef]
  42. National Research Council (USA). Subcommittee on Acute Exposure Guideline Levels. In Acute Exposure Guideline Levels for Selected Airborne Chemicals; National Academy Press: Washington, DC, USA, 2003; ISBN 0309515904. [Google Scholar]
  43. Theriault, J.-M.; Jensen, J.O. Spectral Sensing Research for Surface and Air Monitoring in Chemical, Biological and Radiological Defense and Security Applications; Selected Topics in Electronics and Systems; WORLD SCIENTIFIC Publishing: Singapore, 2009; Volume 49, ISBN 978-981-283-591-8. [Google Scholar]
  44. Huang, Y.; Xu, Y.; Yariv, A. Fabrication of functional microstructured optical fibers through a selective-filling technique. Appl. Phys. Lett. 2004, 85, 5182–5184. [Google Scholar] [CrossRef] [Green Version]
  45. Nielsen, K.; Noordegraaf, D.; Sørensen, T.; Bjarklev, A.; Hansen, T.P. Selective filling of photonic crystal fibres. J. Opt. A Pure Appl. Opt. 2005, 7, L13. [Google Scholar] [CrossRef]
  46. Xiao, L.; Jin, W.; Demokan, M.S.; Ho, H.L.; Hoo, Y.L.; Zhao, C. Fabrication of selective injection microstructured optical fibers with a conventional fusion splicer. Opt. Express 2005, 13, 9014–9022. [Google Scholar] [CrossRef] [PubMed]
  47. Amouzad Mahdiraji, G.; Chow, D.M.; Sandoghchi, S.R.; Amirkhan, F.; Dermosesian, E.; Yeo, K.S.; Kakaei, Z.; Ghomeishi, M.; Poh, S.Y.; Yu Gang, S.; et al. Challenges and Solutions in Fabrication of Silica-Based Photonic Crystal Fibers: An Experimental Study. Fiber Integr. Opt. 2014, 33, 85–104. [Google Scholar] [CrossRef]
  48. Petrovich, N.; van Brakel, A.; Poletti, F.; Mukasa, K.; Austin, E.; Finazzi, V.; Petropoulos, P.; O’Driscoll, E.; Watson, M.; DelMonte, T.; et al. Microstructured Fibers for Sensing Applications. Photonic Crystals and Photonic Crystal Fibers for Sensing Applications 2005, 60050. [Google Scholar]
  49. Ebendorff-Heidepriem, H.; Monro, T.M.; van Eijkelenborg, M.A.; Large, M.C.J. Extruded high-NA microstructured polymer optical fibre. Opt. Commun. 2007, 273, 133–137. [Google Scholar] [CrossRef]
  50. Bise, T.; Trevor, D.J. Sol-gel derived microstructured fiber: Fabrication and characterization. Optical Fiber Communication Conference 2005, 11–13. [Google Scholar]
  51. Atakaramians, S.; Afshar, V.S.; Fischer, B.M.; Abbott, D.; Monro, T.M. Low loss, low dispersion and highly birefringent terahertz porous fibers. Opt. Commun. 2009, 282, 36–38. [Google Scholar] [CrossRef] [Green Version]
  52. Atakaramians, S.; Afshar, V.S.; Ebendorff-Heidepriem, H.; Nagel, M.; Fischer, B.M.; Abbott, D.; Monro, T.M. THz porous fibers: Design, fabrication and experimental characterization. Opt. Express 2009, 17, 14053–15062. [Google Scholar] [CrossRef]
  53. Issa, N.A.; van Eijkelenborg, M.A.; Fellew, M.; Cox, F.; Henry, G.; Large, M.C.J. Fabrication and study of microstructured optical fibers with elliptical holes. Opt. Lett. 2004, 29, 1336. [Google Scholar] [CrossRef]
  54. Liu, F.; Gao, H.Y.; Xu, Q.; Zhang, Y.N. Fabrication and Characteristics of Elliptical-Holes and near Elliptical Core Hexangular Lattice Photonic Crystal Fibers Based on Polymer. Adv. Mater. Res. 2011, 279, 151–156. [Google Scholar] [CrossRef]
  55. Ruan, Y.; Ebendorff-Heidepriem, H.; Afshar, S.; Monro, T.M. Light confinement within nanoholes in nanostructured optical fibers. Opt. Express 2010, 18, 26018–26026. [Google Scholar] [CrossRef]
  56. Zhang, W.Q.; Ebendorff-Heidepriem, H.; Monro, T.M.; Afshar, V.S. Fabrication and supercontinuum generation in dispersion flattened bismuth microstructured optical fiber. Opt. Express 2011, 19, 21135. [Google Scholar] [CrossRef] [PubMed]
  57. Walther, M.; Fischer, B.M.; Ortner, A.; Bitzer, A.; Thoman, A.; Helm, H. Chemical sensing and imaging with pulsed terahertz radiation. Anal. Bioanal. Chem. 2010, 397, 1009–1017. [Google Scholar] [CrossRef] [PubMed]
  58. Kuhlmey, B.T.; Eggleton, B.J.; Wu, D.K.C. Fluid-filled solid-core photonic bandgap fibers. J. Light. Technol. 2009, 27, 1617–1630. [Google Scholar] [CrossRef]
  59. Yong, D.; Ng, W.L.; Yu, X.; Chan, C.C. A compact opto-fluidic platform for chemical sensing with photonic crystal fibers. Sensors Actuators A Phys. 2013, 191, 22–26. [Google Scholar] [CrossRef]
  60. You, B.; Lu, J.-Y. Terahertz Fiber Sensing. In Terahertz Spectroscopy—A Cutting Edge Technology; InTech: London, UK, 2017. [Google Scholar]
Figure 1. Geometrical cross section of the proposed tri-elliptical (TE), quad-elliptical (QE), and penta-elliptical (PE) porous core photonic crystal fibers (PC-PCFs). PML, perfectly matched layer.
Photonics 06 00078 g001
Figure 2. Electric field distribution at 1.2 THz operating frequency of the (a) TE X-polarization (XP) mode, (b) QE X-polarization mode, (c) PE X-polarization mode, (d) TE Y-polarization (YP) mode, (e) QE Y-polarization mode, and (f) PE Y-polarization mode with arrows indicating the direction of the electric field oscillation.
Photonics 06 00078 g002
Figure 3. Response of the TE, QE, and PE designs to birefringence.
Photonics 06 00078 g003
Figure 4. Dispersion profile of the XP and YP modes for the TE, QE, and PE designs.
Photonics 06 00078 g004
Figure 5. Response of confinement loss to frequency for the TE, QE, and PE designs.
Photonics 06 00078 g005
Figure 6. Fractional power flow in relation to frequency for the TE, QE, and PE designs.
Photonics 06 00078 g006
Figure 7. Response of effective material loss (EML) to frequency for the TE, QE, and PE designs.
Photonics 06 00078 g007
Figure 8. Response of total loss to frequency for the TE, QE, and PE designs.
Photonics 06 00078 g008
Figure 9. Response of effective area and bending loss to frequency for the QE XP and YP modes.
Photonics 06 00078 g009
Figure 10. Dispersion profile of the QE design.
Photonics 06 00078 g010
Figure 11. Relative sensitivity and confinement loss of the proposed sensor when the QE air holes were filled with tabun liquid.
Photonics 06 00078 g011
Figure 12. Relative sensitivity and confinement loss of the proposed sensor when the QE air holes were filled with sarin liquid.
Photonics 06 00078 g012
Figure 13. EML and fractional power flow of the proposed sensor when the QE air holes were filled with tabun liquid.
Photonics 06 00078 g013
Figure 14. EML and fractional power flow of the proposed sensor when the QE air holes were filled with sarin liquid.
Photonics 06 00078 g014

