Article

Influence of Ethanol on Breath Acetone Measurements Using an External Cavity Quantum Cascade Laser

Department of Molecular & Laser Physics, IMM, Radboud University, Heyendaalseweg 135, 6525 AJ, Nijmegen, The Netherlands
*
Author to whom correspondence should be addressed.
Photonics 2016, 3(2), 22; https://doi.org/10.3390/photonics3020022
Submission received: 31 March 2016 / Revised: 22 April 2016 / Accepted: 24 April 2016 / Published: 27 April 2016
(This article belongs to the Special Issue Quantum Cascade Lasers - Advances and New Applications)

Abstract

:
Broadly tunable external cavity quantum cascade lasers (EC-QCLs) in combination with off-axis integrated cavity enhanced spectroscopy (OA-ICOS) provide high molecular gas sensitivity and selectivity. We used an EC-QCL in the region of 1150–1300 cm−1 in both broadband scan mode, as well as narrow scanning mode around 1216 cm−1, respectively, for detection of acetone in exhaled breath. This wavelength region is essential for accurate determination of breath acetone due to the relative low spectral influence of other endogenous molecules like water, carbon dioxide or methane. We demonstrated that ethanol has a strong spectroscopic influence on the acetone concentration in exhaled breath, an important detail that has been overlooked so far. An ethanol correction is proposed and validated with the reference measurements from a proton-transfer reaction mass spectrometer (PTR-MS) for the same breath samples from ten persons. With the ethanol correction, both broadband and narrowband molecular spectroscopy represent an attractive way to accurately assess the exhaled breath acetone. The importance of considering spectroscopic ethanol influence is essential, especially for the narrowband scans, (e.g., 1216 cm−1), for which the error in determining the acetone concentrations can rise up to 39% if it is not considered.

Graphical Abstract

1. Introduction

Accurate determination of concentration levels of metabolites in human breath offers a valuable non-invasive way for disease diagnosis and metabolic status monitoring [1]. Normal human breath contains common atmospheric gases such as H2O, CO2, N2 and O2 in relatively high concentrations, and hundreds of volatile organic compounds (VOCs), among which acetone and ethanol are two examples of the most abundant ones with levels varying from tens of parts-per-billion volume (ppbv) to parts-per-million volume (ppmv) [1,2].
Acetone may represent a promising alternative for metabolic monitoring, providing real-time information on fat burning [3]. Elevated breath acetone concentrations have been reported in patients presenting with diabetes [4], persons dieting (i.e., Atkins Diet) or fasting [5,6], persons after exercising [7] or in patients after cardiovascular surgery due to metabolic stress [8].
Turner et al. [9] performed longitudinal studies of acetone and endogenous ethanol production in the breath of 30 healthy volunteers over a six-month period using selected ion flow tube mass spectrometry (SIFT-MS). The acetone concentration ranged from 100 ppbv to more than 1 ppmv, while ethanol ranged from 0 to 380 ppbv. Generally, the reported acetone concentrations in breath in literature vary from 0.15 to 2.7 ppmv with an overall mean of 0.5 ppmv [9,10] and for ethanol from 0.01 to 1.2 ppmv and with a mean of ~0.2 ppmv [11].
Laser-based absorption spectroscopy has advanced over the last few decades such that it allows highly sensitive, selective, real-time, and accurate measurements of compounds in breath for clinical testing [2,12]. It can be performed either via narrow frequency scanning or broadband tuning. When performing the former, external cavity lasers are used in the same manner as distributed feedback (DFB) lasers: the laser frequency scans over a single spectral absorption line of the molecule of interest within a limited wavelength range (~2–5 cm−1). The use of external cavity lasers (ECL) in such a narrow-scan mode offers some advantages over DFB lasers; as the overall tuning range of the ECL (>150 cm−1) is much larger than of a single DFB laser the selection of molecular interference-free regions is easier. In addition, detection of multi-species absorbers is possible by changing the ECL center wavelength. Overall, external cavity quantum cascade lasers (EC-QCLs) [13,14,15] represents a light source with high power, broad tuning range, narrow linewidth, and rapid wavelength tuning for the sensitive and accurate detection of trace gases like in breath analysis [16,17]. Examples of applications using EC-QCLs in narrowband absorption include detection of exhaled acetone [18,19], ammonia [20] and nitric oxide [21].
Broadband tuning allows the detection of larger molecules with dense ro-vibrational transitions as well as complex shape and broader spectral features. In these cases, a measurement of the detailed shape of the absorption spectrum over a wider wavelength range provides the ability to distinguish between different molecules based on comparison to reference library spectra. Combining QCLs with an external cavity offers a substantially enlarged tuning range compared to DFB-QCLs and facilitates the evaluation of broader absorption features, thereby minimizing the effect of line-broadening during the quantitative data evaluation. While the tuning range of a single EC-QCL is much smaller than a Fourier transform infrared (FT-IR) spectrometer, it is still sufficient to capture enough detail in the absorption spectra for reliable identification of large molecules in the gas-phase or many condensed-phase materials. Examples of EC-QCLs measuring broadband absorption spectra include the detection of ethane using wavelength modulation spectroscopy with a sensitivity of 100 ppbv [22], Freon 125 with quartz enhanced photoacoustic spectroscopy (QEPAS) [23] and fluorocarbons at low ppbv levels in real-time [24].
In both near-IR and mid-IR wavelength regions, acetone has strong absorption bands which overlap with those of ethanol. Interestingly, ethanol has not been included so far in the spectroscopic analysis of breath acetone. In consequence, this motivates the aim of the present study to investigate the effect of ethanol on the quantification of acetone levels in exhaled breath.
The present work combines a continuous-wave (cw) external cavity quantum cascade laser, described in detail elsewhere [17], operating between 1120 and 1450 cm−1 with off-axis integrated cavity output spectroscopy (OA-ICOS) [25,26,27]. This region is well suited for monitoring breath acetone given the relative low spectral influence of other substances in exhaled human breath, such as carbon dioxide, water vapor, methane, and ethanol at endogenous levels.
The EC-QCL has been used in a broadband-scan mode for the region of 1150–1300 cm−1, as well as in narrowband-scan mode around 1216 cm−1.

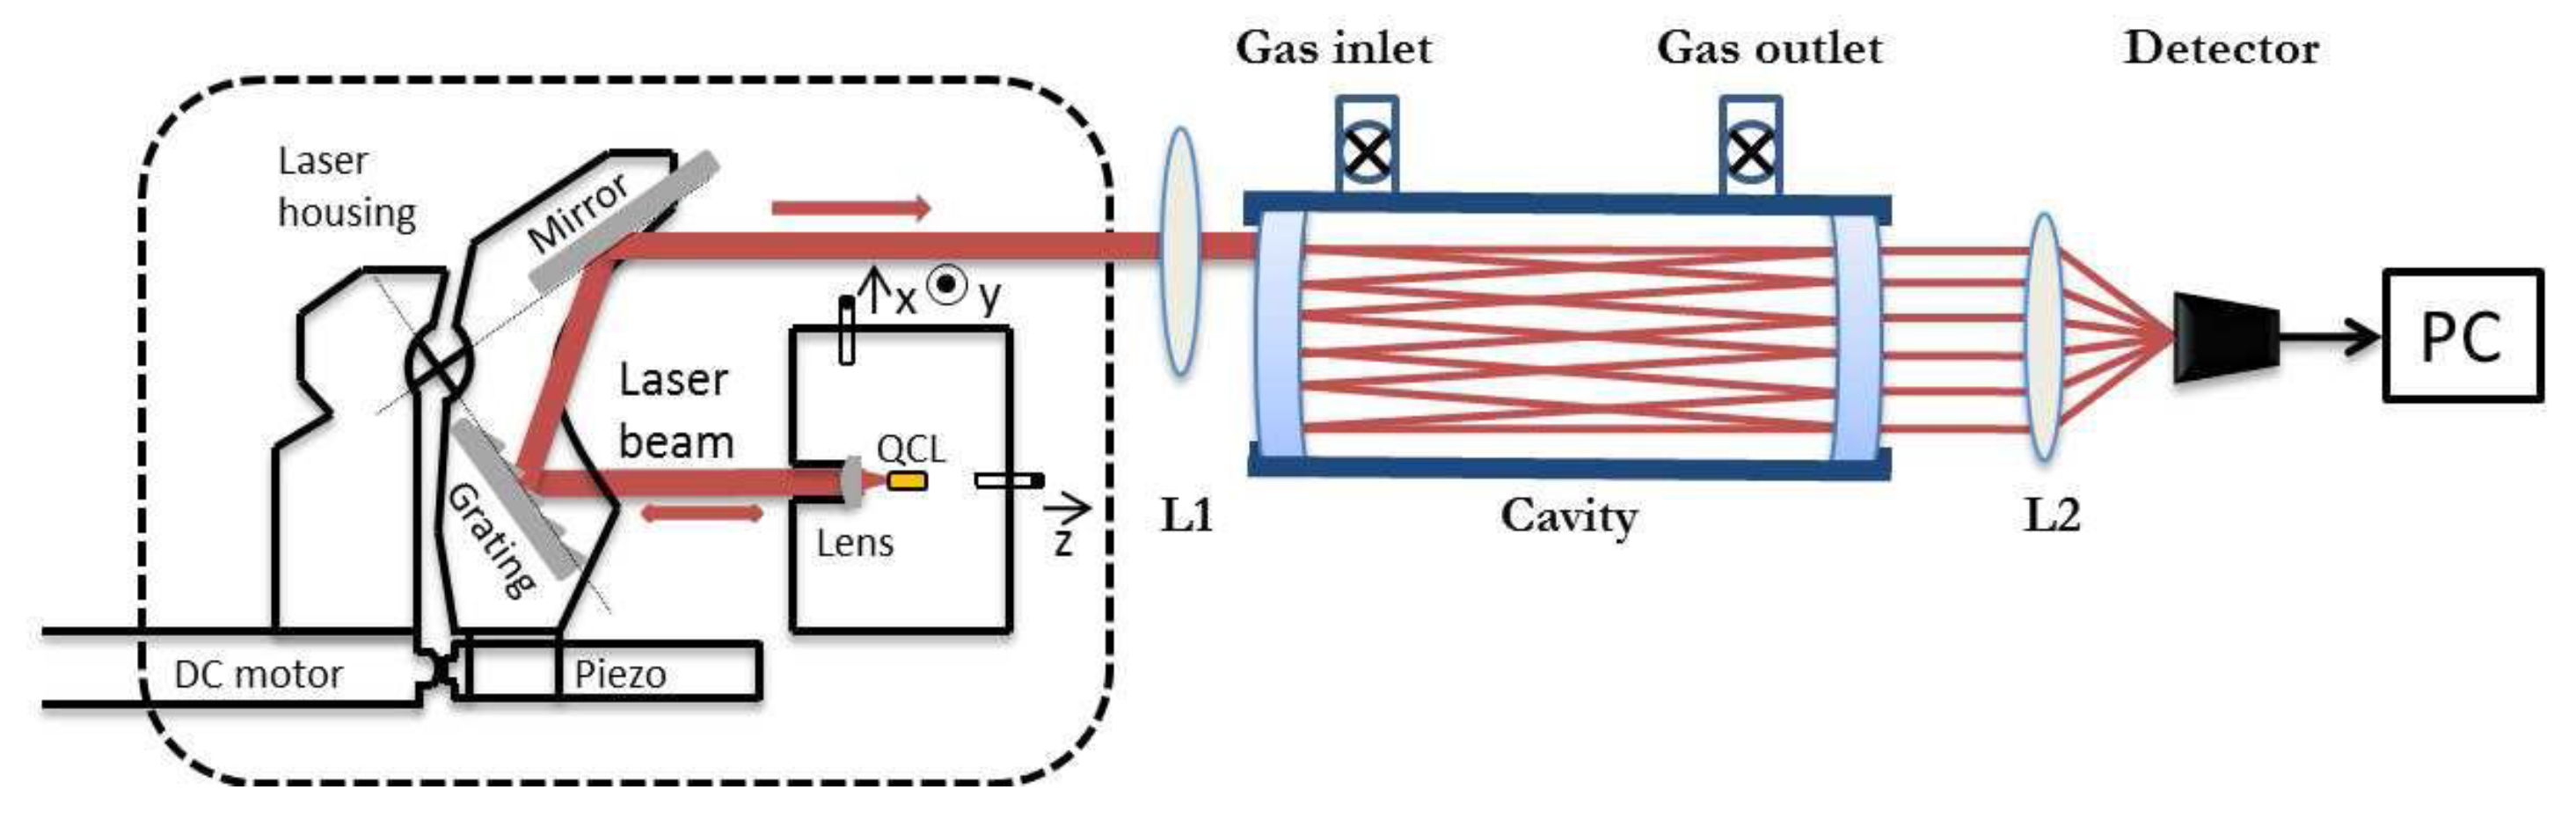
2. Experimental Setup

The experimental setup has been described in details previously [17]. In short, a home-made widely tunable EC-QCL (1129–1432 cm−1) with a maximum power output of 200 mW was combined with Off-Axis Integrated Cavity Output Spectroscopy (OA-ICOS) (Figure 1) [21,28]. The optical cavity had a length of 30 cm with two high reflective mirrors (radius of curvature 1 m, diameter 25 mm, reflectivity 99.97%, CRD Optics, Fort Bragg, CA, USA), which resulted in an effective path length of 1 km. A sinusoidal current modulation of 116 kHz (amplitude of 100 mV) was applied to the QCL. The light after the cavity was collected with a ZnSe lens (f = 5 cm, diameter 25 mm) and directed onto a sensitive infrared detector (PVI-4TE-10.6, VIGO System SA, Vigo, Poland, bandwidth 100 MHz, sensitivity 1.8 × 1010 cm·Hz1/2/W).
Broadband absorption spectra were obtained by rapid coarse tuning of the grating with a DC motor, covering the acetone and ethanol absorption bands between 1150–1300 cm−1 in 3 s. Each spectrum was scanned 10 times and the detector signal was sent via a lock-in amplifier (τ = 100 ms) to a data acquisition card (NI PCI-6259, National Instruments, Austin, TX, USA). The narrowband spectra were measured by a 50 Hz scan of the grating piezo of the laser covering 0.3 cm−1 for an integration time of 1 s.

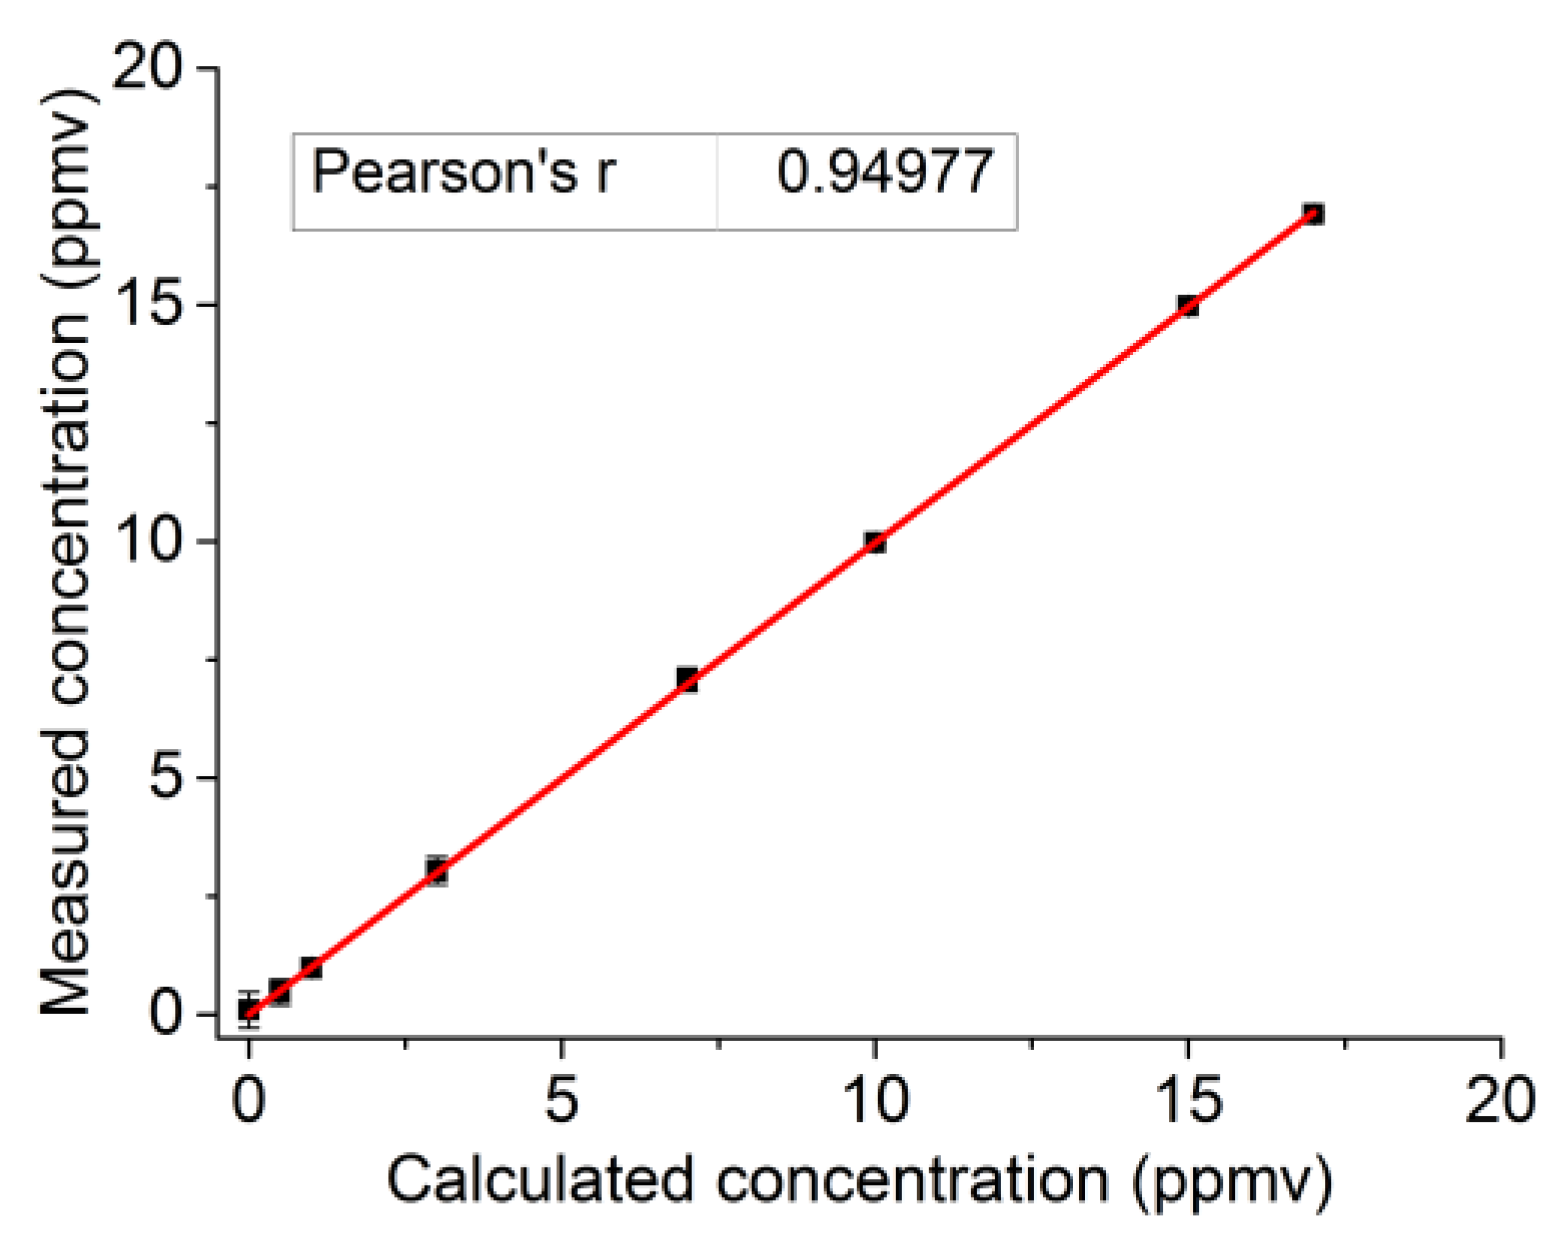
3. Calibration and Detection Limit

For system calibration, a reference homemade gas mixture of 17 ± 0.06 ppmv acetone in nitrogen (N2) was used. Background signals were established by flushing the cell with nitrogen gas and various concentrations were applied with a dynamic flow system of two mass flow controllers (Brooks Instruments, Ede, The Netherlands).
Acetone concentration was determined by scanning the laser over the spectral region from 1150 to 1300 cm−1 and applying a linear fit to the measured signal versus the reference signal corresponding to 17 ppmv acetone in N2 (both background subtracted). The unknown concentration is retrieved by multiplying the reference concentration by the first-order coefficient of the linear fit.
The resulting calibration curve for acetone is shown in Figure 2, where the measured concentrations are plotted against the calculated one from the mixing ratio with N2. The linear fit yields a Pearson coefficient of r = 0.95. Based on these results, the system shows linearity over a wide range of concentrations and the detection limit of the system was estimated at ~30 ppbv acetone for 30 s integration time.

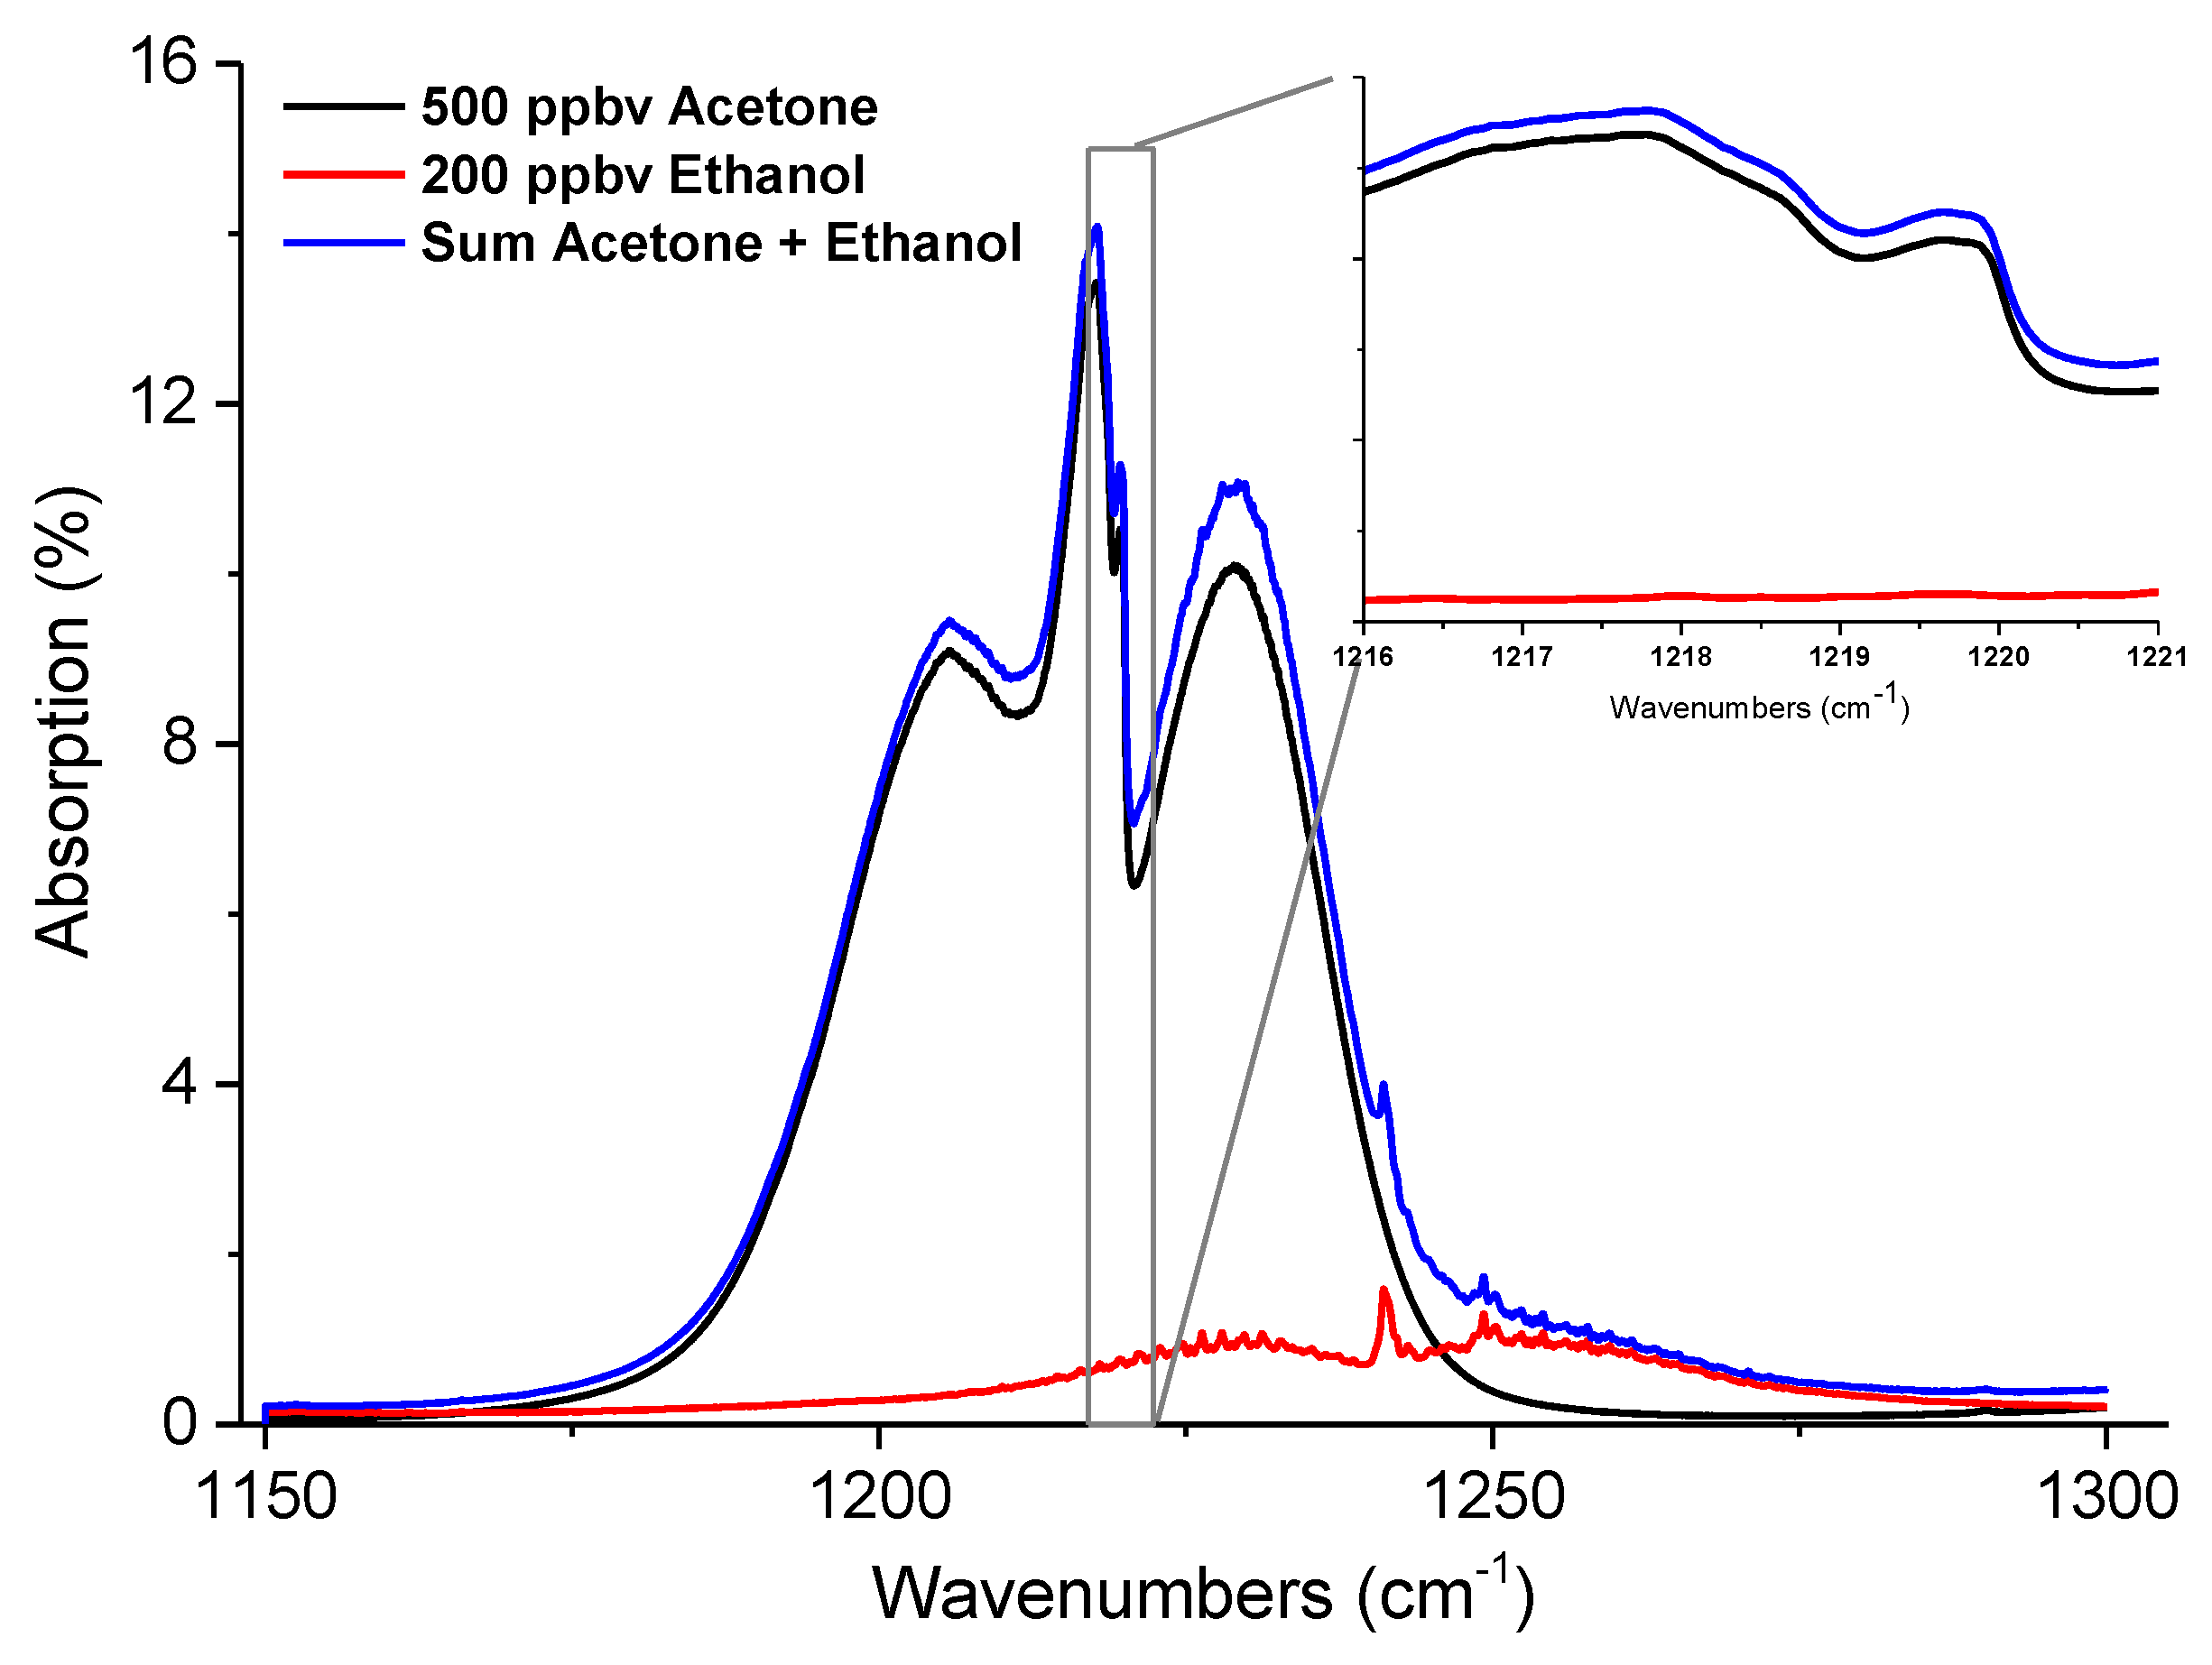
4. Ethanol Influence on Detection of Exhaled Acetone

Figure 3 shows a simulated absorption profile of 500 ppbv acetone and 200 ppbv ethanol in the region of 1150–1300 cm−1 for a path length of 1 km at a pressure of 1 atm. The inset in the top right corner shows the region of 1216.5 cm−1 and 1220 cm−1 that was proposed for breath acetone analysis earlier [18]. Although this wavelength region was chosen because of the minimal spectroscopic interference from water and CO2, the contribution of ethanol results in an elevated absorption line without any significant lineshape change. The relative error for this region and the chosen concentrations is about 5%. Furthermore, the contribution of ethanol is visible for the entire broadband scan region, resulting in an overestimated acetone concentration. This overestimation can be quite significant since inter person variability of ethanol and acetone in exhaled breath may vary greatly.
Therefore, for accurate determination of acetone in exhaled breath, ethanol contribution must be considered for both broadband as well as narrowband scans and corrections should be applied.

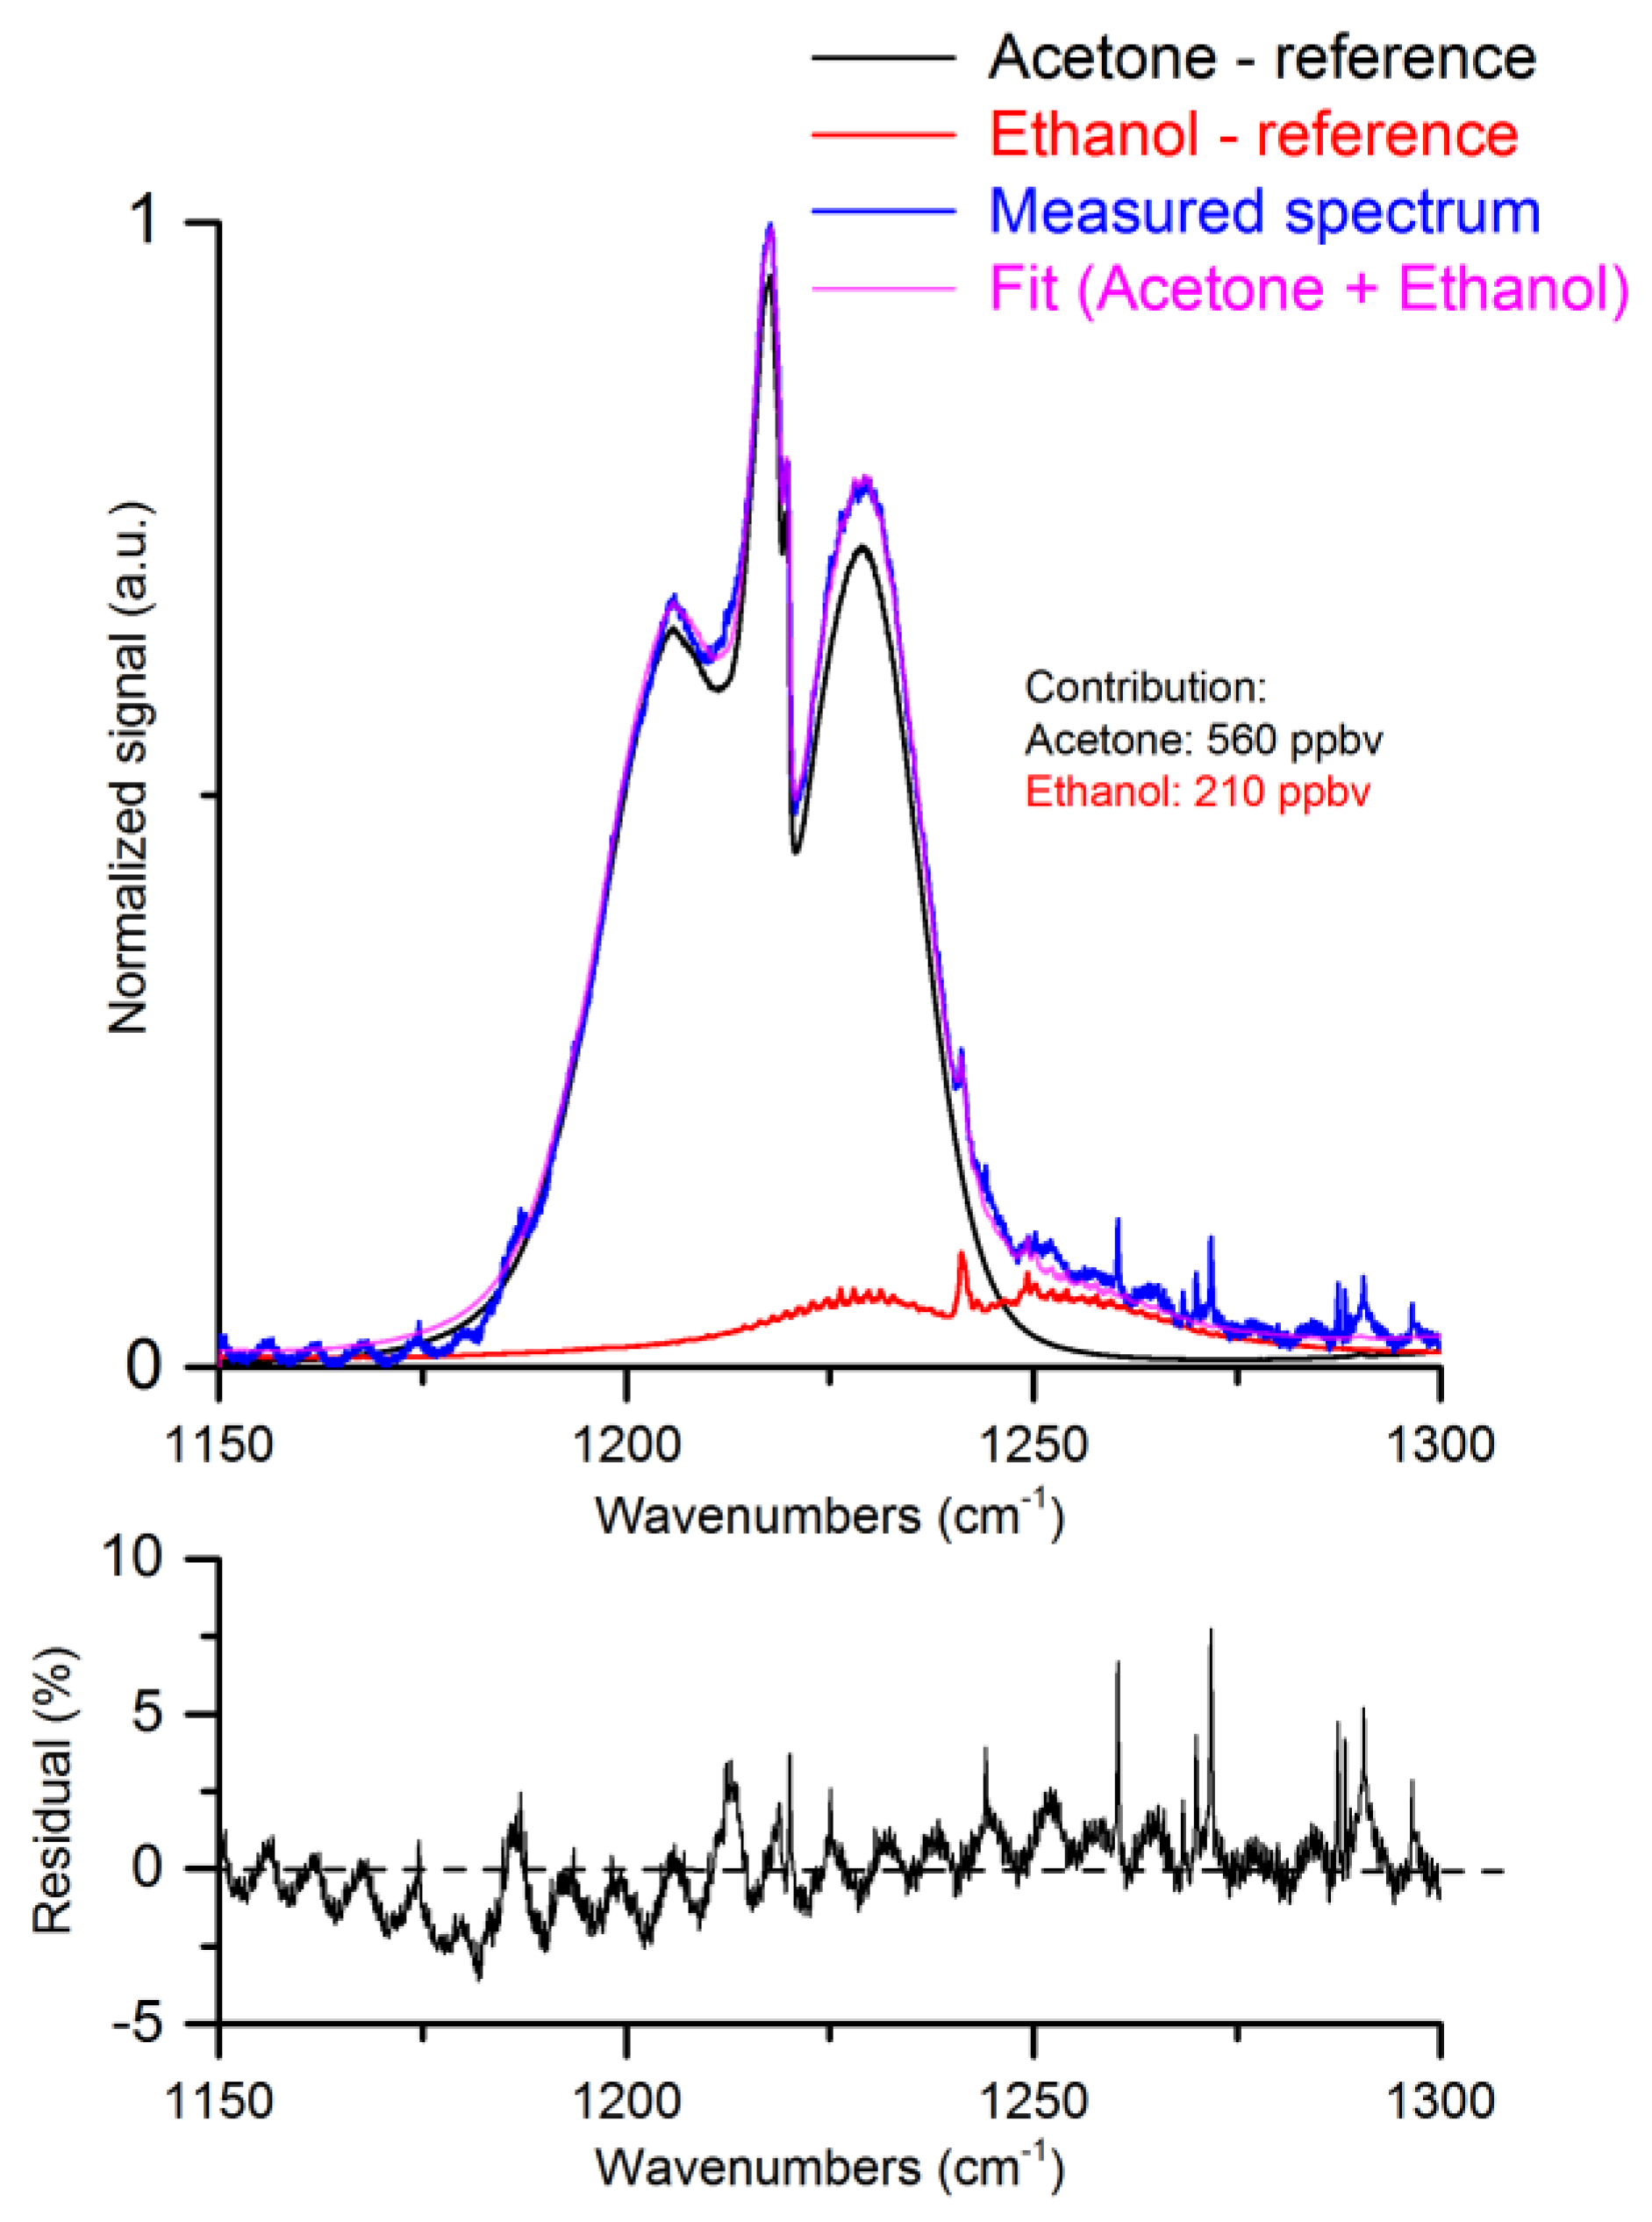
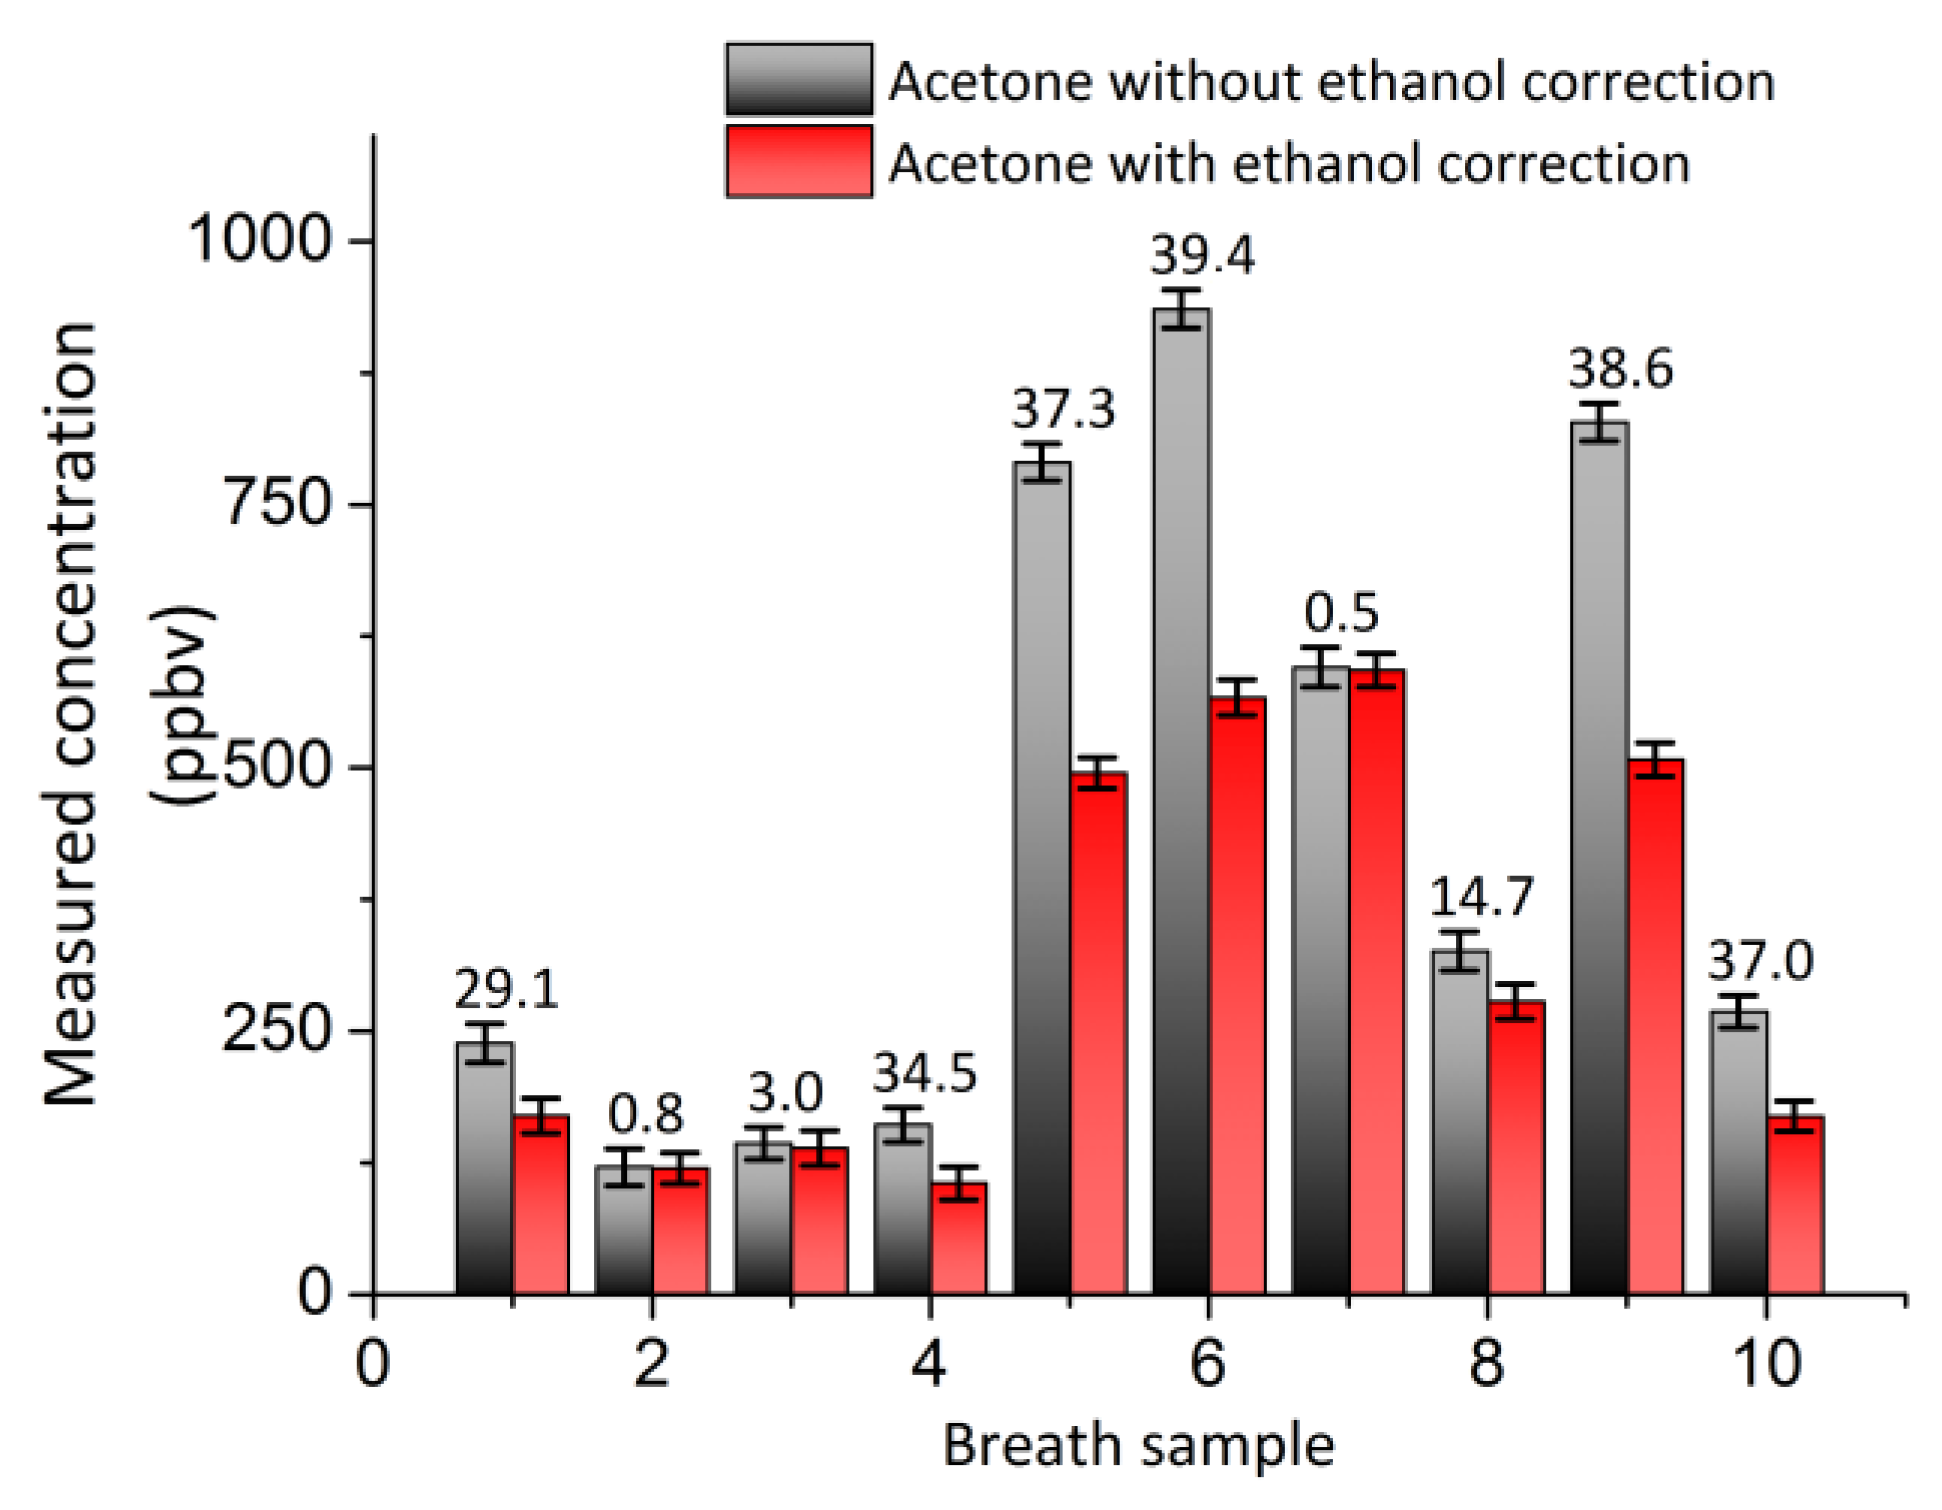
5. Interference Free Acetone Determination

A typical absorption spectrum of the breath from a healthy human subject is given in Figure 4. In this spectrum, the acetone contribution is clearly visible; however, several other features are present and can be identified as ethanol and water. The modulation present in the background is due to the residual optical fringes due to the ICOS gas cell. The recorded spectrum is a linear combination of spectra from the different molecules present in the breath and absorbing in this wavelength region. Considering that acetone and ethanol are the main species contributing to the recorded absorption spectrum, the individual concentrations of the both gases can be retrieved. Prior the measurements, the responses of the sensor are recorded for acetone and ethanol calibrated mixtures separately, providing two reference signals. For each wavelength scan of the system, the recorded signal is fitted with a linear combination of both reference signals minimizing the residual, using the General Linear Fit model. In such a way, the relative contribution of acetone and ethanol can be retrieved. With the knowledge of the absolute concentration of the references gases, the concentration of both gases in the sample is known.
This approach can be successfully implemented in both broadband as well as narrowband scanning mode. However, for the narrowband region, the targeted molecules should display sufficient spectroscopic differences in their absorption spectra.

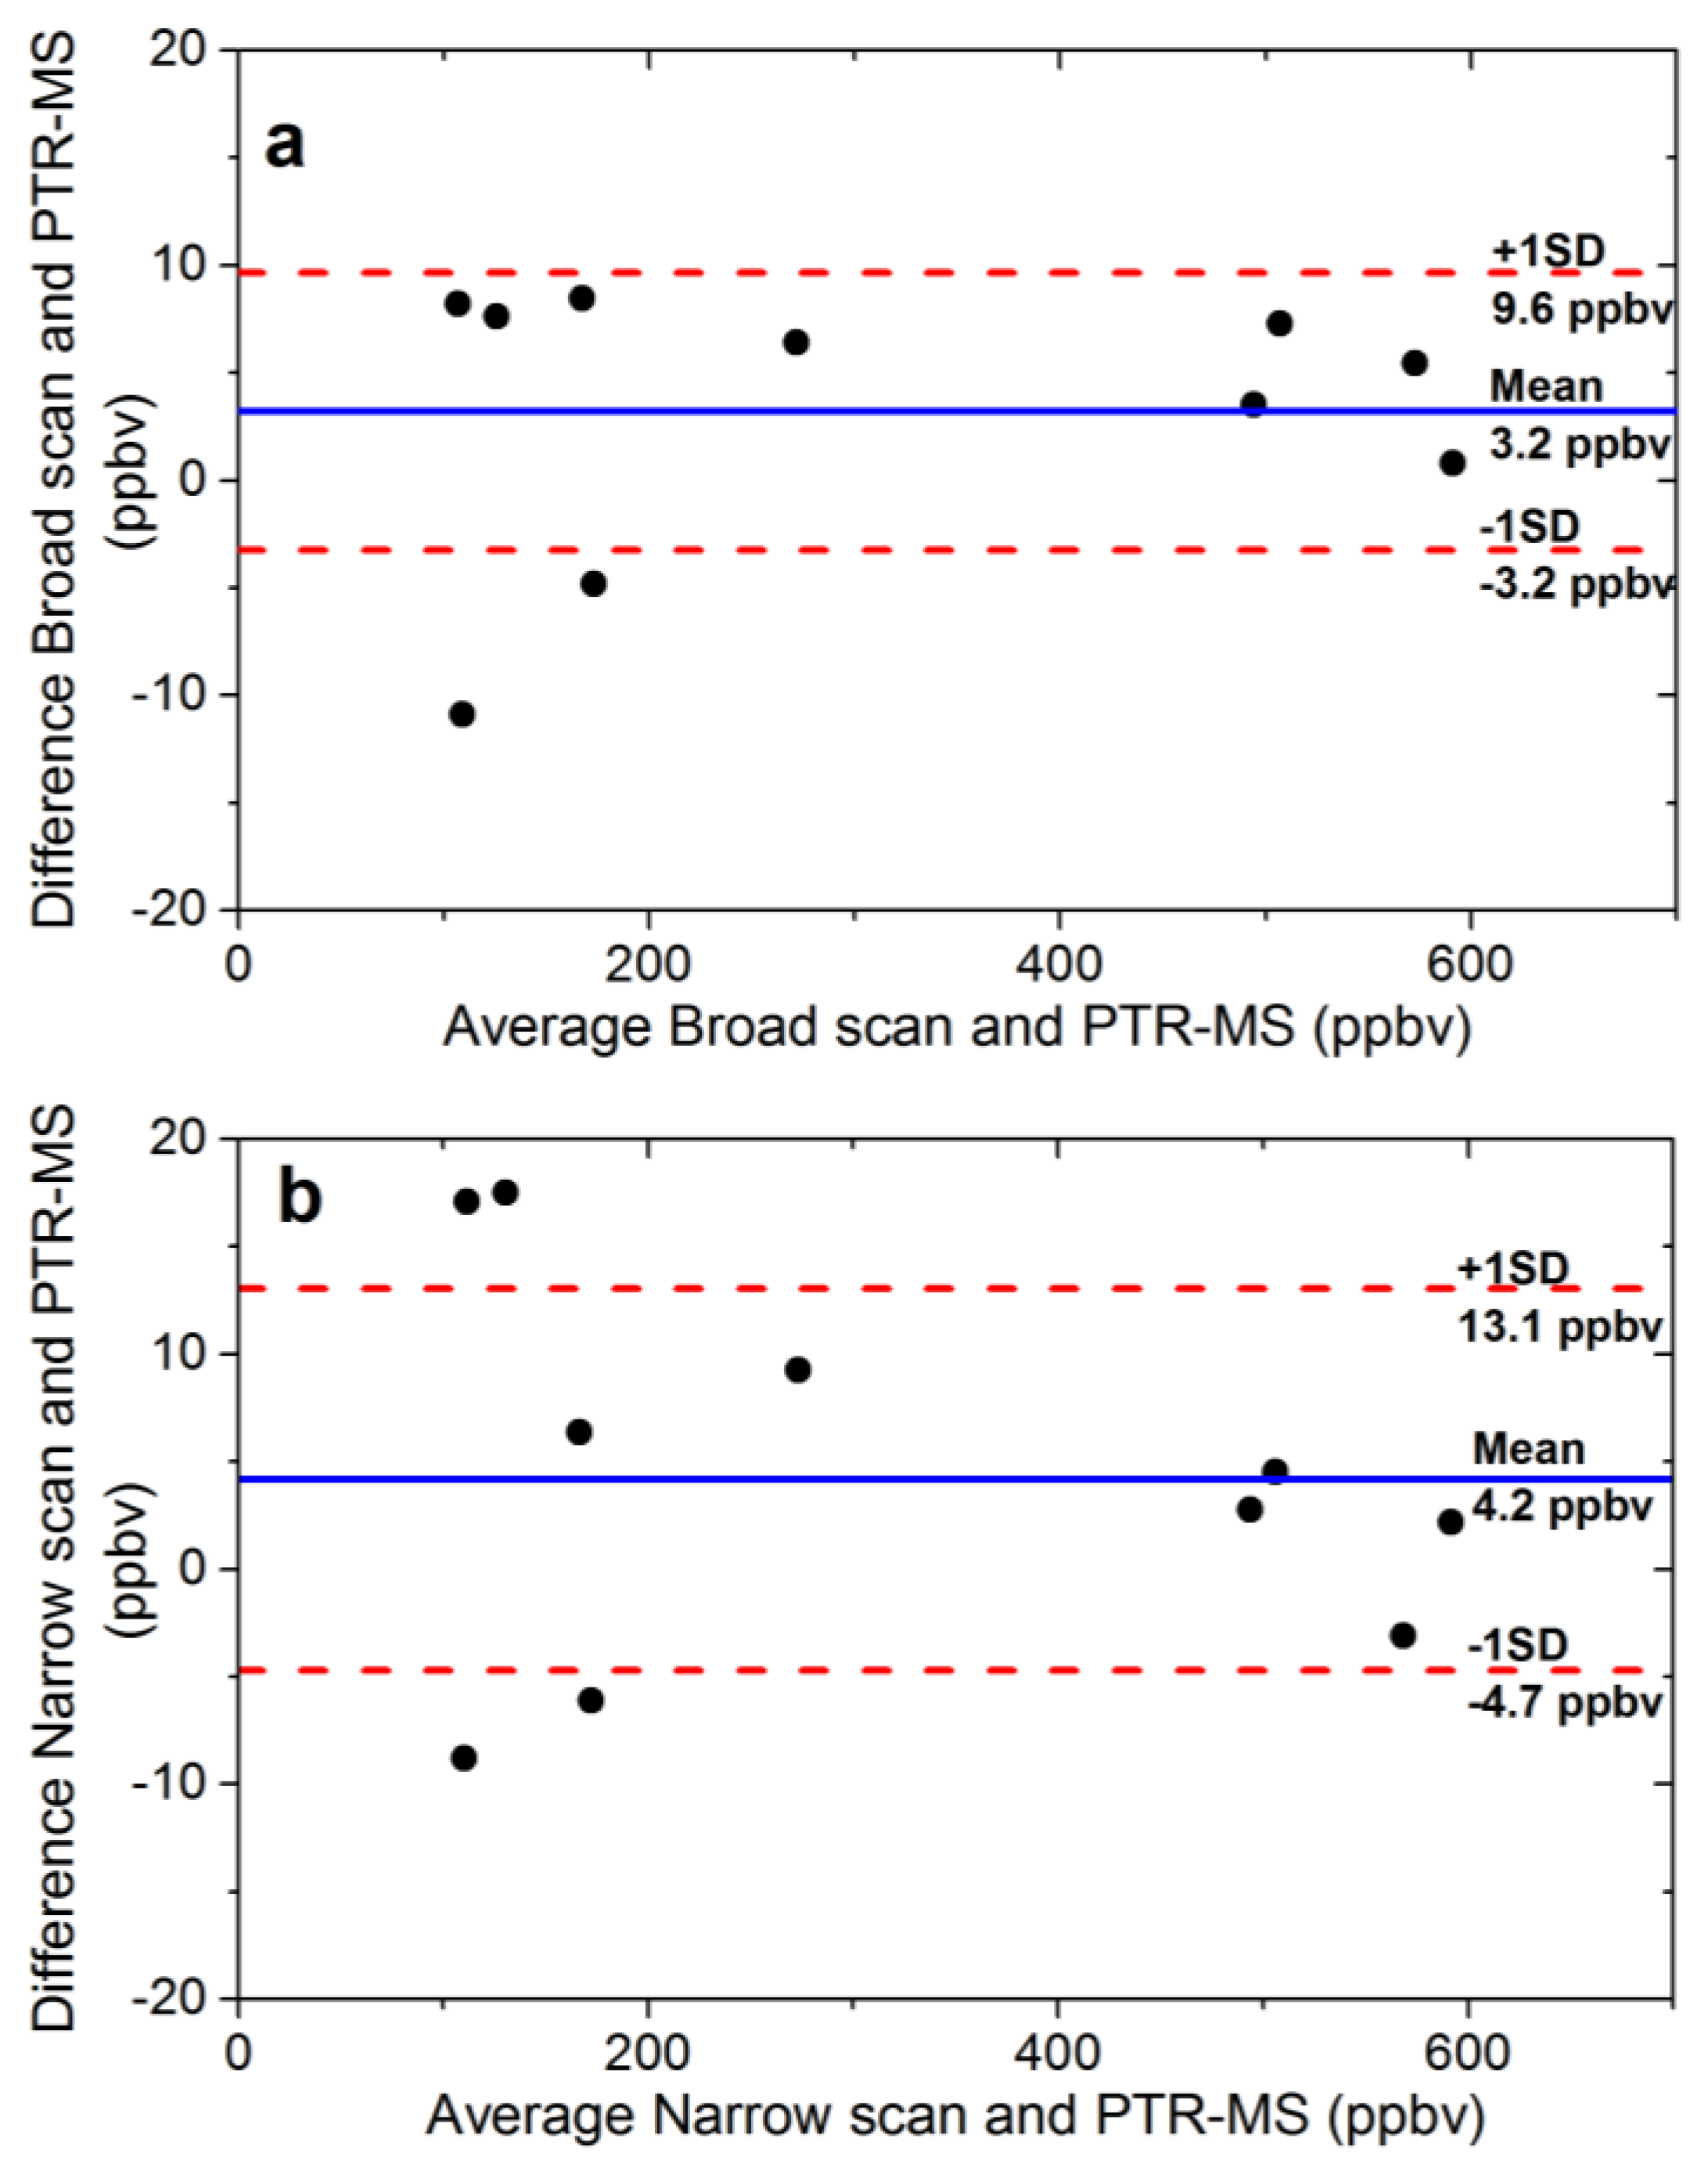
6. Validation of Ethanol-Corrected Breath Acetone Measurements with PTR-MS

Samples of end-tidal breath from ten healthy persons who did not consume any alcohol for 48 h were collected off-line in Tedlar bags (SKC Inc., Eighty Four, PA, USA) using a standard procedure described in [29]. Breath samples were introduced in the EC-QCL-based OA-ICOS setup at a flow rate of 1 L/h. Each sample was measured with the EC-QCL-based OA-ICOS setup in broadband and narrowband scan mode, respectively, using the correction for ethanol. In parallel, PTR-MS [30,31] was used for comparison and validation.
The bags were measured on the same day as the sampling. The Bland-Altman plot in Figure 5 displays the comparison between the two systems.
In general, the determination of gas concentrations is more accurate when the absorption profile over a wide range is measured, as the fit of the broadband spectrum to a database reference spectrum will become more reliable, due to the distinction of multiple components in the spectrum. Using the ethanol correction, the accuracy of acetone detection is 1.3% for the broadband scan (Figure 5a) and 2.8% for the narrowband scan (Figure 5b) as compared to the standard reference of PTR-MS. The accuracy values are relatively low, possibly within the gas calibration error, indicating that breath acetone can be sufficiently accurate detected also within narrowband region, if the scanning domain contains sufficient spectroscopic information from H2O, CO2 and ethanol.

7. Narrowband Detection of Exhaled Acetone

To verify the effect of ethanol on narrowband breath acetone measurements, a wavelength at 1216.5 cm−1 was used with a scanning range of 2 cm−1. Figure 6 shows the acetone concentrations with and without ethanol correction. In each pair of bars, the left (black) bar represents the acetone concentration determined without considering the absorption of ethanol (no correction) and the right (red) bar after retrieving the individual contribution of acetone and ethanol. The error bars were derived from the 1σ standard deviation of five consecutive measurements and the numbers on top of the bars represent the relative error in the determined acetone concentration. The error in acetone concentration from all 10 samples ranges from 0% to 39%. This significant contribution to the amount of acetone found in breath can have a profound impact on the determination of the health status of a person.

8. Conclusions

In this work, we demonstrated the potentially strong spectroscopic effect of ethanol on exhaled breath acetone measurements (up to 39% error) using an EC-QCL in the wavelength region of 1150–1300 cm−1. We observed good agreement between measured spectra of acetone with the EC-QCL-based OA-ICOS in comparison to measurements from a PTR-MS. By including a correction for ethanol, both broadband and narrowband approaches determine accurately the acetone concentration in human breath. The importance of considering spectroscopic ethanol influences for the assessment of acetone in human breath is essential, especially for the narrowband scans, (spectral region 1216 cm−1), for which the error can go up to 39% if it is not taken into account. Furthermore, other molecules of interest exhibit broadband features in this wavelength region of the EC-QCL used here.

Acknowledgments

This work was financially supported by the Foundation for Fundamental Research on Matter under contract N0304M and the European Regional Development Fund, province of Gelderland (GO-EFRO project (No. 2009-010034)) and MPNS COST Action “MP-1204 TERA-MIR Radiation: Materials, Generation, Detection and Applications”.

Author Contributions

R.C., F.J.M.H. and S.M.C proposed the concept and initiated the study, F.J.M.H., S.M.C. and R.C. guided the study, R.C. and J.M. carried out the measurements, and R.C., J.M. and S.M.C wrote the manuscript.

Conflicts of Interest

The authors declare no conflict of interest.

References

  1. Amann, A.; Miekisch, W.; Schubert, J.; Buszewski, B.; Ligor, T.; Jezierski, T.; Pleil, J.; Risby, T. Analysis of exhaled breath for disease detection. Annu. Rev. Anal. Chem. 2014, 7, 455–482. [Google Scholar] [CrossRef] [PubMed]
  2. Risby, T.H.; Tittel, F.K. Current status of midinfrared quantum and interband cascade lasers for clinical breath analysis. Opt. Eng. 2010, 49, 111123. [Google Scholar]
  3. Samudrala, D.; Lammers, G.; Mandon, J.; Blanchet, L.; Schreuder, T.H.A.; Hopman, M.T.; Harren, F.J.M.; Tappy, L.; Cristescu, S.M. Breath acetone to monitor life style interventions in field conditions: An exploratory study. Obesity 2014, 22, 980–983. [Google Scholar] [CrossRef] [PubMed]
  4. Smith, D.; Spanel, P.; Fryer, A.A.; Hanna, F.; Ferns, G.A.A. Can volatile compounds in exhaled breath be used to monitor control in diabetes mellitus? J. Breath Res. 2011, 5, 022001. [Google Scholar] [CrossRef] [PubMed]
  5. Musa-Veloso, K.; Likhodii, S.S.; Cunnane, S.C. Breath acetone is a reliable indicator of ketosis in adults consuming ketogenic meals. Am. J. Clin. Nutr. 2002, 76, 65–70. [Google Scholar] [PubMed]
  6. Smith, D.; Spanel, P.; Davies, S. Trace gases in breath of healthy volunteers when fasting and after a protein-calorie meal: A preliminary study. J. Appl. Physiol. 1999, 87, 1584–1588. [Google Scholar] [PubMed]
  7. King, J.; Kupferthaler, A.; Unterkofler, K.; Koc, H.; Teschl, S.; Teschl, G.; Miekisch, W.; Schubert, J.; Hinterhuber, H.; Amann, A. Isoprene and acetone concentration profiles during exercise on an ergometer. J. Breath Res. 2009, 3, 027006. [Google Scholar] [CrossRef] [PubMed]
  8. Mieth, M.; Schubert, J.K.; Groeger, T.; Sabel, B.; Kischkel, S.; Fuchs, P.; Hein, D.; Zimmermann, R.; Miekisch, W. Automated needle trap heart-cut GC/MS and needle trap comprehensive two-dimensional GC/TOF-MS for breath gas analysis in the clinical environment. Anal. Chem. 2010, 82, 2541–2551. [Google Scholar] [CrossRef] [PubMed]
  9. Turner, C.; Spanel, P.; Smith, D. A longitudinal study of ammonia, acetone and propanol in the exhaled breath of 30 subjects using selected ion flow tube mass spectrometry, SIFT-MS. Physiol. Meas. 2006, 27, 321–337. [Google Scholar] [CrossRef] [PubMed]
  10. Schwarz, K.; Pizzini, A.; Arendacká, B.; Zerlauth, K.; Filipiak, W.; Schmid, A.; Dzien, A.; Neuner, S.; Lechleitner, M.; Scholl-Bürgi, S.; et al. Breath acetone—aspects of normal physiology related to age and gender as determined in a PTR-MS study. J. Breath Res. 2009, 3, 027003. [Google Scholar] [CrossRef] [PubMed]
  11. Turner, C.; Spanel, P.; Smith, D. A longitudinal study of ethanol and acetaldehyde in the exhaled breath of healthy volunteers using selected-ion flow-tube mass spectrometry. Rapid Commun. Mass Spectrom. 2006, 20, 61–68. [Google Scholar] [CrossRef] [PubMed]
  12. Arslanov, D.D.; Swinkels, K.; Cristescu, S.M.; Harren, F.J.M. Real-time, subsecond, multicomponent breath analysis by optical parametric oscillator based off-axis integrated cavity output spectroscopy. Opt. Express 2011, 19, 24078–24089. [Google Scholar] [CrossRef] [PubMed]
  13. Maulini, R.; Mohan, A.; Giovannini, M.; Faist, J.; Gini, E. External cavity quantum-cascade laser tunable from 8.2 to 10.4 m using a gain element with a heterogeneous cascade. Appl. Phys. Lett. 2006, 88, 201113. [Google Scholar] [CrossRef]
  14. Peng, C.; Luo, G.P.; Le, H.Q. Broadband, continuous, and fine-tune properties of external-cavity thermoelectric-stabilized mid-infrared quantum-cascade lasers. Appl. Opt. 2003, 42, 4877–4882. [Google Scholar] [CrossRef] [PubMed]
  15. Wysocki, G.; Lewicki, R.; Curl, R.F.; Tittel, F.K.; Diehl, L.; Capasso, F.; Troccoli, M.; Hofler, G.; Bour, D.; Corzine, S.; et al. Widely tunable mode-hop free external cavity quantum cascade lasers for high resolution spectroscopy and chemical sensing. Appl. Phys. B Lasers Opt. 2008, 92, 305–311. [Google Scholar] [CrossRef]
  16. Curl, R.F.; Capasso, F.; Gmachl, C.; Kosterev, A.A.; McManus, B.; Lewicki, R.; Pusharsky, M.; Wysocki, G.; Tittel, F.K. Quantum cascade lasers in chemical physics. Chem. Phys. Lett. 2010, 487, 1–18. [Google Scholar] [CrossRef]
  17. Centeno, R.; Marchenko, D.; Mandon, J.; Cristescu, S.M.; Wulterkens, G.; Harren, F.J.M. High power, widely tunable, mode-hop free, continuous wave external cavity quantum cascade laser for multi-species trace gas detection. Appl. Phys. Lett. 2014, 105, 261907. [Google Scholar] [CrossRef]
  18. Ciaffoni, L.; Hancock, G.; Harrison, J.J.; van Helden, J.-P.H.; Langley, C.E.; Peverall, R.; Ritchie, G.A.D.; Wood, S. Demonstration of a mid-infrared cavity enhanced absorption spectrometer for breath acetone detection. Anal. Chem. 2013, 85, 846–850. [Google Scholar] [CrossRef] [PubMed]
  19. Hancock, G.; Langley, C.E.; Peverall, R.; Ritchie, G.A.D.; Taylor, D. Laser-based method and sample handling protocol for measuring breath acetone. Anal. Chem. 2014, 86, 5838–5843. [Google Scholar] [CrossRef] [PubMed]
  20. Wysocki, G.; Curl, R.F.; Tittel, F.K.; Maulini, R.; Bulliard, J.M.; Faist, J. Widely tunable mode-hop free external cavity quantum cascade laser for high resolution spectroscopic applications. Appl. Phys. B Lasers Opt. 2005, 81, 769–777. [Google Scholar] [CrossRef]
  21. Marchenko, D.; Mandon, J.; Cristescu, S.M.; Merkus, P.J.F.M.; Harren, F.J.M. Quantum cascade laser-based sensor for detection of exhaled and biogenic nitric oxide. Appl. Phys. B Lasers Opt. 2013, 111, 359–365. [Google Scholar] [CrossRef]
  22. Parameswaran, K.R.; Rosen, D.I.; Allen, M.G.; Ganz, A.M.; Risby, T.H. Off-axis integrated cavity output spectroscopy with a mid-infrared interband cascade laser for real-time breath ethane measurements. Appl. Opt. 2009, 48, B73–B79. [Google Scholar] [CrossRef] [PubMed]
  23. Lewicki, R.; Wysocki, G.; Kosterev, A.A.; Tittel, F.K. Qepas based detection of broadband absorbing molecules using a widely tunable, cw quantum cascade laser at 8.4 μm. Opt. Express 2007, 15, 7357–7366. [Google Scholar] [CrossRef] [PubMed]
  24. Phillips, M.C.; Taubman, M.S.; Bernacki, B.E.; Cannon, B.D.; Stahl, R.D.; Schiffern, J.T.; Myers, T.L. Real-time trace gas sensing of fluorocarbons using a swept-wavelength external cavity quantum cascade laser. Analyst 2014, 139, 2047–2056. [Google Scholar] [CrossRef] [PubMed]
  25. Baer, D.S.; Paul, J.B.; Gupta, J.B.; O’Keefe, A. Sensitive absorption measurements in the near-infrared region using off-axis integrated-cavity-output spectroscopy. Appl. Phys. B Lasers Opt. 2002, 75, 261–265. [Google Scholar] [CrossRef]
  26. Moyer, E.J.; Sayres, D.S.; Engel, G.S.; Clair, J.M.S.; Keutsch, F.N.; Allen, N.T.; Kroll, J.H.; Anderson, J.G. Design considerations in high-sensitivity off-axis integrated cavity output spectroscopy. Appl. Phys. B Lasers Opt. 2008, 92, 467–474. [Google Scholar] [CrossRef]
  27. Paul, J.B.; Lapson, L.; Anderson, J.G. Ultrasensitive absorption spectroscopy with a high-finesse optical cavity and off-axis alignment. Appl. Opt. 2001, 40, 4904–4910. [Google Scholar] [CrossRef] [PubMed]
  28. Centeno, R.; Mandon, J.; Cristescu, S.M.; Harren, F.J.M. Three mirror off axis integrated cavity output spectroscopy for the detection of ethylene using a quantum cascade laser. Sens. Actuators B Chem. 2014, 203, 311–319. [Google Scholar] [CrossRef]
  29. Mandon, J.; Hogman, M.; Merkus, J.F.M.; van Amsterdam, J.; Harren, F.J.M.; Cristescu, S.M. Exhaled nitric oxide monitoring by quantum cascade laser: Comparison with chemiluminescent and electrochemical sensors. J. Biomed. Opt. 2012, 17, 017003. [Google Scholar] [CrossRef] [PubMed]
  30. Crespo, E.; Cristescu, S.M.; de Ronde, H.; Kuijper, S.; Kolk, A.H.J.; Anthony, R.M.; Harren, F.J.M. Proton transfer reaction mass spectrometry detects rapid changes in volatile metabolite emission by mycobacterium smegmatis after the addition of specific antimicrobial agents. J. Microbiol. Meth. 2011, 86, 8–15. [Google Scholar] [CrossRef] [PubMed]
  31. Boamfa, E.I.; Steeghs, M.M.L.; Cristescu, S.M.; Harren, F.J.M. Trace gas detection from fermentation processes in apples; an intercomparison study between proton-transfer-reaction mass spectrometry and laser photoacoustics. Int. J. Mass Spectrom. 2004, 239, 193–201. [Google Scholar] [CrossRef]
Figure 1. A schematic view of the external cavity quantum cascade laser (EC-QCL) showing the arrangement of the laser components including grating, mirror, and step motors. The laser was mounted vertically on a copper block due to polarization, in front of which a lens in a 3D-positioning system was installed. The light exited at the front and was guided via two focusing lenses (L1, L2) and a high finesse off-axis cavity onto the thermo-electrically cooled detector.
Photonics 03 00022 g001
Figure 2. Measurements of different acetone concentrations at 200 mbar plotted as a function of calculated acetone concentrations from the mixing ratio with nitrogen (10 averaged scans in 30 s) including the linear fit.
Photonics 03 00022 g002
Figure 3. Simulation of absorption of 500 ppbv acetone and 200 ppbv ethanol at a pressure of 1 atm and a path length of 1 km from the PNNL (Pacific Northwest National Laboratory) database. The inset shows a zoom of the 1216 cm−1 region, showing the contribution of ethanol in this region, which results in an elevated absorption signal without significant lineshape variation for both contributions (upper curve, blue).
Photonics 03 00022 g003
Figure 4. Typical measured absorption spectrum of a breath sample consisting of a combined spectrum of acetone, ethanol and water. The recorded spectrum is fitted with a linear combination of two reference spectra of acetone and ethanol. After minimizing the residual, the relative contribution of both gases contained in the sample is known. The concentration of both gases present in the sample can be then calculated as the reference gases (acetone and ethanol in N2) with known concentrations have been measured prior the experiment.
Photonics 03 00022 g004
Figure 5. Bland-Altman plot of breath acetone from ten persons measured with the EC-QCL-based system and compared to proton-transfer reaction mass spectrometer (PTR-MS). (a) broadband scan mode and (b) narrowband scan mode. Solid line represents the mean difference between the two systems. Dashed lines represent the limits of agreement: (a) −3.2 ppbv and 9.6 ppbv and (b) −4.7 ppbv and 13.1 ppbv; SD is standard deviation.
Photonics 03 00022 g005
Figure 6. Comparison of measured acetone concentration at 1216.5 cm−1 from 10 breath samples without correction for ethanol (left bars, black) and with (right bars, red). Numbers on top give the relative error of acetone concentration if the presence of ethanol is not considered.
Photonics 03 00022 g006

