1. Introduction
Silica-based optical fibers are widely used in communication and energy transmission due to their excellent electromagnetic interference immunity and high bandwidth [
1]. However, as application scenarios expand, these fibers increasingly face extreme environments such as ultra-high temperatures [
2], high humidity [
3], and intense radiation [
4]. In nuclear facilities, high-energy physics experiments, and aerospace missions, radiation-induced attenuation (RIA) can severely compromise system reliability. Recently, the deployment of Commercial Off-The-Shelf (COTS) devices in Low Earth Orbit (LEO) space missions has become a major trend; however, it poses critical system-level challenges regarding radiation qualification and up-screening [
5]. Within such system-level frameworks, the proposed model can be positioned as an effective component-level tool to quantitatively evaluate the radiation-induced degradation of COTS optical fibers used in space optical links, fiber sensors, or photonic payloads. Consequently, the quantitative evaluation of fiber attenuation evolution under radiation is not only a fundamental scientific issue but also an urgent engineering prerequisite.
High-energy radiation disrupts the silica network, generating vacancy defects and free carriers. These carriers are subsequently trapped by both radiation-induced and intrinsic vacancies to form color centers, whose absorption ultimately causes RIA [
6,
7].
Various strategies have been developed to suppress color-center formation, including dopant engineering (e.g., Ge, F, Ce) and pre-/post-treatments such as gas loading, photobleaching, and thermal annealing [
8,
9,
10,
11,
12,
13,
14,
15,
16,
17,
18]. Optimizing these strategies, however, demands accurate kinetic models that capture the underlying defect dynamics.
Existing RIA models fall into empirical and mechanistic categories. Early power-law formulations [
19,
20] are simple but lack physical meaning and cannot describe high-dose saturation. To incorporate saturation, the saturating exponential model was introduced [
21], sometimes combined with a power-law term [
22]. Recognizing the dispersive nature of defect reactions in amorphous silica, Griscom et al. proposed a stretched-exponential (fractal-kinetics) description that significantly improves fitting accuracy [
23]. Building on this, Gilard et al. explicitly included dose-rate and temperature dependencies through a dispersive parameter, accounting for diffusion-limited recovery [
24]. More recently, Liu et al. generalized the Gilard model to a dual-color-center system and introduced temperature-dependent dose-rate relaxation [
25]. However, these dispersive extensions increase computational complexity and require approximations that can compromise accuracy. An alternative free-carrier evolution approach offers complementary insight [
26]. Despite these advances, a fundamental limitation persists—most models treat the vacancy (precursor) concentration as static or absent, overlooking the dynamic generation and conversion of vacancies that governs color-center populations. Moreover, the restriction to one or two color centers is often inadequate for infrared RIA, where multiple defect types with overlapping absorption tails contribute simultaneously.
To address these limitations, we propose a multi-color-center kinetic model driven by continuous vacancy-to-color-center conversion. Because the exact atomic identities of infrared-active defects are difficult to resolve, we adopt the phenomenological concept of “effective color centers.” Beyond fitting macroscopic data, the model acts as a kinetic decoder, separating overlapping RIA signals into transient and steady-state effective defect pools. This flexible phenomenological framework accurately captures the steady-state RIA evolution of fluorine–germanium co-doped fibers under constant temperature and dose rate, laying a foundation for future multi-component evaluations.
2. Equation Derivation and Modeling
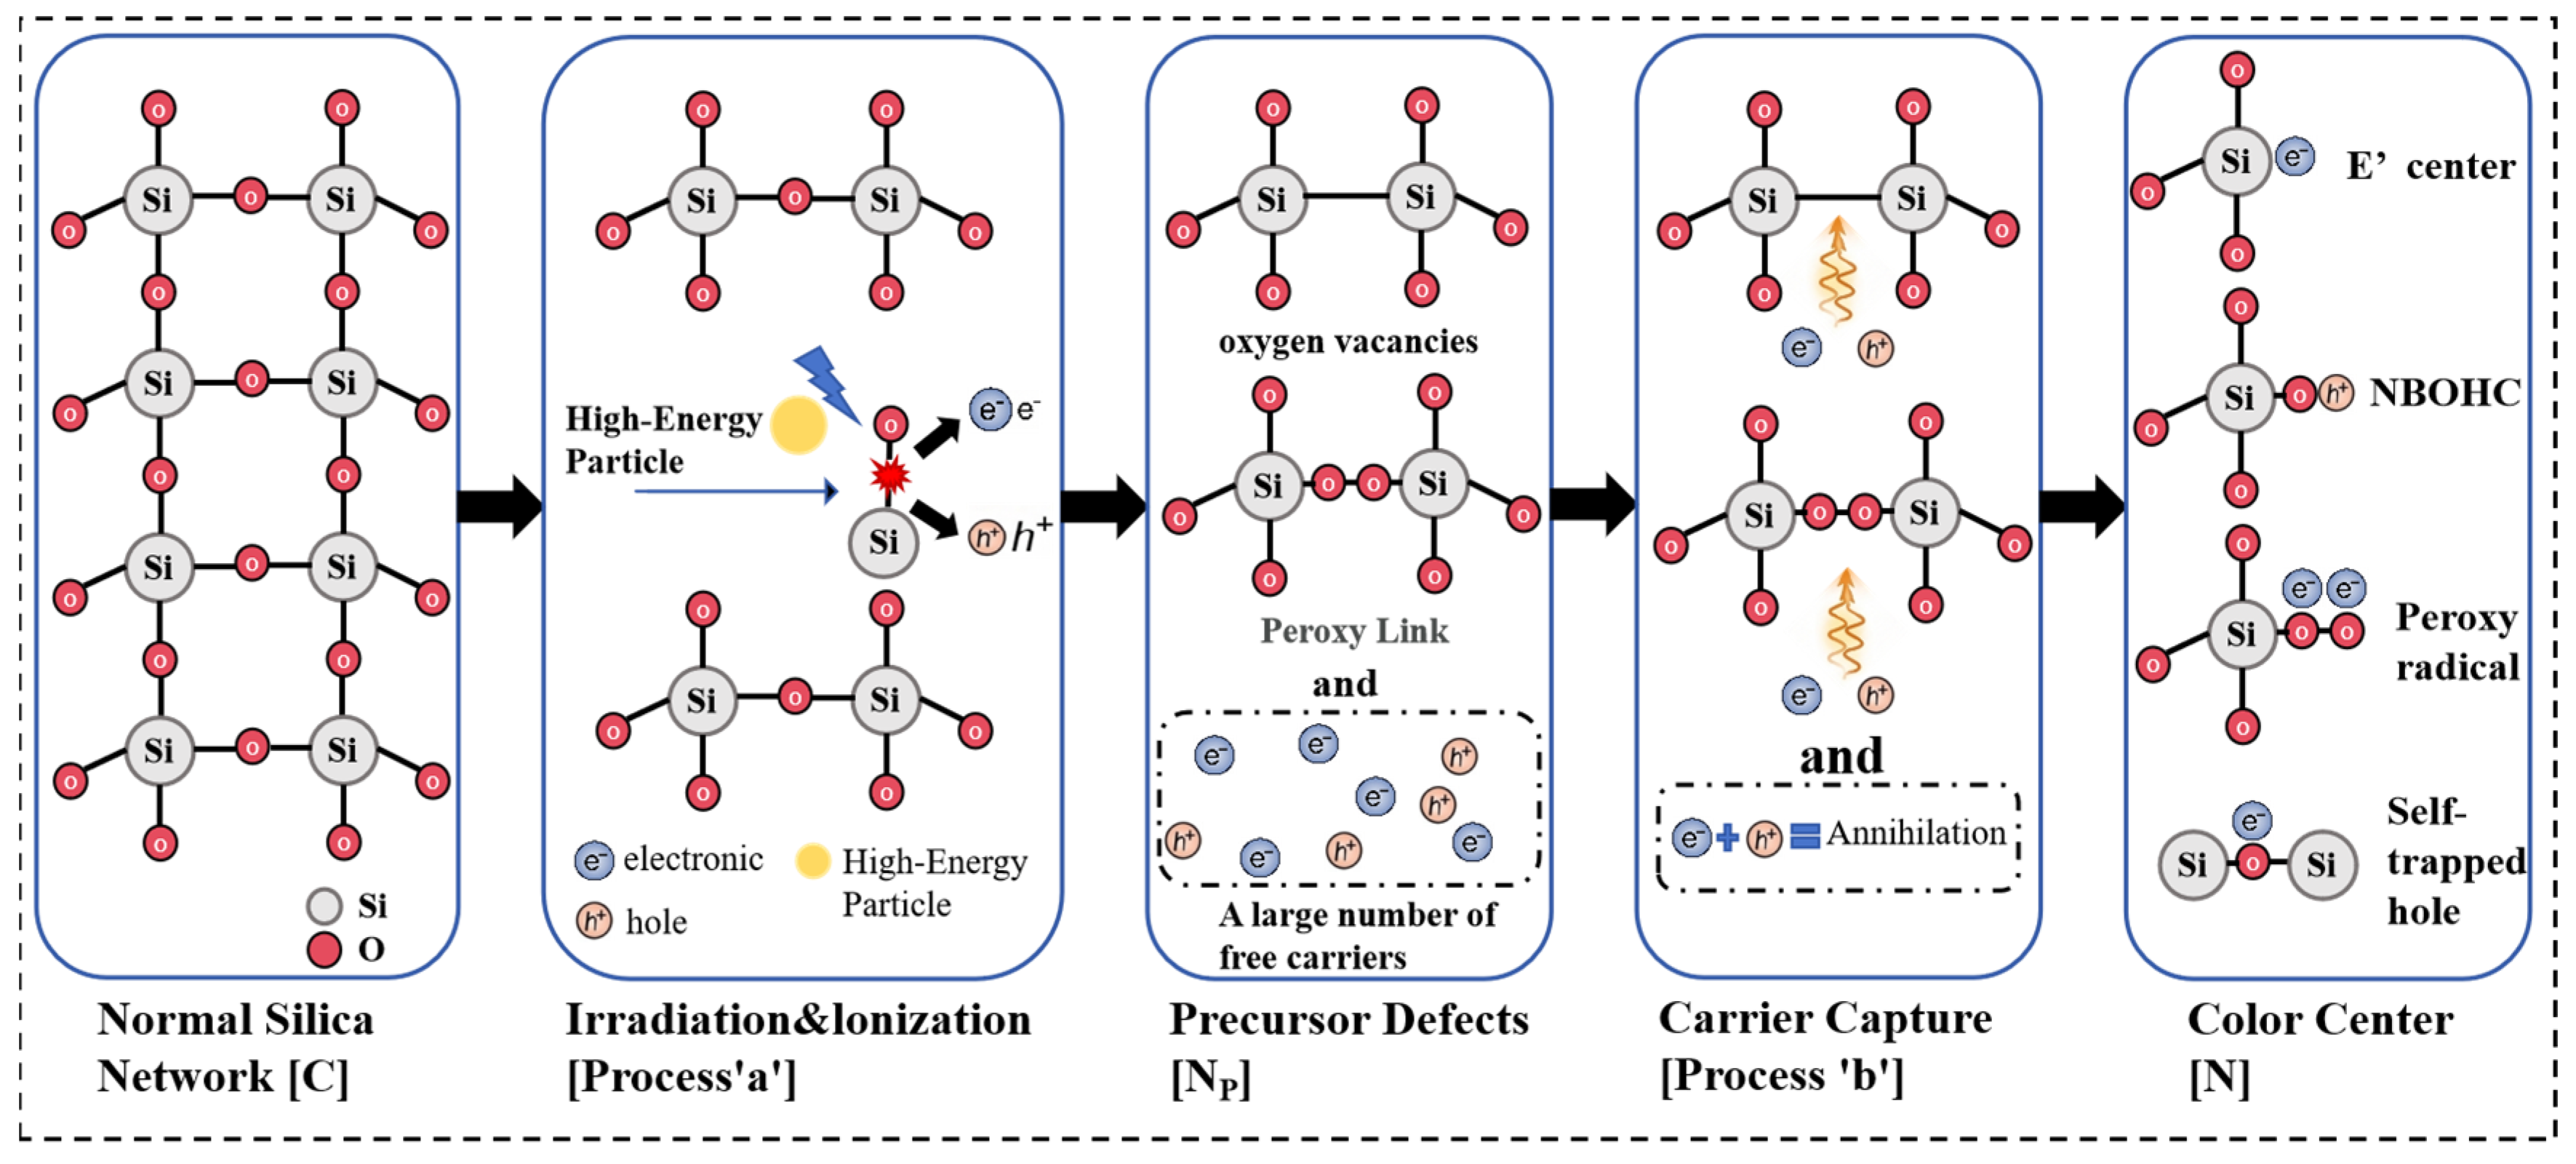
This study investigates the kinetics of color centers in silica-based fibers under high-energy radiation, focusing on the evolution of defect density and the resulting radiation-induced attenuation (RIA). The underlying physical mechanism is as follows: High-energy particles transfer energy to the fiber material, triggering ionization and breaking of the silicon–oxygen tetrahedral network. This disruption generates precursor (vacancy) defects—such as oxygen vacancies and bridging-oxygen defects—and simultaneously excites abundant free carriers. Subsequently, both radiation-induced and intrinsic vacancies trap these free carriers to form color centers, whose absorption gives rise to RIA [
5,
6].
Based on this process, the vacancy–color-center generation model is schematically illustrated in
Figure 1. We assume that vacancy defects do not undergo structural recovery: once created, they cannot revert to the normal network but can only be consumed through conversion into color centers.
Here, [C] represents the normal silicon–oxygen tetrahedral structure. [Np] represents the precursor defect. [N] represents the color center formed by this precursor structure. Furthermore, ‘a’ denotes the transformation of the normal silicon–oxygen tetrahedral structure into a precursor structure. ‘b’ denotes the precursor structure trapping carriers to form a color center defect. Based on these physical mechanisms, we establish differential equations for color center evolution. This constructs a kinetic damage model for radiation-induced attenuation (RIA). Regarding the evolution of vacancy defects, we assume that the change in vacancy concentration is the difference between a generation term and an annihilation term. The generation term represents radiation-induced vacancy formation. The annihilation term represents the conversion of vacancies into color centers. Specifically, the generation term is characterized by the vacancy induction coefficient and the radiation dose rate. The annihilation term is jointly determined by the color center trapping coefficient, the radiation dose rate, and the vacancy concentration. The specific expression is as follows:
Here,
d represents the dose rate (Gy/s), and
t is the irradiation time (s). It is crucial to note that microscopic defect concentrations are fundamentally unmeasurable in arbitrary units. To establish a phenomenologically solvable macroscopic model, we mathematically absorb the scaling factor (which correlates defect density to macroscopic attenuation) directly into the state variables. Through this phenomenological integration,
Vi(t) is transformed to represent the equivalent radiation-induced attenuation (RIA) contribution of the current precursor pool, measured in dB/km. Due to the presence of intrinsic vacancies, we set the initial conditions:
. To ensure strict dimensional consistency across the equation, the corresponding parameters are defined as follows:
ki is the effective induction rate, with units of dB·km
−1·Gy
−1; and
ai is the color center trapping coefficient, with units of Gy
−1.
This equation takes the form of an exponential function plus a constant term. It indicates that the number of vacancies gradually approaches a constant value. Furthermore, the rate of this decrease also slows down over time. Eventually, the generation and annihilation of vacancies reach an equilibrium. The equilibrium term is as follows: This equation takes the form of an exponential function plus a constant term, indicating that the effective capacity of the precursor pool gradually approaches a constant steady-state value. Depending on whether the initial capacity
V0i is greater or smaller than the equilibrium limit
ki/
ai, this capacity will dynamically either decrease or increase over time. In either scenario, the rate of this change progressively slows down. Eventually, the phenomenological generation and annihilation processes reach a dynamic equilibrium. The equilibrium term is expressed as follows:
Following the modeling approach for vacancy defects, we conduct a kinetic analysis of color center defects. We assume that the change in color center concentration is the difference between its generation term and annihilation term. The color center generation term equals the vacancy annihilation term. Meanwhile, the color center annihilation term is jointly determined by the intrinsic recovery coefficient and the color center concentration. This evolution process is independent of the radiation dose rate. The specific expression is as follows:
Here,
bi represents the inherent structural recovery coefficient of the color center, with the unit of s
−1. Consistent with the aforementioned phenomenological transformation,
Ni(
t) represents the effective macroscopic RIA contribution generated by the
i-th color center, measured in dB/km. We assume that no color center structures exist before the irradiation begins:
. Correspondingly, the initial precursor capacity
V0i is also expressed in dB/km, representing the maximum potential attenuation capacity of this specific defect pool under extreme saturation.
This equation consists of a “one minus exponential” term and a “difference of two exponentials” term. Overall, it indicates that the number of color centers increases, while its growth rate gradually decreases.
It should be noted that Equation (5) theoretically presents a mathematical singularity in the specific limiting case where bi = ai ∗ d. Under this specific condition, the denominator of the second term becomes zero. However, this is merely a removable singularity. Because the numerator simultaneously approaches zero (), this creates a “0/0” indeterminate form. By applying L’Hôpital’s rule to take the limit as ai ∗ d → bi, the second term mathematically converges to a continuous and well-behaved function: . Physically, this limiting case represents a “critically balanced kinetic state” where the color center recovery rate constant exactly matches the precursor capture rate constant. The resolution of this singularity ensures that the phenomenological defect concentration evolution remains continuous and mathematically stable across all possible boundary conditions without infinite divergence.
Eventually, the generation and annihilation of color centers reach an equilibrium. The equilibrium term is as follows:
The above expression for color centers can be generalized to a multi-color center form:
where
i = 1, 2, 3...,
n, representing the generalized multi-color-center expansion.
Different color-center types exhibit distinct lifetimes, absorption cross-sections, and peak wavelengths, traditionally requiring individual scaling factors [
25]. Introducing numerous such parameters, however, leads to severe over-parameterization. We therefore adopt a three-center description in which each effective center represents a kinetically defined defect pool rather than a specific atomic structure. Clustering defects by their kinetic timescales optimally balances mathematical tractability and physical realism.
By phenomenologically absorbing the scaling factors into the state variables, the unmeasurable microscopic densities are directly transformed into macroscopic kinetic components. This allows the total radiation-induced attenuation (RIA) to be decoupled into transient-relaxation and steady-state degradation contributions, expressed simply as their linear superposition (Equation (8)).
Notably, the framework is inherently scalable: although a three-center baseline is employed here, the number n can be dynamically reduced (to a dual- or single-center model) or expanded according to the RIA profile and statistical criteria (e.g., parameter identifiability, AIC, BIC). This structural adaptability ensures an optimal balance between physical fidelity and statistical parsimony across diverse scenarios. In the following section, we validate the model against experimental data to confirm its accuracy and practical applicability.
3. Fitting the Derived Model to Experimental Data
To validate the proposed model, we performed Cobalt-60 (60Co) gamma-ray irradiation tests on a fluorine–germanium co-doped single-mode fiber (core: F/Ge co-doped; coating: acrylate; 9/125 μm standard). The source was provided by the Heilongjiang Academy of Atomic Energy. Under irradiation, this composition readily generates typical point defects—Ge-E′, Ge(1), Ge(2), and self-trapped holes (STHs)—which serve as the primary structural precursors for macroscopic RIA.
A Ceyear 6422 optical time-domain reflectometer (OTDR, dynamic range 35–45 dB) was used to measure the attenuation coefficient a (dB/km). The coefficient was extracted from OTDR traces via the least-squares approximation (LSA) method, with the linear regression restricted to the uniform Rayleigh backscattering region of the irradiated fiber to exclude Fresnel reflections and dead zones at both ends. The dynamic radiation-induced attenuation (RIA) was then obtained by continuously subtracting the pre-irradiation baseline a(0) from the transient a(t) measured at each irradiation time.
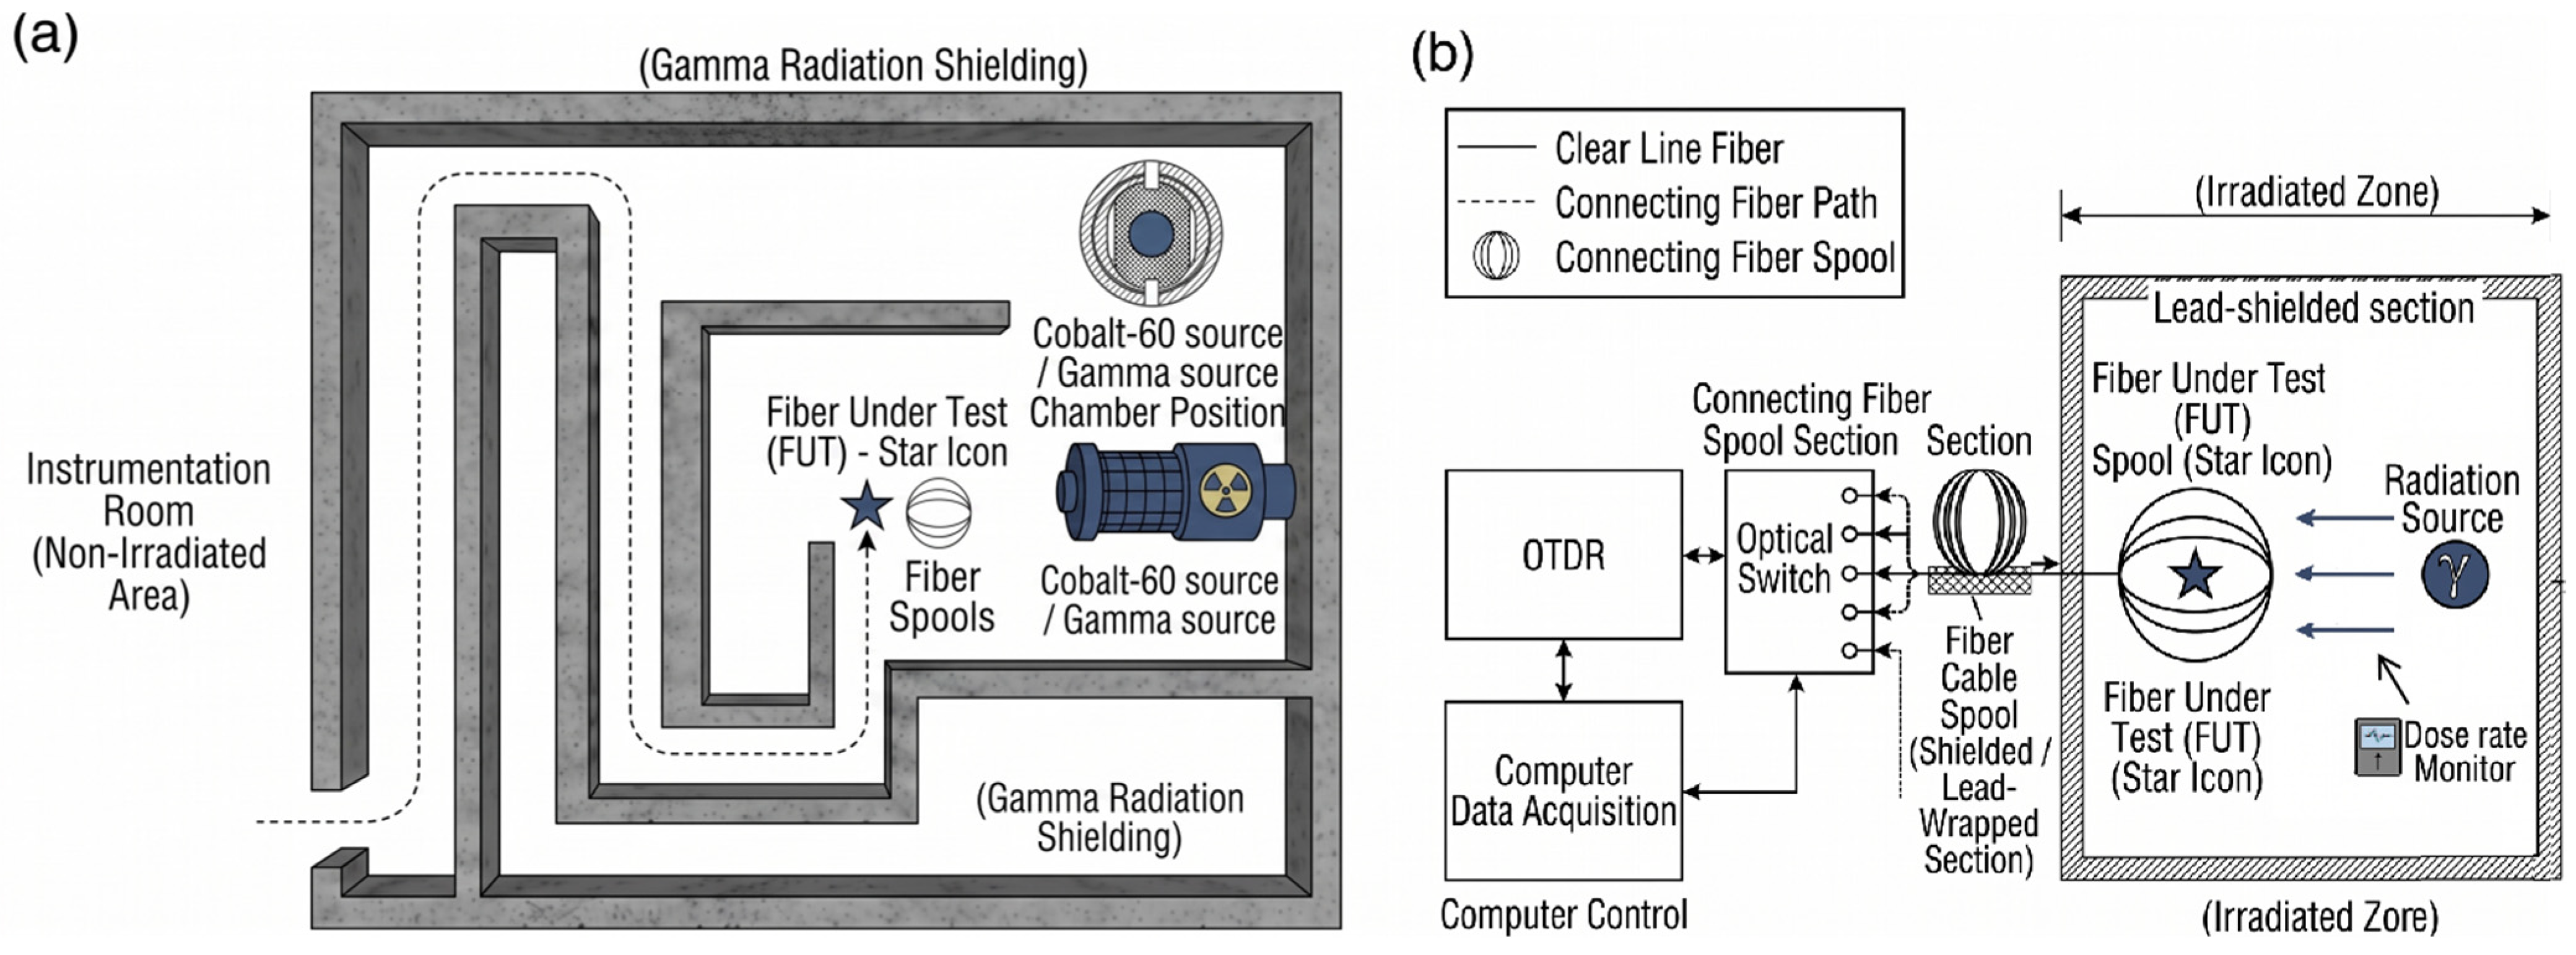
The experimental layout and optical path are shown in
Figure 2.
For dosimetric rigor and reproducibility, the hardware configuration was as follows. The total length of the experimental fiber path was 216 m. Of this, the radiation-exposed length (fiber under test, FUT) was 200 m, wound on a 16.5 cm-diameter aluminum spool (bending radius 8.25 cm) to ensure dose uniformity. Irradiation lasted approximately 800,000 s, delivering a total dose of ∼1.0 MGy at a dose rate of 1.25 ± 0.06 Gy/s.
To isolate the instruments, the OTDR and data acquisition system were placed in a non-irradiated room. They were connected to the FUT via 16 m patch cords located outside the irradiation zone. The connecting fibers and OTDR ports were shielded with lead bricks to prevent parasitic degradation in the non-test sections.
To suppress photobleaching, the average OTDR probe power was kept below 1 mW. The OTDR pulse width was 10 ns, corresponding to ∼1 m spatial resolution. The trace averaging time was 40 s to reduce random fluctuations and enhance the signal-to-noise ratio. The attenuation coefficient was extracted from the OTDR traces using the least-squares approximation (LSA) method. The linear regression was confined to the uniform Rayleigh backscattering region, excluding the Fresnel reflections and dead zones at both ends. Prior to irradiation, the initial attenuation slope a(0)—accounting for intrinsic fiber attenuation, bending loss on the spool, and connection loss—was recorded as the baseline. The dynamic RIA was then obtained by subtracting this baseline from the transient a(t) measured at each irradiation time.
The RIA data were corrected for connector losses, bending losses, OTDR repeatability, and parasitic radiation in non-test sections. The temperature was maintained at 10 ± 2 °C, which mitigated thermal drift. Considering the OTDR’s precision, backscatter-signal fluctuations, and residual thermal variations, the combined measurement uncertainty was conservatively estimated to be within ±3% (or <0.5 dB/km at low dose). This narrow uncertainty ensures that the extracted RIA reflects intrinsic color-center dynamics rather than measurement noise.
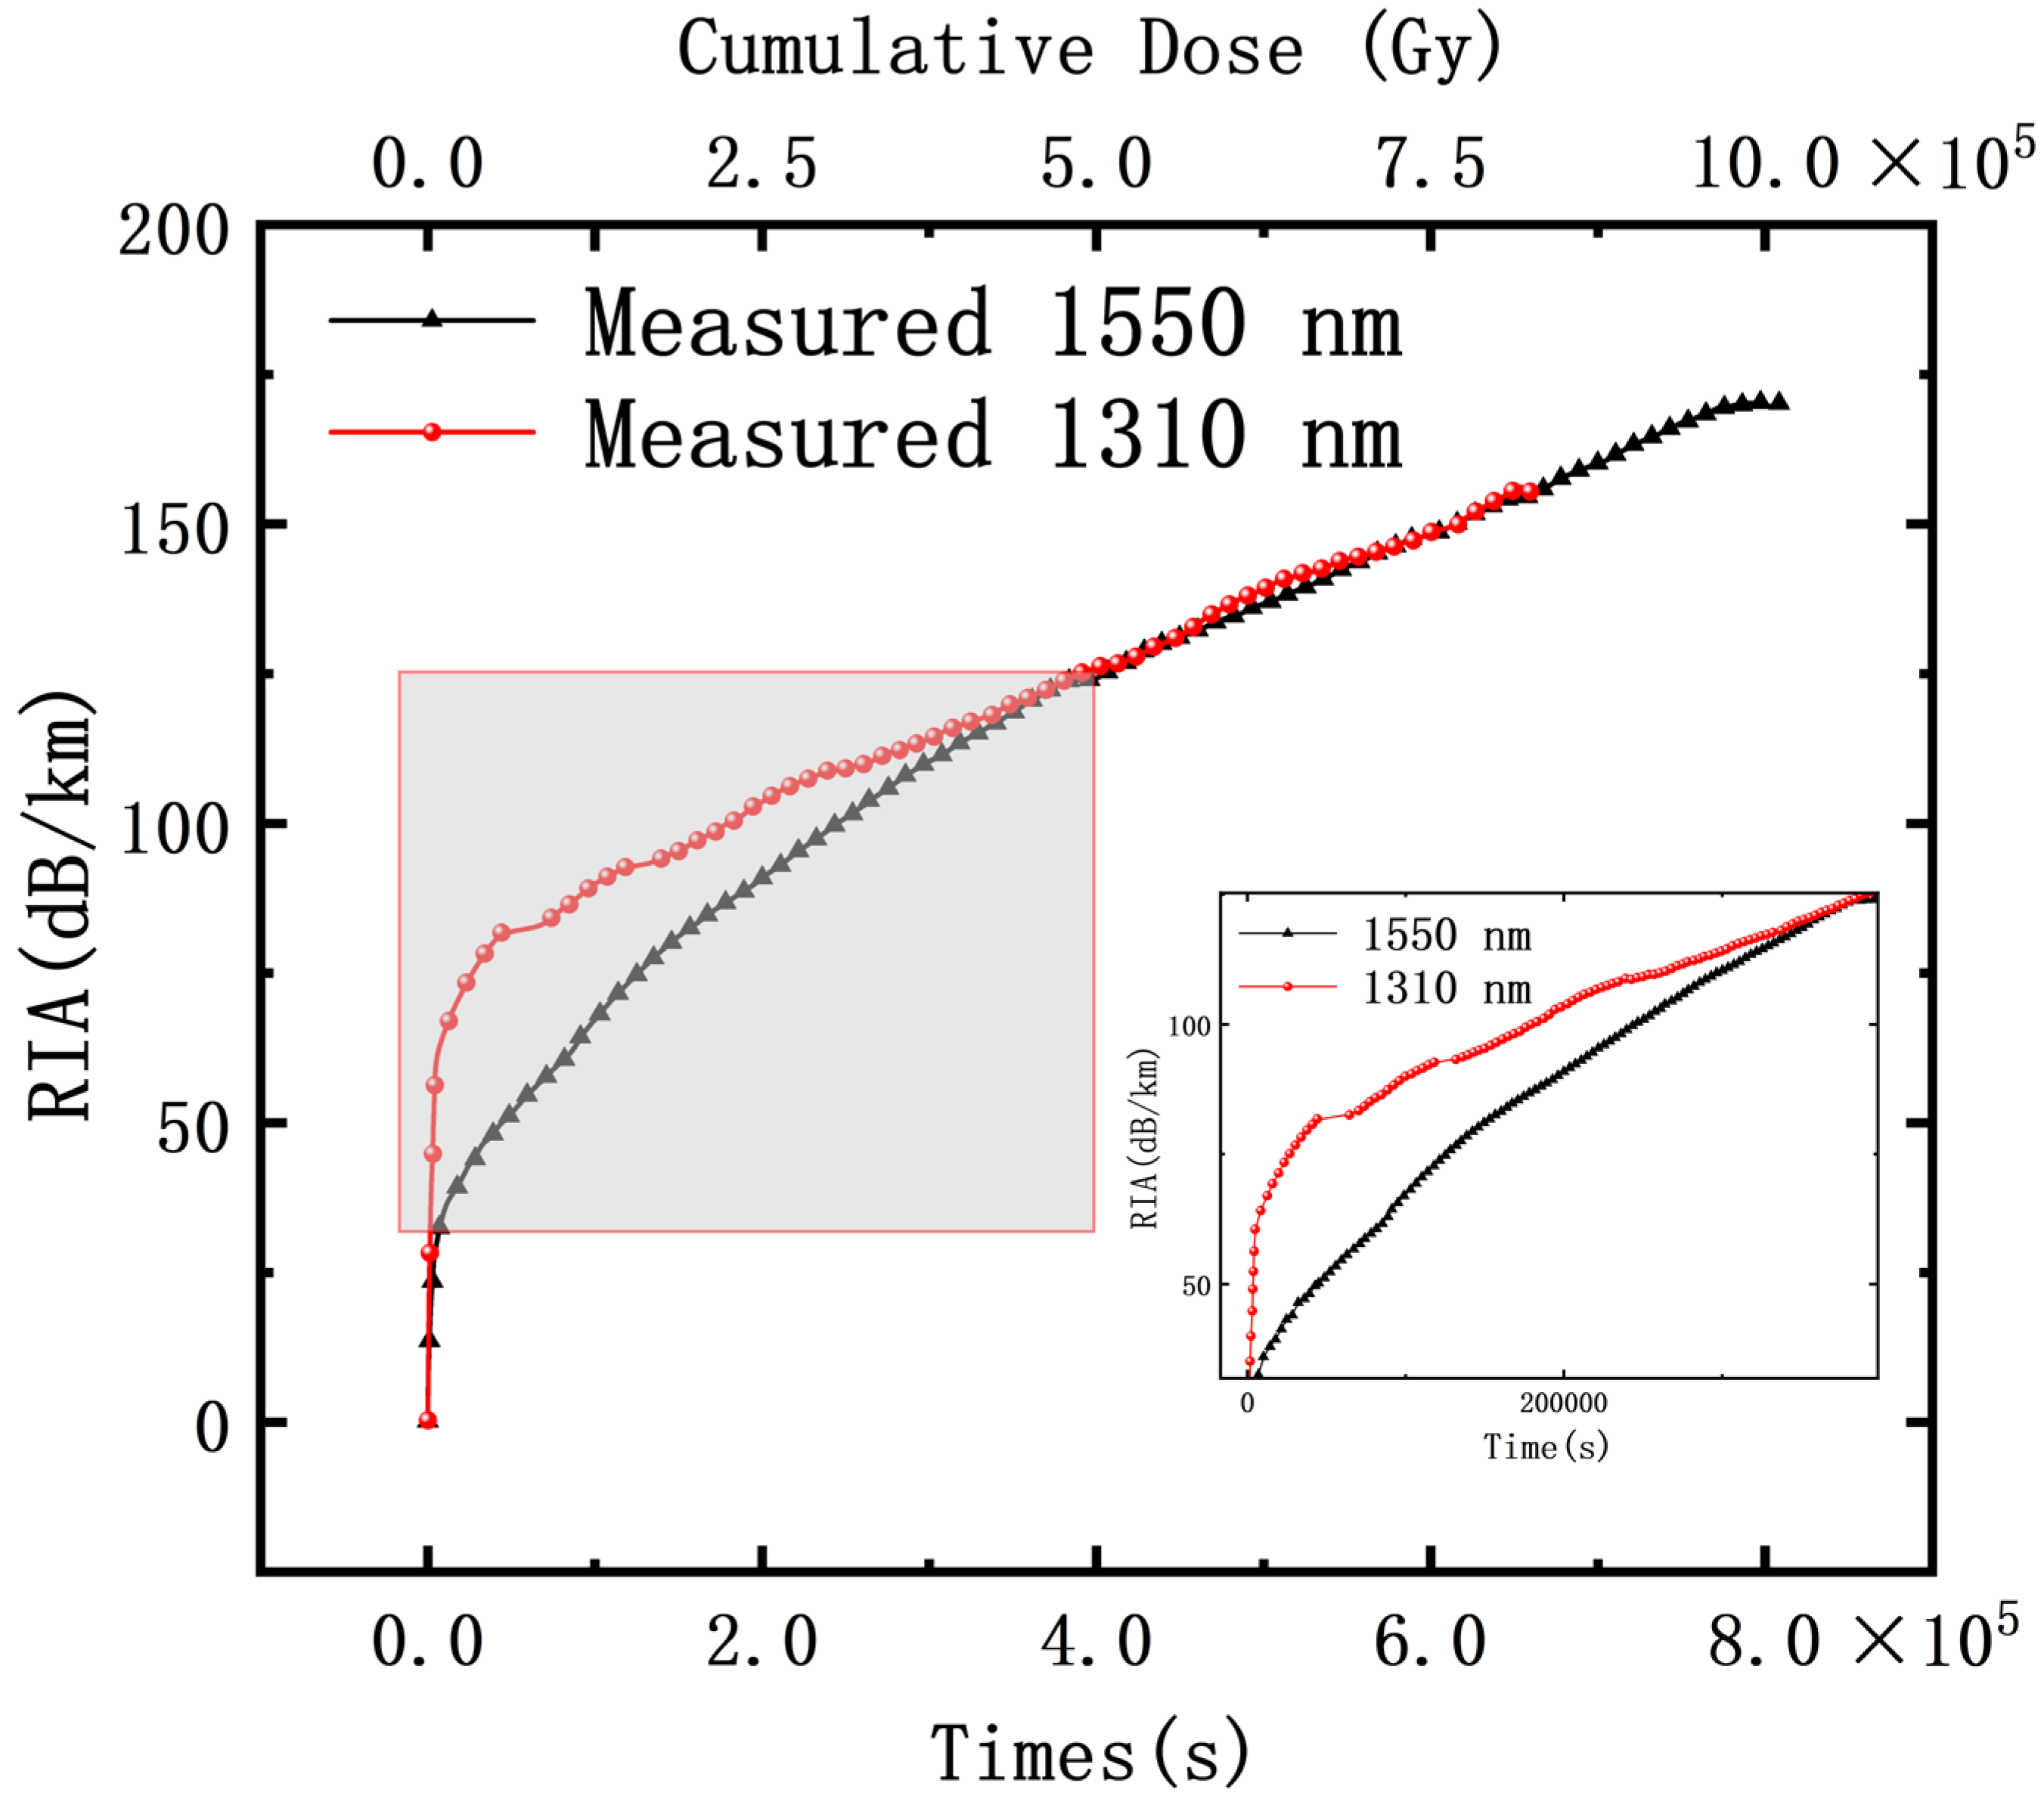
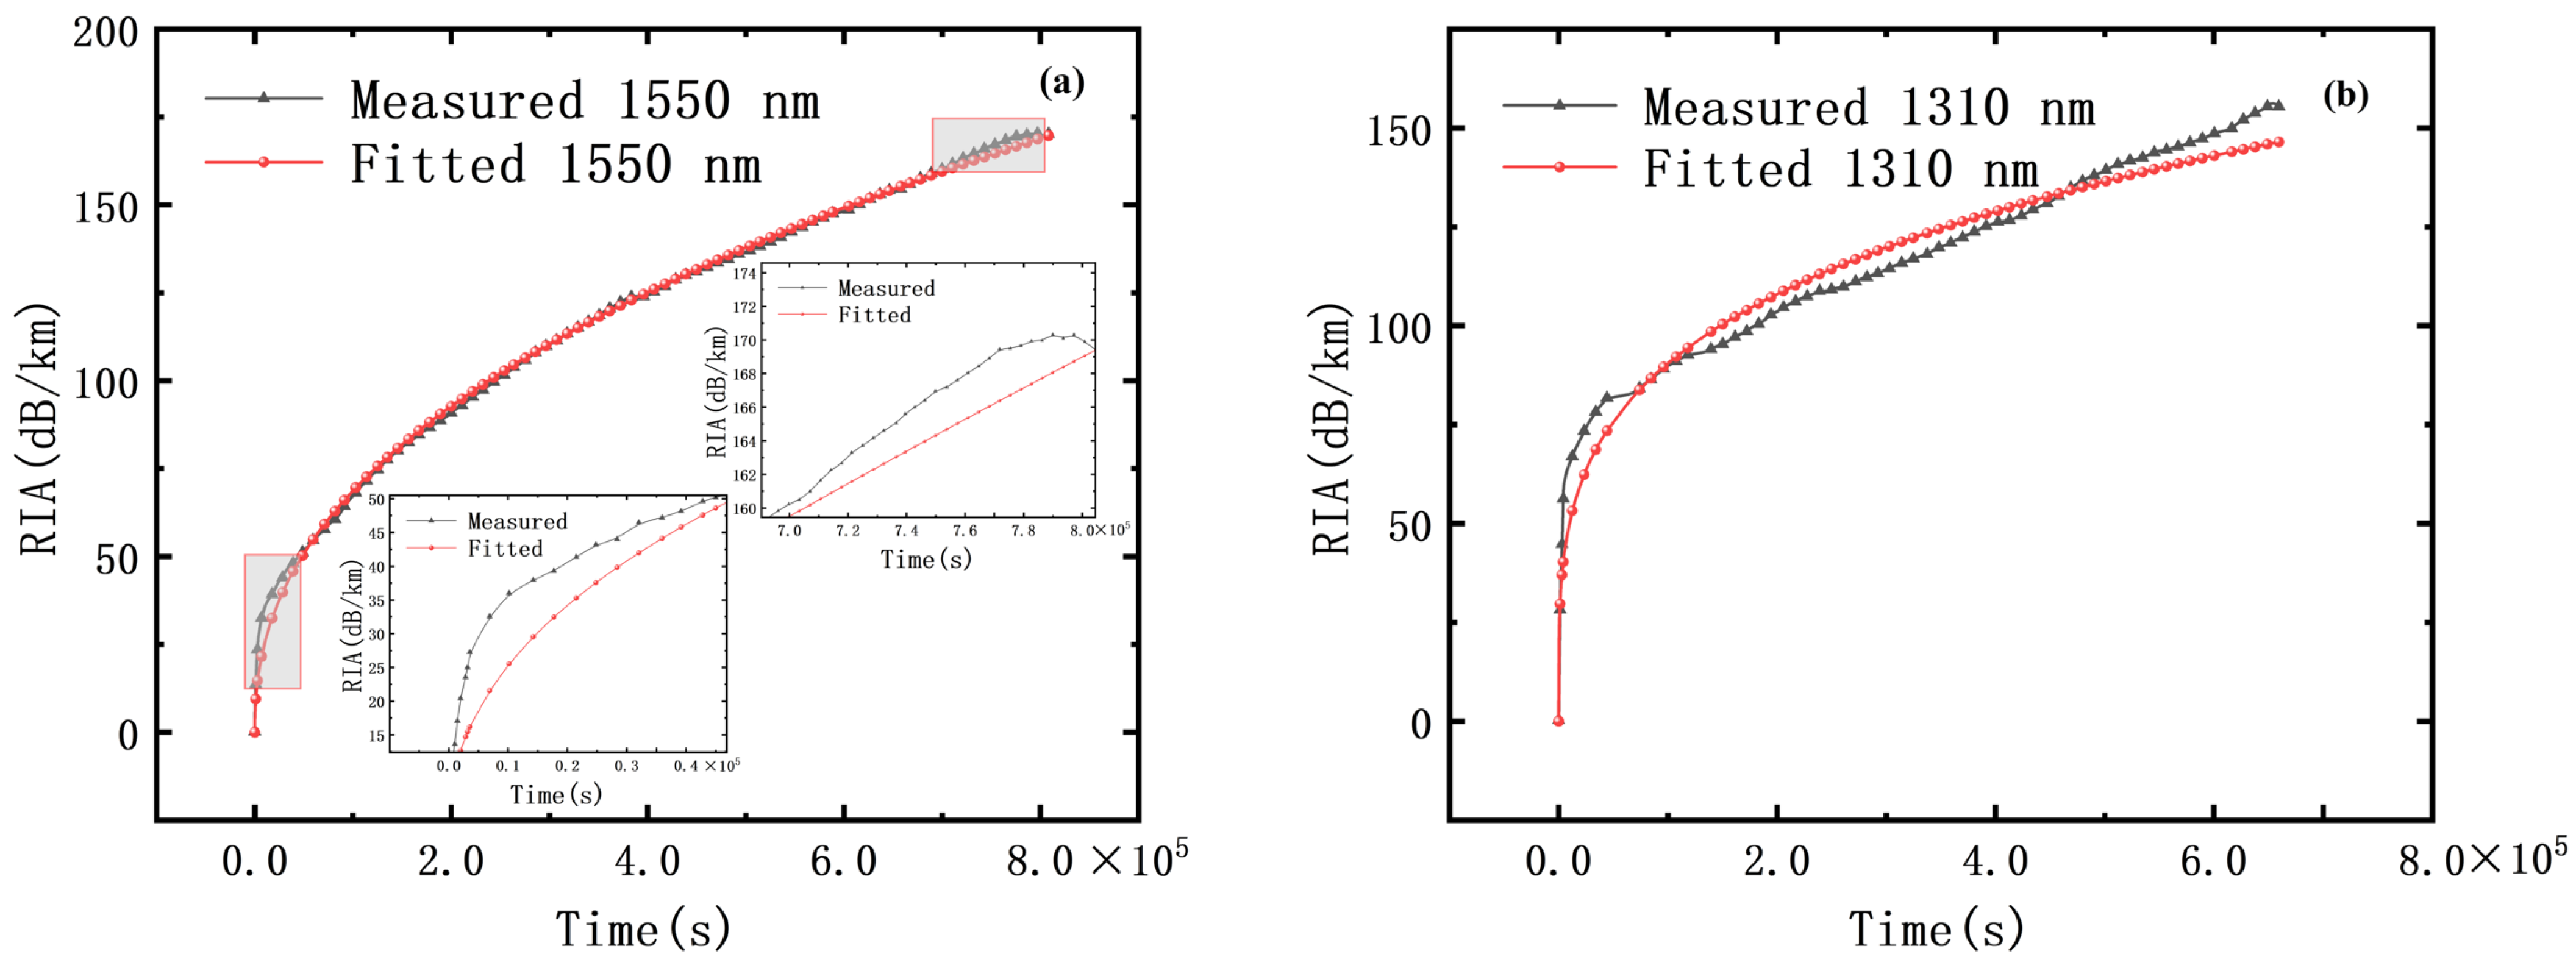
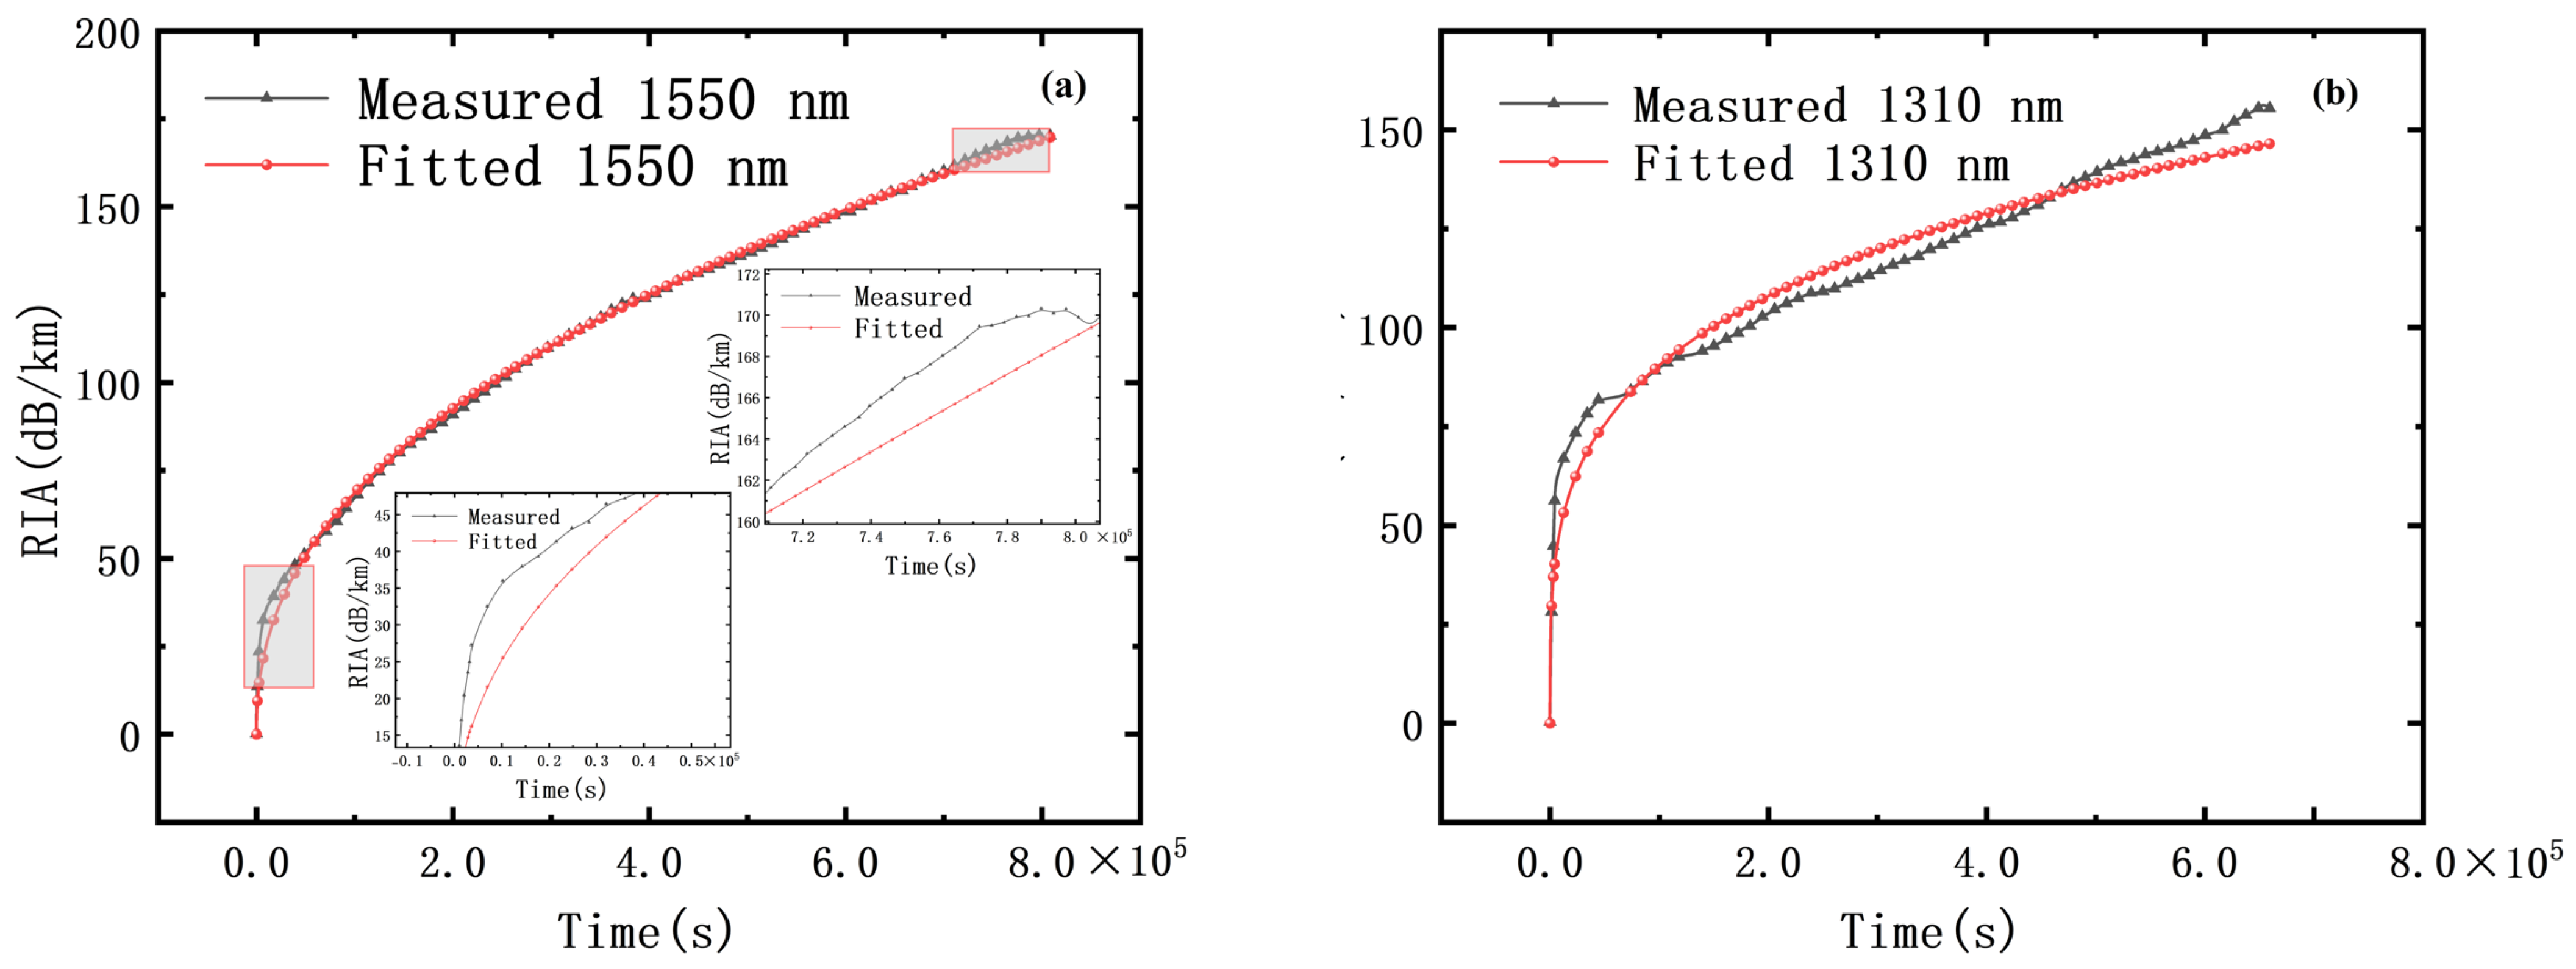
Figure 3 shows the RIA curves at 1310 nm and 1550 nm.
The RIA curves at both wavelengths share a common pattern: an initial rapid increase that gradually decelerates. Two notable differences, however, distinguish the 1310 nm and 1550 nm behavior. First, the initial rapid-growth phase at 1310 nm persists slightly longer than at 1550 nm. Second, between approximately 1000 s and 350,000 s, the growth rate at 1310 nm declines substantially faster than at 1550 nm, after which the two rates converge and remain nearly indistinguishable thereafter.
We tentatively attribute the more prolonged rapid growth at 1310 nm to the kinetics of the dominant color centers. Under irradiation, the defects that primarily govern the early attenuation at 1310 nm appear to reach a sufficient concentration rapidly, sustaining a longer phase of fast accumulation. Given that the main absorption bands of these color centers are located in the ultraviolet–visible (UV-Vis) region, their low-energy tails tend to contribute more strongly to the attenuation at 1310 nm than at 1550 nm. This spectral overlap can simultaneously explain both the extended initial surge and the subsequently faster deceleration observed at 1310 nm. It must be acknowledged, however, that with only two discrete telecom wavelengths, this interpretation remains a qualitative phenomenological interpretation; definitive assignment of band-dependent defect contributions would require future broadband radiation-induced absorption spectroscopy, for instance over the 850–1625 nm range. Finally, due to the limited irradiation duration, the 1550 nm RIA curve only began to exhibit signs of leveling off near 800,000 s.
To extract the optimal phenomenological kinetic parameters, the nonlinear curve fitting was rigorously performed using 1stOpt (First Optimization) software. The fitting process utilized a robust hybrid algorithm combining the proprietary Universal Global Optimization (UGO) method for expansive global searching and the Levenberg–Marquardt (LM) algorithm for precise local convergence. The objective function was established to minimize the Residual Sum of Squares (RSS) between the experimentally measured RIA data and the modeled predictions. To ensure physical validity and prevent mathematical singularities (e.g., negative defect capacities or zero-rate denominators), strict parameter bounds were imposed during the iteration:
ai > 0,
ki > 0,
V0i > 0, and the inherent recovery coefficient was constrained to
bi > 10
−20 s
−1. A distinct advantage of employing the UGO algorithm is its autonomous exploration of the bounded parameter space, which entirely eliminates the requirement for manual initial guesses, thereby avoiding local minima traps typically caused by human bias. The iteration stopping criteria were governed by a stringent convergence tolerance, terminating the optimization when the relative change in the objective function fell below 10
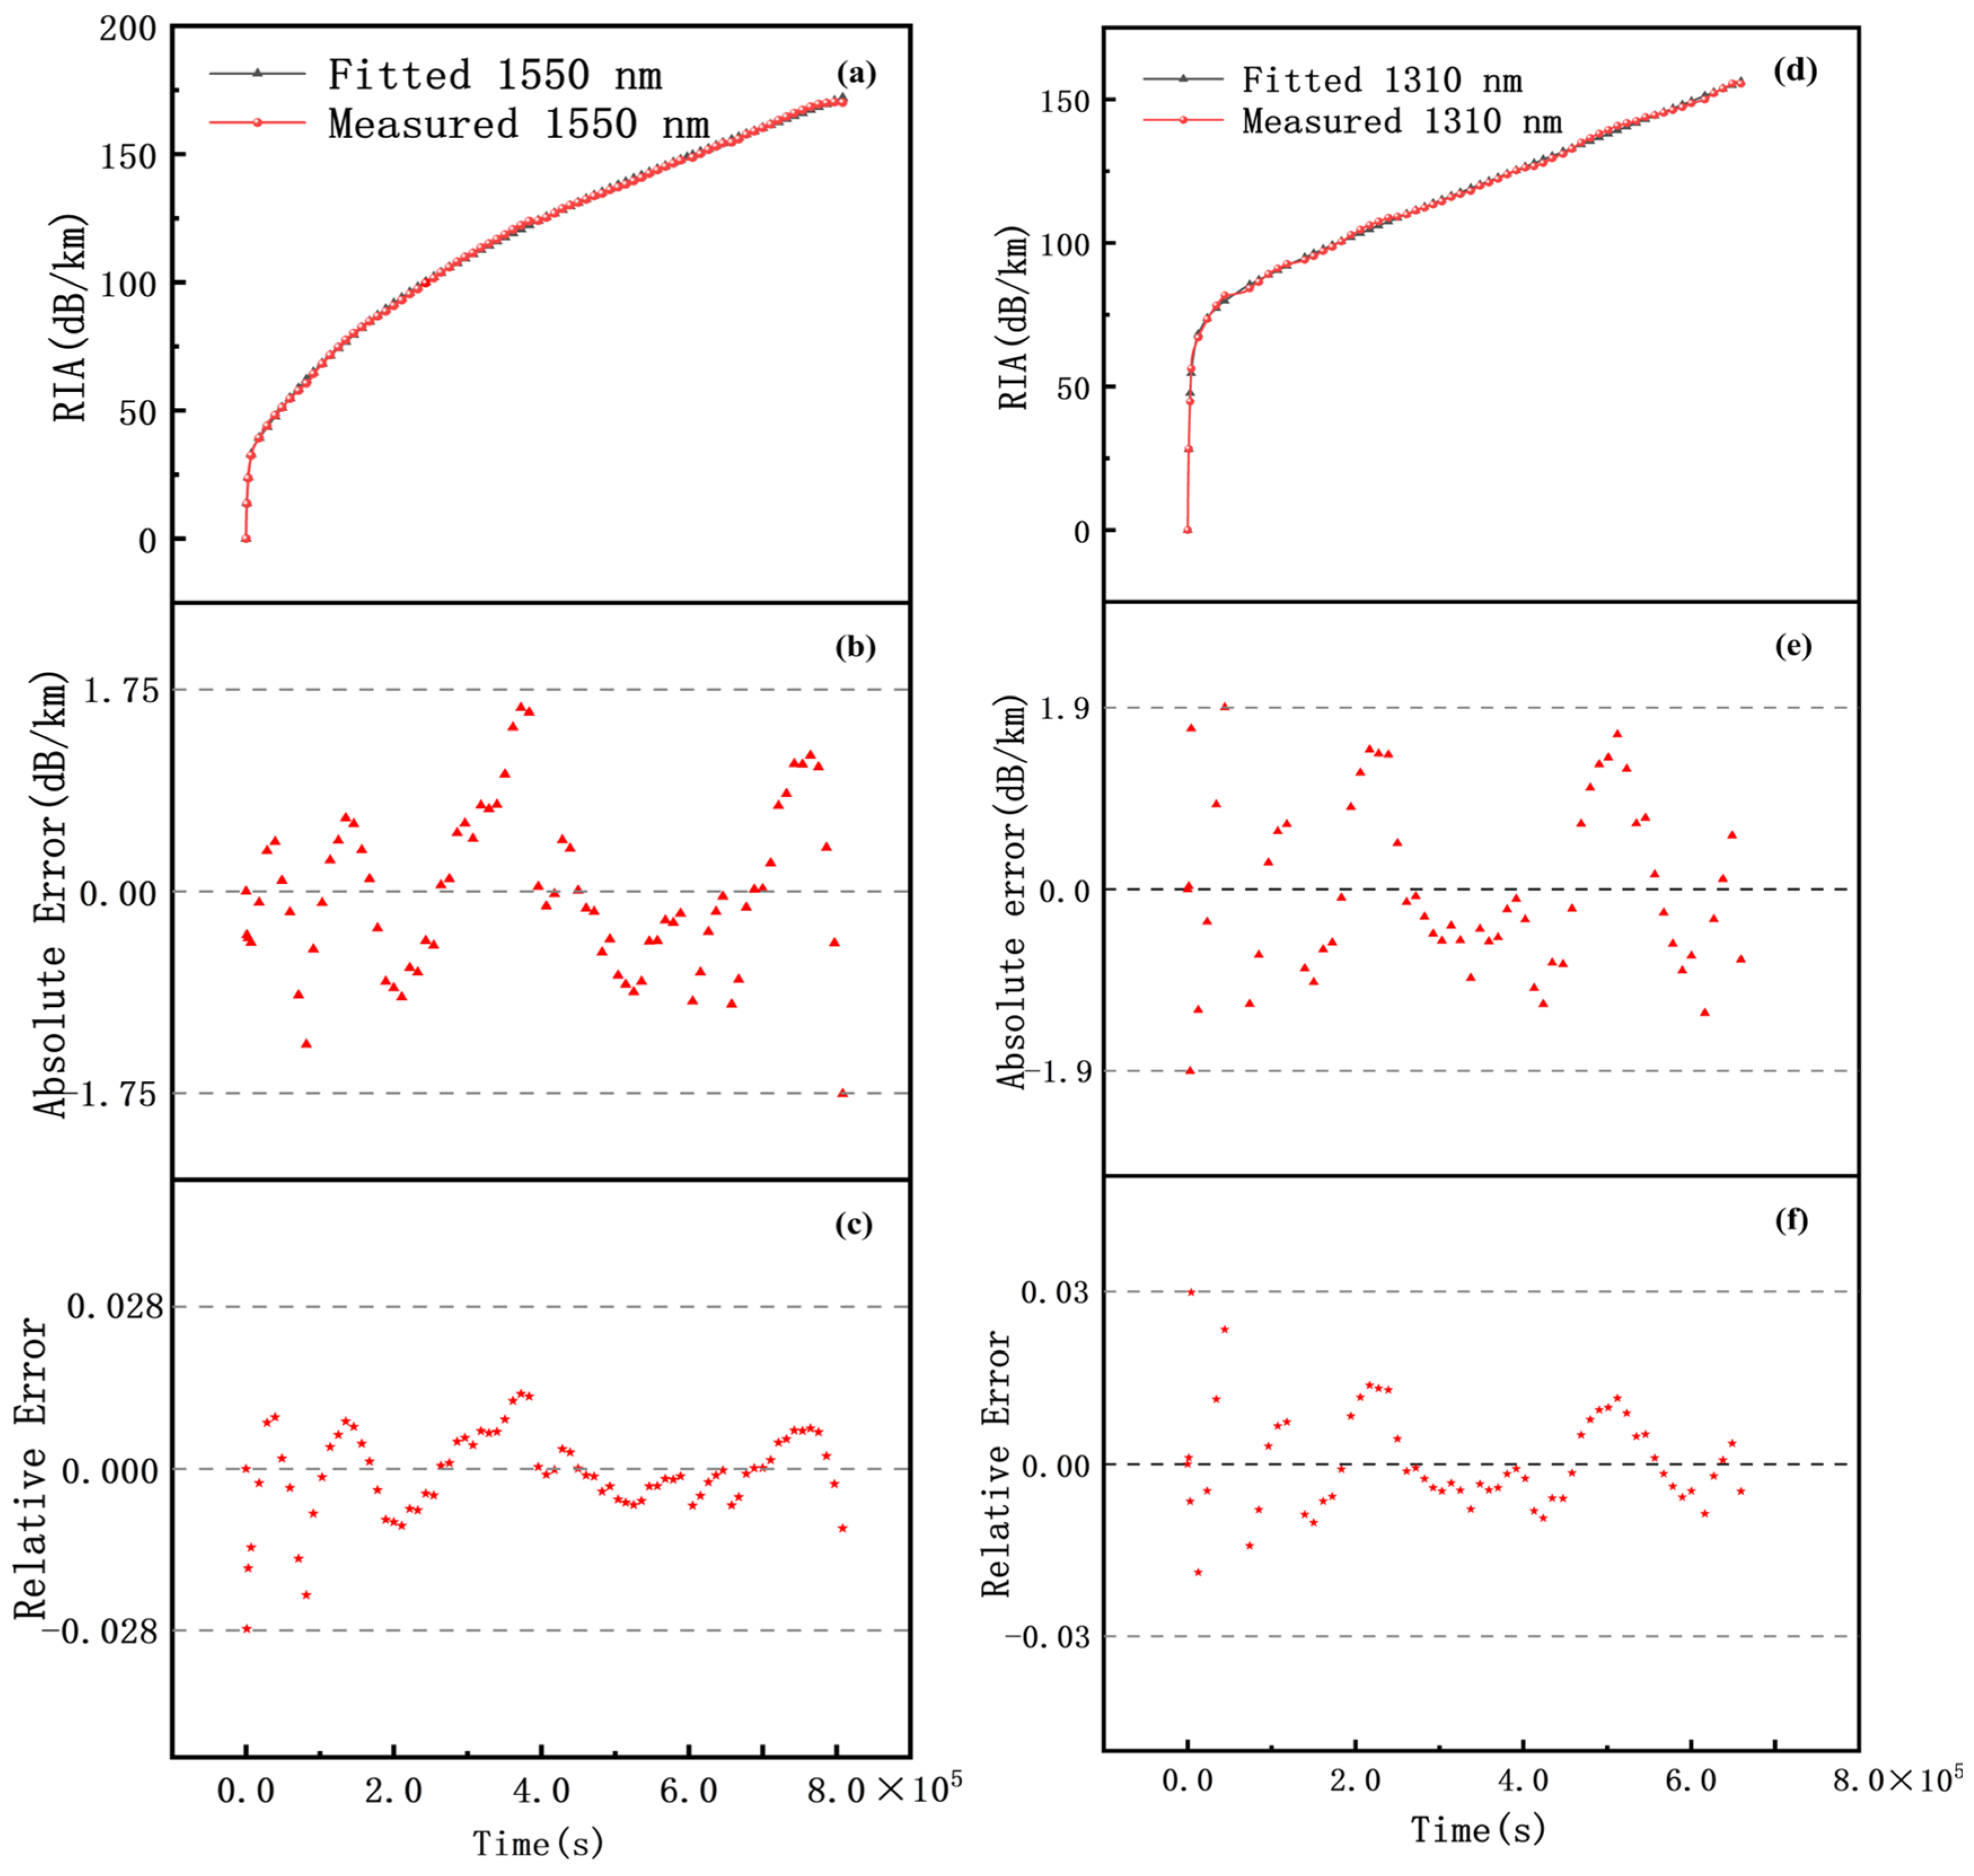
−20 or upon reaching a maximum of 1000 iteration steps. The fitting results are shown in
Figure 4.
3.1. The Derived Model
Figure 4 shows the excellent fitting accuracy of the proposed dual-center model. In conventional analyses, near-zero baseline attenuation values during early irradiation can amplify relative errors. Our model suppresses this artifact: the maximum absolute errors over the entire process are 1.75 dB/km (1550 nm) and 1.9 dB/km (1310 nm), with peak relative errors of ∼2.8% and ∼3.0%, respectively.
To assess both accuracy and parsimony, we also computed the adjusted R
2, Akaike information criterion (AIC), and Bayesian information criterion (BIC). At 1550 nm, the model yields R
2 = 0.9997 (Adj-R
2 = 0.9997), RMSE = 0.70 dB/km, NRMSE = 0.41%, MAE = 0.57 dB/km, and highly negative AIC = −149.3 and BIC = −121.7, confirming parameter efficiency. At 1310 nm, the performance is similar: R
2 = 0.9991, Adj-R
2 = 0.9991, and AIC = −24.9. These comprehensive evaluation metrics are summarized in
Table 1.
To rule out non-unique solutions from over-parameterization (n = 3), we reduced the framework to a structurally identifiable dual-center model (n = 2). Its uniqueness and fidelity are confirmed by three analyses:
- (i)
the parameter correlation matrix (
Supplementary Table S1) shows low cross-correlations (maximum |Rij| < 0.95), precluding structural degeneracy;
- (ii)
local-sensitivity perturbation curves (
Supplementary Figure S1) show that a ±10% shift in key parameters produces noticeable curve distortion, indicating tight physical constraints;
- (iii)
the 95% confidence intervals of all fitted parameters (
Table 2 and
Table 3) are narrow relative to the nominal values, confirming convergence to a unique global optimum rather than a degenerate plateau.
3.2. Parameter Identifiability and Local Sensitivity Analysis
The structural identifiability of the dual-color-center framework was first assessed using the parameter correlation matrix (
Supplementary Table S1). Cross-correlations between the first defect pool (
a1,
b1,
k1,
V01) and the second pool (
a2,
b2,
k2,
V02) are low, mostly negative or marginally positive. This pronounced inter-group decoupling indicates that the two phenomenological pools capture distinct kinetic stages without structural redundancy. Moderate-to-high intra-group correlations are observed (e.g.,
k2 −
b2 = 0.938); however, this is an intrinsic feature of saturating kinetic equations, where the steady-state limit is proportional to the
ki/
bi ratio. No correlation coefficient exceeds the degeneracy threshold, confirming that serious multicollinearity is avoided.
Parameter uniqueness was further examined by local sensitivity analysis. Each parameter was perturbed within a range proportional to its 95% confidence interval. The resulting perturbation curves (
Supplementary Figure S1) show that all parameters converge to a sharp global minimum at the 0% variation point. Parameters that govern steady-state accumulation (
k2,
b2) and the initial surge (
a1,
V01) display steep V-shaped profiles, demonstrating that they are tightly constrained by the experimental data.
The structural recovery coefficient b1 causes only a very small variation in the global RMSE (on the order of 10−13 dB/km), which is consistent with its extremely small fitted value (2.94 × 10⁻¹⁹ s−1). Physically, this implies that the transient relaxation of effective color-center 1 acts as an effectively irreversible sink on the experimental timescale. Although its contribution to the total fitting error is marginal, its well-defined local minimum preserves the structural completeness of the kinetic equations without affecting long-term predictive accuracy. Given that the experimental data consist of a single continuous irradiation curve, conventional cross-validation (e.g., leave-one-out) is not directly applicable. The combination of downscaling to a dual-center model with the rigorous sensitivity analysis therefore provides the primary evidence for global parameter uniqueness and effectively mitigates overfitting risks.
4. Fitting Other Models to Experimental Data
To further verify the superiority of the proposed model, we performed a comparative fitting analysis on the experimental data using alternative radiation-induced attenuation (RIA) models. Specifically, three representative models were selected for comparison. These benchmarks include the early classical power-law model, the classical stretched exponential model, and the color center kinetic model proposed by Liu G. et al. in 2025 [
25].
4.1. Power-Law Model
The power-law model was originally proposed to characterize the radiation-induced attenuation process in optical fibers. As an empirical model derived from experimental observations, it features a simple mathematical form, expressed as follows [
18,
19]:
The power-law model takes the form
RIA =
C·(d·t)f, where d is the constant dose rate,
D = d·t is the accumulated dose, and
t is the irradiation time, and
C and
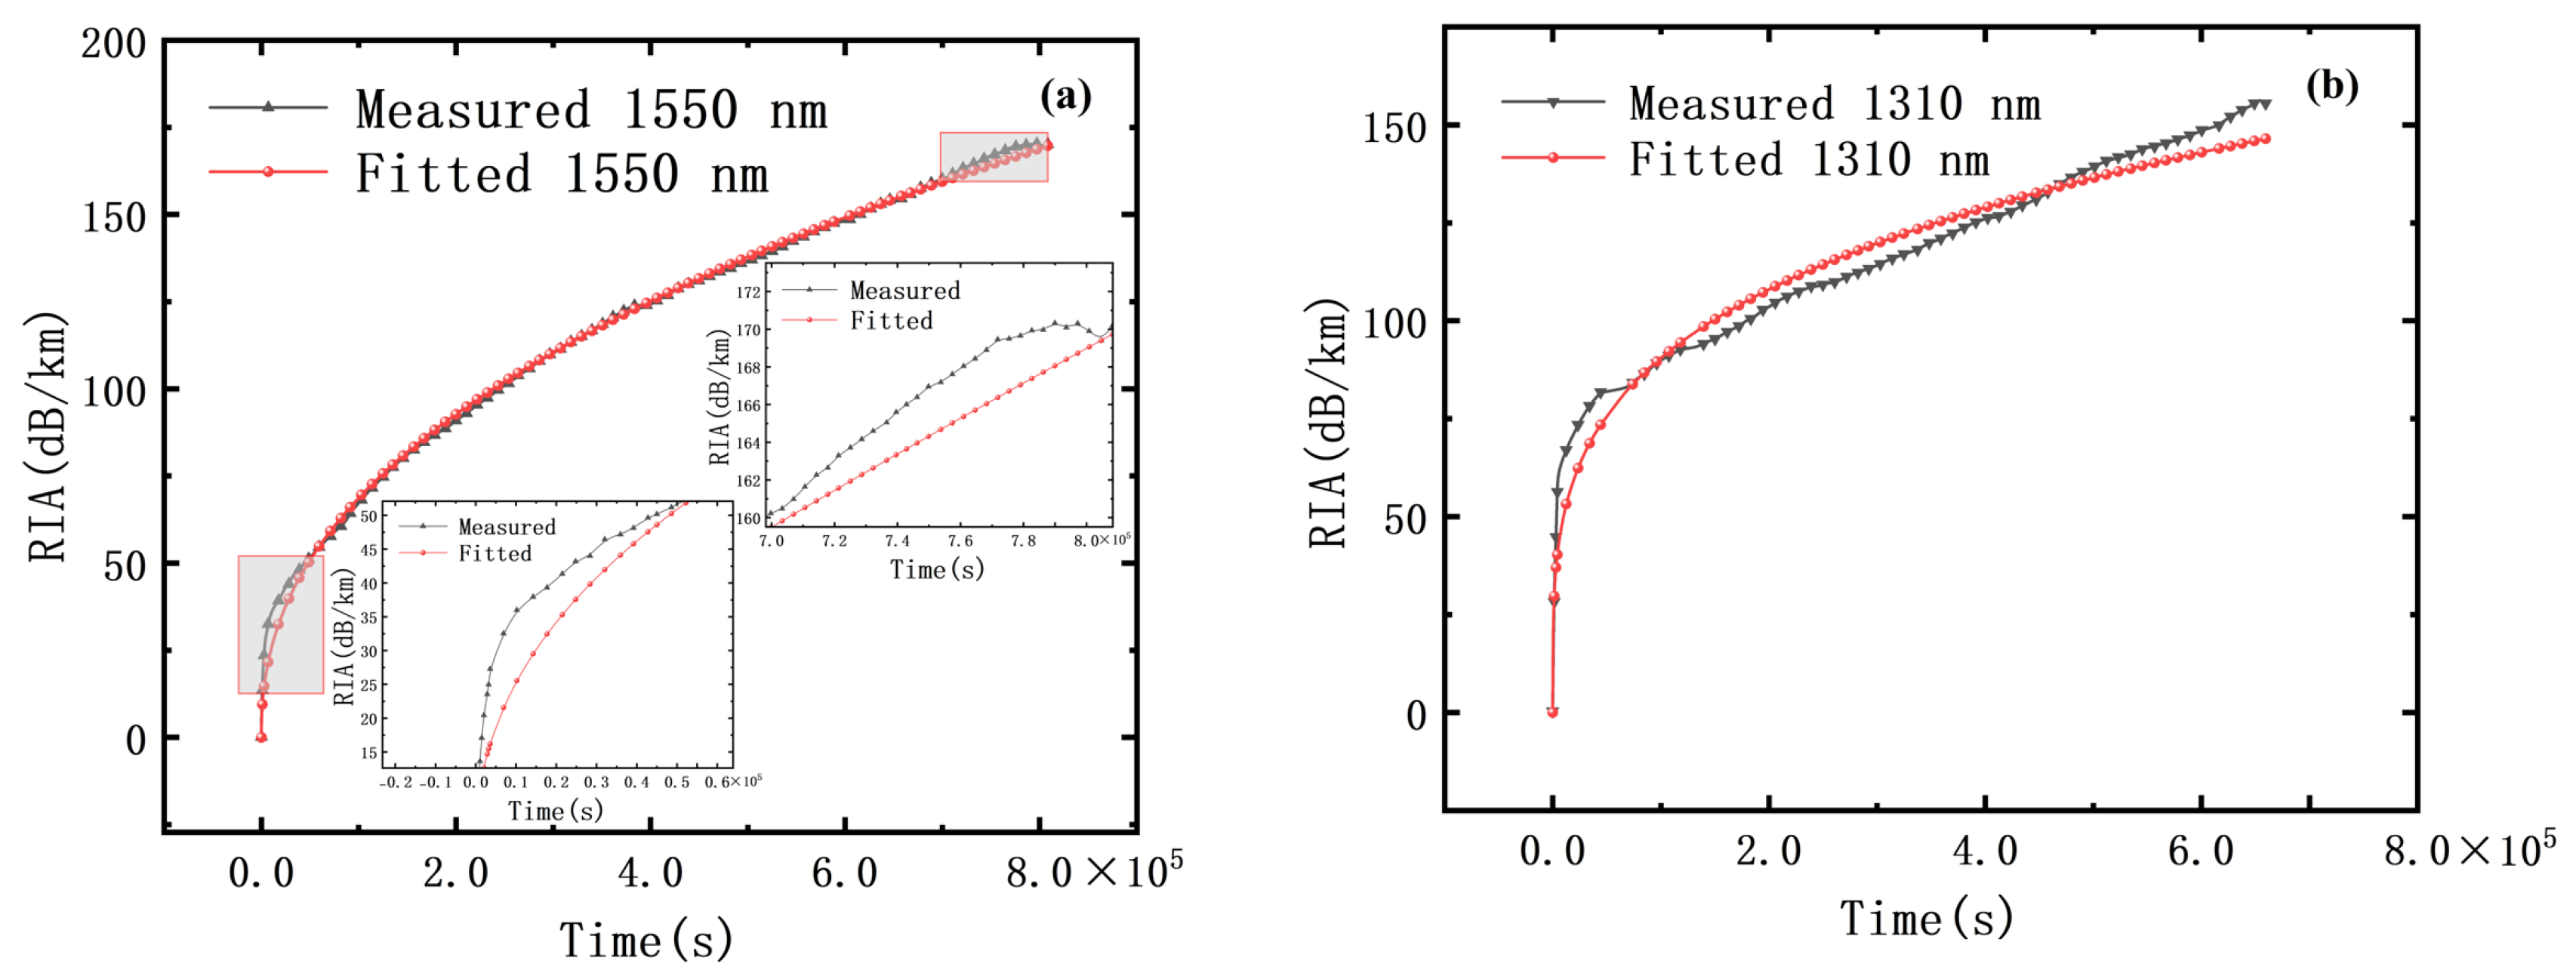
f are fitting parameters. The fitting results are shown in
Figure 5:
The power-law model serves as a baseline for describing RIA growth. However, noticeable deviations occur during the initial rapid-growth phase: as shown in the absolute and relative error plots (
Supplementary Materials), the maximum absolute error reaches 26 dB/km, with a peak relative error of ~49% (0.49). Furthermore, because the power-law lacks an intrinsic convergence limit, it represents the later-stage deceleration differently than saturating models. Note that full saturation of this fiber was not reached within the available irradiation time.
Quantitatively, for the 1550 nm band, the power-law fit yields R
2 = 0.997 (Adj-R
2 = 0.9967), RMSE = 2.27, NRMSE = 1.33%, MAE = 1.37 dB/km, AIC = 385.3, and BIC = 392.1. For the 1310 nm band, the corresponding values are R
2 = 0.9637 (Adj-R
2 = 0.9633), RMSE = 5.73, NRMSE = 3.66%, MAE = 4.81 dB/km, AIC = 635.8, and BIC = 642.2. These metrics summarize the performance of the power-law model on the present dataset. The fitted parameters with their 95% confidence intervals are listed below. These comprehensive evaluation metrics are summarized in
Table 4.
4.2. Stretched Exponential Model
The stretched exponential model is generally classified into two types: the first-order model and the second-order model. By introducing a stretching parameter to the traditional exponential model, the first-order model can more accurately characterize the continuous distribution of defect activation energies within glass materials. Building upon this, the second-order model modifies the expression of the color center concentration within the annihilation term into a second-order form. This modification allows it to more precisely describe the bimolecular interaction mechanisms during defect migration. The specific expressions for both models are as follows, where Equation (10) represents the first-order stretched exponential model, and Equation (11) represents the second-order stretched exponential model [
22]:
where the independent variable is time
t,
β is the stretching parameter, and the remaining variables are all fitting parameters. The fitting results are shown in
Figure 6,
Table 5, and
Table 6:
As shown in the
Supplementary Materials, the first-order stretched exponential model exhibits a maximum absolute error of 13 dB/km and a peak relative error of 55% (0.55). The second-order model shows larger deviations, with a maximum absolute error of 16 dB/km and a peak relative error of 46% (0.46). Its overall fitting performance and error profile are highly similar to those of the power-law model(see
Figure 7,
Table 7, and
Table 8).
Quantitatively, for the 1550 nm waveband, the first-order model achieves R
2 = 0.9970 (Adj-R
2 = 0.9969), RMSE = 2.27, NRMSE = 1.33%, and AIC = 386.2. The second-order model yields virtually identical overall metrics (R
2 = 0.997, RMSE = 2.27, AIC = 386.2), despite slightly larger localized peak deviations. Similar metric parity is observed for the 1310 nm waveband (R2 = 0.9637, RMSE = 5.73, NRMSE = 3.66%). Complete evaluation metrics, fitted parameters, and 95% confidence intervals are summarized in
Table 5,
Table 6,
Table 7 and
Table 8.
4.3. Color Center Kinetic Model (2025)
The color center model proposed by Liu G. et al. in 2025 [
25] systematically elucidates how radiation dose, dose rate, and temperature modulate the lifetime of color centers. Based on the synergistic evolution of multiple dominant color centers, high-order kinetic equations were established, thereby constructing a more comprehensive and precise radiation-induced attenuation (RIA) model. The specific expression is as follows [
24]:
where the independent variable
x is the radiation dose, and
H(x) is the step function.
λ(T) denotes the temperature-dependent function of the color centers, and
tc,β represents the characteristic times calculated as
t → 0 and
t → ∞.
k is the scaling factor representing the contribution of a single color center to the radiation-induced attenuation (RIA).
kp and
Np are the transformation coefficient and the corresponding number of precursors for the first type of color center, respectively; similarly,
ke and
Ne are the transformation coefficient and the corresponding number of precursors for the second type of color center. Additionally,
v is the defect frequency factor,
kB is the Boltzmann constant,
Ea is the activation energy coefficient, and
T is the temperature. The remaining terms are stretching coefficients.
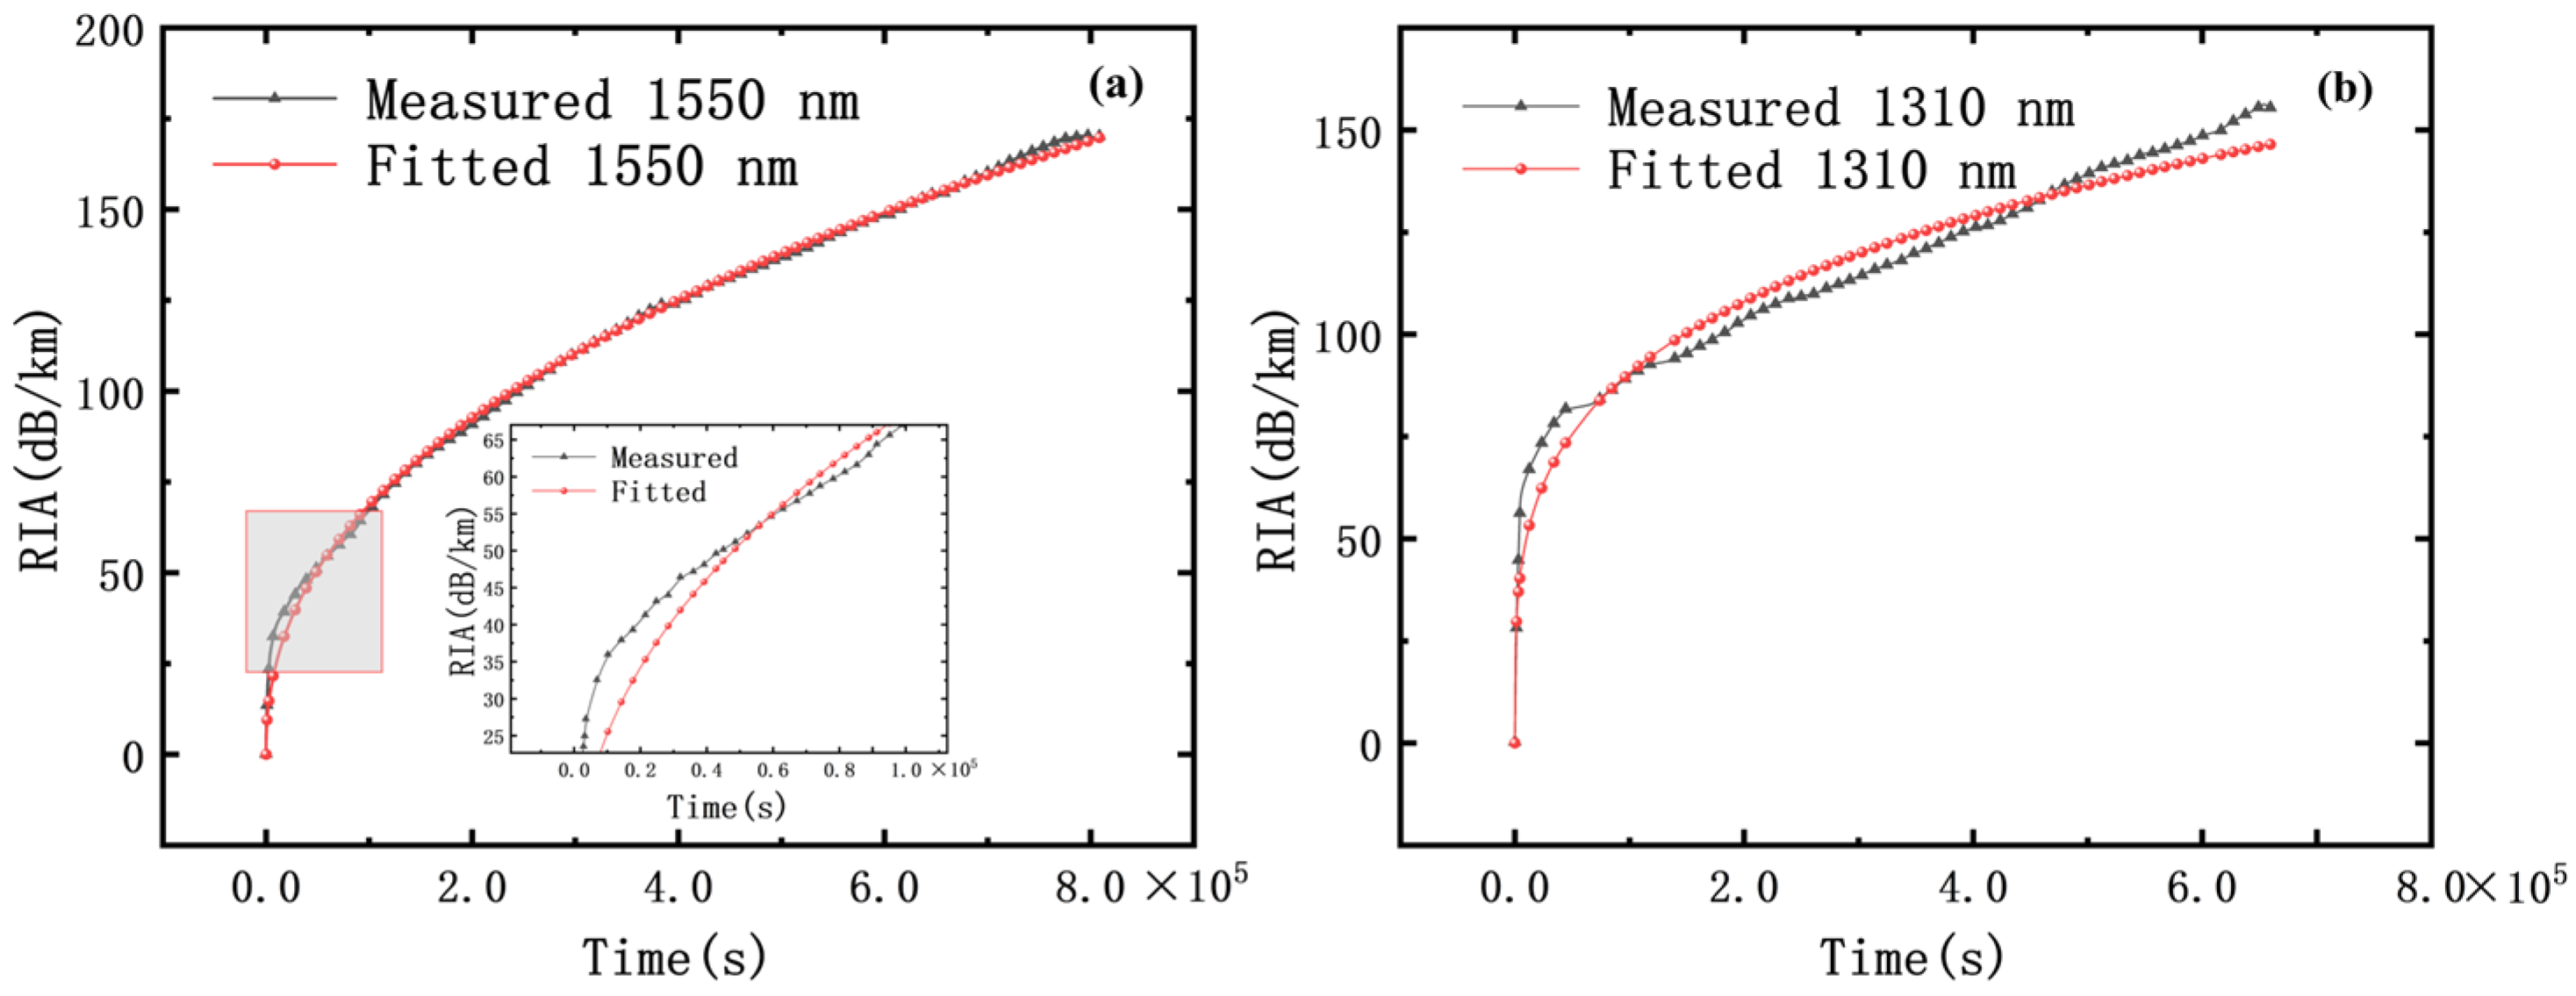
This model divides the RIA process into an initial linear growth stage and a subsequent dose-dependent power-law growth stage. A step function is utilized to bridge the transition between these two evolutionary stages, with the overall trend ultimately approaching a saturation state. Although most parameters within the model possess distinct physical meanings, to enhance the overall fitting accuracy in this study, their value ranges were not constrained by actual physical boundaries. The corresponding fitting results are shown in
Figure 8,
Table 9 and
Table 10:
For the 2025 model, the 1550 nm waveband yields R2 = 0.9969 (Adj-R2 = 0.9968), NRMSE = 1.34%, and MAE = 1.33 dB/km. For the 1310 nm waveband, the corresponding values are R2 = 0.9637 (Adj-R2 = 0.9618), NRMSE = 3.66%, and MAE = 4.81 dB/km. These metrics are highly consistent with the power-law model results, reflecting the fact that, under the present isothermal conditions, the 2025 model largely reduces to a power-law-like behavior.
It should be noted that the 2025 model is a physically comprehensive framework designed to capture synergistic dose-, dose-rate-, and temperature-dependent effects. Because our experiment was conducted at a strictly constant temperature (10 ± 2 °C), the temperature-dependent term reduces to a constant, and its associated parameter (Ea) becomes unactivated, causing the model to degenerate.
Therefore, the present comparison should not be taken as a judgment of either model’s fundamental capability. Rather, it highlights their complementary application domains: the 2025 model is an indispensable tool for predicting radiation damage under dynamically varying environments, whereas our phenomenological multi-center model provides a streamlined approach optimized for decoupling steady-state kinetic parameters from stable isothermal datasets without introducing over-parameterization.
4.4. Comparison of Model Evaluation Metrics
Table 11 compares the four evaluation metrics (R
2, RMSE, and MAE) for the fitting accuracy of the proposed model, the power-law model, the first- and second-order stretched exponential models, and the 2025 model at 1550 nm and 1310 nm.
Among the compared models, the proposed dual-center formulation shows the closest agreement with the experimental data at both wavelengths. At 1550 nm, it yields R2 = 0.9997, NRMSE = 0.41%, and MAE = 0.57 dB/km, with AIC = −149.31 and BIC = −121.73. For comparison, the power-law, first- and second-order stretched exponential, and 2025 models all give R2 values near 0.997 and NRMSE around 1.33%. The 2025 model produces the highest AIC (400.88), which is attributable to its additional temperature-dependent terms that cannot be activated under the present isothermal conditions, thereby increasing the parameter count without notably improving the fit.
At 1310 nm, where the RIA curves exhibit stronger fluctuations, the proposed model maintains an NRMSE of 0.57% and MAE of 0.73 dB/km, whereas the other models show NRMSE values exceeding 3.6% and considerably larger AIC values (e.g., 649.81 for the 2025 model). Its Adj-R2 (0.9991) is virtually identical to R2, suggesting that the dual-center parameterization captures the essential kinetic features without obvious over-fitting. Overall, under the present experimental conditions, the proposed phenomenological model offers a favorable combination of fitting accuracy and statistical parsimony relative to the selected benchmarks.
4.5. Kinetic Decoupling into Effective Color-Center Pools
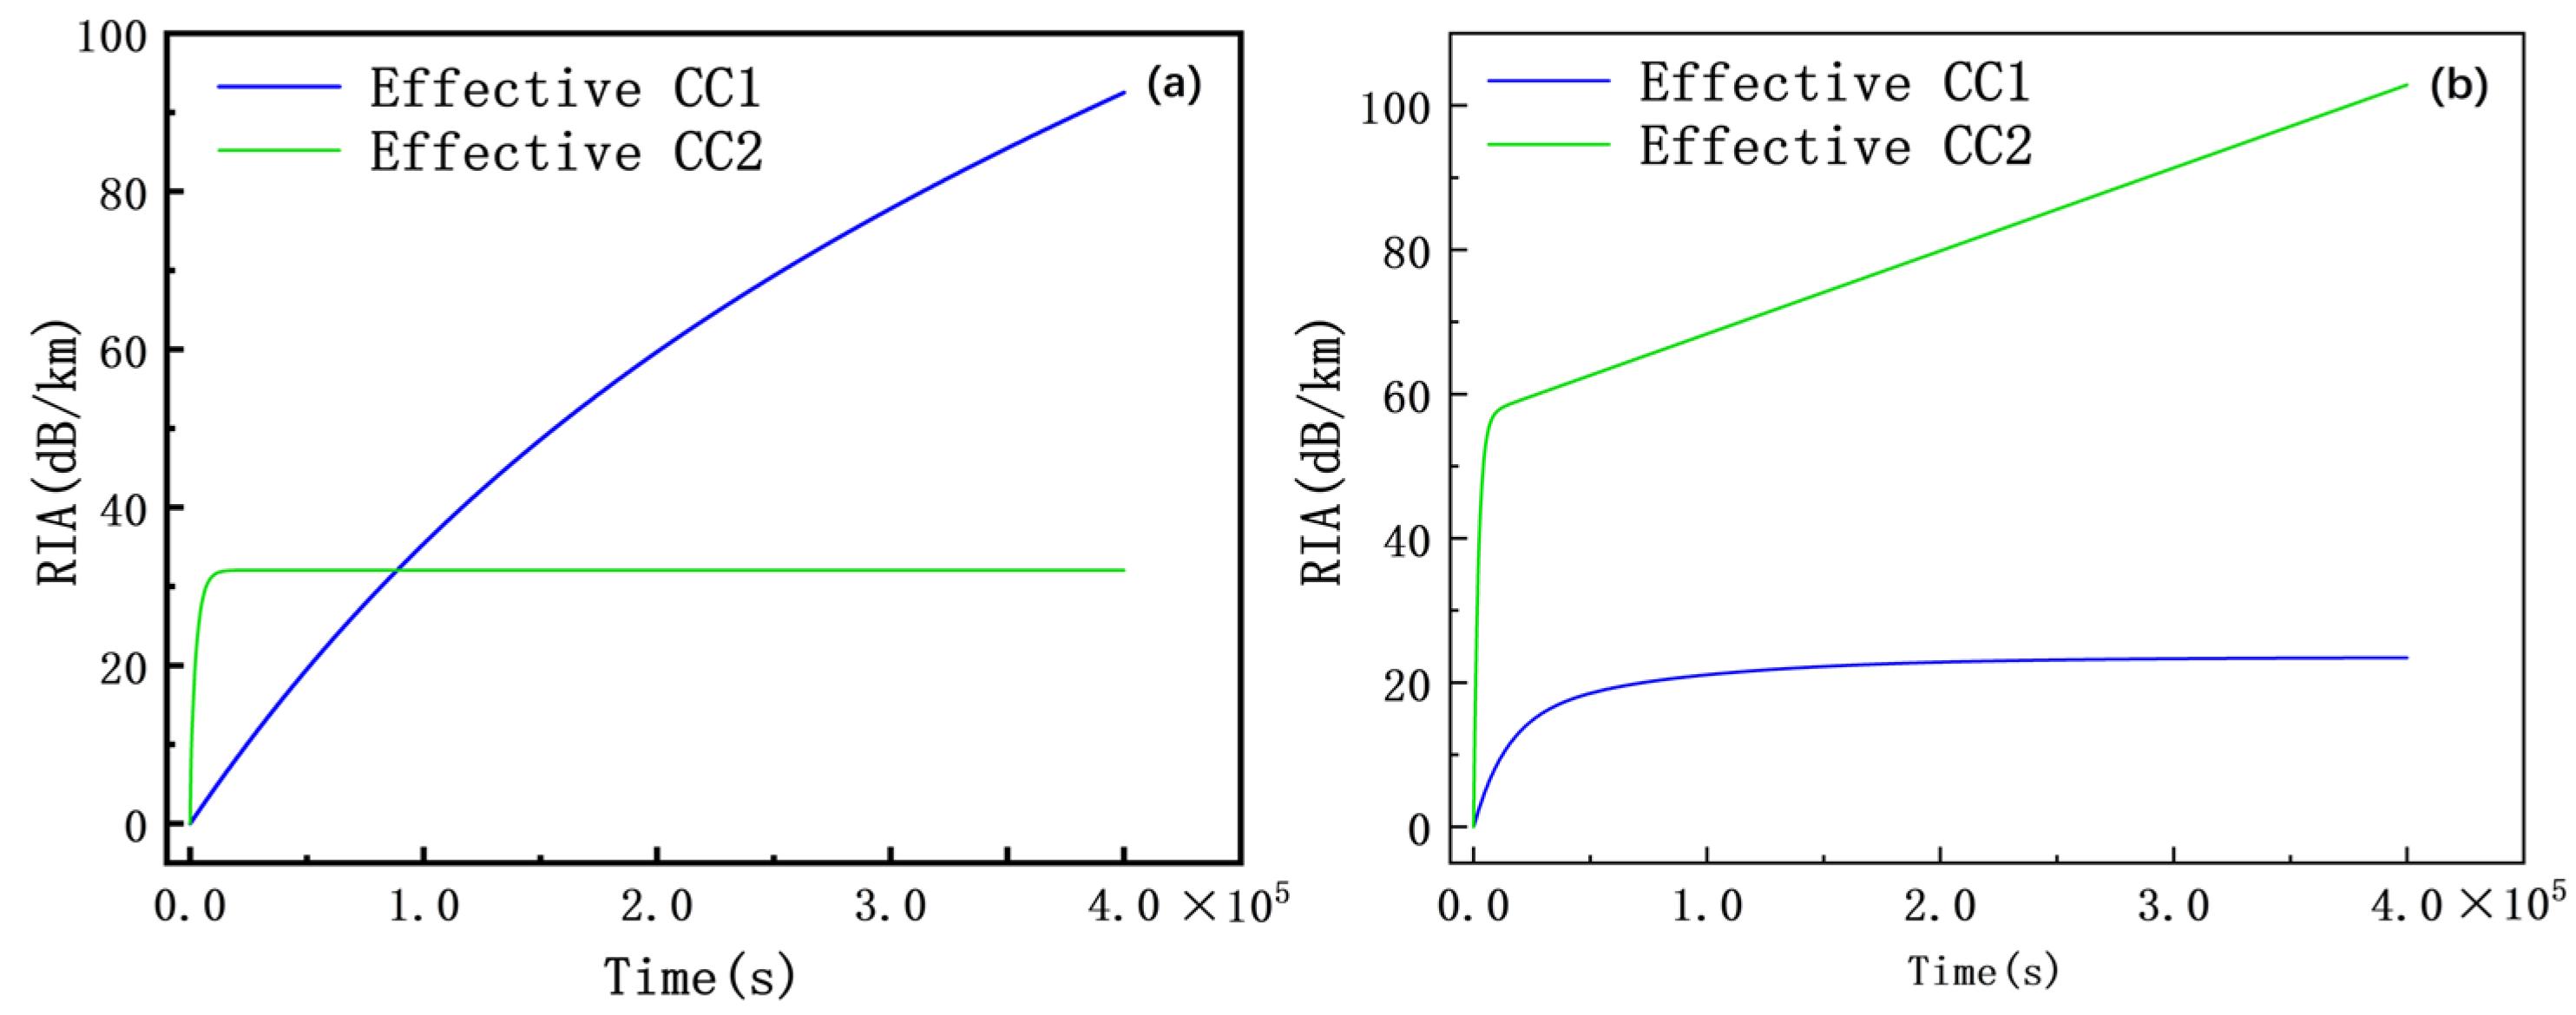
The proposed dual-center model separates the macroscopic RIA into two phenomenological defect pools; their individual evolutions are shown in
Table 10.
The kinetic parameters for the two effective centers were fitted independently for the 1310 nm and 1550 nm datasets. Because the infrared absorption tails of various point defects overlap differently across wavelengths, the defect sub-populations that dominate the two bands are kinetically distinct. Thus, “Effective CC1” and “Effective CC2” denote wavelength-specific kinetic components, not universal atomic structures. This independent treatment captures the distinct weighted-average kinetics governing each band, which improves the phenomenological fitting accuracy.
Using this phenomenological concept, the macroscopic RIA is successfully resolved into a fast-saturating perturbation and a steady-state accumulation. As illustrated in
Figure 9a for the 1550 nm waveband, Effective CC2 exhibits rapid initial growth and quickly reaches a state of complete saturation. This behavior is characteristic of a fast-response defect pool restricted by rapid precursor depletion or structural relaxation. Conversely, Effective CC1 demonstrates continuous, monotonic growth without reaching saturation within the test timeframe, serving as the dominant steady-state pool governing long-term degradation.
A kinetically analogous decoupling is observed at 1310 nm (
Figure 9b). Here, Effective CC1 acts as the fast-saturating transient component, plateauing early in the irradiation process, while Effective CC2 dictates the continuous, long-term attenuation trend.
This dual-center reduction avoids over-parameterization and highlights the key kinetic coefficients governing long-term attenuation, thereby serving as a robust tool for evaluating intrinsic radiation resistance under steady-state conditions.
4.6. Boundary Conditions and Limitations of the Phenomenological Model
While the proposed multi-color-center kinetic model provides a robust mathematical framework for predicting radiation-induced attenuation (RIA), it is essential to acknowledge its underlying physical assumptions. As is well known, amorphous silica optical fibers exhibit highly complex micro-dynamics under irradiation, where processes such as defect generation, carrier trapping, electron–hole recombination, thermal annealing, hydrogen-related passivation, photobleaching, and precursor depletion often occur simultaneously. To establish a solvable mathematical model, our work mathematically decouples these complex micro-dynamics by adopting a phenomenological simplification, which includes independent parameter fitting for individual wavelength bands.
These strict assumptions are highly effective for extracting macroscopic kinetic trends, but they inherently define the physical boundary conditions of our model. Consequently, the decoupled components must be interpreted as wavelength-specific kinetic responses rather than globally invariant atomic structures, bound by the specific telecom wavebands evaluated in this study. The proposed model is primarily valid for scenarios with steady dose rates, relatively low and stable environmental temperatures (e.g., around 10 °C, where severe thermal annealing is suppressed), and standard signal light powers where photobleaching effects are negligible. Under extreme conditions (e.g., high temperature, intense optical pumping, or hydrogen-loading), these idealized assumptions may break down.
5. Conclusions
A kinetic model driven by vacancy–color-center conversion was developed to characterize the steady-state RIA of fluorine–germanium co-doped fibers. With a dual-center configuration, the model achieves R2 > 0.999 and NRMSE < 0.57%, surpassing the conventional models considered in this work. It decouples macroscopic RIA into transient and steady-state effective pools, and its complexity can be adaptively tuned by adjusting the number of phenomenological color centers.
Beyond precise fitting, the model serves as a phenomenological kinetic decoder. Because the principal absorption bands of relevant defects (e.g., Ge-related centers) are located in the ultraviolet–visible region, their individual contributions to infrared RIA are inherently difficult to separate. By resolving the overlapping signals into distinct kinetic components, the model offers band-dependent insight into the degradation processes, which is consistent with the observed differences in RIA evolution at 1310 nm and 1550 nm.
The framework is structurally flexible: the number of effective centers can be reduced (e.g., from three to two or one) or expanded according to the specific fiber and statistical criteria, allowing quantitative extraction of steady-state kinetic parameters without over-fitting. In its current form, the model adopts a phenomenological simplification that is validated under stable conditions (10 ± 2 °C, 1.25 Gy/s). Future work will extend it to variable temperature, optical power, and dose-rate environments, as well as to broadband radiation-induced absorption spectroscopy (e.g., 850–1625 nm). Such extensions are expected to enable comprehensive dynamic calibration and physical validation of band-dependent defect contributions, providing a robust theoretical basis for the structural design and performance optimization of radiation-hardened optical fibers.
Supplementary Materials
The following supporting information can be downloaded at:
https://www.mdpi.com/article/10.3390/photonics13070655/s1. Table S1: Correlation Matrix; Figure S1: Local Sensitivity Analysis; Figure S2: Absolute and relative errors of the power-law model; Figure S3: Absolute and relative errors of first-order stretched exponential model; Figure S4: Absolute and relative errors of second-order stretched exponential model; Figure S5: Absolute and relative errors of 2025 model.
Author Contributions
Conceptualization, Y.L. (Yanrui Liu) and H.D.; methodology, H.D. and Q.D.; software, Y.L. (Yanrui Liu); formal analysis, Q.D.; investigation, Y.L. (Yanrui Liu); resources, Y.L. (Yan Li), J.Z. and W.T.; data curation, Y.L. (Yanrui Liu); writing—original draft preparation, Y.L. (Yanrui Liu); writing—review and editing, H.D. and J.Z.; project administration, W.T. All authors have read and agreed to the published version of the manuscript.
Funding
This work was supported in part by the National Natural Science Foundation of China under Grant 12004290 and Grant 51909195, in part by Hubei Provincial Natural Science Foundation of China under Grant 2020CFB251, in part by Wuhan East Lake High-tech Development Zone (2024KJB302), in part by Scientific Research Project of Education Department of Hubei Province under Grant Q20181501 and Grant Q20191512, and in part by the Scientific Research Foundation of Wuhan Institute of Technology (23QD106).
Institutional Review Board Statement
Not applicable.
Informed Consent Statement
Not applicable.
Data Availability Statement
Data underlying the results presented in this paper are not publicly available at this time but may be obtained from the authors upon reasonable request.
Acknowledgments
The authors would like to express their sincere gratitude to Wuhan Institute of Technology for providing the academic platform and research resources. Special thanks go to Feiling Optical Fiber Co., Ltd., for their invaluable technical assistance and material support during the experimental phase. Furthermore, we are deeply grateful to Shuhui Liu and Haoze Du for their insightful guidance, constructive discussions, and unwavering support throughout this research.
Conflicts of Interest
Authors Haoze Du, Quanrong Deng, Jin Zhang and Wei-jun Tong were employed by the company Wuhan Fibersight Optoelectronic Science and Technology Corporation Ltd. The remaining authors declare that the research was conducted in the absence of any commercial or financial relationships that could be construed as a potential conflict of interest.
References
- Liu, H.H.; Hu, D.J.J.; Sun, Q.Z.; Wei, L.; Li, K.; Liao, C.; Li, B.; Zhao, C.; Dong, X.; Tang, Y.; et al. Specialty optical fibers for advanced sensing applications. Opto-Electron. Sci. 2023, 2, 220025. [Google Scholar] [CrossRef]
- Ma, S.; Xu, Y.; Pang, Y.; Zhao, X.; Li, Y.; Qin, Z.; Liu, Z.; Lu, P.; Bao, X. Optical fiber sensors for high-temperature monitoring: A review. Sensors 2022, 22, 5722. [Google Scholar] [CrossRef] [PubMed]
- Wang, Y.; Li, J.; Guo, L.N.; Tian, M.; Meng, F. Development of fabrication technique and sensing performance of optical fiber humidity sensors in the most recent decade. Measurement 2023, 215, 112888. [Google Scholar] [CrossRef]
- Li, J.; Chen, Q.; Zhou, J.; Cao, Z.; Li, T.; Liu, F.; Yang, Z.; Chang, S.; Zhou, K.; Ming, Y.; et al. Radiation damage mechanisms and research status of radiation-resistant optical fibers: A review. Sensors 2024, 24, 3235. [Google Scholar] [CrossRef] [PubMed]
- Brunetti, G.; Campiti, G.; Tagliente, M.; Ciminelli, C. Cots devices for space missions in leo. IEEE Access 2024, 12, 76478–76514. [Google Scholar] [CrossRef]
- Griscom, D.L. Nature of defects and defect generation in optical glasses. Proc. SPIE 1985, 541, 38–59. [Google Scholar] [CrossRef]
- Griscom, D.L. A minireview of the natures of radiation-induced point defects in pure and doped silica glasses and their visible/near-IR absorption bands, with emphasis on self-trapped holes and how they can be controlled. Phys. Res. Int. 2013, 2013, 379041. [Google Scholar] [CrossRef]
- Giacomazzi, L.; Martin-Samos, L.; Alessi, A.; Valant, M.; Gunturu, K.C.; Boukenter, A.; Ouerdane, Y.; Girard, S.; Richard, N. Optical absorption spectra of P defects in vitreous silica. Opt. Mater. Express 2018, 8, 385–400. [Google Scholar] [CrossRef]
- Girard, S.; Alessi, A.; Richard, N.; Martin-Samos, L.; De Michele, V.; Giacomazzi, L.; Agnello, S.; Di Francesca, D.; Morana, A.; Winkler, B.; et al. Overview of radiation induced point defects in silica-based optical fibers. Rev. Phys. 2019, 4, 100032. [Google Scholar] [CrossRef]
- Regnier, E.; Flammer, I.; Girard, S.; Gooijer, F.; Achten, F.; Kuyt, G. Low-dose radiation-induced attenuation at infrared wavelengths for P-doped, Ge-doped and pure silica-core optical fibres. IEEE Trans. Nucl. Sci. 2007, 54, 1115–1119. [Google Scholar] [CrossRef]
- Di Francesca, D.; Girard, S.; Agnello, S.; Alessi, A.; Marcandella, C.; Paillet, P.; Richard, N.; Boukenter, A.; Ouerdane, Y.; Gelardi, F.M. Cerium codoping effect on the radiation response of germanosilicate and phosphosilicate multimode optical fibers. In Proceedings of the 2015 15th European Conference on Radiation and Its Effects on Components and Systems (RADECS), Moscow, Russia, 14–18 September 2015; pp. 1–4. [Google Scholar]
- Stone, J. Interactions of hydrogen and deuterium with silica optical fibers: A review. J. Light. Technol. 1987, 5, 712–733. [Google Scholar] [CrossRef]
- Xing, Y.-B.; Liu, Y.-Z.; Zhao, N.; Cao, R.-T.; Wang, Y.-B.; Yang, Y.; Peng, J.-G.; Li, H.-Q.; Yang, L.-Y.; Dai, N.-L.; et al. Radical passive bleaching of Tm-doped silica fiber with deuterium. Opt. Lett. 2018, 43, 1075–1078. [Google Scholar] [CrossRef] [PubMed]
- Di Francesca, D.; Agnello, S.; Girard, S.; Alessi, A.; Marcandella, C.; Paillet, P.; Boukenter, A.; Gelardi, F.M.; Ouerdane, Y. O2-loading treatment of Ge-doped silica fibers: A radiation hardening process. J. Light. Technol. 2016, 34, 2311–2316. [Google Scholar]
- Friebele, E.J.; Gingerich, M.E. Photobleaching effects in optical fiber waveguides. Appl. Opt. 1981, 20, 3448–3452. [Google Scholar] [CrossRef] [PubMed]
- Toh, K.; Shikama, T.; Nagata, S.; Tsuchiya, B.; Suzuki, T.; Okamoto, K.; Shamoto, N.; Yamauchi, M.; Nishitani, T. Optical characteristics of aluminum coated fused silica core fibers under 14 MeV fusion neutron irradiation. J. Nucl. Mater. 2004, 329, 1495–1498. [Google Scholar] [CrossRef]
- Schuyt, J.J.; Duke, O.; Moseley, D.A.; Ludbrook, B.M.; Salazar, E.E.; Badcock, R.A. Gamma irradiation of Ge-doped and radiation-hard silica fibers at cryogenic temperatures: Mitigating the radiation-induced attenuation with 1550 and 970 nm photobleaching. J. Appl. Phys. 2023, 134, 43103. [Google Scholar]
- Zhao, Q.; Luo, Y.; Hao, Q.; Peng, G.-D. Electron beam irradiation and thermal-induced effects on the spectral properties of BAC-Al in Bi/Er codoped aluminosilicate fibers. Opt. Mater. Express 2019, 9, 4287–4294. [Google Scholar]
- Pfeffer, R.L. Damage center formation in SiO2 thin films by fast electron irradiation. J. Appl. Phys. 1985, 57, 5176–5180. [Google Scholar] [CrossRef]
- Devine, R.A.B.; Arndt, J. Correlated defect creation and dose-dependent radiation sensitivity in amorphous SiO2. Phys. Rev. B 1989, 39, 5132. [Google Scholar]
- Griscom, D.L.; Gingerich, M.E.; Friebele, E.J. Radiation-induced defects in glasses: Origin of power-law dependence of concentration on dose. Phys. Rev. Lett. 1993, 71, 1019. [Google Scholar] [PubMed]
- Borgermans, P.; Brichard, B. Kinetic models and spectral dependencies of the radiation-induced attenuation in pure silica fibers. IEEE Trans. Nucl. Sci. 2002, 49, 1439–1445. [Google Scholar]
- Griscom, D.L. Fractal kinetics of radiation-induced point-defect formation and decay in amorphous insulators: Application to color centers in silica-based optical fibers. Phys. Rev. B 2001, 64, 174201. [Google Scholar]
- Gilard, O.; Caussanel, M.; Duval, H.; Quadri, G.; Reynaud, F. New model for assessing dose, dose rate, and temperature sensitivity of radiation-induced absorption in glasses. J. Appl. Phys. 2010, 108, 93115. [Google Scholar] [CrossRef]
- Liu, G.; Xiao, H.; Li, X. Radiation damage kinetic model based on the multi-dominant color center evolution mechanism for silica-based optical fibers. Radiat. Phys. Chem. 2025, 230, 112581. [Google Scholar]
- Schuyt, J.J.; Moseley, D.A.; Ludbrook, B.M.; Haneef, S.M.; Badcock, R.A. Modeling the radiation-induced attenuation limits in optical fibers during concurrent irradiation, thermal annealing, and photobleaching. IEEE Trans. Nucl. Sci. 2025, 72, 2154–2162. [Google Scholar] [CrossRef]
Figure 1.
Schematic of color center generation.
Figure 1.
Schematic of color center generation.
Figure 2.
Schematic diagrams of (a) the irradiation source room layout and (b) the experimental optical path.
Figure 2.
Schematic diagrams of (a) the irradiation source room layout and (b) the experimental optical path.
Figure 3.
Radiation-induced attenuation at 1550 nm and 1310 nm (temperature: 10 ± 2 °C, dose rate: 1.25 Gy/s).
Figure 3.
Radiation-induced attenuation at 1550 nm and 1310 nm (temperature: 10 ± 2 °C, dose rate: 1.25 Gy/s).
Figure 4.
Fitted curves at (a) 1550 nm and (d) 1310 nm, with their absolute errors (b,e) and relative errors (c,f). Symbols denote the error values, and dashed lines indicate the reference bounds.
Figure 4.
Fitted curves at (a) 1550 nm and (d) 1310 nm, with their absolute errors (b,e) and relative errors (c,f). Symbols denote the error values, and dashed lines indicate the reference bounds.
Figure 5.
Fitted curves at (a) 1550 nm and (b) 1310 nm.
Figure 5.
Fitted curves at (a) 1550 nm and (b) 1310 nm.
Figure 6.
Fitted curves of the first-order stretched exponential model at (a) 1550 nm and (b) 1310 nm.
Figure 6.
Fitted curves of the first-order stretched exponential model at (a) 1550 nm and (b) 1310 nm.
Figure 7.
Fitted curves of the second-order stretched exponential model at (a) 1550 nm and (b) 1310 nm.
Figure 7.
Fitted curves of the second-order stretched exponential model at (a) 1550 nm and (b) 1310 nm.
Figure 8.
Fitted curves of the color center kinetic model (2025) at (a) 1550 nm and (b) 1310 nm.
Figure 8.
Fitted curves of the color center kinetic model (2025) at (a) 1550 nm and (b) 1310 nm.
Figure 9.
Evolution trends of the model-derived effective kinetic components at (a) 1550 nm and (b) 1310 nm.
Figure 9.
Evolution trends of the model-derived effective kinetic components at (a) 1550 nm and (b) 1310 nm.
Table 1.
Evaluation metrics at 1550 nm and 1310 nm.
Table 1.
Evaluation metrics at 1550 nm and 1310 nm.
| | R2 | RMSE | NRMSE | MAE (dB/km) | Adj-R2 | AIC | BIC |
|---|
| 1550 | 0.9997 | 0.700282 | 0.41% | 0.566937 | 0.9997 | −149.31 | −121.73 |
| 1310 | 0.9991 | 0.893178 | 0.57% | 0.732037 | 0.9991 | −24.89 | 0.69 |
Table 2.
Fitted parameters at 1550 nm.
Table 2.
Fitted parameters at 1550 nm.
| | ai (Gy−1) | bi (s−1) | ki (dB·km−1·Gy−1) | V0i (dB/km) |
|---|
| i = 1 | (4.71 ± 0.11) × 10−6 | (2.94 ± 0.17) × 10−19 | (8.34 ± 0.08) × 10−5 | 73.85 ± 0.86 |
| i = 2 | 0.0147 ± 0.009 | (3.79 ± 0.22) × 10−4 | (9.73 ± 0.54) × 10−3 | 5.25 ± 1.23 |
Table 3.
Fitted parameters at 1310 nm.
Table 3.
Fitted parameters at 1310 nm.
| | ai (Gy−1) | bi (s−1) | ki (dB·km−1·Gy−1) | V0i (dB/km) |
|---|
| i = 1 | (3.97 ± 0.24) × 10−4 | (5.08 ± 0.68) × 10−19 | (9.2 ± 0.091) × 10−5 | 57.08 ± 2.97 |
| i = 2 | (1.02 ± 0.34) × 10−5 | (7.2 ± 1.6) × 10−5 | (1.35 ± 0.53) × 10−3 | 91.66 ± 18.1 |
Table 4.
Fitted parameters and Evaluation metrics of the power-law model.
Table 4.
Fitted parameters and Evaluation metrics of the power-law model.
| | C | f | R2 | RMSE | NRMSE | MAE (dB/km) | Adj-R2 | AIC | BIC |
|---|
| 1550 | 0.38 ± 0.002 | 0.43 ± 0.011 | 0.997 | 2.274299 | 1.33% | 1.374252 | 0.9967 | 385.25 | 392.14 |
| 1310 | 3.84 ± 0.26 | 0.26 ± 0.0052 | 0.963 | 5.727999 | 3.66% | 4.80569 | 0.963 | 635.82 | 642.21 |
Table 5.
Fitted parameters of the first-order stretched exponential model.
Table 5.
Fitted parameters of the first-order stretched exponential model.
| | k | | |
|---|
| 1550 | (8.51 ± 0.13) × 10−11 | 0.43 ± 0.0022 | (5.53 ± 0.08) × 109 |
| 1310 | (4.05 ± 0.13) × 10−10 | 0.26 ± 0.005 | (1.18 ± 0.039) × 1010 |
Table 6.
Evaluation metrics of the first-order stretched exponential model.
Table 6.
Evaluation metrics of the first-order stretched exponential model.
| | R2 | RMSE | NRMSE | MAE (dB/km) | Adj-R2 | AIC | BIC |
|---|
| 1550 | 0.997 | 2.26913 | 1.33% | 1.407032 | 0.9969 | 386.2 | 369.54 |
| 1310 | 0.963 | 5.72794 | 3.66% | 4.808884 | 0.963 | 637.8 | 647.41 |
Table 7.
Fitted parameters of the second-order stretched exponential model.
Table 7.
Fitted parameters of the second-order stretched exponential model.
| | k | | |
|---|
| 1550 | (3.31 ± 0.05) × 10−7 | 0.43 ± 0.0022 | (1.42 ± 0.02) × 106 |
| 1310 | (2.7 ± 0.089) × 10−6 | 0.26 ± 0.0052 | (1.77 ± 0.059) × 106 |
Table 8.
Evaluation metrics of the second-order stretched exponential model.
Table 8.
Evaluation metrics of the second-order stretched exponential model.
| | R2 | RMSE | NRMSE | MAE (dB/km) | Adj-R2 | AIC | BIC |
|---|
| 1550 | 0.9969 | 2.26913 | 1.33% | 1.407049 | 0.9969 | 386.2 | 369.54 |
| 1310 | 0.964 | 5.72794 | 3.66% | 4.808957 | 0.963 | 637.8 | 647.41 |
Table 9.
Fitted parameters of the 2025 model.
Table 9.
Fitted parameters of the 2025 model.
| | k | f | r | KpNp | KeNe | β | μ | ν | Ea |
|---|
| 1550 | 0.162 ± 0.00049 | 0.65 ± 0.00066 | 3.98 ± 0.017 | 1.06 ± 0.0039 | 0.00035 ± 0.0001 | 1.22 ± 0.0011 | 0.47 ± 0.0023 | 2.59 ± 0.021 | 0.2 ± 0.00019 |
| 1310 | 0.6 ± 0.0085 | 0.47 ± 0.011 | 23.56 ± 0.19 | 8.78 ± 0.53 | 0.26 ± 0.039 | 3.02 ± 0.025 | 0.23 ± 0.0096 | 1.72 ± 0.32 | (3.51 ± 0.45) × 10−6 |
Table 10.
Evaluation metrics of the 2025 model.
Table 10.
Evaluation metrics of the 2025 model.
| | R2 | RMSE | NRMSE | MAE (dB/km) | Adj-R2 | AIC | BIC |
|---|
| 1550 | 0.9969 | 2.282266 | 1.34% | 1.333805 | 0.9968 | 400.88 | 431.9 |
| 1310 | 0.9637 | 5.727908 | 3.66% | 4.809228 | 0.9618 | 649.81 | 678.6 |
Table 11.
Summary of model evaluation metrics at 1550 nm and 1310 nm.
Table 11.
Summary of model evaluation metrics at 1550 nm and 1310 nm.
| Model | Waveband (nm) | R2 | RMSE | NRMSE | MAE (dB/km) | Adj-R2 | AIC | BIC |
|---|
| derived model | 1550 | 0.9997 | 0.700282 | 0.41% | 0.566937 | 0.9997 | −149.31 | −121.73 |
| | 1310 | 0.9991 | 0.893178 | 0.57% | 0.732037 | 0.9991 | −24.89 | 0.69 |
| Power-law | 1550 | 0.997 | 2.274299 | 1.33% | 1.374252 | 0.9967 | 385.25 | 392.14 |
| | 1310 | 0.963 | 5.727999 | 3.66% | 4.80569 | 0.963 | 635.82 | 642.21 |
| 1st-order Stretched | 1550 | 0.997 | 2.26913 | 1.33% | 1.407032 | 0.9969 | 386.2 | 369.54 |
| | 1310 | 0.963 | 5.72794 | 3.66% | 4.808884 | 0.963 | 637.8 | 647.41 |
| 2nd-order Stretched | 1550 | 0.9969 | 2.26913 | 1.33% | 1.407049 | 0.9969 | 386.2 | 369.54 |
| | 1310 | 0.9637 | 5.72794 | 3.66% | 4.808957 | 0.963 | 637.8 | 647.41 |
| 2025 | 1550 | 0.9969 | 2.282266 | 1.34% | 1.333805 | 0.9968 | 400.88 | 431.9 |
| | 1310 | 0.9637 | 5.727908 | 3.66% | 4.809228 | 0.9618 | 649.81 | 678.6 |
| Disclaimer/Publisher’s Note: The statements, opinions and data contained in all publications are solely those of the individual author(s) and contributor(s) and not of MDPI and/or the editor(s). MDPI and/or the editor(s) disclaim responsibility for any injury to people or property resulting from any ideas, methods, instructions or products referred to in the content. |