Article

Process-Window Extended Laser Cleaning of Hot-Rolled Steel Oxide Scales: Based on Ablation and Thermal Vibration Synergy

1
School of Mechanical Engineering, Jiangsu University, Zhenjiang 212013, China
2
College of Mechanical Engineering, Nantong Institute of Technology, Nantong 226000, China
3
Police Equipment Technical College, China People’s Police University, Langfang 065000, China
*
Author to whom correspondence should be addressed.
Photonics 2026, 13(7), 642; https://doi.org/10.3390/photonics13070642
Submission received: 12 June 2026 / Revised: 28 June 2026 / Accepted: 29 June 2026 / Published: 2 July 2026
(This article belongs to the Special Issue Advanced and Efficient Non-Destructive Laser Cleaning)

Abstract

The efficient removal of tenacious oxide scales from hot-rolled steel surfaces represents a persistent challenge in advanced manufacturing, as traditional manual grinding methods exhibit poor efficiency and environmental compatibility. This investigation develops an innovative methodology, i.e., a “coarse-to-fine” hierarchical cleaning paradigm consisting of dual-stepwise laser cleaning with variable parameters that successfully addresses the restrictive process window inherent to conventional single-parameter techniques. Through a strategically designed sequential treatment protocol—employing initial low-frequency (20 kHz), high-energy-density (200 mm/s) laser irradiation for primary oxide ablation, succeeded by high-frequency (60 kHz), low-energy-density (4000 mm/s) processing for residual scale elimination—we demonstrate an optimal synergy between ablative and thermomechanical vibration mechanisms. Rigorous multi-modal characterization incorporating SEM-EDS microscopy, oxygen content quantification, and metallographic analysis confirms exceptional performance metrics, including 98.7% oxide removal efficiency and 43.2% reduction in substrate surface roughness relative to standard methods. The developed protocol achieves a 2.8-fold expansion of the operational parameter space while establishing a novel “coarse-to-fine” hierarchical cleaning paradigm. These findings offer fundamental insights into laser–matter interactions while delivering a transferable technological framework for high-value manufacturing sectors, particularly in automotive and aerospace component production.

1. Introduction

Hot-rolled steel is characterized by high strength, excellent plasticity, and good welding properties [1]. It is employed in a multitude of applications, including structural construction, automobile manufacturing, piping, and container manufacturing [2]. During the hot rolling of steel at elevated temperatures, an oxide film is formed on the surface in contact with the surrounding oxygen, water vapor, and other substances. This oxide film is subsequently formed and stabilized during the cooling process [3]. The formation of an oxide film provides a certain degree of protection for the steel, reducing corrosion and damage to the metal surface [4]. However, the presence of an oxide film also affects the surface quality and machinability of the material, which in turn influences the performance and use of the material [5]. To meet specific application requirements, post-rolling oxide-scale removal is carried out to achieve a surface state that balances oxide removal, limited residual oxygen, and minimal laser-induced thermal effects on the substrate. In this study, successful cleaning is therefore defined as the effective removal of the hot-rolled oxide scale while preserving acceptable surface integrity and process efficiency.
The conventional techniques for removing hot-rolling oxide film encompass high-pressure water jet cleaning, chemical cleaning, and sandblasting. The use of a high-pressure water jet cleaning method requires a significant input of water resources, with the cleaning effect being limited. Furthermore, the surface is prone to rusting following the cleaning process [6]. The efficiency of chemical cleaning is low, with the reagent causing corrosion of the material surface and weakening its strength. The resulting chemical waste is detrimental to the environment [7]. Furthermore, sandblasting cleaning is prone to local deformation and damage, and the operation generates significant noise and dust pollution [8]. It is evident that the conventional cleaning techniques are inadequate to fulfill the demands of contemporary industrial cleaning. Laser cleaning, as a novel surface cleaning technology, offers numerous advantages, including green environmental protection, high efficiency, precision, and the ability to operate without contact [9]. Following years of development, the technology has been applied in numerous fields, including aerospace [10,11], marine vessels [12,13], automotive processing [14,15], optical devices [16], semiconductors [17], and cultural relic protection [18,19,20]. The cleaning objects encompass a range of materials, including paint, rust, oil, resin, and oxides.
In recent years, scholars have conducted extensive research on the metal oxide film laser cleaning process and mechanism. Yoo et al. [21] conducted a study on laser cleaning of the rust layer on the surface of 304L stainless steel, demonstrating that increasing the laser spot overlap rate and the number of scanning passes leads to the formation of denser dislocation structures and grain refinement, which subsequently enhances the microhardness and tensile strength of the substrate. Zhang et al. [22] investigated the effect of laser cleaning on the welding performance of 6005A aluminum alloy and found that by adjusting laser power and scanning frequency, the oxygen content on the aluminum alloy surface could be effectively reduced, significantly decreasing the porosity in the weld seam and slightly improving the mechanical properties. Wang et al. [23] conducted both dry and wet laser cleaning (rinsing, soaking, and flushing methods) experiments on the corrosion products on steel components. They discovered that wet laser cleaning effectively reduced thermal effects, and the steam and water flow generated during the process helped to remove surface impurity particles. Guo et al. [24], by establishing a three-dimensional coupled model of heat transfer and fluid flow during the laser cleaning of the oxide layer on 6061 aluminum alloy, verified that the evolution of the substrate’s surface microstructure after cleaning is influenced by the combined effects of recoil pressure, surface tension, and gravity. Li et al. [25] conducted laser cleaning research on the oxide layer of TA15 titanium alloy, concluding that the optimal removal efficiency and surface performance can be achieved at a laser energy density of 3.98 J/cm2 and a laser head moving speed of 5 mm/s, with the ablation effect being the primary cleaning mechanism in the process. Substantial research has been conducted on laser cleaning of metallic materials; the majority of studies have primarily focused on oxide films or coatings on aluminum and titanium alloys, as well as rust layers on steel surfaces. However, few studies have focused on laser removal of dense oxide-scales from hot-rolled steel plates. The scarcity of research stems from the combined effects of the stringent processing constraints intrinsic to oxide scale thermodynamics and the paucity of targeted studies on hot-rolled steel substrates.
In this study, a novel “coarse-to-fine” hierarchical cleaning paradigm, i.e., a specific multi-pass, variable-parameter laser cleaning strategy for oxide-scale removal, is proposed. The strategy involves two passes: first, using low-frequency, high-energy-density laser pulses to significantly thin the oxide scale, and second, applying high-frequency, low-energy-density laser pulses to remove residual oxide scales while improving the surface morphology. By controlling variables and adjusting experimental parameters, multiple sets of results were obtained. The surface morphology, phase composition, and oxygen content of each sample were analyzed, along with the changes in the metallographic structure of the samples before and after cleaning. These analyses were used to determine the optimal cleaning parameters. Since the present work mainly focuses on surface characterization, these measurements are used to evaluate oxide-scale removal effectiveness, surface morphology evolution, and process-induced surface quality, which together support parameter optimization for efficient and substrate-safe cleaning. Additionally, sputtered products and vibration signals from the laser cleaning process were collected to analyze the synergistic coupling of ablation and vibration effects in laser cleaning of hot-rolled steel oxide scales.

2. Materials and Methods

2.1. “Coarse-to-Fine” Hierarchical Cleaning Paradigm

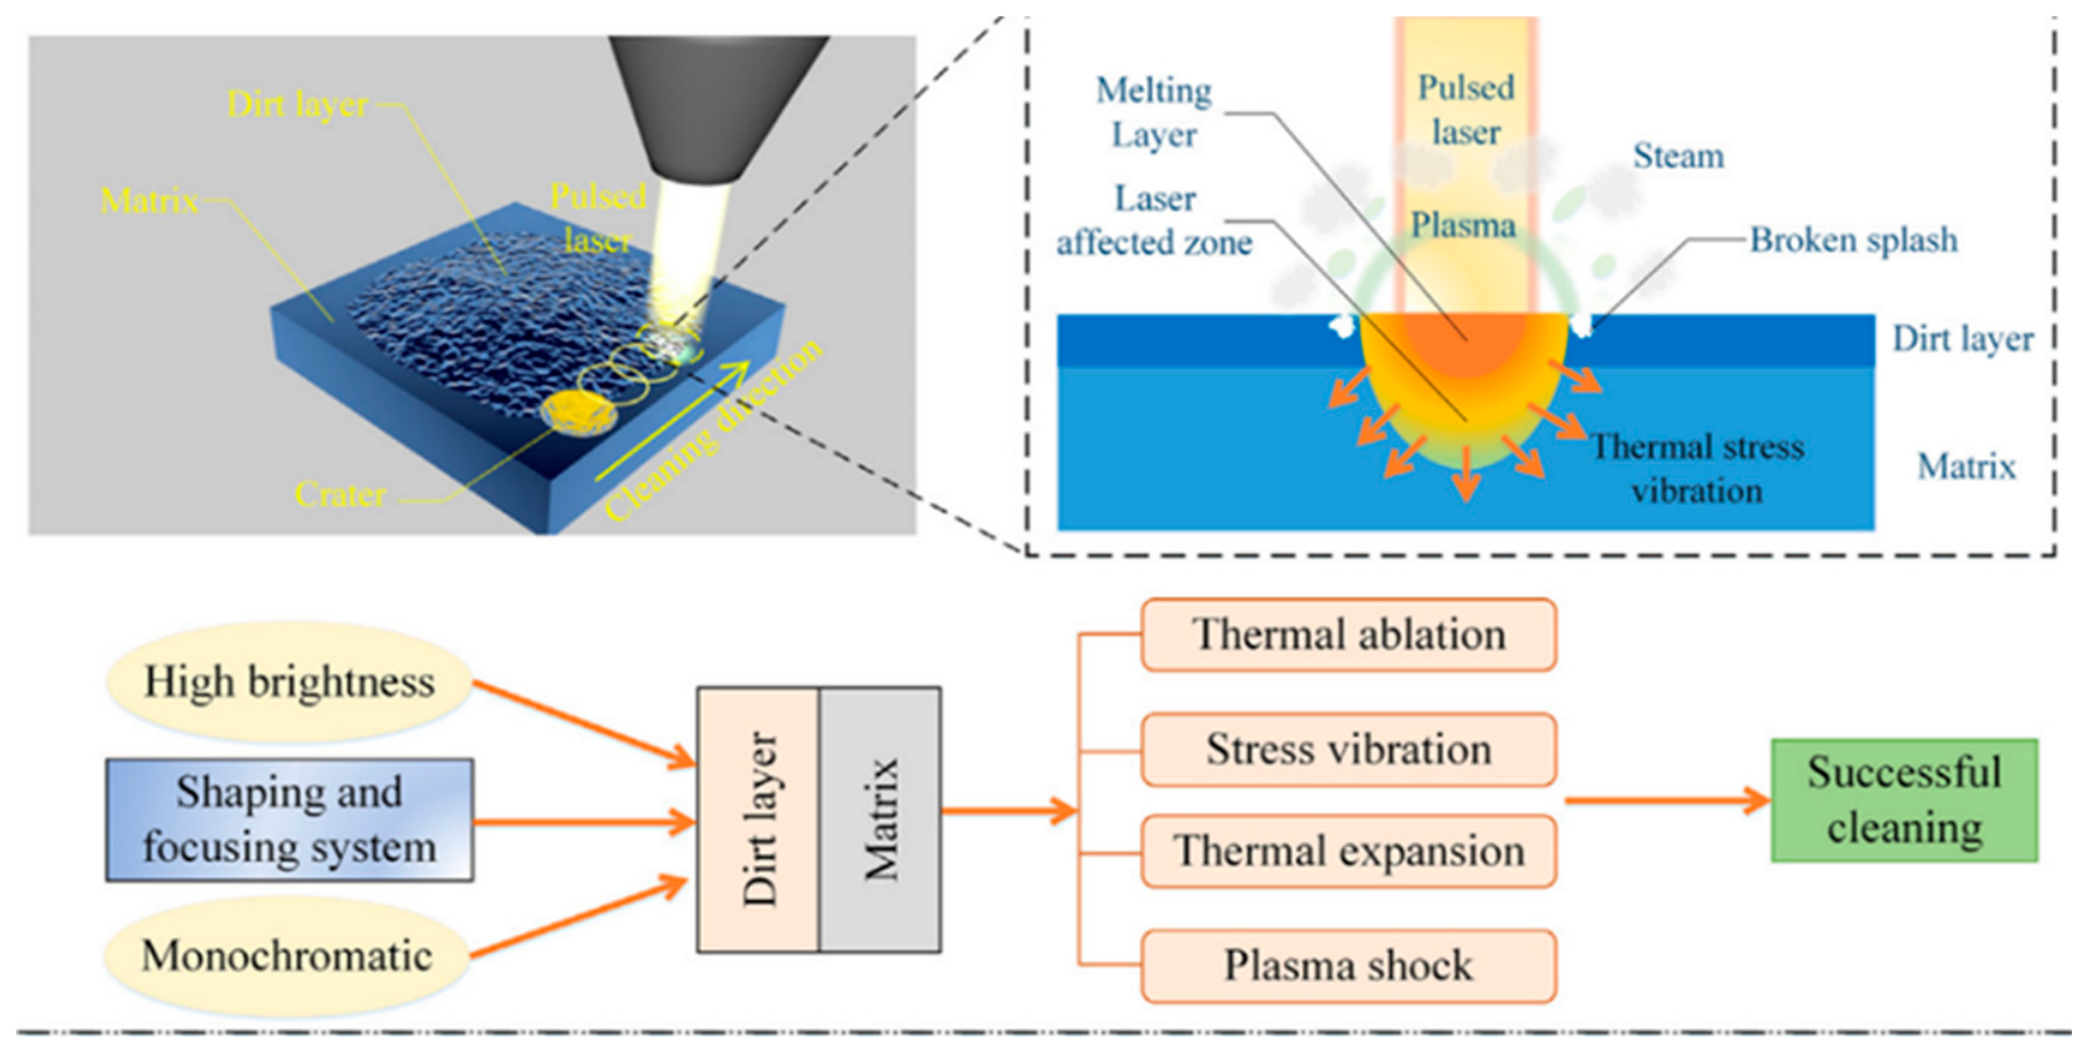
As shown in Figure 1 laser cleaning is a process involving complex physical and chemical transformations, encompassing interactions among various materials and energy conversions. Under the interplay of optical, thermal, and mechanical coupling effects [26,27], it enables resonance and energy transfer between the intense light field and the material. Selective material removal is achieved through melting, vaporization, material ejection, and plume-assisted detachment, while thermal conduction, melt flow, and redeposition affect the resulting surface morphology and cleaning uniformity [24]. Among these, the effects of thermal ablation and thermal vibration are particularly significant and essential during the cleaning process. The thermal ablation effect becomes significant under high-energy-density laser irradiation, where rapid surface energy deposition raises the local temperature and generates recoil pressure and shock effects [28]. As a result, the oxide layer or substrate surface may undergo melting, oxide decomposition, vaporization, and material ejection, depending on the local energy input and material properties [29]. This process effectively removed contaminants from the cleaning layer but can cause varying degrees of thermal influence on the substrate, such as overheating, repeated surface remelting, secondary oxidation, and contamination [30].
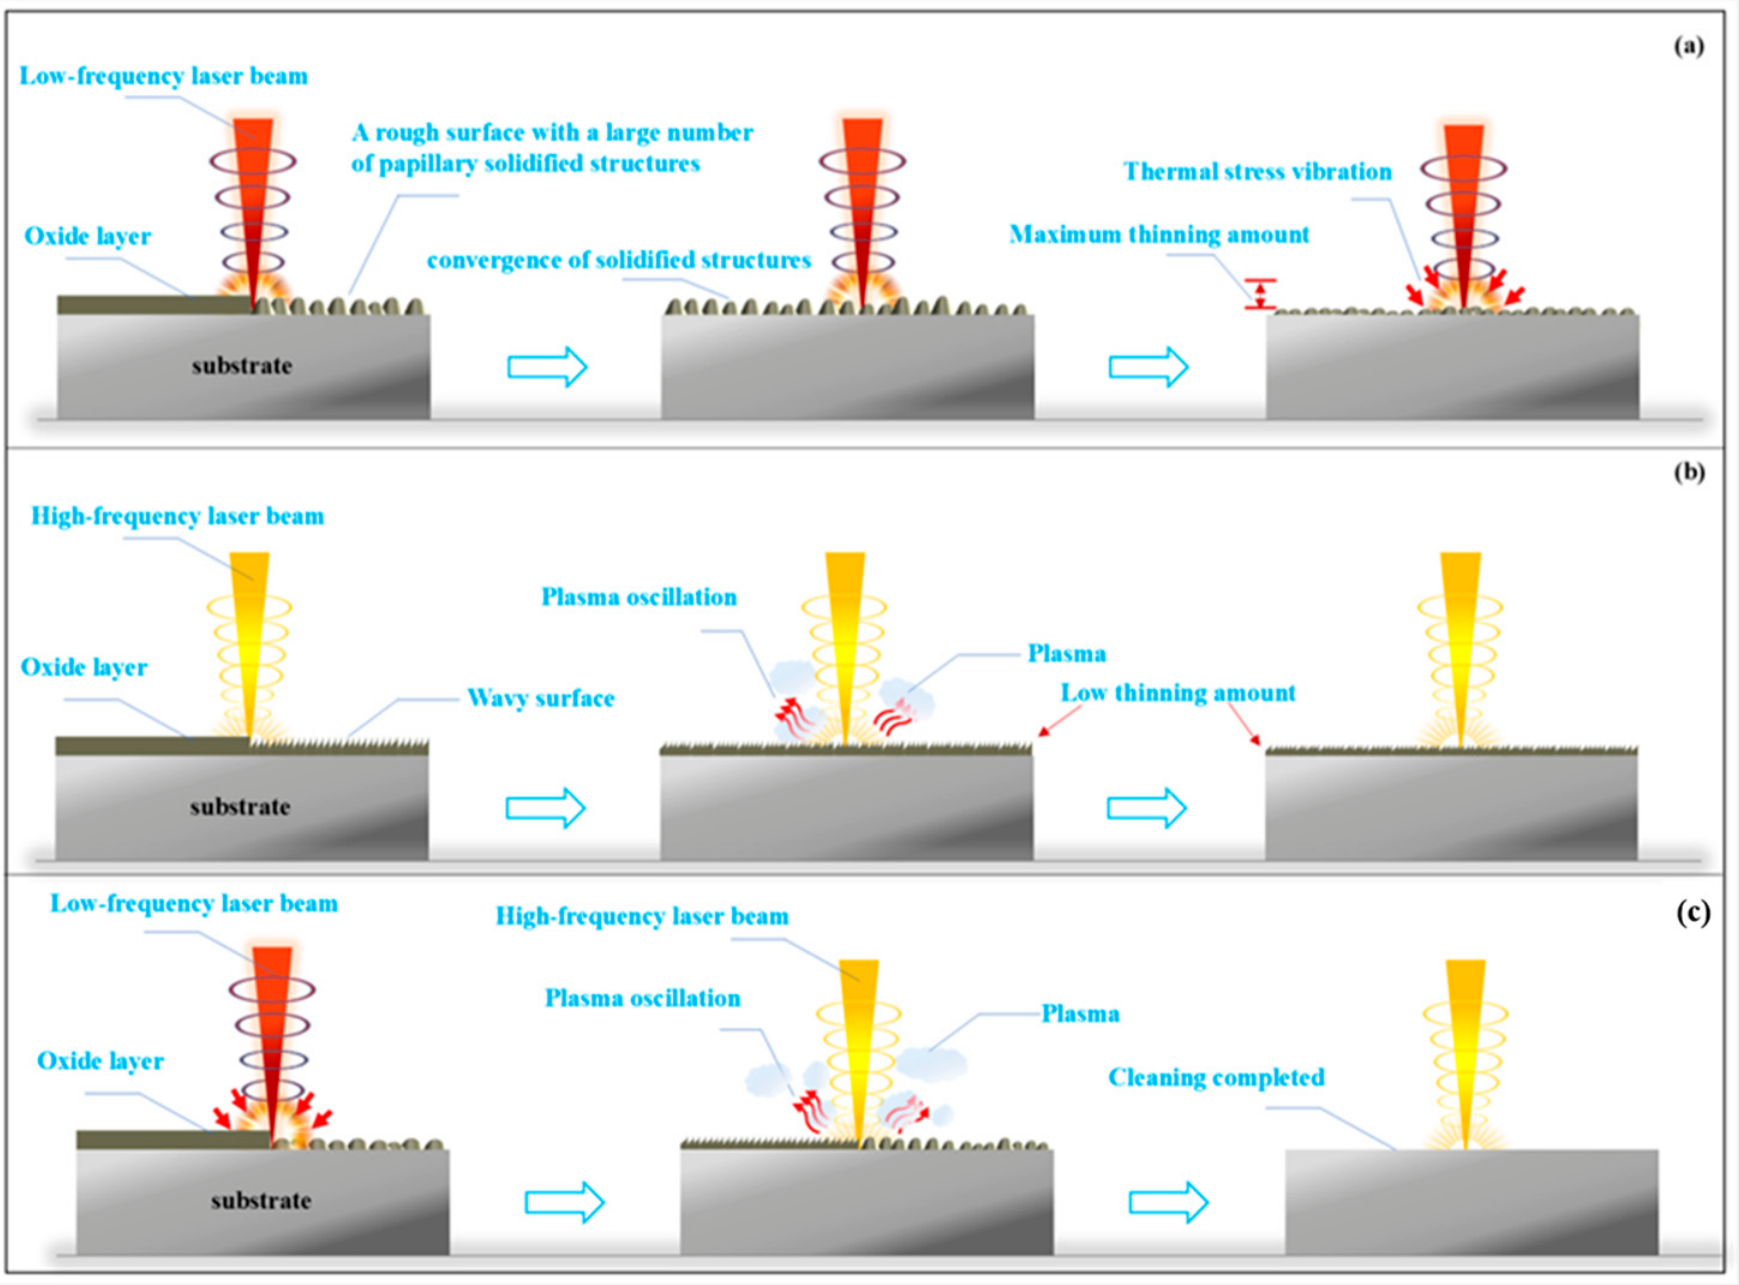
However, for hot-rolled steel oxide scales, laser cleaning in one pass was generally unable to achieve the desired effect, and how to set multi-pass laser cleaning parameters became very important. At present, the parameters of each pass in multi-pass laser cleaning do not change, and can be mainly divided into two types: low-frequency and high-energy laser cleaning and high-frequency and low-energy laser cleaning as shown in Figure 2a,b.
In Figure 2a, for low-frequency and high-energy laser cleaning, the oxide surface exhibited dense papillary solidified structures (labeled “a rough surface with large number of papillary structures”). When the low-frequency laser (red arrow) irradiated the surface, it first triggered the convergence of solidified oxide structures (labeled “Oxide solidified structure convergence”), followed by thermal stress vibration (depicted by yellow diffusion ripples) that induced significant deformation in the oxide layer [31]. This mechanism achieves the “Maximum thinning amount” of the oxide layer but may risk thermal damage to the substrate. Meanwhile, this approach resulted in significant thinning of the oxide film but also led to the formation of numerous uneven, droplet-like solidified structures on the material surface, increasing surface roughness.
On the contrary, in Figure 2b, for high-frequency and low-energy laser cleaning, the oxide surface adopted a regular undulating morphology (labeled “Wavy surface”). The high-frequency laser (red arrow) induced plasma oscillation (orange cloud with diffusion ripples), generating mechanical vibration waves (yellow oscillatory lines) that primarily act on the oxide–substrate interface. However, due to localized energy dissipation in the plasma, this mode only achieved a “Low thinning amount”, indicating insufficient oxide removal with a single high-frequency treatment. Therefore, the thinning effect was limited, and the growth in thinning with additional scanning passes was negligible; this significantly lowered cleaning efficiency.
According to previous studies [32,33], it was not difficult to find that these two methods have difficulty meeting the requirements of cleaning efficiency, and both required more than 2 passes of cleaning to meet the requirements. The reason behind this was that the laser cleaning parameters were not adjusted based on the surface state of the previous cleaning, resulting in the surface being either over-cleaned or uncleaned. Therefore, the “coarse-to-fine” hierarchical cleaning paradigm is suggested in this article.
As shown in Figure 2c, the low-frequency laser (red arrow) pre-treats the oxide layer, promoting structural densification. Subsequently, the high-frequency laser (blue arrow) triggers intense plasma oscillation (large orange cloud), combining thermal stress and vibrational waves (yellow interfacial ripples) to completely remove the oxide layer (labeled “Cleaning completed”). This staged energy delivery strategy leverages the structural loosening capability of low-frequency irradiation and the precision of high-frequency plasma-driven detachment, optimizing cleaning efficiency while protecting the substrate. For the “coarse-to-fine” hierarchical cleaning paradigm, the first pass involved using a low-frequency and high-energy laser beam to achieve substantial thinning under the thermal ablation effect. At this stage, the material surface exhibited numerous droplet-like solidified structures and high roughness. Consequently, the second pass introduced a high-frequency and low-energy laser beam. Owing to the increased surface roughness at this point, laser absorption was enhanced. Through the coupled effects of thermal ablation and thermal vibration, high-frequency mechanical energy (thermal stress) and plasma oscillations were generated, removing the remaining stubborn oxide film. This process also reshaped and repaired the rough surface, potentially enhancing surface properties and significantly improving the efficiency of laser cleaning; thus, it meets the required cleaning quality standards.

2.2. Sample Material Preparation

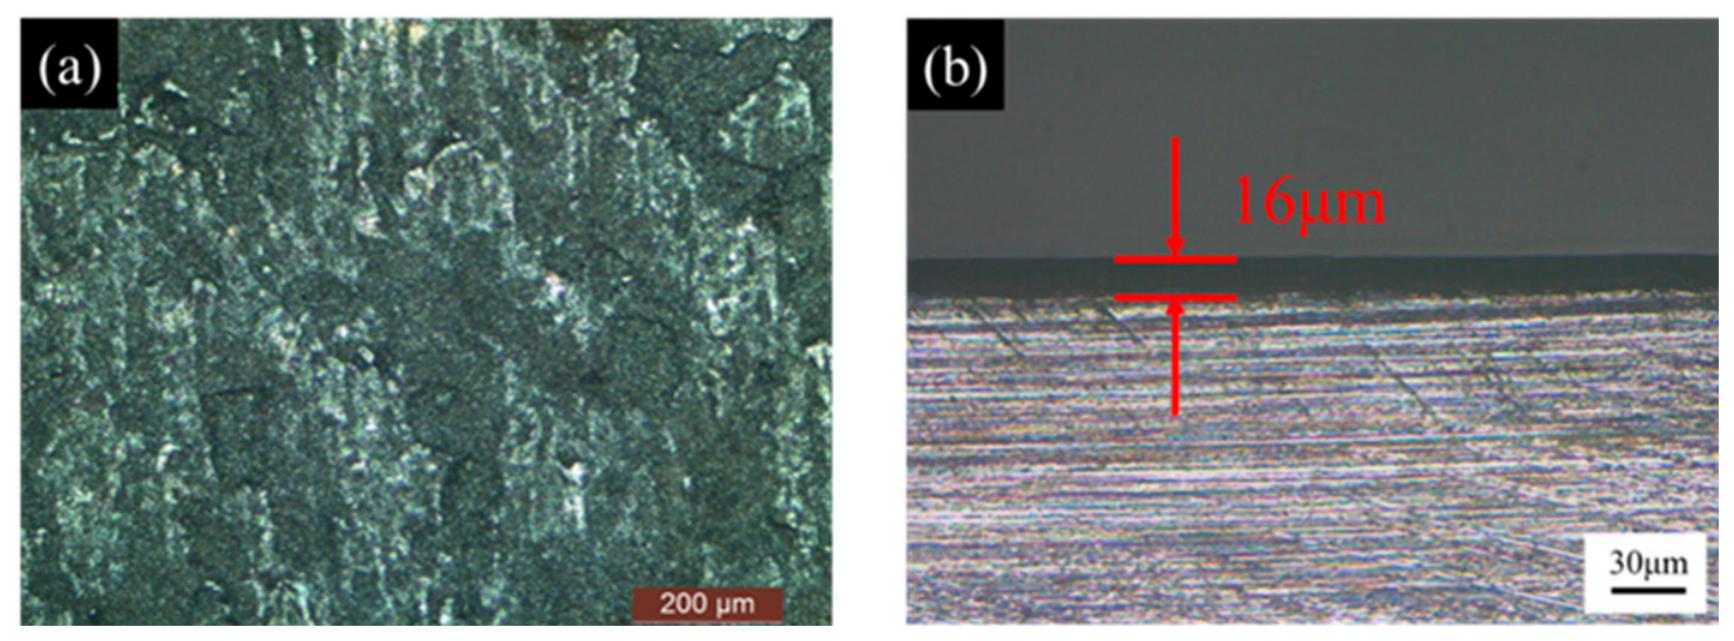
The experiment utilized Q235A hot-rolled steel with a thickness of 3 mm as the processing material, with its main elemental composition detailed in Table 1. The steel plates were cut into small squares measuring 25 mm × 25 mm using wire cutting, and the samples were subsequently subjected to ultrasonic cleaning with anhydrous ethanol. The original surface was examined using an optical microscope, and the thickness of the hot-rolled oxide layer on the cross-section was measured. It was observed that the surface of the hot-rolled steel is characterized by a substantial presence of gray oxides, as well as fine cracks formed during the hot-rolling process due to variations in stress, as illustrated in Figure 3a. The average thickness of the hot-rolled oxide layer, measured on the cross-section, was approximately 16 μm, as shown in Figure 3b.
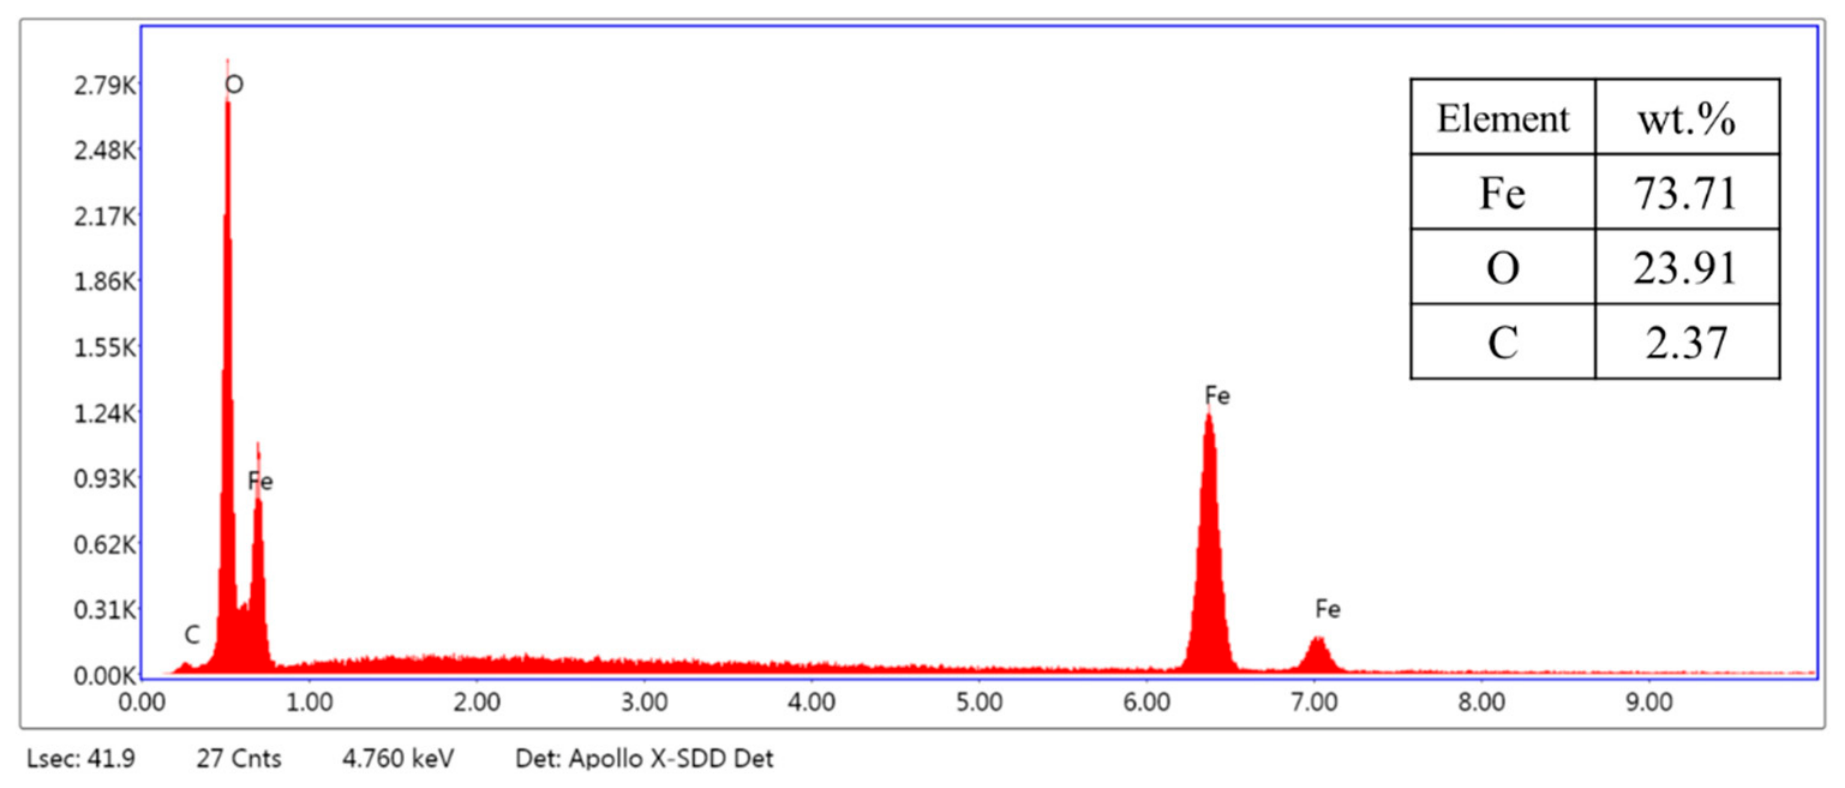
The Energy Dispersive Spectroscopy (EDS) analysis revealed that the original sample’s surface contained approximately 23.91 wt.% oxygen. Additionally, due to the adherence of carbonaceous materials from the air, the surface of the sample also contained 2.37 wt.% carbon, as shown in Figure 4.

2.3. Laser Cleaning Experimental Equipment

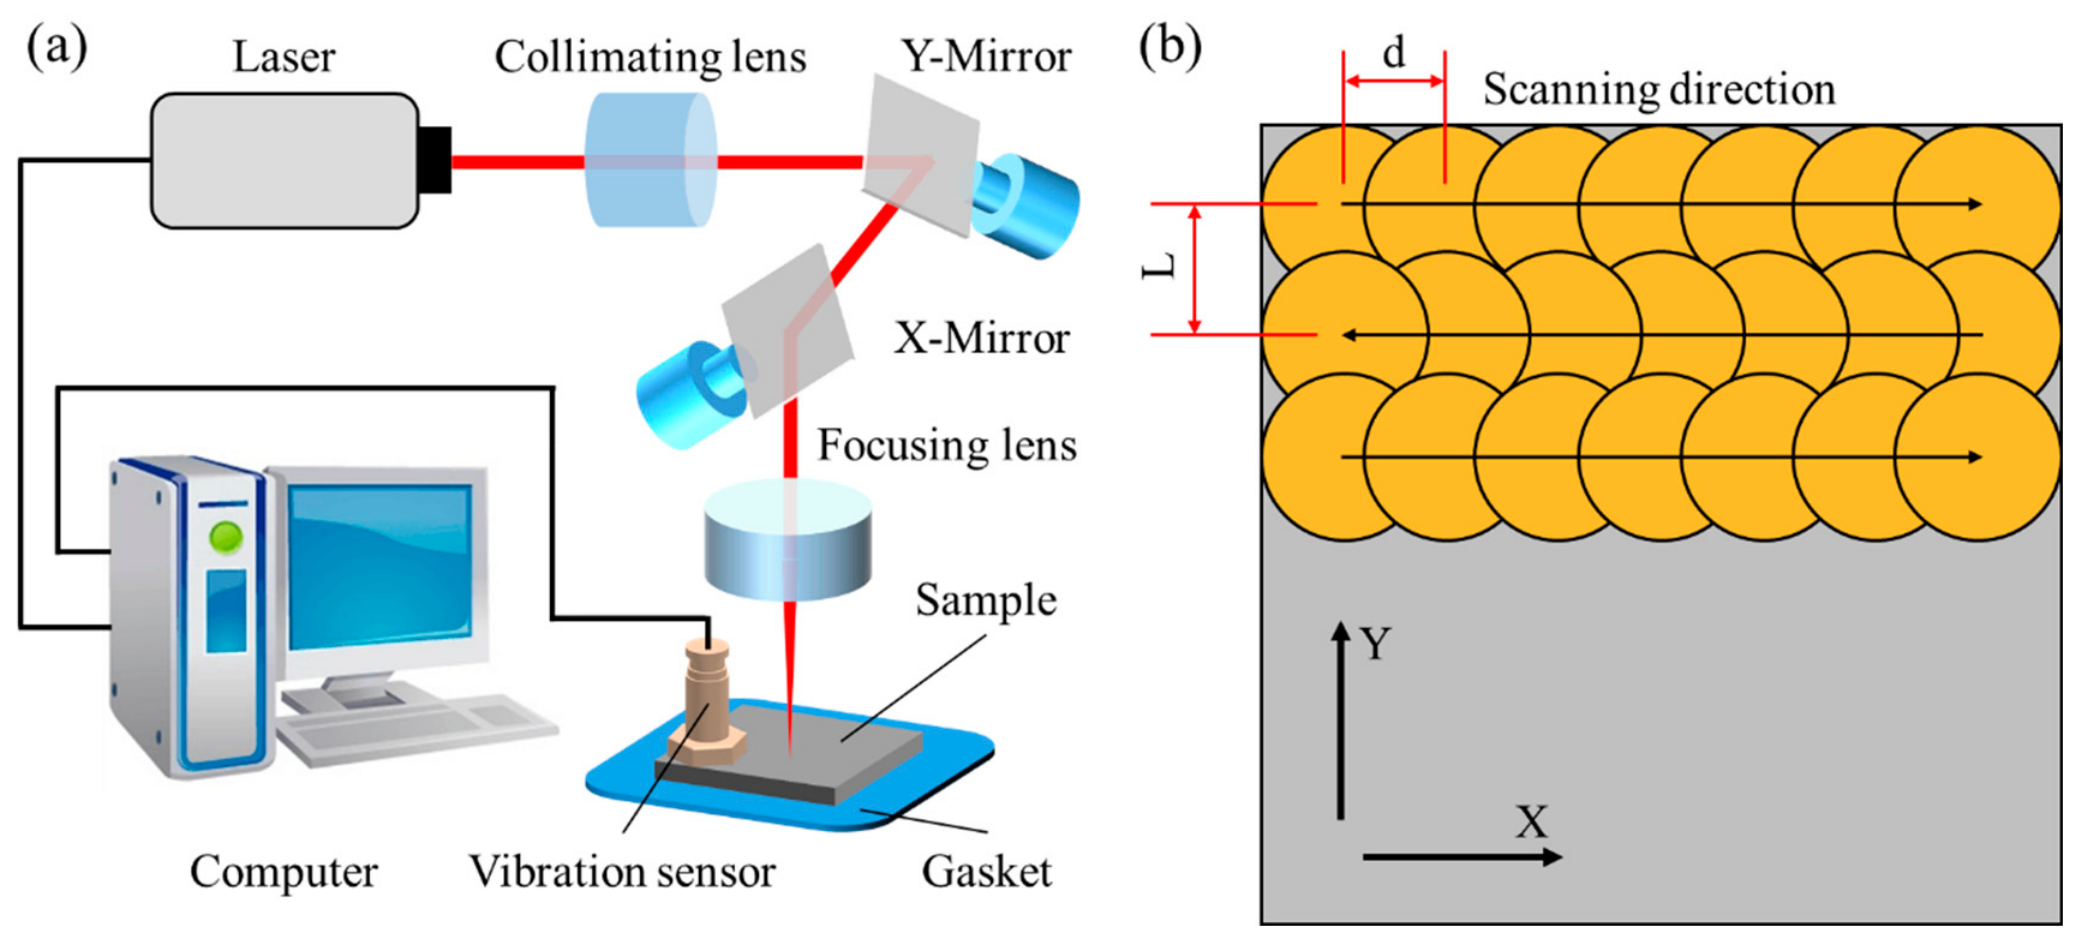
The nanosecond laser cleaning system employed in the experiment consists of a laser source, beam delivery system, control system, vibration sensor, and workbench. A schematic diagram of the system is illustrated in Figure 5a.,The laser used was a BLC-100 laser marking machine (Shenzhen Shentai Laser Technology Co., Ltd., Shenzhen, China), with its main technical parameters shown in Table 2. The laser beam is transmitted via optical fiber, expanded by a beam expander, and its scanning trajectory is controlled by a 2D scanning galvanometer. Finally, the beam is focused on a plane through a field lens. As illustrated in Figure 5b, the laser cleaning trajectory employs a line-by-line scanning methodology. A magnetic vibration signal conditioner enables the collection of vibration signals from the substrate under varying laser cleaning process parameters. This enables the collection of vibration signals from the substrate under varying laser cleaning process parameters. A metal shim is positioned beneath the substrate to capture sputtered material during the laser cleaning of hot-rolled steel. By testing the vibration signals and observing the oxide scale on hot-rolled steel, the effects of pulsed laser cleaning can be postulated.
The temperature field distribution during the laser cleaning process is primarily influenced by the laser energy density (F), which can be expressed as Equation (1):
F = P f π r 2
P is the average laser power, f is the laser pulse frequency, and r is the radius of the focused beam spot.
Additionally, the overlap ratio of the laser spot is a critical factor influencing the material removal rate. The overlap ratios in the x and y directions, denoted as Ux and Uy, can be expressed by Equations (2) and (3):
U x = ( 1 v f D ) × 100 %
U y = ( 1 L D ) × 100 %
v is the laser scanning speed, D is the diameter of the focused beam spot, f is the laser pulse frequency, and L is the spacing between two adjacent scanning tracks in the y directions.

2.4. Surface Characterization

An optical microscope (OM; Motic, Xiamen, China) was employed to examine the surface morphology of the sample. A JC-LC211 instrument (Jinchang Tech. Co., Ltd., Wuhan, China) was employed to ascertain the degree of laser cleaning. A Hitachi S-3400N variable vacuum tungsten filament scanning electron microscope (SEM; Hitachi High-Tech, Tokyo, Japan) and a matching Energy Dispersive Spectrometer (EDS; Bruker, Billerica, MA, USA) were employed to ascertain the micro-morphology and elemental composition of the cleaning surface. Because EDS has limited accuracy for light elements such as oxygen, the measured oxygen content is used here primarily as a qualitative or semi-quantitative indicator for comparing relative cleaning performance among samples. The three-dimensional morphology and roughness of the cleaning surfaces were observed using an Olympus OLS4100 laser scanning confocal microscope (Olympus Corporation, Tokyo, Japan) and a Keyence VHX-7000 deep focus microscope (KEYENCE Corporation, Osaka, Japan).

2.5. Experiment Method Design

To examine the influence of varying scan passes on the removal efficiency of the oxide scale on hot-rolled steel under a constant energy density, a preliminary experiment was conducted. In the preliminary experiment, a laser power of 20 W was selected, and different laser energy densities were achieved by varying the pulse frequency. The scan line spacing in the Y direction was set to 0.02 mm, and the corresponding scan speed was adjusted synchronously to ensure a 60% spot overlap rate. The parameter selection is shown in Table 2 and Table 3. Laser cleaning tests were conducted 1, 3, and 5 times under these sets of process parameters. The microscopic morphology and changes in oxygen content under different process conditions were observed using a scanning electron microscope (SEM).
The initial objective of the laser cleaning experiment was to achieve the maximum possible thinning of the hot-rolled oxide film while preventing any damage to the substrate material. In this phase, a combination of low laser pulse frequency and low scanning speed was selected, and the scanning line spacing and laser scanning speed were adjusted in unison to ensure a consistent spot overlap rate in both the X and Y directions. A two-factor, three-level process experiment was designed and is presented in Table 4. For the roughness analysis after the first-step cleaning, the arithmetic average roughness (Ra) values of representative surfaces under the first-step parameter combinations were additionally compared to evaluate how the coarse cleaning stage affected the subsequent fine-cleaning conditions.
The optimal cleaning process was determined by selecting the parameter combination that achieved the greatest thinning in the initial step of cleaning. Based on this, the second-step laser cleaning parameters were designed. While maintaining the laser power at 20 W, the pulse frequency was significantly increased to achieve a much lower single-pulse laser energy density. According to the literature [11], the thermal vibration effect occurs at the edge of the laser spot during laser cleaning, which increases the effective area of the spot and improves cleaning efficiency. Therefore, in the second-step cleaning experiment, the laser scanning speed was significantly increased, while maintaining an effective overlap of the laser spots in the X direction. Additionally, the laser scan line spacing was set to 0.01 mm, and the overlap rate in the Y direction was 80%. The specific experimental parameters for the process are shown in Table 5.
In the two-step laser cleaning experiments with variable process, the magnitude of the laser energy density was set by adjusting the pulse frequency. A total of 5 different pulse frequencies were employed during the first and second pass of the laser cleaning process: 20, 40, 60, 80 and 100 kHZ. To investigate the removal mechanism of the hot-rolled oxide film during stepwise laser cleaning, vibration signals from the sample surface were collected at different pulse frequencies. The acquisition frequency was set at 5 kHZ, with a sampling duration of 1 s, and the data were subsequently visualized using a MATLAB signal analyzer (MathWorks, Natick, MA, USA; Version R2023a). Additionally, aluminum alloy spacers were employed to collect the spatter products in the vicinity of the samples at varying pulse frequencies. These particles were observed under a confocal microscope, and a brush was used to aggregate and weigh the particles, thereby achieving a measurement accuracy of 1 mg.

3. Results

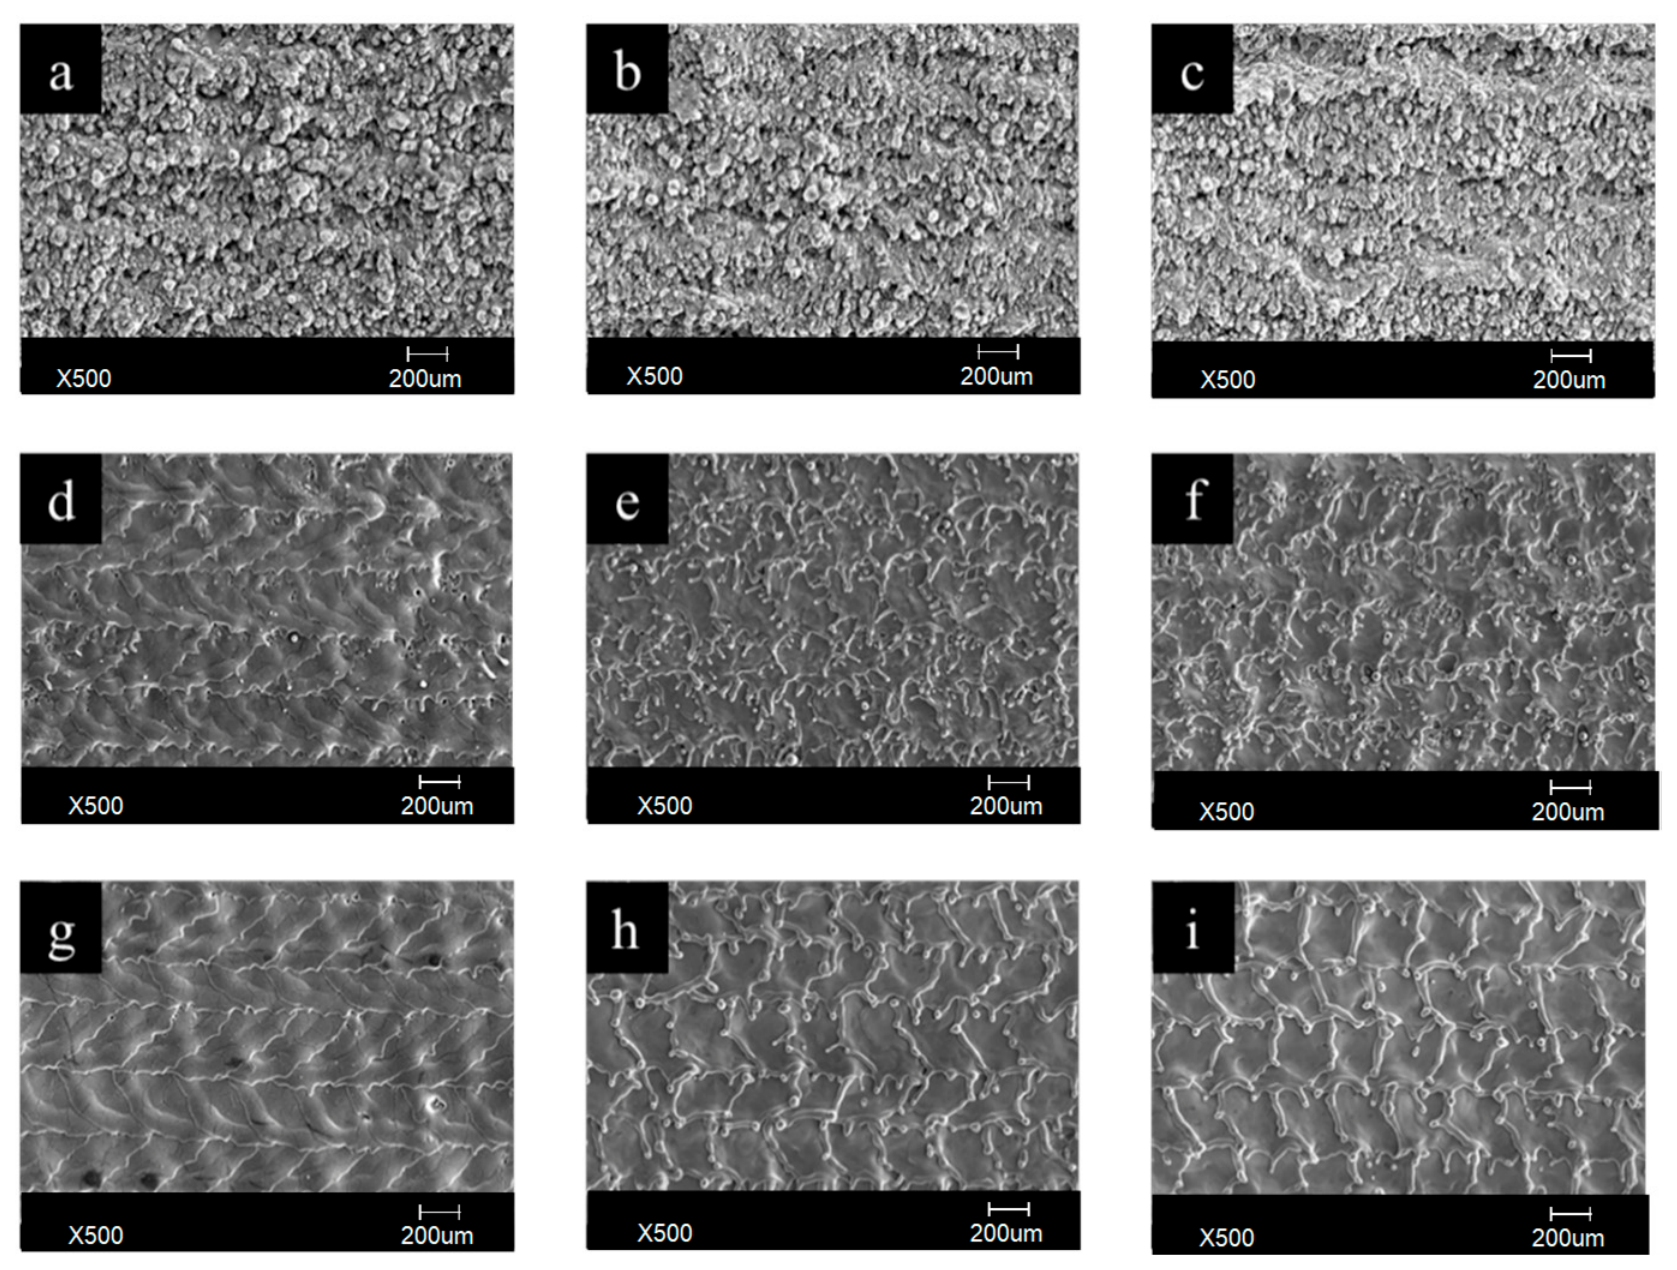
Figure 6 shows the surface morphology of the samples after multi-pass laser cleaning at different energy densities. It is evident that when the laser energy density is set at 50.9 J/cm2, numerous droplet-like molten deposits appear on the substrate surface after a single cleaning pass, resulting in an uneven overall morphology and significant laser ablation effects, as shown in Figure 6a.
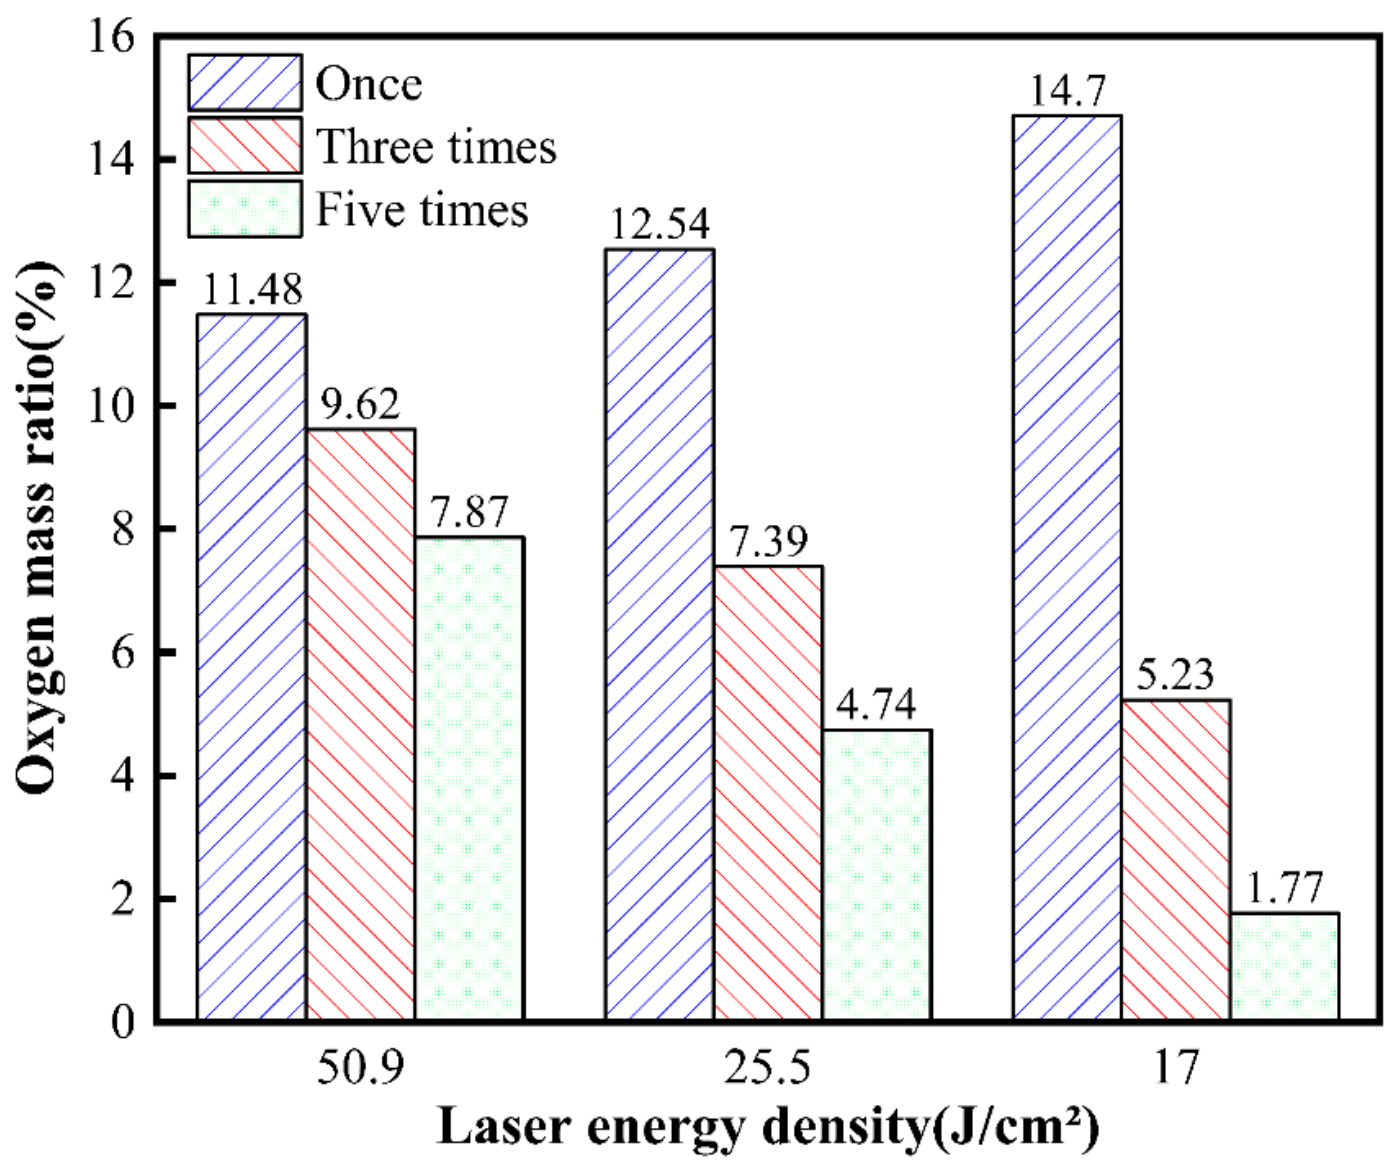
At this energy density, a single cleaning pass is insufficient to completely remove the hot-rolled oxide film. Increasing the cleaning cycles to three and then to five, as shown in Figure 6b,c, still reveals droplet-like molten material on the substrate surface. Moreover, with the increase in cleaning cycles, the protruding molten deposits tend to become more prevalent. However, under multiple irradiations from high-energy lasers, the oxide particles begin to melt and coalesce extensively, leading to a gradual smoothing of the surface morphology. Although the oxygen content decreases slightly with the increase in scanning cycles, it remains at a relatively high proportion. This indicates that at an energy density of 50.9 J/cm2, the repeated melting and solidification phenomenon occurs on the substrate surface, preventing the effective layer-by-layer removal of the hot-rolled oxide film through laser ablation.
In Figure 6d–f, when the laser energy density was reduced to 25.5 J/cm2, the surface of the sample exhibited ablation patterns along the scanning direction after a single cleaning, as shown in Figure 6d. With an increase in the number of scans, the surface texture of the sample became increasingly chaotic, covered with splattered molten material. Compared to the high energy density of 50.9 J/cm2, the oxygen content showed a more significant decrease with the increase in cleaning cycles. After five laser scans, the sample surface still presented a light-yellow color on a macro scale, indicating a reduction in the overburn phenomenon caused by the laser thermal effects.
In Figure 6g–i, after further reducing the laser energy density to 17.0 J/cm2, wave-like cleaning patterns appeared again after a single cleaning as seen in Figure 6g. As the number of scans gradually increased, the samples formed regularly arranged pits under the impact of the pulsed laser, with edges formed by accumulated molten material. The mass fraction of oxygen significantly decreased with the increase in the number of scans, reaching a minimum value of 1.77% after five laser scans. The substrate material exposed a bright metallic luster, achieving a complete cleaning effect.
Meanwhile, according to the EDS spectral analysis results shown in Figure 7, the oxygen content is significantly reduced compared to the original surface, with the sample appearing brownish at the macroscopic level, indicating potential thermal damage to the material during laser cleaning at high energy densities. The results of the single-parameter multiple cleaning experiments indicate that when the laser energy density is 50.9 J/cm2, the material exhibits a significant number of droplet-like molten deposits under the influence of a high-energy laser.
As the number of scans increases, a repeated melting–solidifying phenomenon occurs on the sample surface, and the presence of droplet-like molten deposits does not improve. Moreover, the changes in the oxygen content on the sample surface show that at this laser energy density, gradually increasing the number of scans does not effectively remove the thermal oxide layer. A reduction in laser energy density to 25.5 J/cm2 results in a notable enhancement in the quality of the molten phenomenon on the sample surface. However, this improvement is accompanied by an increase in the intensity of the phenomenon with an increasing number of scans. The oxygen content indicates that oxide residues or re-oxidized regions may still remain at this parameter, although EDS alone is insufficient to confirm complete removal or retention of the thermally oxidized film. When the laser energy density is further reduced to 17.0 J/cm2, the lower pulse energy helps to reduce excessive thermal effects on the substrate surface. However, additional cleaning cycles are required to gradually thin the thermal oxide film, which in turn decreases the efficiency of laser cleaning. Therefore, it is crucial to achieve an optimal balance between cleaning quality and removal efficiency in the laser cleaning of thermal oxide skin.

4. Discussion

4.1. The First Step of the Laser Cleaning Process and Surface Quality

Based on the aforementioned preliminary cleaning experiment results, a two-stage laser cleaning process with variable parameters is proposed. First, a low-frequency, high-energy-density laser is used to significantly thin the thermal oxide film. The high-energy laser creates a molten surface with greater roughness, which is more conducive to the material’s absorption of the laser beam energy. Subsequently, a high-frequency, low-energy-density laser is employed to remove the residual oxides while improving the micro-morphology of the substrate surface. This approach not only ensures effective removal of the thermal oxide layer but also maintains a high cleaning efficiency and results in a better surface quality, meeting the process requirements for laser cleaning of thermal oxide skin.
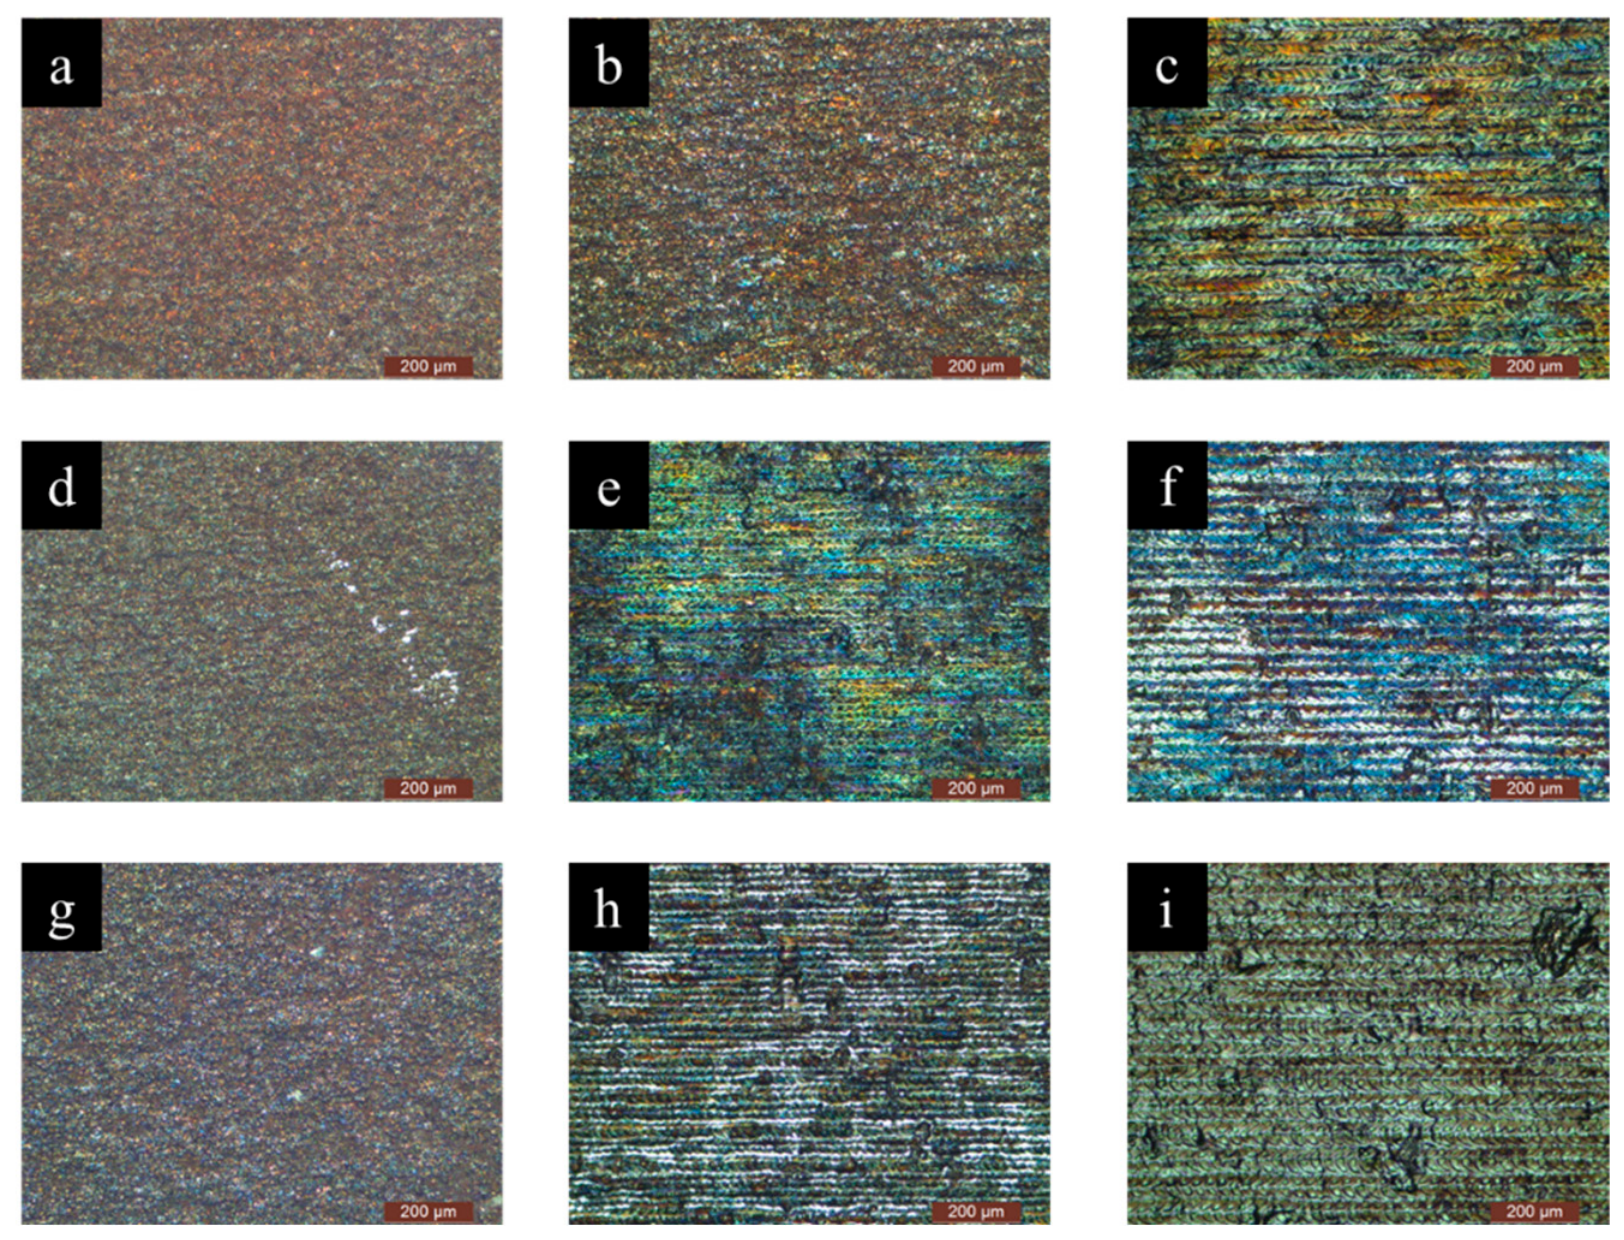
In Figure 8a–c, when the energy density is 50.9 J/cm2 and the spot overlap rate is 80%, the surface of the substrate appears reddish-brown after cleaning, indicating that the material surface has experienced evident thermal effects at this energy density. As the laser scanning speed increases and the spot overlap rate decreases to 60% and then to 40%, the damage caused by thermal accumulation gradually weakens. At a 40% overlap rate, the traces of the laser spot scanning can be clearly observed, with slight yellowing appearing on the cleaned sample surface.
In Figure 8e–f, when the laser energy density is 25.5 J/cm2 and the overlap rate is 80%, the sample surface still exhibits noticeable thermal effects. As the scanning speed increases and the overlap rate decreases, the ablation damage significantly weakens. At a 60% overlap rate, local areas of the sample surface reveal slight ablation of the metal substrate, but most of the surface remains covered by a gray oxide film. When the overlap rate is further reduced to 40%, a noticeable bright white area appears on the sample surface. Due to the lower overlap rate, there are many gray strip-like oxide skins in the Y direction, indicating that the cleaning effect is not uniform enough.
In Figure 8g–i, when the laser energy density is 17.0 J/cm2 and the overlap rate is 80%, the sample surface still exhibits thermally affected ablation features, presenting a gray-brown color. When the overlap rate is reduced to 60%, the sample surface alternates between gray oxide skin and substrate, indicating incomplete removal of the thermal oxide film. Further reducing the overlap rate to 40%, due to both the low laser energy density and the low spot overlap rate, the laser ablation effect is not significant, and clear scanning traces are observed on the sample surface, with the laser spots forming regularly distributed pits.
The optical microscope images of the sample surface after the first stage of laser cleaning reveal that both the laser energy density and the spot overlap rate have a significant impact on the cleaning effectiveness. If the laser energy density is too high or the scanning speed is too slow, obvious ablation marks appear on the sample surface. Conversely, if the laser energy density is too low or the scanning speed is too fast, effective cleaning cannot be achieved. Combining the results from multiple single-factor cleaning experiments indicates that only with appropriate parameter combinations can both surface quality and cleaning efficiency be optimized.
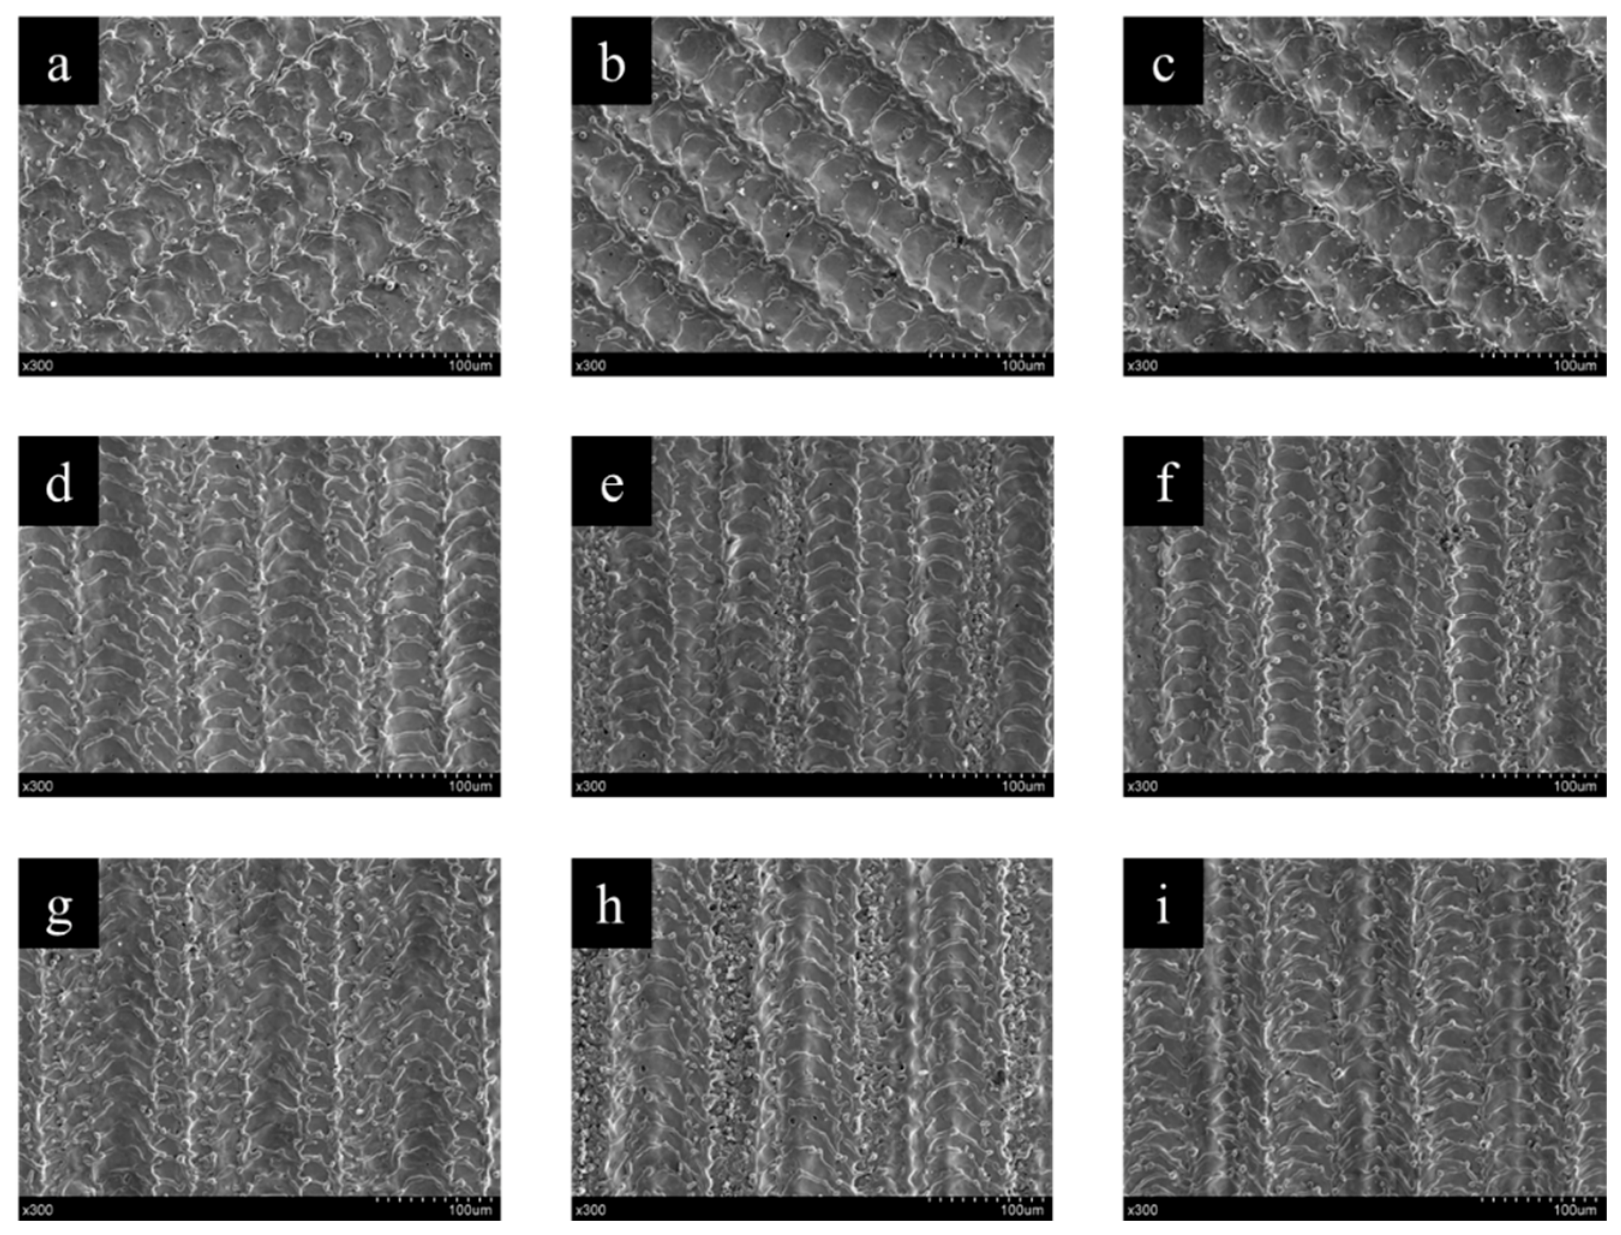
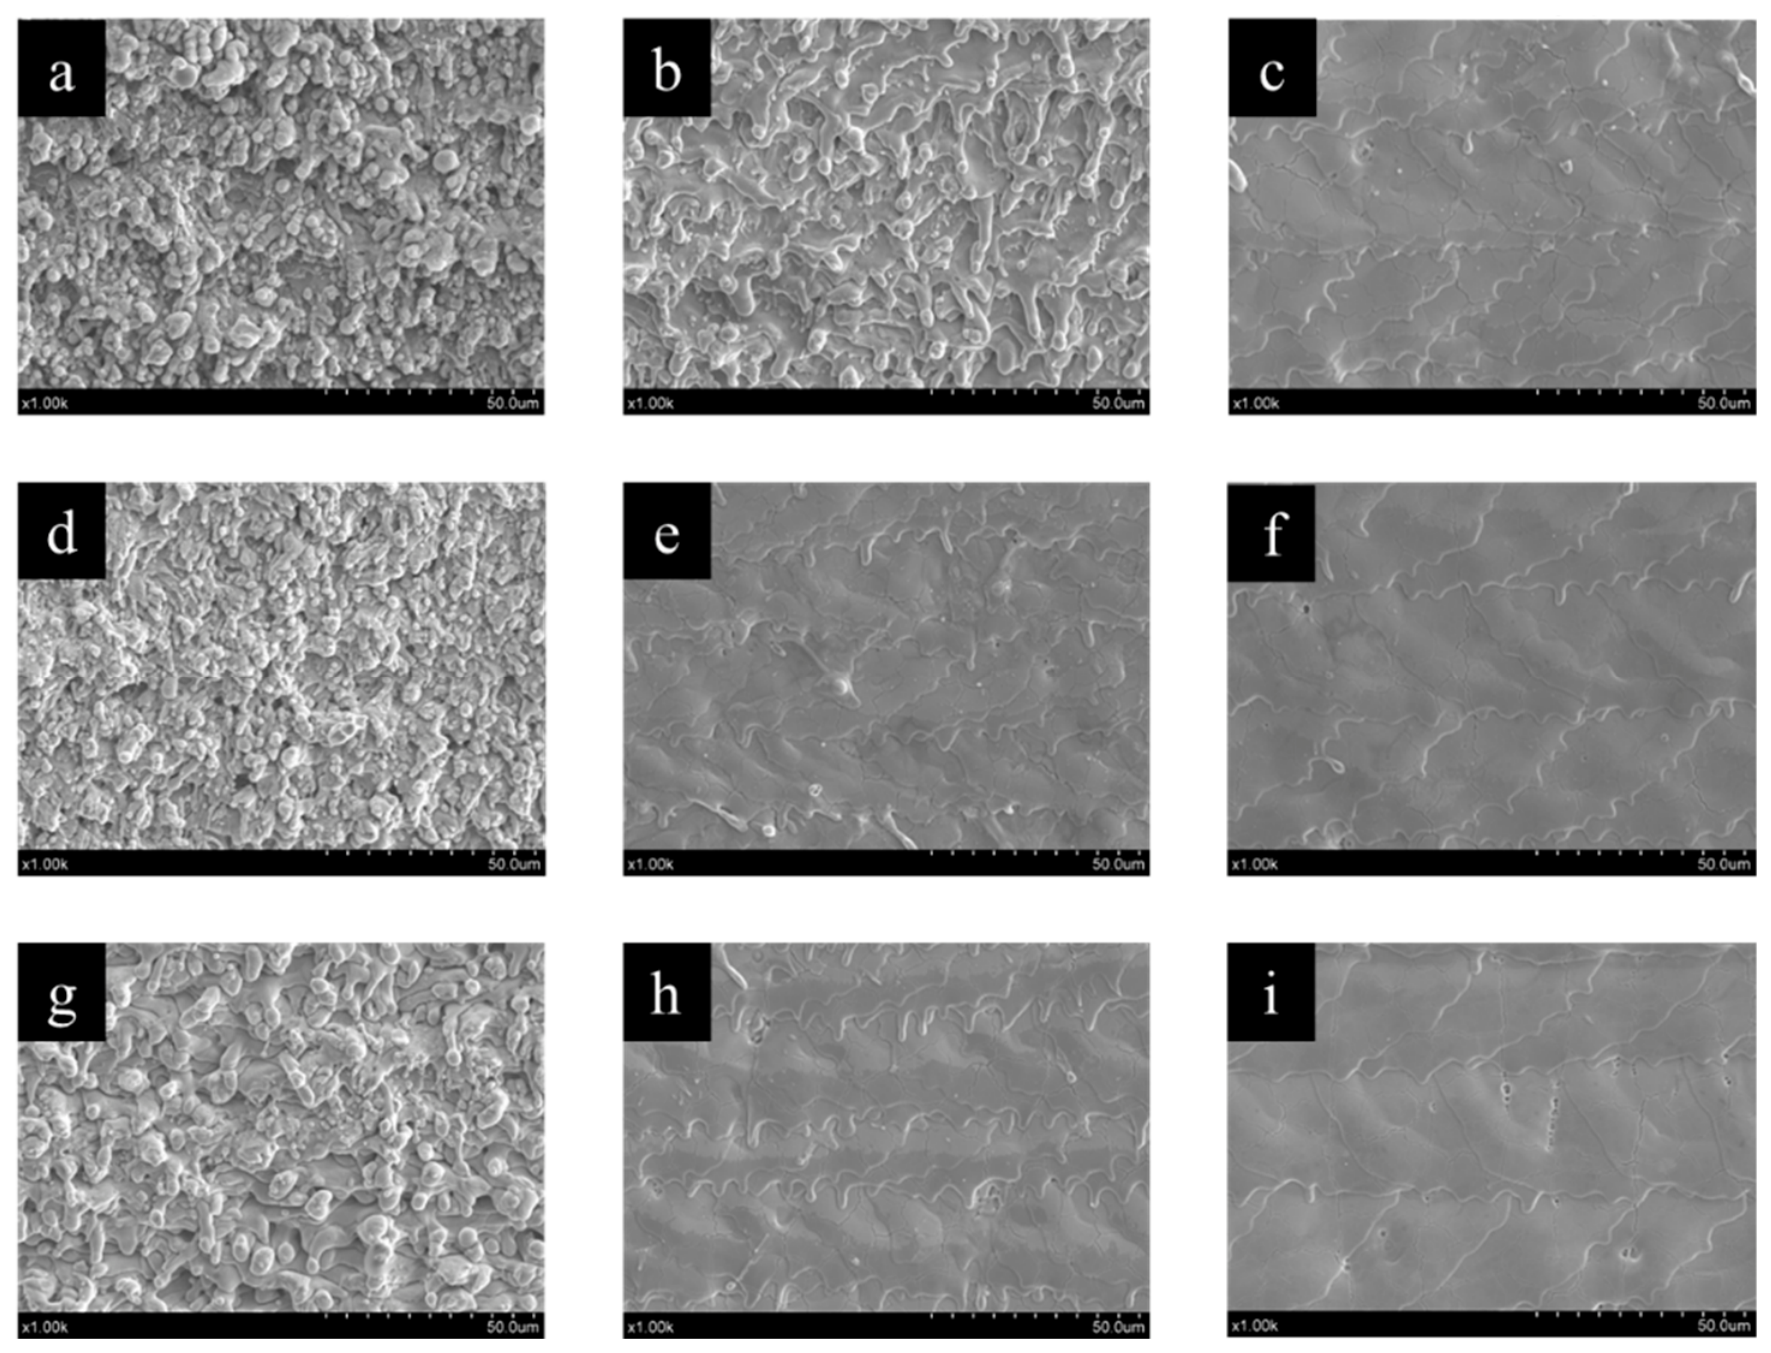
Figure 9 depicts the electron microscope images obtained under the parameters of the initial-stage laser cleaning experiment. It can be observed that when the spot overlap rate is 80%, the sample surfaces cleaned at energy densities of 50.9 J/cm2, 25.5 J/cm2, and 17.0 J/cm2 all exhibit droplet-like molten deposits, similar to the results of the single-factor multiple cleaning experiments in Chapter 2. As the laser energy density decreases, the number of droplet-like molten deposits decreases, and the size of the molten droplets on the surface after cleaning at an energy density of 17.0 J/cm2 is relatively larger.
Following a reduction in the spot overlap rate to 60%, the surface cleaned at an energy density of 50.9 J/cm2 still exhibited the presence of molten deposits, albeit in a more sparsely distributed manner when compared to higher overlap rates. In contrast, the surface morphology at energy densities of 25.5 J/cm2 and 17.0 J/cm2 is relatively smooth, with discernible evidence of spot overlap. The edges of the laser scanning direction exhibit the presence of minor undulations in a wave-like configuration.
When the spot overlap rate is 40%, the micro-morphology of the sample surface becomes flatter as the energy density decreases, and the laser scanning traces become more indistinct. This is because, with the increase in laser scanning speed, the heat dissipation space of the spot cleaning area expands, weakening the laser thermal accumulation effect. Consequently, the temperature and pressure of the molten pool formed by spot ablation decrease, as evidenced by the disappearance of droplet-like molten deposits and a reduction in thermal damage.
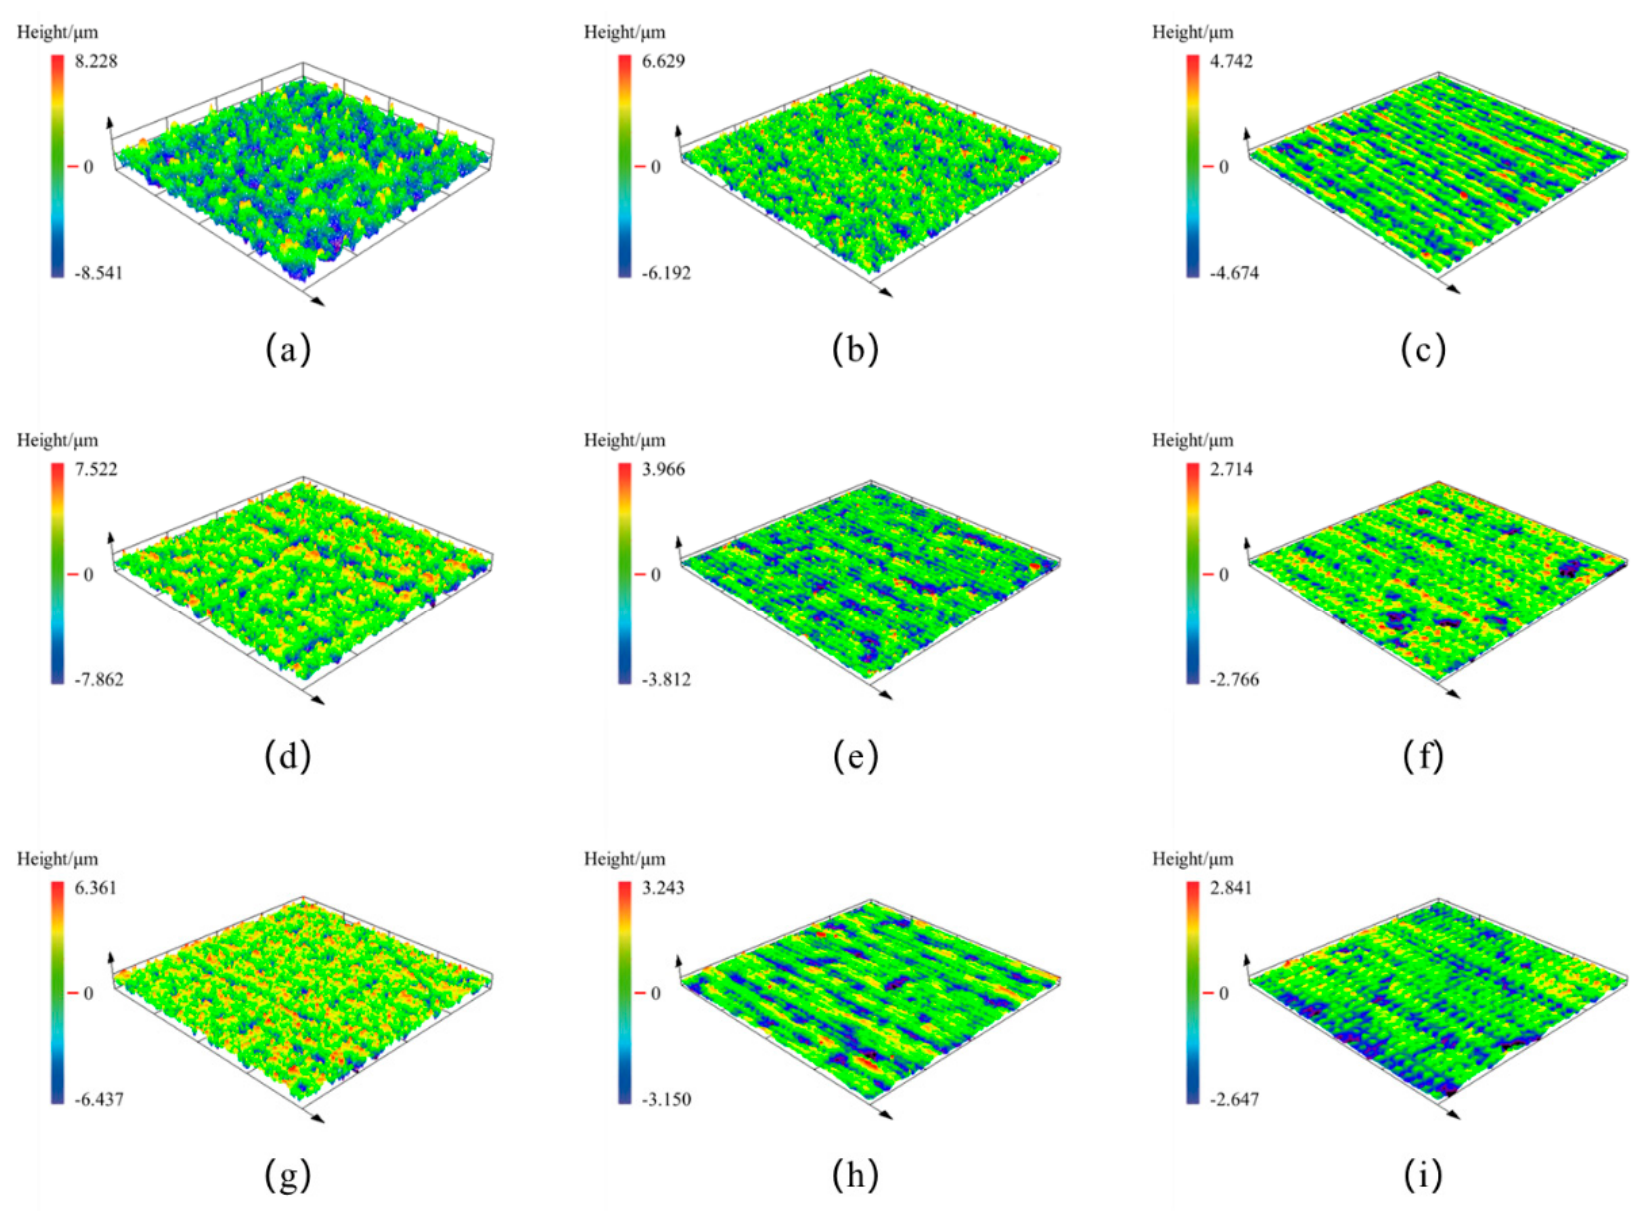
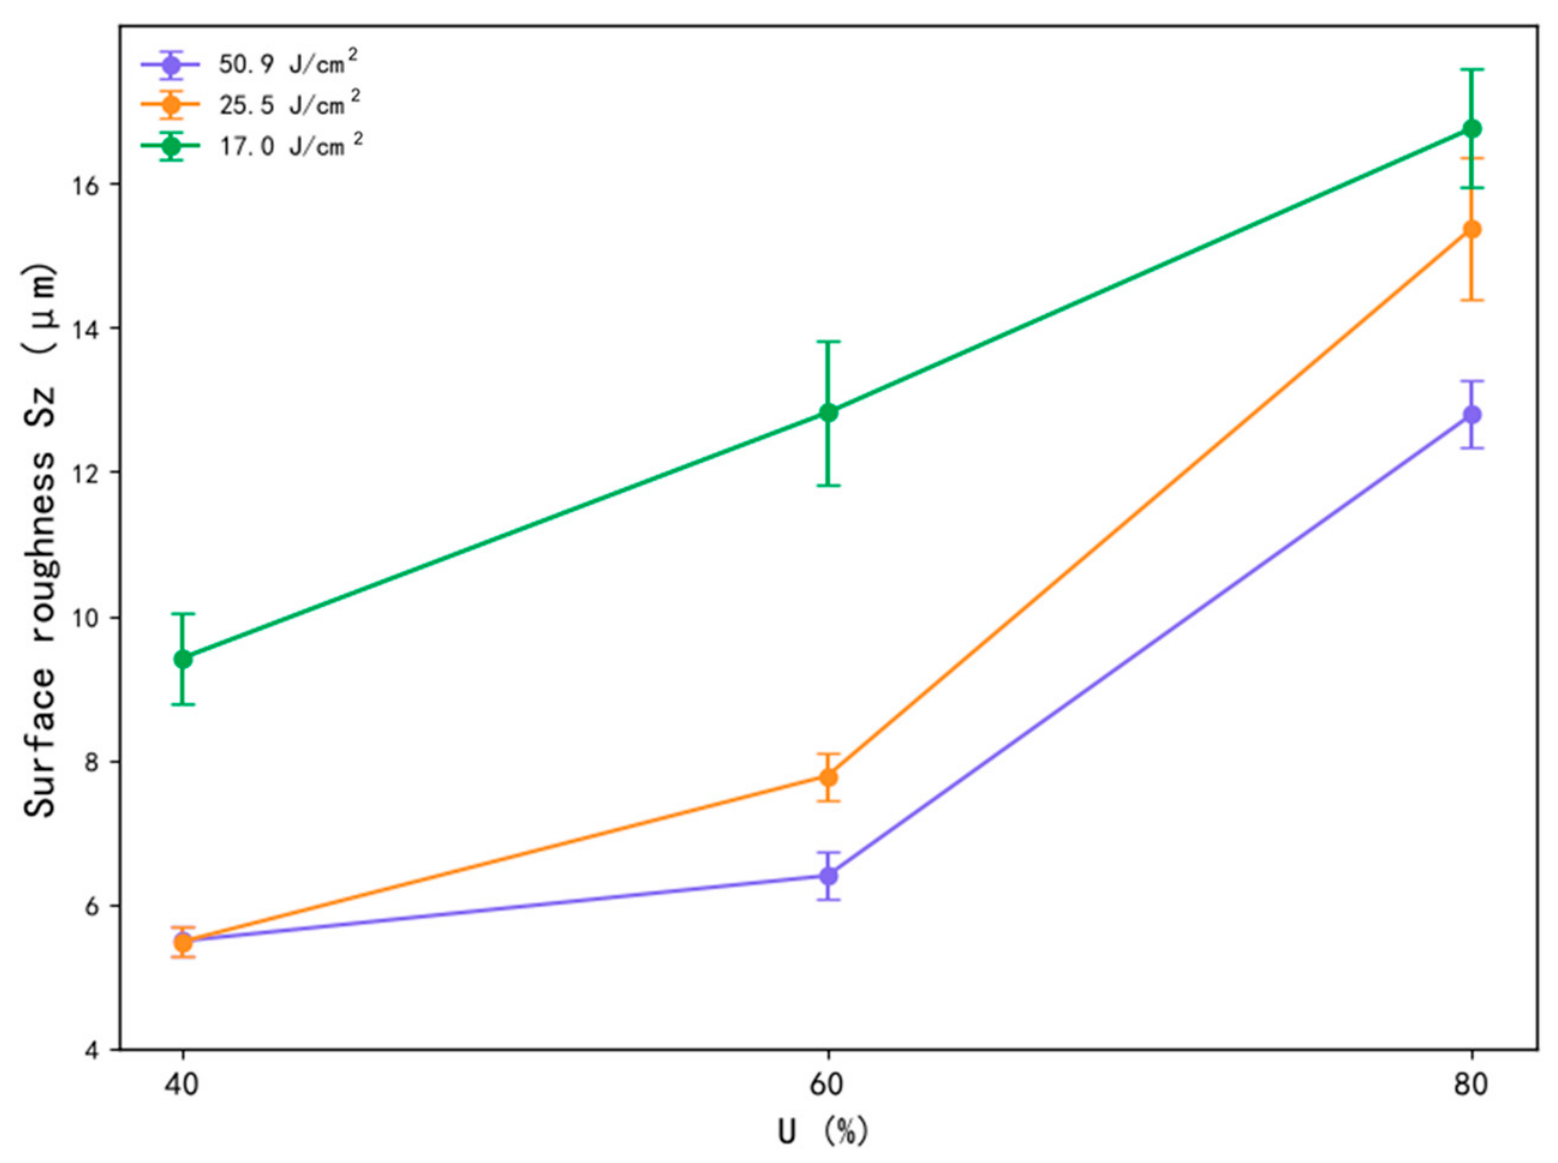
Figure 10 and Figure 11 illustrates the three-dimensional morphology of the sample surface following the initial stage of laser cleaning. By combining this with the micro-morphology images, it can be observed that the micro-morphology exhibits greater surface undulations due to the presence of droplet-like molten deposits, resulting in higher surface roughness.
At a constant spot overlap rate, the surface roughness of the sample is positively correlated with the laser energy density: the higher the energy density, the greater the surface roughness. High-energy-density lasers can cause a rapid increase in local temperature on the sample surface, potentially leading to phenomena such as evaporation, dissolution, or melting, and even the generation of high-temperature gases. This excessive thermal effect can result in uneven material removal and even molten spattering, creating a granular, uneven and rough structure on the surface. Furthermore, due to the distribution characteristics of Gaussian pulsed lasers, high-energy densities may lead to non-uniform removal effects, where some areas may be over-cleaned or damaged while others may retain contaminants or remain insufficiently treated, ultimately increasing surface roughness.
Conversely, at a constant laser energy density, the surface roughness of the sample is inversely proportional to the laser scanning speed. If the scanning speed is insufficient, the laser lingers longer at a given position, potentially resulting in over-cleaning or ablation. This can create more textures or depressions on the surface, thereby increasing surface roughness. Tighter spot overlap rates can enhance the thermal accumulation effect of the laser, as continuous laser pulses on the same area accumulate energy, surpassing the material’s thermal diffusion and conduction capabilities, leading to local overheating, detachment, or sintering, resulting in a rough surface.
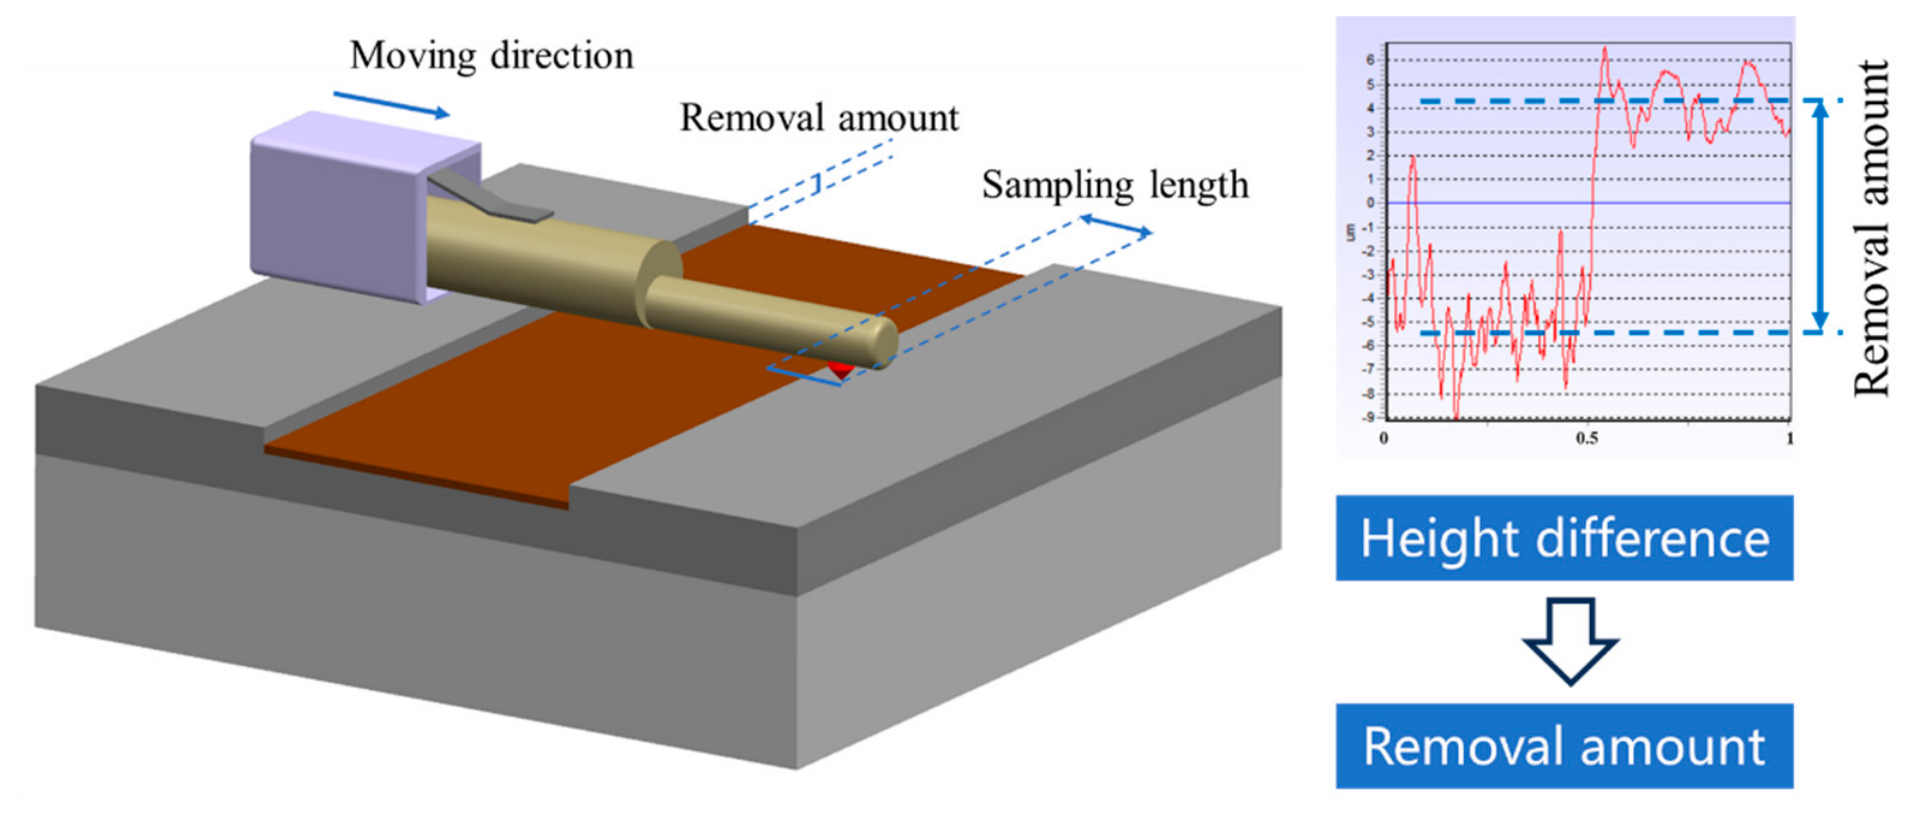
From the surface morphology characteristics, it can be seen that there are signs of ablation thermal damage or incomplete cleaning after the first cleaning step. Consequently, the oxygen content on the surface was not analyzed. However, by measuring the amount of thermal oxide film removed after the first cleaning step, reference can be provided for setting the process parameters for the subsequent second laser cleaning step. To rapidly and efficiently ascertain the residual quantity of thermal oxide film following the initial laser cleaning procedure, a roughness measurement apparatus was employed to discern the diminution of the oxide film. As the probe moves across the surface of the workpiece, it experiences vertical movements due to surface undulations. This movement is amplified by electronic devices, outputting data or graphs related to roughness, ultimately resulting in the surface profile along the measurement path. The sampling length used in this test is 1 mm, and the sampling path transitions from the cleaned surface to the original surface. By processing the graphical data, the average fluctuation value difference between the cleaned and uncleaned areas is considered the thinning amount from the first laser cleaning step, with the detection principle illustrated in Figure 12.
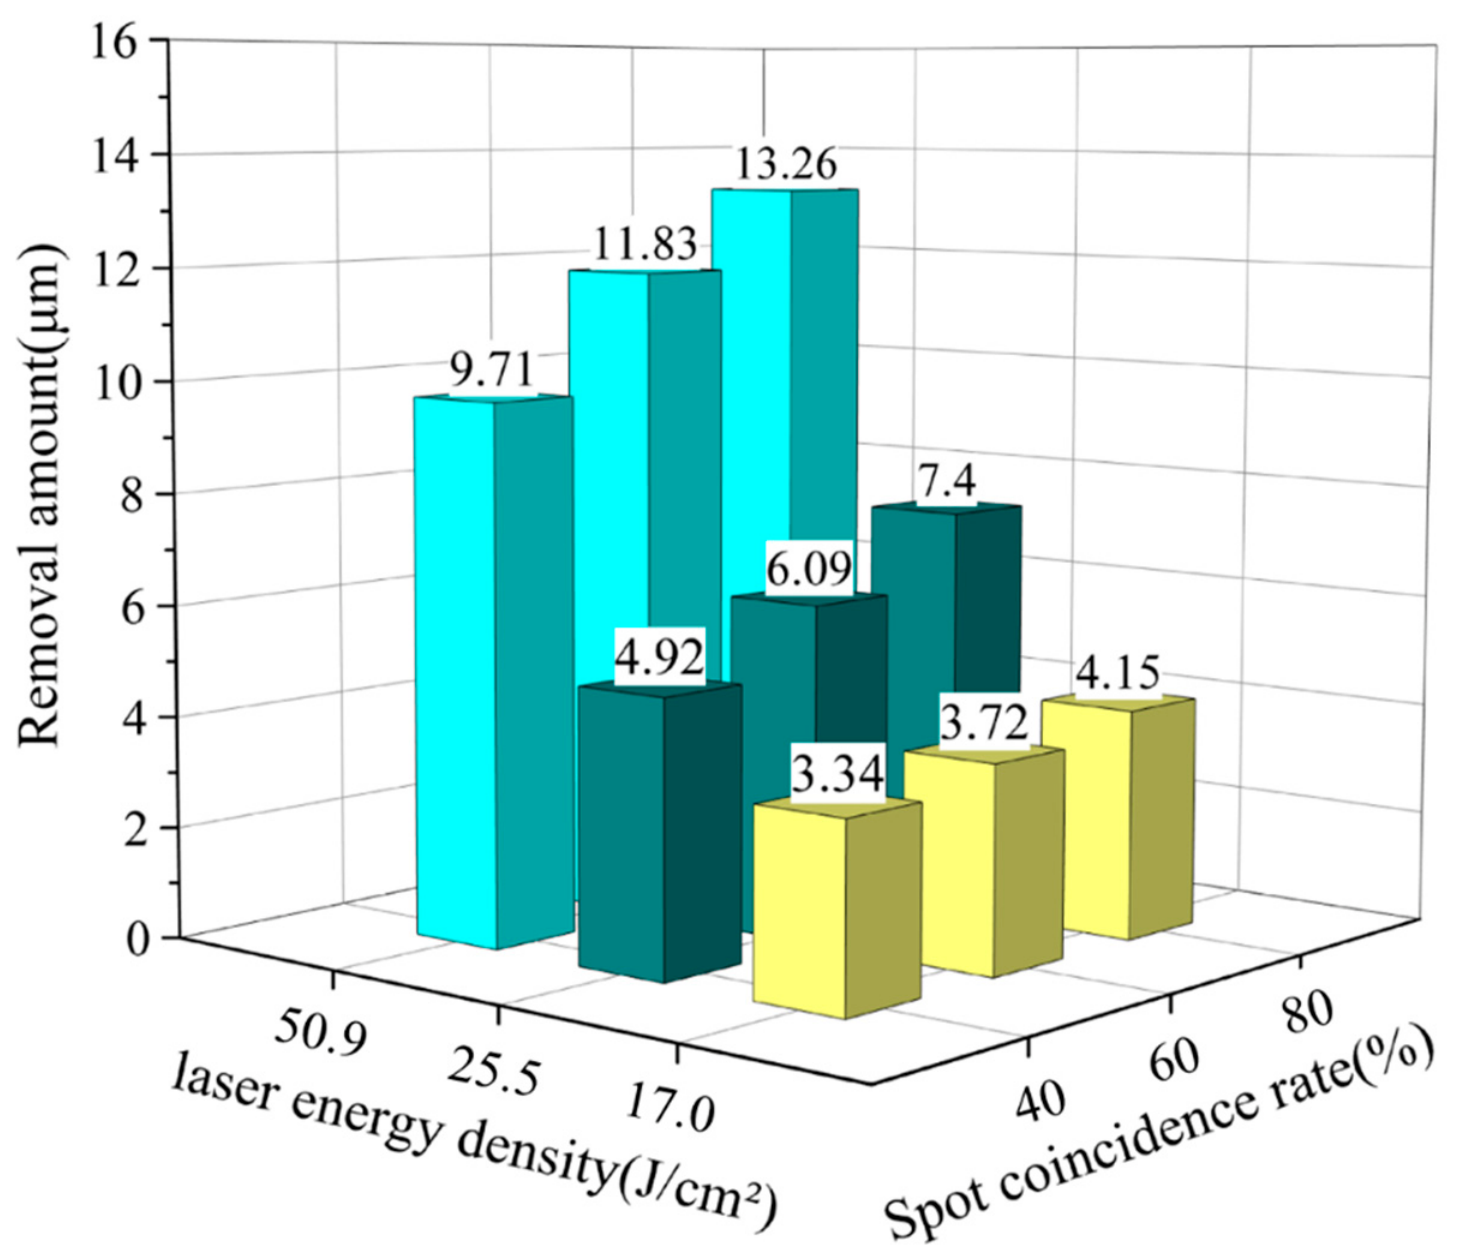
Figure 13 illustrates the thinning amount data obtained from the initial stage of laser cleaning. It can be seen that compared to the spot overlap rate, the impact of laser energy density on the removal rate of the thermal oxide film is more significant, demonstrating an almost linear relationship. Higher energy density lasers can provide sufficient thermal energy and mechanical action to evaporate, melt, and strip the oxide layer, thereby increasing the thinning amount of the oxide layer during laser cleaning. At the same energy density, a higher spot overlap rate results in a wider area of laser beam action when cleaning the thermal oxide film. The interaction and superposition effects between multiple spots enhance the thermal energy and impact force, leading to a greater removal amount of the oxide layer. Additionally, a high spot overlap rate means that the same area receives laser irradiation for a relatively longer time, increasing the interaction time with the oxide layer during the cleaning process, further improving the removal effect.
In the initial phase of the laser cleaning process experiment, the maximum thinning amount of the thermal oxide film was achieved with the parameters of a laser energy density of 50.9 J/cm2 and a spot overlap rate of 80%, amounting to 13.26 μm, which is less than 16 μm (the average thickness of the thermal oxide film shown in Figure 3b). Therefore, this process parameter will serve as the basis for the second stage of the laser cleaning experiment. The objective of the second stage of laser cleaning is to remove the residual oxide film from the substrate surface and to repair the droplet-like molten deposits observed on the surface in Figure 9a.

4.2. The Second Step of the Laser Cleaning Process and Surface Quality

As evidenced by the aforementioned findings, the initial laser cleaning parameters were observed to significantly reduce the thickness of the thermal oxide film, resulting in the formation of uneven molten deposits on the sample surface. This directly led to an increase in the absorption of laser energy by the residual oxide film. Furthermore, during continuous distributed cleaning, the absorption of the first-stage laser energy by the sample leads to an increase in the surface temperature, which further enhances the sample’s absorption rate of the laser.
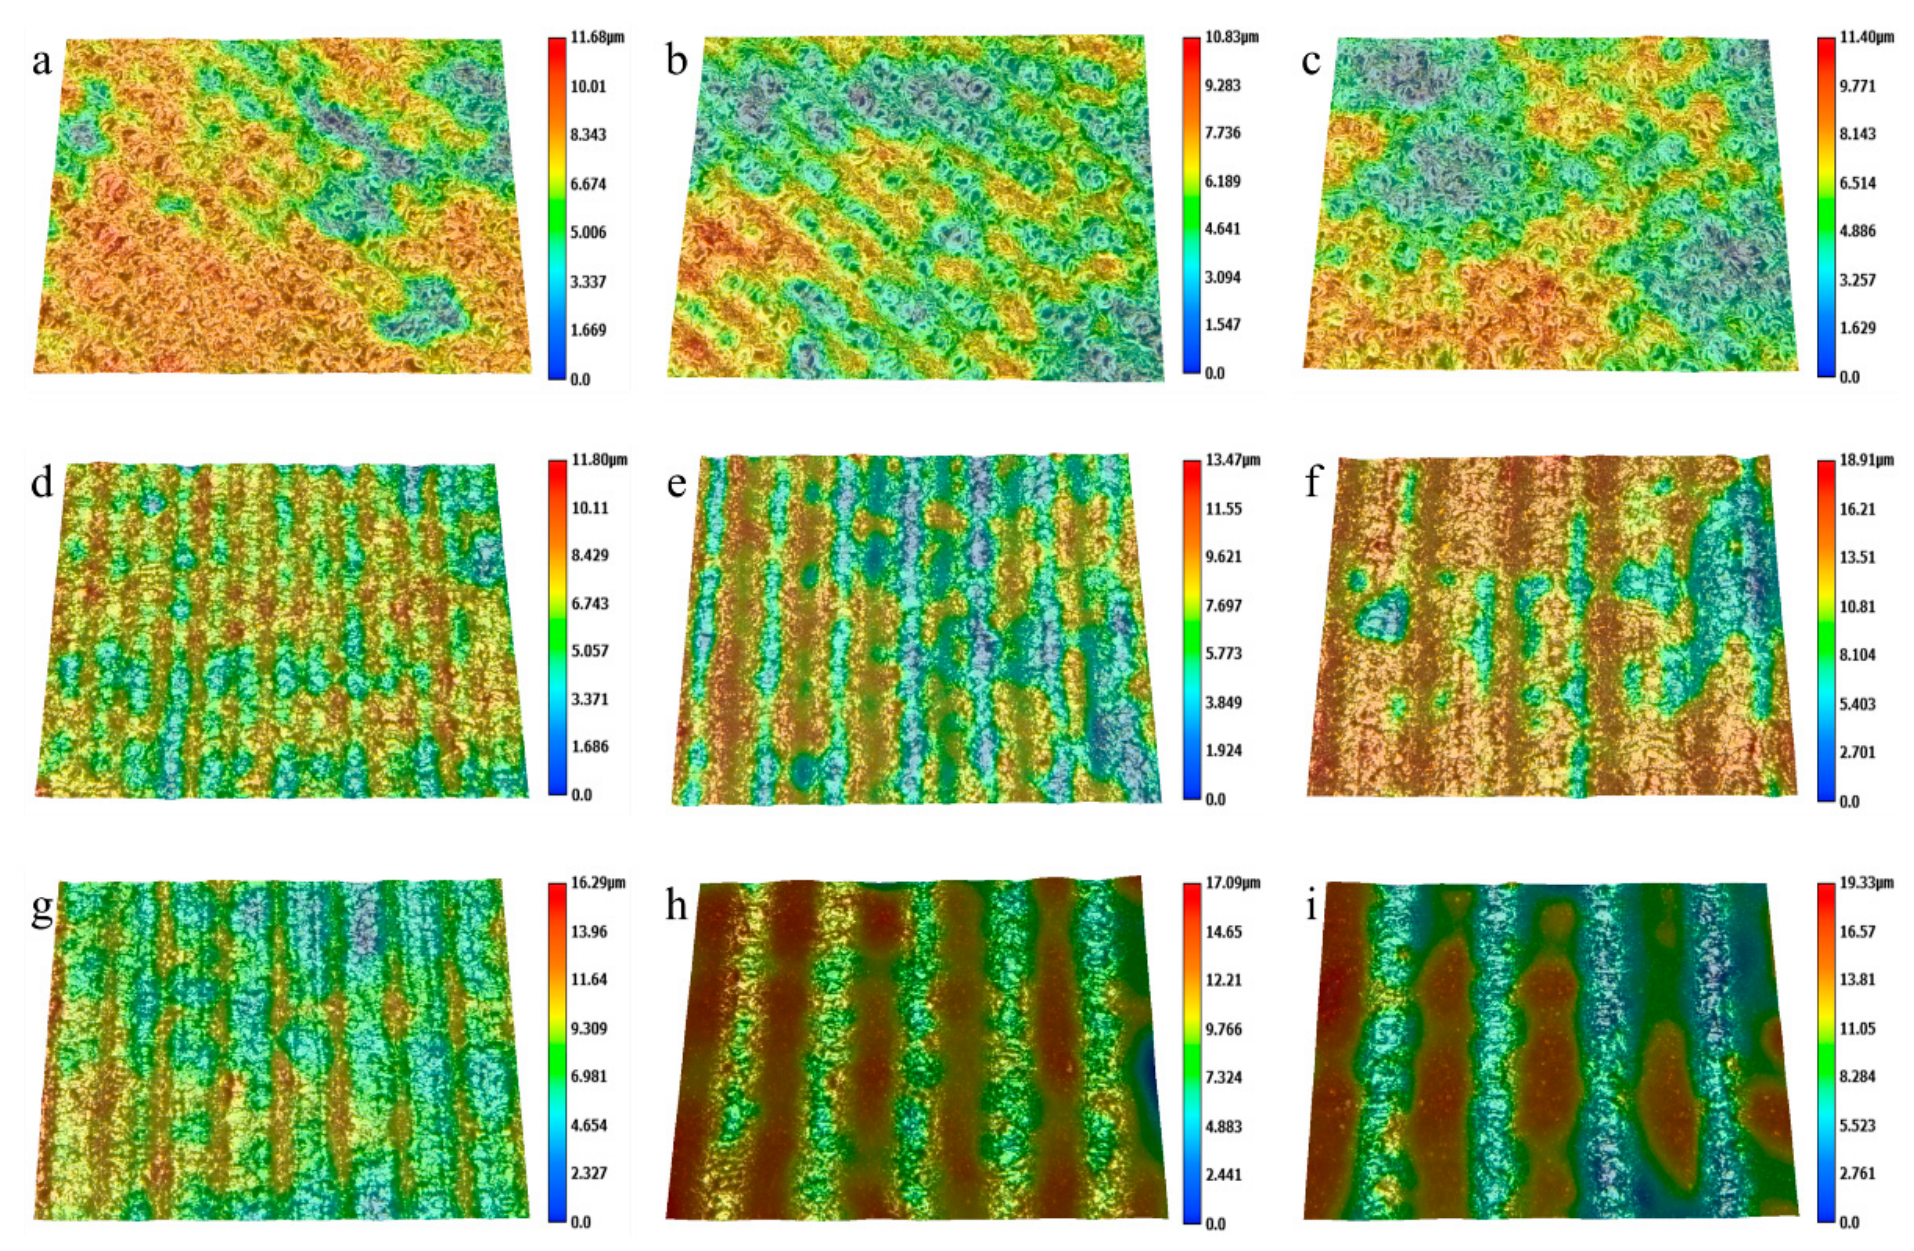
Figure 14 and Figure 15 illustrate the three-dimensional morphology of the sample surface following the second stage of laser cleaning. It can be observed that the droplet-like molten deposits generated on the surface during the initial stage of laser cleaning have completely disappeared. As a consequence of the stacking effect generated at the edges of the laser spot during scanning, ridge-like stripes emerge on the surfaces of samples subjected to different process parameters. However, the distinction can be attributed to the fact that, due to the randomly interleaved scanning trajectories, the ridge-like stripes on the sample surface cleaned at an energy density of 17.0 J/cm2 are distributed parallel in a 45° diagonal direction, while the stripes on the surfaces cleaned at energy densities of 12.7 J/cm2 and 10.2 J/cm2 are oriented vertically.
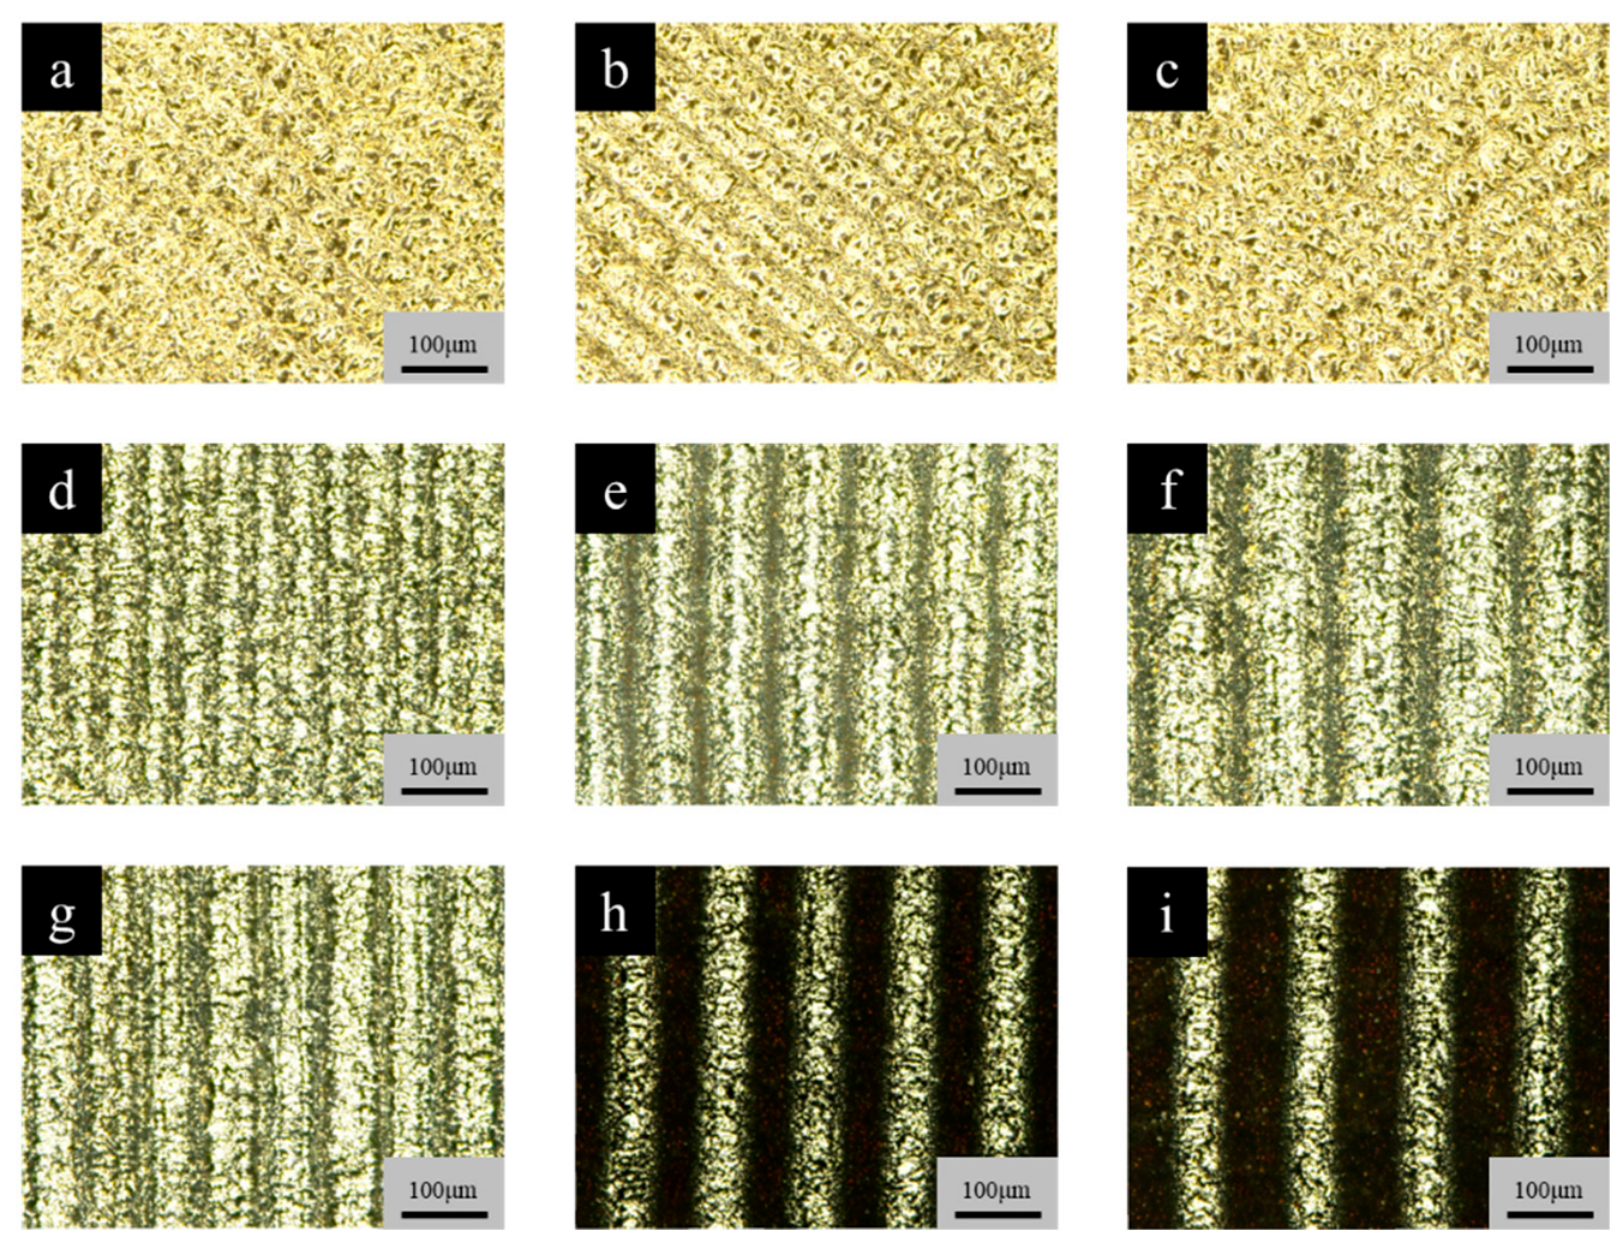
The microscopic morphology reveals that at an energy density of 17.0 J/cm2, the pits created at different laser scanning speeds are arranged in a regular and orderly manner. From the deep-focus microscope images in Figure 15, it can be seen that although the laser spots in the X direction did not form effective overlaps, the laser energy density is sufficiently high. This results in a strong thermal vibration effect at the edges of the spots, which can vibrationally detach the residual oxide layer on the surface in the areas not directly affected by the laser, leading to excellent cleaning results. The sample surface exhibits the bright metallic sheen of the substrate material. Furthermore, the interleaved distribution of the scanning trajectories at this energy density results in an increased actual coverage area of the laser spots, thereby enhancing the effectiveness of the laser cleaning process.
When the laser energy density is reduced to 10.2 J/cm2, the majority of the residual oxide layer on the sample surface can be removed at a scanning speed of 3000 mm/s. However, as the scanning speed continues to increase, a “zebra stripe” pattern begins to appear on the surface. The excessively high scanning speed results in the laser having an insufficient dwell time on the sample surface, and the low laser energy density is inadequate to generate the requisite thermal vibration effect to cause the oxide layer in the unaffected areas to be impacted and stripped away. This results in poor cleaning results, leaving behind zebra stripe-like residues.
As the frequency of the laser pulse increases and the energy density decreases to 12.7 J/cm2, it is still possible to remove the residual oxide layer from the substrate surface at a scanning speed of 3000 mm/s. However, when the laser scanning speed increases to 4000 mm/s and 5000 mm/s, gray vertical stripes appear on the sample surface. This is due to the reduced energy density, which weakens the impact effect at the edges of the spots, making it impossible to completely remove the oxide layer in the intervals between the spots.
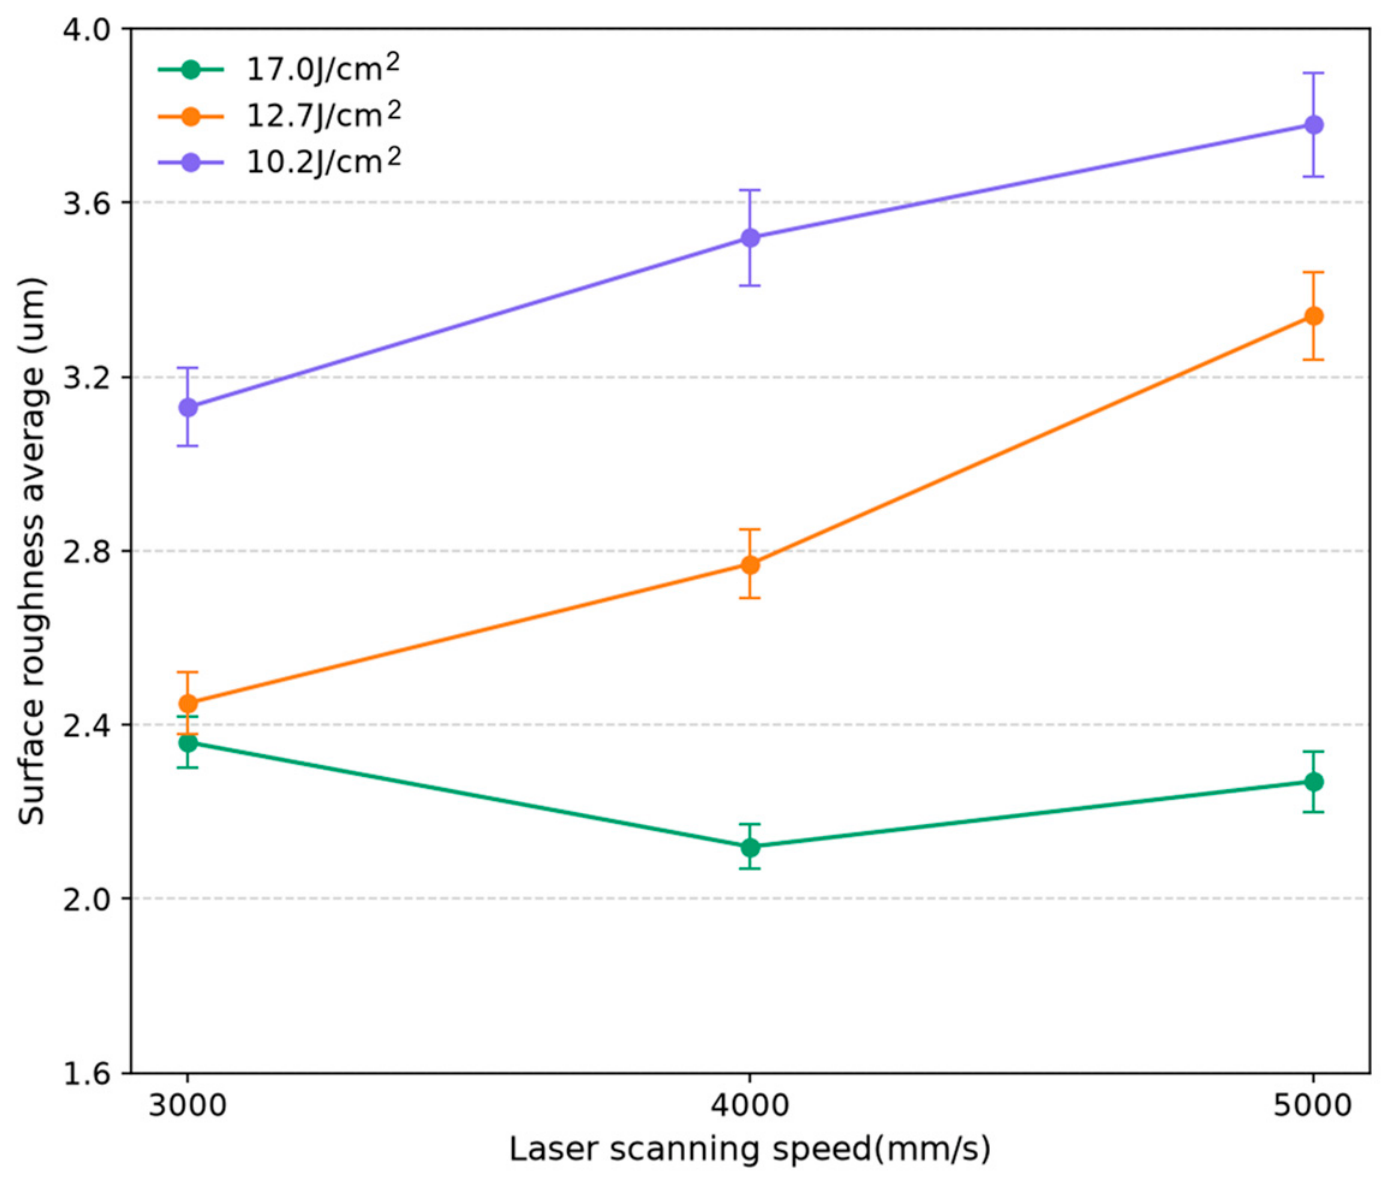
Figure 16 and Figure 17 illustrate the three-dimensional morphology and roughness of the sample surface following the second stage of laser cleaning. It can be observed that the surface roughness values of the samples exhibit an overall inverse relationship with the laser energy density: the higher the energy density used in the second stage of laser cleaning, the lower the surface roughness of the samples. This is because high-energy-density lasers can concentrate energy over a larger cleaning area during the cleaning process, increasing the diffusion of the heat-affected zone, which helps to avoid overheating and the formation of uneven surface structures, thereby reducing roughness. In contrast, at lower energy densities, the effective cleaning area of the laser may be limited to the spot projection area, preventing sufficient thermal stress vibration from detaching the oxide layer at the edges of the spot.
At energy densities of 12.7 J/cm2 and 10.2 J/cm2, an increase in laser scanning speed is observed to result in an elevation in surface roughness of the samples. At a scanning speed of 3000 mm/s, a relatively high area cleaning rate can still be achieved. However, as the scanning speed increases further, the area of residual oxide regions gradually enlarges. At lower energy densities, excessive laser scanning speeds impede the laser from fully covering the entire surface of the sample during cleaning, resulting in an inadequate removal of the residual oxide layer, which exhibits irregularities in profile characteristics. The unevenness between peaks and valleys directly affects the surface roughness, and these features become more pronounced as the scanning speed increases, leading to an increase in surface roughness.
The three-dimensional morphology after cleaning at an energy density of 17.0 J/cm2 demonstrates that the effective cleaning area produced by a single pulse is larger due to the thermal vibration effect of high-energy pulsed lasers at the edges. This results in a more uniform cleaning effect. The surface of the samples exhibits minimal variation, and the changes in surface roughness are insignificant across different scanning speeds. Combining the three-dimensional morphology and surface roughness change graphs, it is observed that the sample surface cleaned with the parameters of 17.0 J/cm2 and 4000 mm/s has better flatness and the lowest surface roughness of 2.12 μm.
By analyzing the changes in oxygen element content on the sample surface after laser cleaning using EDS, it is possible to assess the effectiveness of oxide layer removal with greater accuracy. Combining Figure 2 and Figure 5, it can be concluded that after the first stage of laser cleaning, the oxygen content on the sample surface has significantly decreased from 23.91 wt.% to 11.48 wt.%.
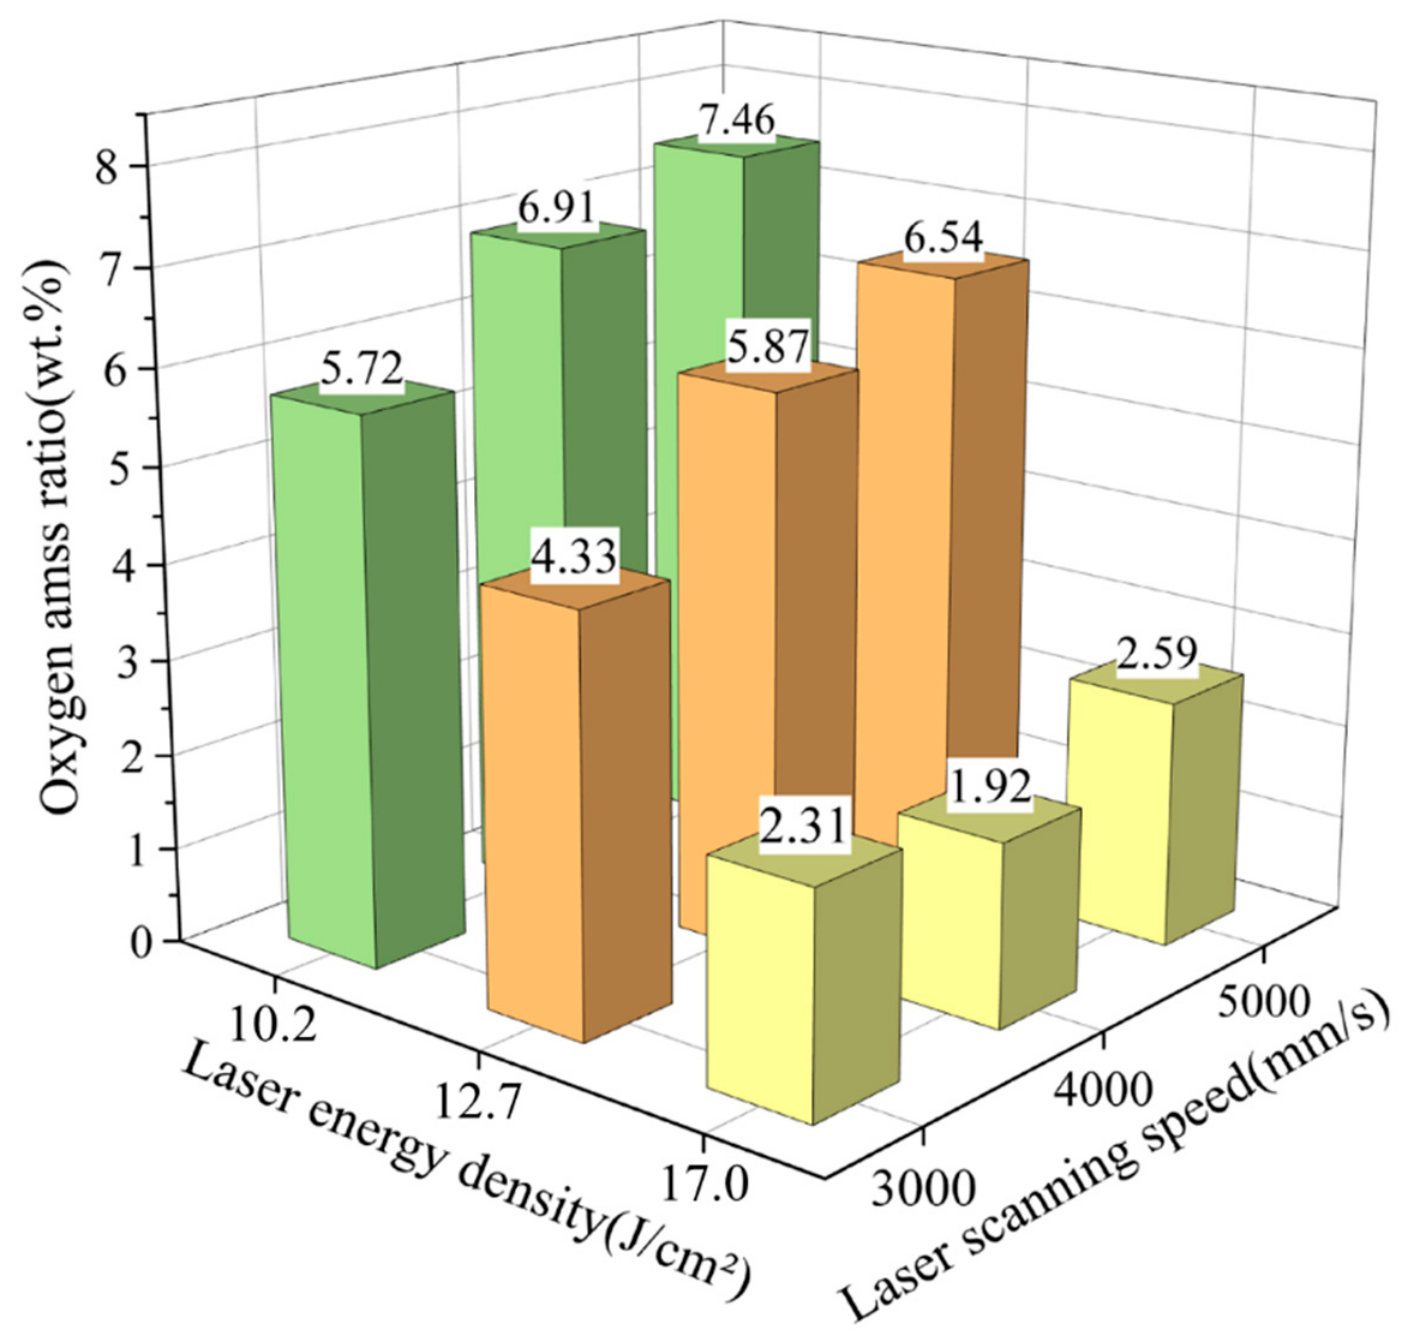
In Figure 18, the oxygen content on the sample surface is observed to decrease with the increase in laser energy density during the second stage of the laser cleaning experiment. It is observed that in comparison to the single-process multi-stage cleaning experiments, the variable process experiments resulted in a further reduction in the oxygen content on the sample surface following the second stage of laser cleaning.
At energy densities of 12.7 J/cm2 and 10.2 J/cm2, as the laser scanning speed increases, the contact time between the laser and the sample surface decreases, which may result in an insufficient cleaning effect to completely remove the oxide layer. This could lead to the formation of a streaky residual oxide film and an elevated oxygen content. In contrast, at 17.0 J/cm2, the laser cleaning effect is more uniform, and no residual oxide layer is observed in the microstructure, resulting in a lower mass percentage of oxygen. The overall trend is consistent with that observed for surface roughness, with the lowest oxygen content of 1.92 wt.% observed on the sample surface after laser cleaning at the parameter combination of 17.0 J/cm2 and 4000 mm/s. This value is similar to that obtained in the single-factor multi-stage laser cleaning experiments, which represents an optimal result. Therefore, it can be concluded that the variable process of two-stage laser cleaning effectively and efficiently removes the hot-rolled oxide layer from the surface of Q235A steel.
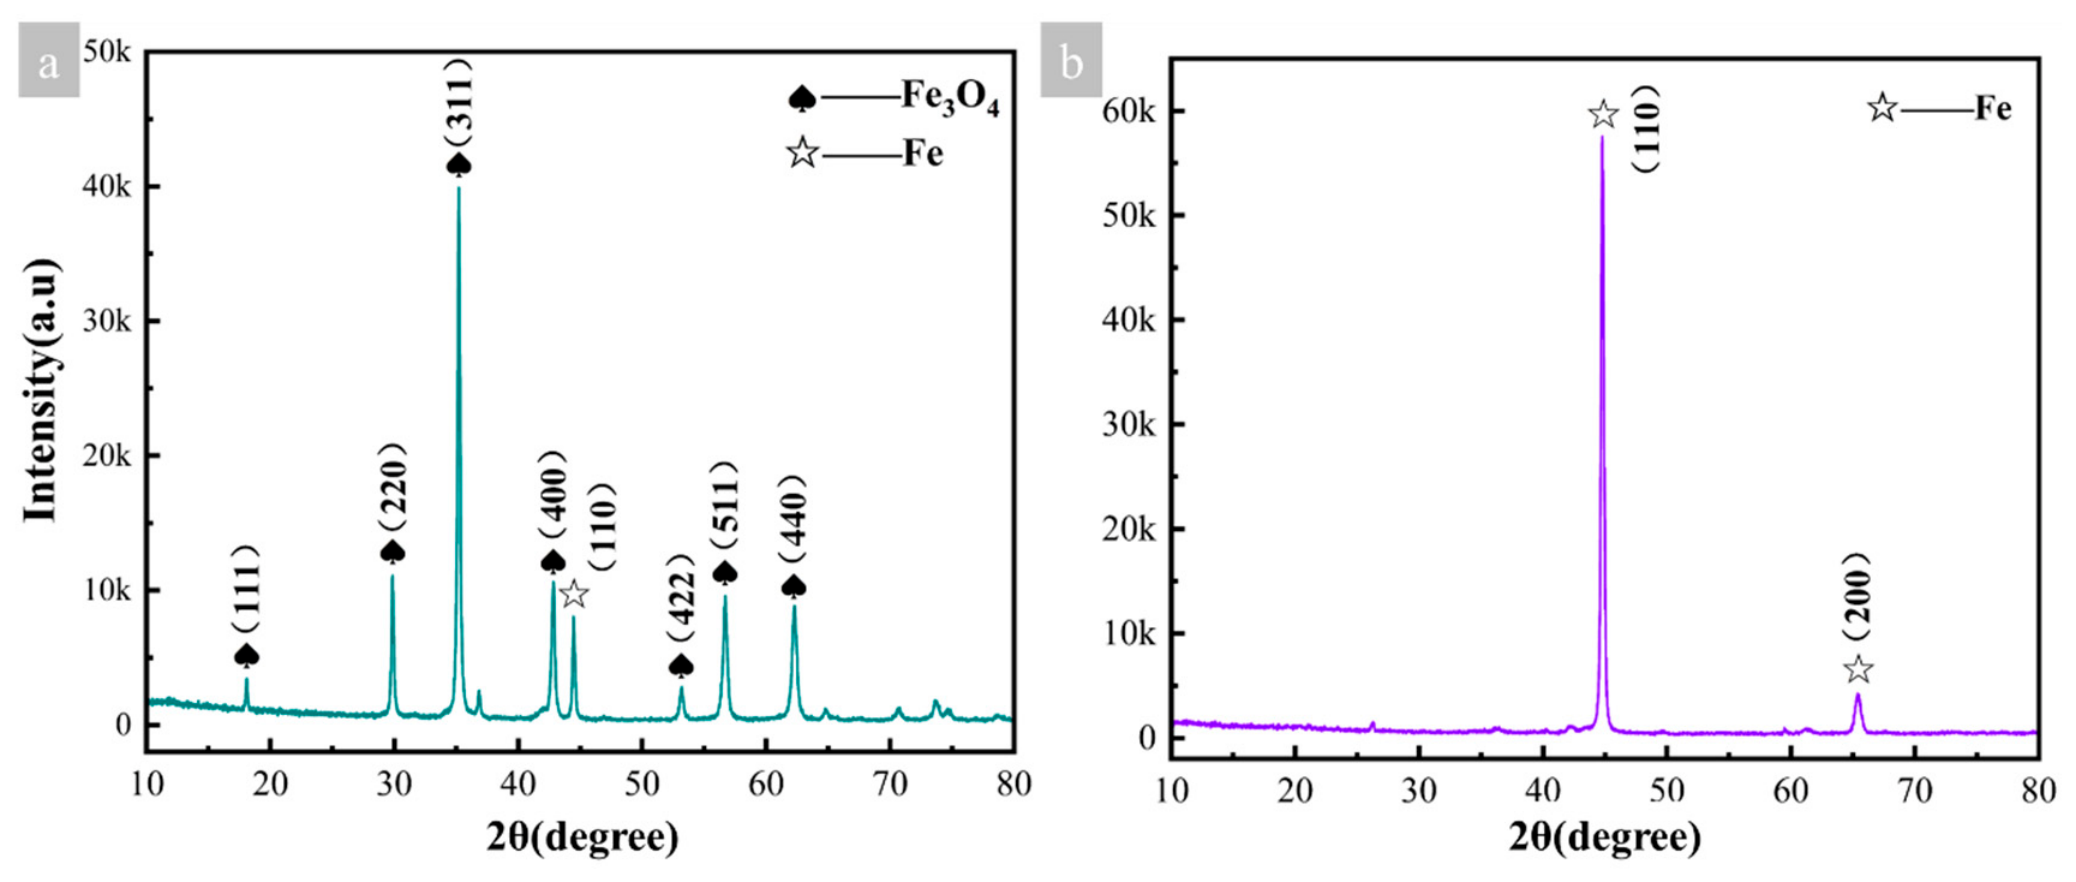
To ascertain the distinctions in the phase composition of the original sample and those of the samples subjected to variable two-stage laser cleaning, X-ray diffraction (XRD) testing was conducted on both samples. In Figure 19, the XRD patterns of the samples prior to and following laser cleaning are displayed. The diversity in the arrangement of atoms or molecules within the material structure resulted in the detection of seven prominent diffraction peaks corresponding to Fe3O4 and one diffraction peak for Fe on the surface of the original sample. Following the variable process two-stage laser cleaning, all of the Fe3O4 diffraction peaks were no longer discernible, while the Fe diffraction peak at a 45° diffraction angle with Miller index (110) exhibited a marked increase in intensity. This provides further evidence of the efficacy of the variable process two-stage laser cleaning in removing the hot-rolled oxide layer. Furthermore, in addition to the Fe diffraction peak with Miller index (110), a new diffraction peak with Miller index (200) was observed. This indicates that alterations in the crystalline structure or grain size of the surface may have occurred as a result of laser cleaning.
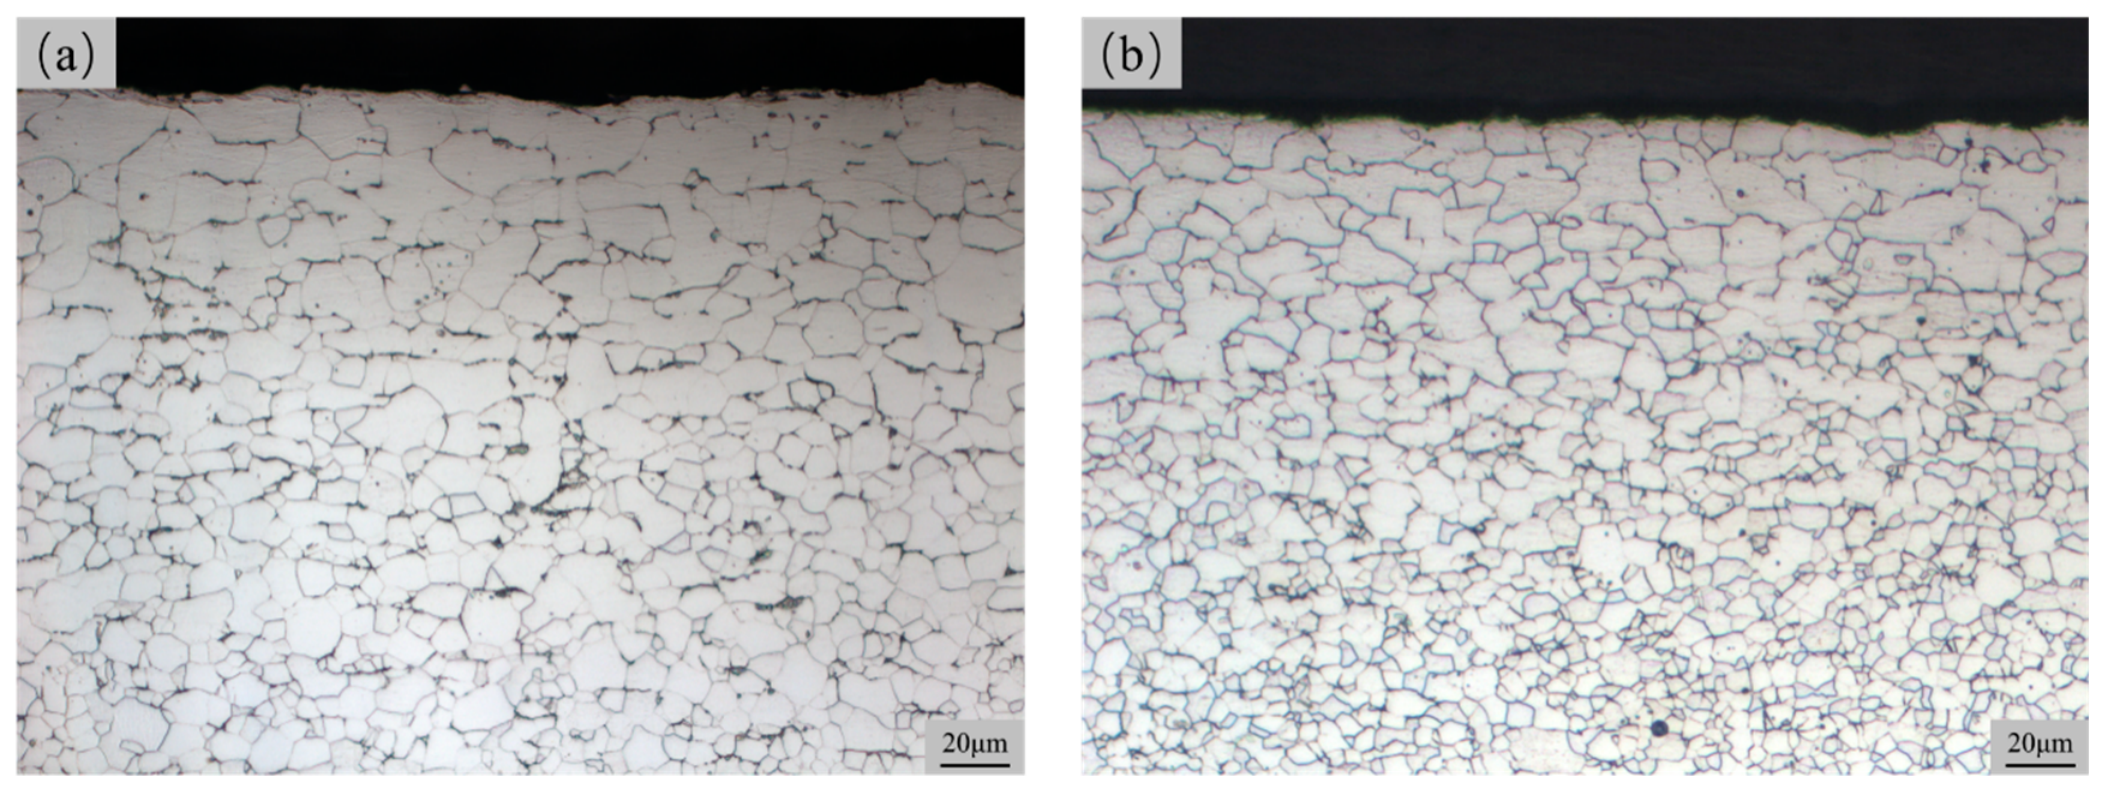
Figure 20 illustrates the metallographic organization of the surface interface of the samples prior to and following laser cleaning. It can be observed that the metallographic structure of the material did not change before and after laser cleaning; both consist of ferrite. However, the grain size was observed to have undergone a process of refinement following the application of the laser cleaning technique. It is possible that the laser cleaning process may induce recrystallization within the lattice, resulting in the original, larger grains being refined into smaller ones. This phenomenon can be attributed to the elevated temperatures and thermal stresses generated by the laser on the surface of the sample, which facilitate lattice rearrangement and grain reorganization, ultimately leading to the formation of smaller grains.
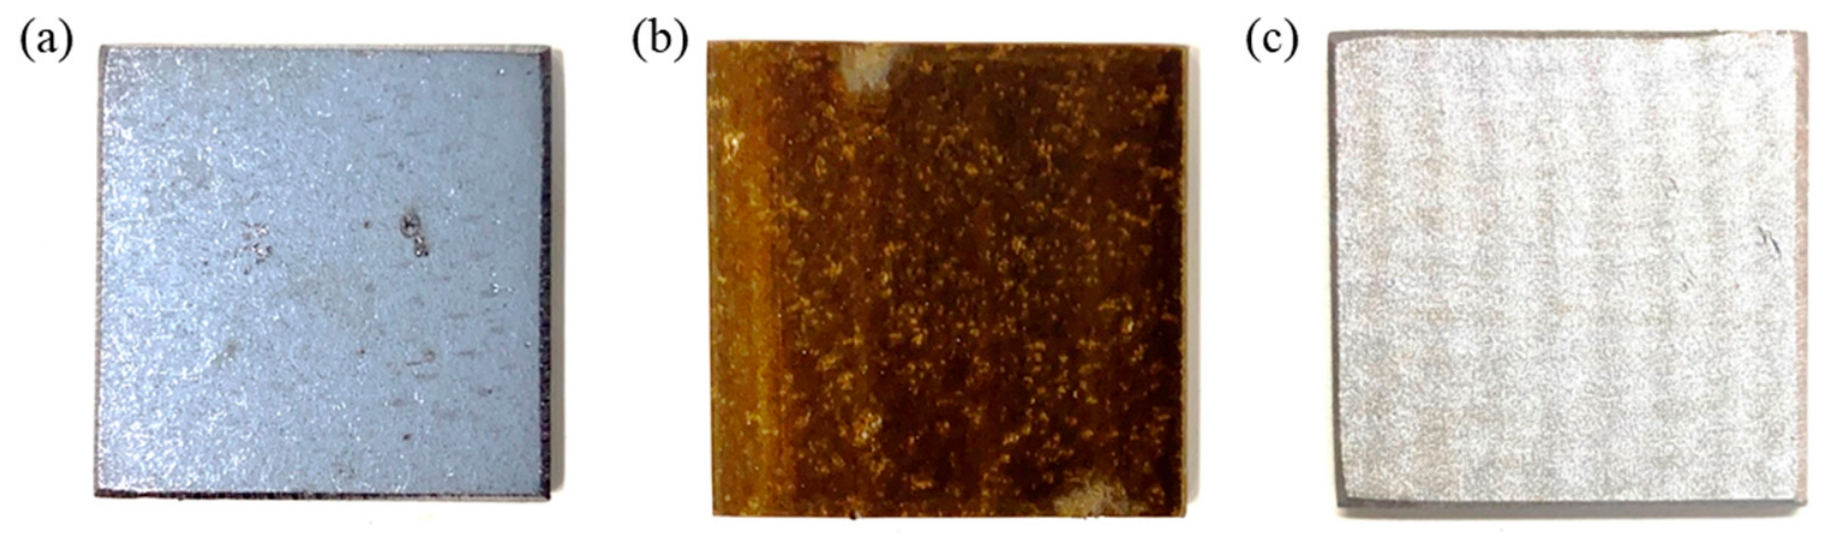
As shown in Figure 21, the surface of the uncleaned sample is covered by a dense hot-rolled oxide layer, which appears to be dark gray in color. Following the initial laser cleaning procedure, the surface of the sample underwent a transformation, acquiring a brownish hue due to the excessive ablation caused by the laser. Additionally, the initial laser cleaning procedure resulted in a notable reduction in the thickness of the hot-rolled oxide layer. Given the inherent unevenness in the thickness of the surface oxide layer, some local areas of the sample have revealed the substrate’s color. With the second step of laser cleaning, the oxide layer on the sample surface was entirely eliminated, thereby imparting a brilliant silver-white aspect to the underlying metallic material. Due to potential discrepancies in flatness between the upper and lower surfaces of the original sample, a faint ‘ripple’ pattern can be discerned on the macroscopic surface of the sample following laser scanning.

4.3. Identification of Thermal Vibration Effects

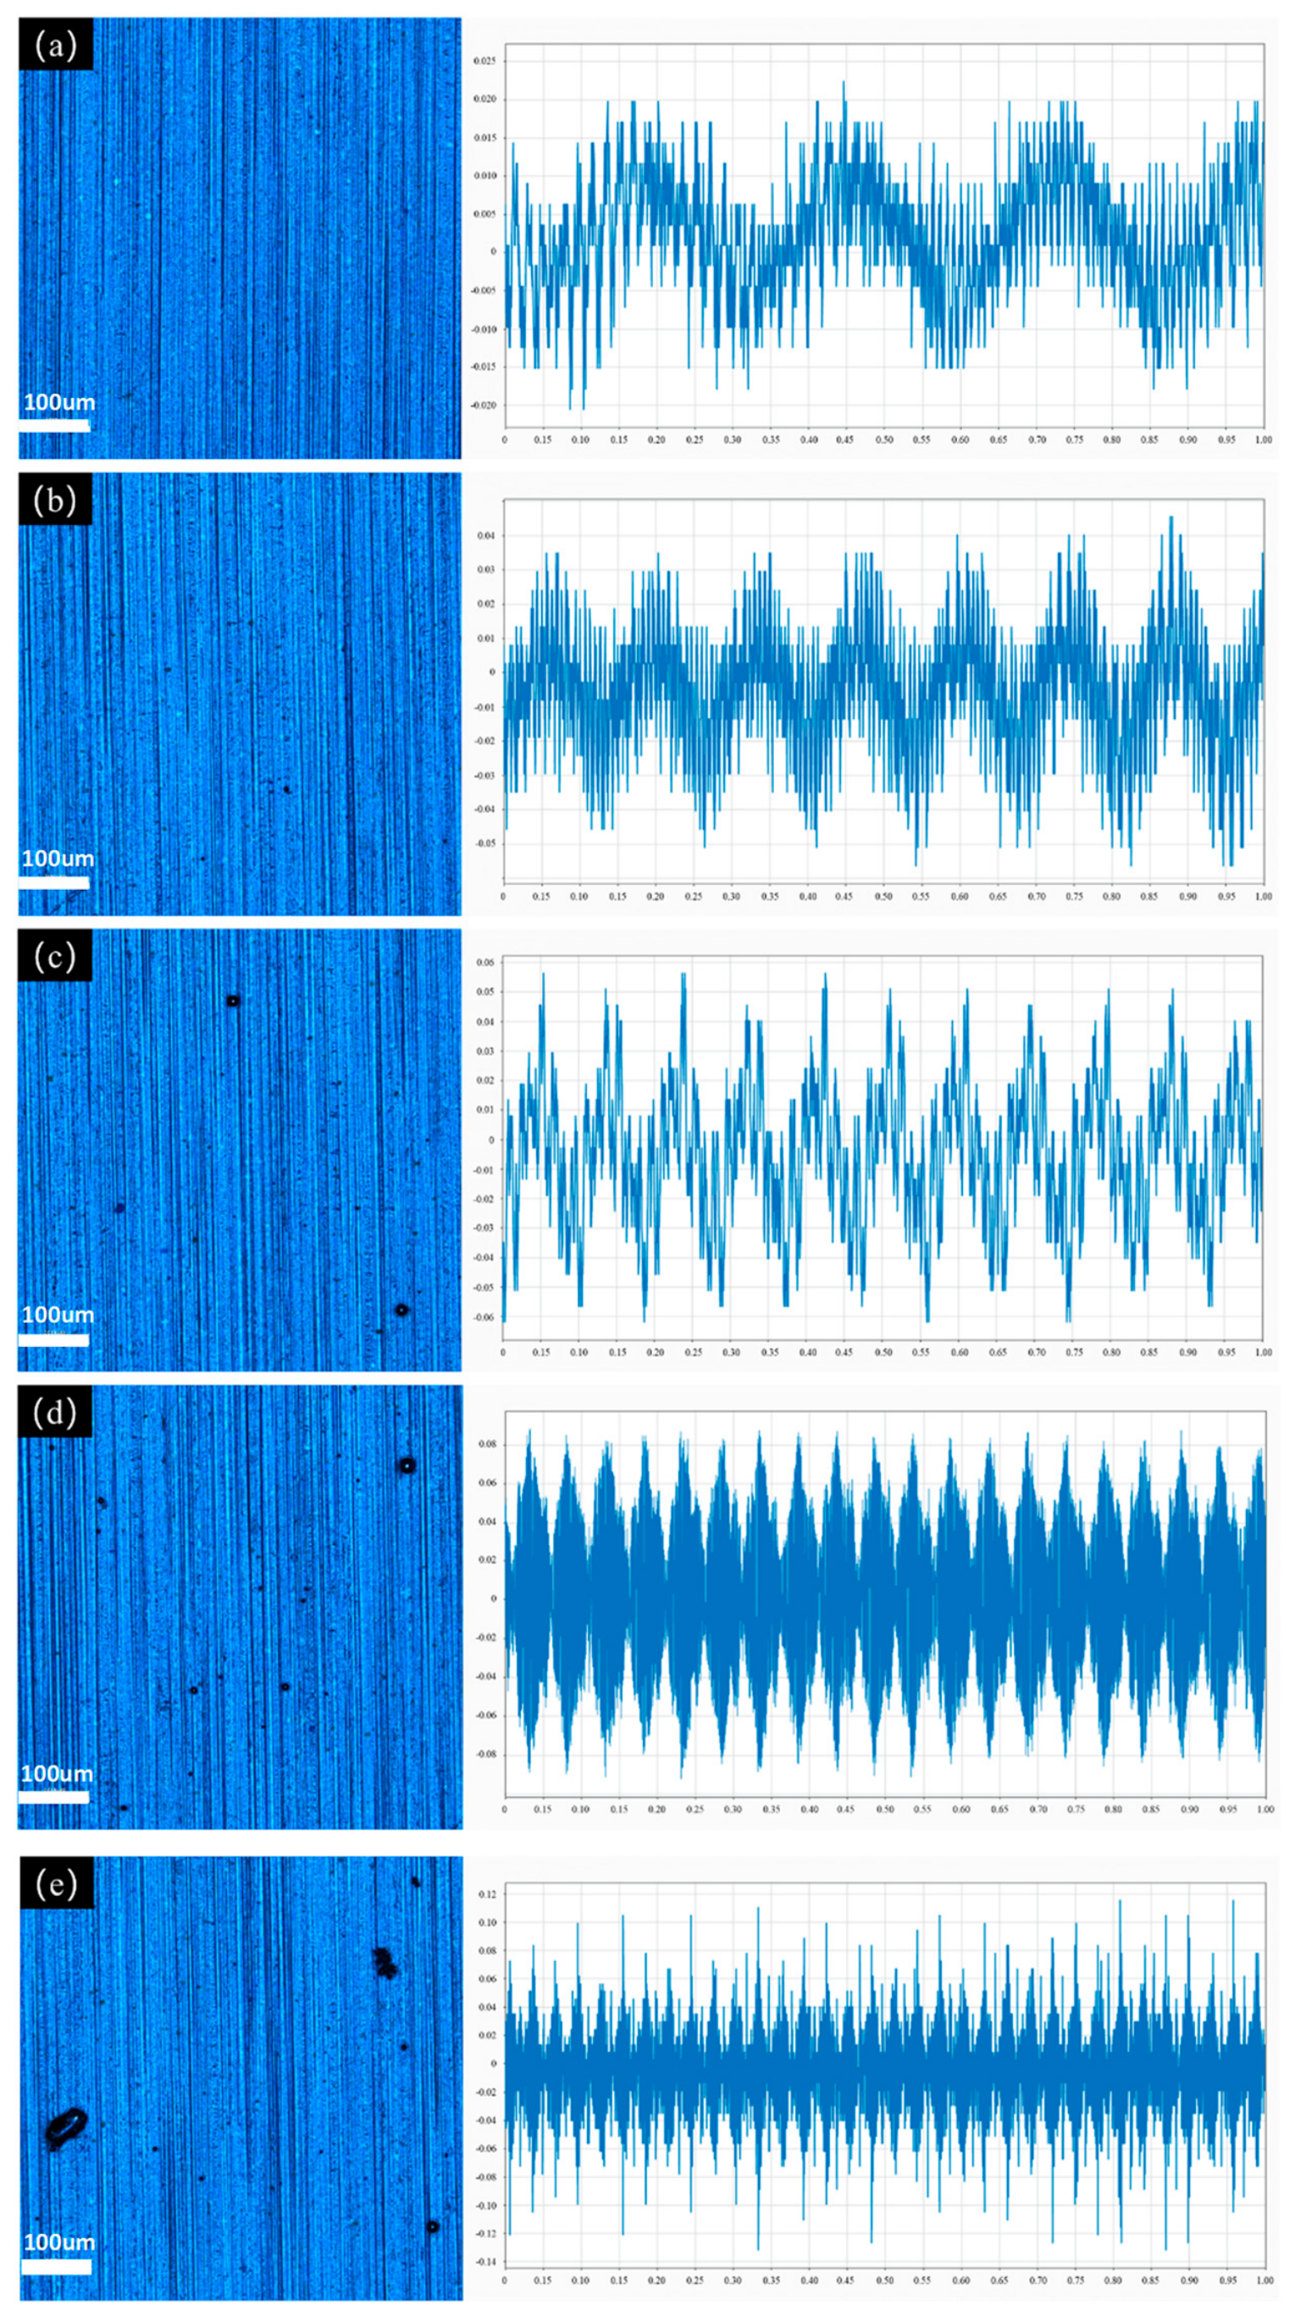
Figure 22 illustrates the particle products on the surface of the aluminum alloy sheet under varying laser pulse frequencies, accompanied by the vibration signals gathered from the sample surface. The left-hand image within each panel set (Figure 22a–e) is a micrograph characterized by a distinct deep blue coloration. It reveals surface morphology featuring prominent linear striations or banded patterns running across the field of view. The presence of black spots or particles is noted within several of these micrographs. A scale bar included in each image indicates the magnification level, showing the features are observed at the micron scale. These images visually depict the characteristics of surface products or deposits, referred to as “sputtering products”. The right-hand image in each panel set (Figure 22a–e) presents a time-domain waveform signal plotted on a white background with distinct blue tracing lines. These graphs feature clearly labeled axes with numeric values indicating specific units of measurement for both the horizontal (time or a related quantity) and vertical (amplitude or intensity) dimensions. The blue lines display fluctuating patterns, varying in shape, amplitude, and frequency between the different panels (Figure 22a–e). These plots visualize “vibration signals” associated with the conditions listed for each set.
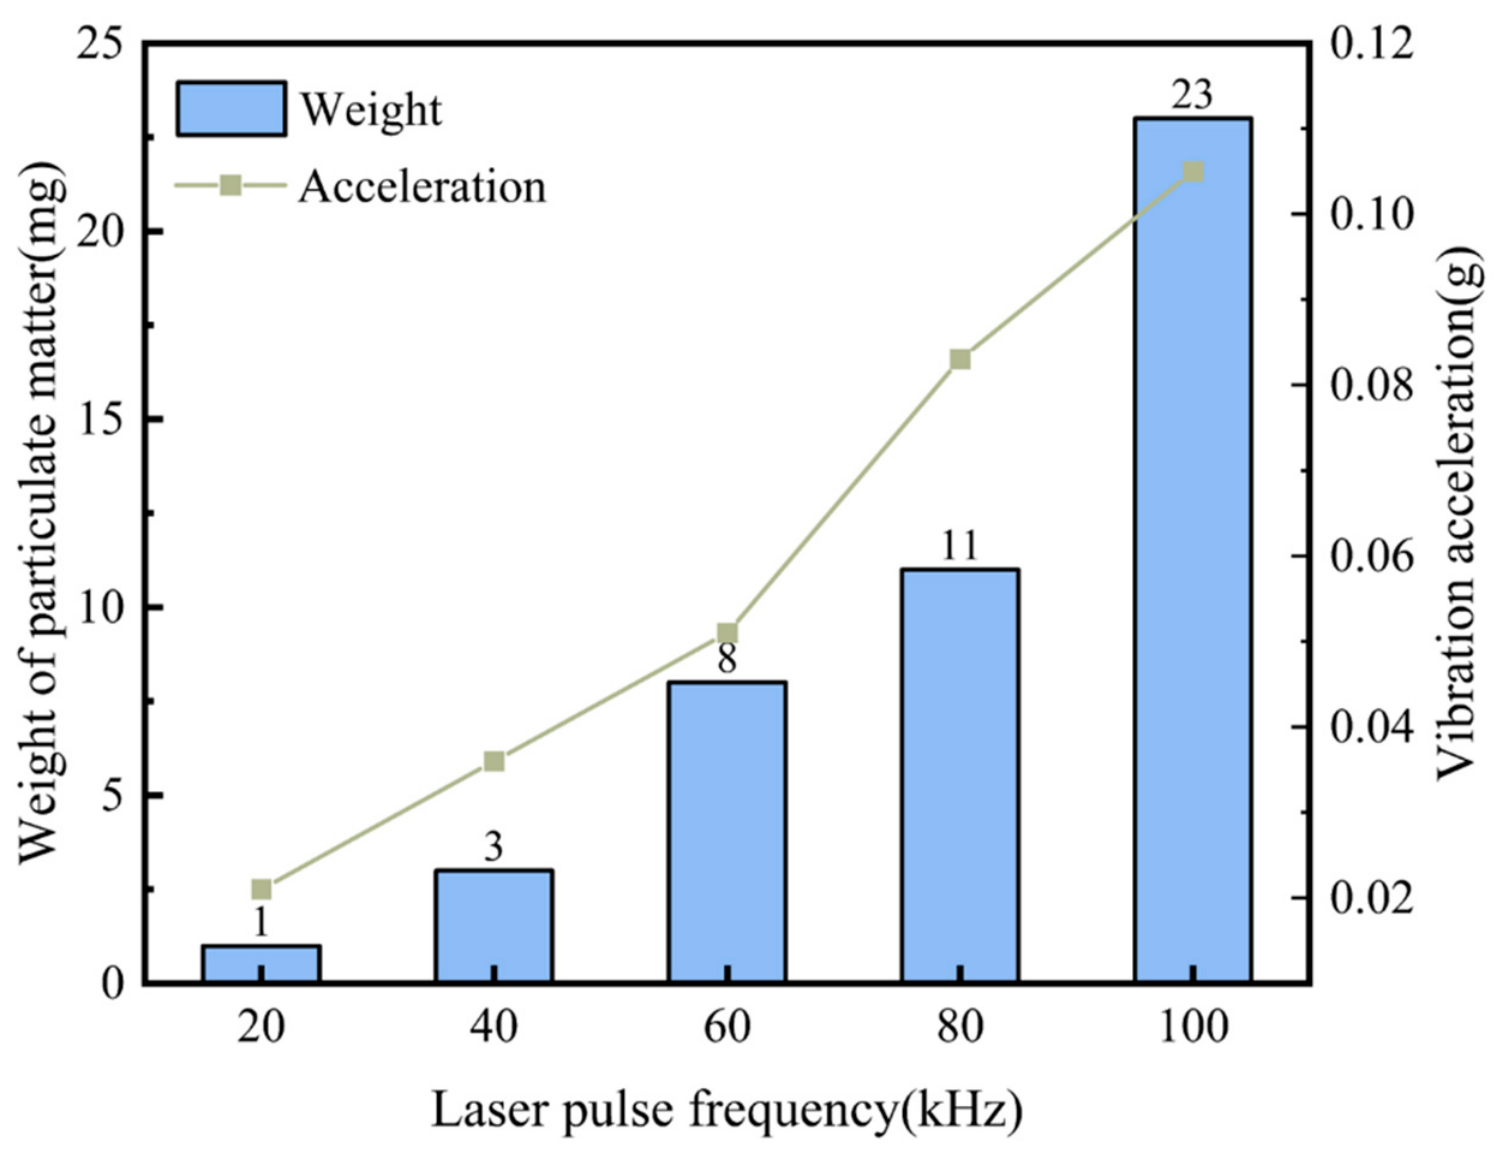
Additionally, Figure 23 presents the mass of the sputtered products following data processing and the vibration acceleration amplitude of the sample. From these two figures, it can be observed that when the pulse frequency is 20 kHz, there is a notable absence of laser cleaning products collected on the surface of the gasket, and the peak value of the sample’s vibration acceleration is approximately 0.02 g. Upon increasing the pulse frequency to 40 kHz, the presence of small particles on the gasket surface becomes discernible, and the peak value of the vibration acceleration rises to 0.04 g. As the pulse frequency is increased to 60 kHz, in addition to the small particles, larger sputtered products are also observed, with the vibration acceleration peak value reaching approximately 0.51 g. Further increasing the pulse frequency to 80 kHz and 100 kHz results in sputtered products growing to several tens of micrometers, and their quantity further increases, while the peak values of the vibration acceleration rise to 0.083 g and 0.105 g, respectively.
Overall, the mass of the sputtered particles produced by laser cleaning and the vibration acceleration of the samples both increase in proportion to the rise in laser pulse frequency. Consequently, the thermal vibration effect produced by laser cleaning is also amplified with an increase in pulse frequency. In accordance with the laser cleaning mechanism elucidated in Section 2.2, the contaminants eliminated by the ablation effect during the laser cleaning process are vaporized and evaporated into the air. In light of the substantial thinning of the oxide layer observed in the initial stage of laser cleaning (Section 2.3), it can be posited that at a pulse frequency of 20 kHz, where minimal cleaning products are collected, the primary mechanism at play in the initial stage of laser cleaning is the ablation effect.
Furthermore, the findings of the second phase of laser cleaning suggest that the cleaning efficacy is enhanced at the pulse frequency of 60 kHz, where approximately 8 mg of cleaning products can be collected. This is in comparison to the mass of cleaning products collected at 80 kHz and 100 kHz, which is less than the aforementioned amount. However, the actual experimental results demonstrate that a considerable quantity of oxide residue persists following the cleaning process at these two pulse frequencies. This suggests that the removal mechanisms in the second step of laser cleaning involve both the ablation effect and the thermal vibration effect. Nevertheless, further investigation is required to ascertain which effect is predominant under different process parameters.
Although the optimized parameters noticeably suppress severe surface overheating, the SEM and optical microscopy results still suggest that process-induced thermal effects may remain on the cleaned steel surface. Residual stress evolution and possible implications for fatigue performance were not directly measured in the present work. These aspects will therefore be included in future work through residual-stress characterization and mechanical-property evaluation to further verify the functional integrity of the cleaned substrate.


5. Conclusions

This study builds upon the results of single-parameter laser cleaning experiments for oxide-scale removal, proposing a multi-parameter, two-pass distributed laser cleaning scheme. It systematically analyzes the influence of key process parameters—laser pulse frequency, energy density, scanning speed, and overlap ratio—on the cleaning efficiency and surface quality of hot-rolled steel oxide scales. By conducting a series of experiments, optimal process parameters were identified, and the cleaned samples were characterized and analyzed. Vibrational signals and the mass of laser-induced spatter were studied to elucidate the laser cleaning mechanism. The key findings of this research are summarized as follows:
(1) In single-factor multi-pass cleaning experiments, the focus was on studying the influence of changes in laser energy density and the number of scans on oxide-scale cleaning. The analysis of the experimental results revealed that under high-energy laser beams, a large number of droplet-like resolidified materials appeared on the sample surface, and increasing the number of scans could not effectively reduce the presence of these resolidified materials. Reducing the laser energy density significantly improved the re-solidification phenomenon on the sample surface. However, increasing the number of scans under this condition made the re-solidification phenomenon even more pronounced.
(2) After a series of experiments, the optimal process parameter combination was determined to be 20 kHz at 200 mm·s−1 and 60 kHz at 40,000 mm·s−1. Under this combination, effective removal of hot-rolled oxide scales could be achieved while maintaining high cleaning efficiency and producing surfaces with good quality and low roughness. By observing the metallographic morphology of the sample surface interface, it was found that the grains after laser cleaning underwent lattice rearrangement and grain refinement due to the high temperatures and thermal stresses generated by the laser, thereby enhancing the surface strength of the samples.
(3) Analysis of the vibration signals collected from the sample surface, the mass of splattered products, and the vibration acceleration amplitude of the sample revealed that in this experiment, the thermal vibration effect induced by laser cleaning intensified with increasing laser pulse frequency. Both the mass of splattered products and the vibration acceleration of the sample increased as the laser pulse frequency rose. In the two-pass distributed cleaning process with variable parameters, the primary mechanism for the first step of laser cleaning was ablation. The mechanism for the second step was determined by the coupling effect of ablation and thermal vibration. However, further in-depth studies are required to determine which effect is dominant.

Author Contributions

Conceptualization, H.Z.; Methodology, H.Z.; Software, H.Z.; Validation, H.Z.; Formal analysis, Y.H.; Investigation, Y.H. and G.J.; Resources, Y.H.; Data curation, Y.H. and Z.G.; Writing—original draft, H.Z. and Z.G.; Writing—review & editing, H.Z.; Visualization, G.J.; Supervision, G.J.; Project administration, Y.F.; Funding acquisition, Y.F. All authors have read and agreed to the published version of the manuscript.

Funding

The Natural Science Foundation of The Jiangsu Higher Education Institutions of China (Grant No.24KJB460009); Zhenjiang key laboratory of Advanced Manufacturing of Aerospace Components (SS2023009); Changzhou Industrial Innovation Science and Technology Support Special Project (CS20252010).

Data Availability Statement

The data presented in this study are not publicly available due to the inclusion of sensitive commercial information. The data may be available from the corresponding author upon reasonable request, subject to a confidentiality agreement and with permission of the relevant institution.

Conflicts of Interest

The authors declare no conflicts of interest.

References

  1. Zhang, Y.; Wang, W.; Li, Z.; Shu, S.; Lang, X.; Zhang, T.; Dong, J. Development of a cross-scale weighted feature fusion network for hot-rolled steel surface defect detection. Eng. Appl. Artif. Intell. 2023, 117, 105628. [Google Scholar] [CrossRef]
  2. Zhang, Q.; Wang, Y. Research on mechanical property prediction of hot rolled steel based on lightweight multi-branch convolutional neural network. Mater. Today Commun. 2023, 37, 107445. [Google Scholar] [CrossRef]
  3. Cui, C.; Cao, G.; Cao, Y.; Liu, J.; Dong, Z.; Wu, S.; Liu, Z. Physical metallurgy guided deep learning for yield strength of hot-rolled steel based on the small labeled dataset. Mater. Des. 2022, 223, 111269. [Google Scholar] [CrossRef]
  4. Cheng, X.; Jiang, Z.; Wei, D.; Hao, L.; Zhao, J.; Jiang, L. Oxide scale characterization of ferritic stainless steel and its deformation and friction in hot rolling. Tribol. Int. 2015, 84, 61–70. [Google Scholar] [CrossRef]
  5. Li, X.; Guan, Y. Real-time monitoring of laser cleaning for hot-rolled stainless steel by laser-induced breakdown spectroscopy. Metals 2021, 11, 790. [Google Scholar] [CrossRef]
  6. Huang, L.Y.; Chen, Z.S. Effect of technological parameters on hydrodynamic performance of ultra-high-pressure water-jet nozzle. Appl. Ocean Res. 2022, 129, 103410. [Google Scholar] [CrossRef]
  7. Li, Y.; Wang, K.; Sun, R.; Liu, R.; Tian, Y.; Cai, S.; Song, L. Analysis of surface blackening defects on hot-rolled pickled steel. J. Phys. Conf. Ser. 2022, 2348, 012004. [Google Scholar] [CrossRef]
  8. Horodek, P.; Eseev, M.K.; Kobets, A.G. Studies of stainless steel exposed to sandblasting. Nukleonika 2015, 60, 721–724. [Google Scholar] [CrossRef]
  9. Zhu, G.; Xu, Z.; Jin, Y.; Chen, X.; Yang, L.; Xu, J.; Shan, D.; Chen, Y.; Guo, B. Mechanism and application of laser cleaning: A review. Opt. Lasers Eng. 2022, 157, 107130. [Google Scholar] [CrossRef]
  10. Zhu, G.; Wang, S.; Cheng, W.; Ren, Y.; Wen, D. Corrosion and wear performance of aircraft skin after laser cleaning. Opt. Laser Technol. 2020, 132, 106475. [Google Scholar] [CrossRef]
  11. Wang, Z.; Zhang, L.; Xie, N.; Jiang, J.; He, J.; He, C.; Han, J.; Zhu, J. Mechanism and parametric control of laser-layered paint removal for aircraft skin. Opt. Laser Technol. 2023, 165, 109612. [Google Scholar] [CrossRef]
  12. Tian, Z.; Lei, Z.; Chen, X.; Chen, Y. Evaluation of laser cleaning for defouling of marine biofilm contamination on aluminum alloys. Appl. Surf. Sci. 2020, 499, 144060. [Google Scholar] [CrossRef]
  13. Lu, Y.; Ding, Y.; Wang, M.; Yang, L.; Wang, Y. An environmentally friendly laser cleaning method to remove oceanic micro-biofoulings from AH36 steel substrate and corrosion protection. J. Clean. Prod. 2021, 314, 127961. [Google Scholar] [CrossRef]
  14. AlShaer, A.W.; Li, L.; Mistry, A. The effects of short pulse laser surface cleaning on porosity formation and reduction in laser welding of aluminium alloy for automotive component manufacture. Opt. Laser Technol. 2014, 64, 162–171. [Google Scholar] [CrossRef]
  15. Guan, Y.C.; Ng, G.K.L.; Zheng, H.Y.; Hong, M.H.; Hong, X.; Zhang, Z. Laser surface cleaning of carbonaceous deposits on diesel engine piston. Appl. Surf. Sci. 2013, 270, 526–530. [Google Scholar] [CrossRef]
  16. Ding, K.; Zhou, K.; Feng, G.; Han, J.; Xie, N.; Huang, Z.; Zhou, G. Mechanism and conditions for laser cleaning of micro and nanoparticles on the surface of transparent substrate. Vacuum 2022, 200, 110987. [Google Scholar] [CrossRef]
  17. Zhang, S.; Yan, Q.; Lin, J.; Zhang, Q.; Lu, Y.; Yao, J.; Fan, L. Elimination of blind zone in nanoparticle removal on silicon wafers using a double-beam laser shockwave cleaning process. Appl. Surf. Sci. 2021, 539, 148057. [Google Scholar] [CrossRef]
  18. Maingi, E.M.; Alonso, M.P.; de la Fuente, G.F.; Dubernet, S.; Lefrais, Y.; Chapoulie, R.; Vally, E.; Angurel, L.A. UV femtosecond laser cleaning of encrusted historical stained-glasses. J. Cult. Herit. 2023, 61, 100–108. [Google Scholar] [CrossRef]
  19. Bian, T.; Bai, Y.; Yu, L.; Xu, Z. Laser cleaning of paint layers on white marble surface based on cooperative use of laser-induced breakdown spectroscopy and image binarization. J. Cult. Herit. 2023, 62, 124–133. [Google Scholar] [CrossRef]
  20. Ye, Y.; Qi, Y.; Yuan, X.; Xiang, X.; Wang, H.; Zhou, W.; Cheng, X.; Luan, X.; Zhang, R. Laser cleaning of contamination on sandstone surfaces in Yungang Grottoes. Optik 2014, 125, 3093–3097. [Google Scholar] [CrossRef]
  21. Yoo, H.J.; Baek, S.; Kim, J.H.; Choi, J.; Kim, Y.-J.; Park, C. Effect of laser surface cleaning of corroded 304L stainless steel on microstructure and mechanical properties. J. Mater. Res. Technol. 2022, 16, 373–385. [Google Scholar] [CrossRef]
  22. Zhang, Y.; Yao, Q.; Long, W.; Wang, C.; Lin, J.; Liu, Z. Welding Defect and Mechanical Properties of Nanosecond Laser Cleaning 6005A Aluminum Alloy. Materials 2022, 15, 7841. [Google Scholar] [CrossRef] [PubMed]
  23. Wang, Q.; Kainuma, S.; Zhuang, S.; Shimizu, K.; Haraguchi, M. Laser cleaning on severely corroded steel members: Engineering attempt and cleanliness assessment. J. Clean. Prod. 2022, 376, 134224. [Google Scholar] [CrossRef]
  24. Guo, L.; Li, Y.; Geng, S.; Wang, C.; Jiang, P. Numerical and experimental analysis for morphology evolution of 6061 aluminum alloy during nanosecond pulsed laser cleaning. Surf. Coat. Technol. 2022, 432, 128056. [Google Scholar] [CrossRef]
  25. Li, Z.; Zhang, D.; Su, X.; Yang, S.; Xu, J.; Ma, R.; Shan, D.; Guo, B. Removal mechanism of surface cleaning on TA15 titanium alloy using nanosecond pulsed laser. Opt. Laser Technol. 2021, 139, 106998. [Google Scholar] [CrossRef]
  26. Liu, Y.; Liu, W.; Zhang, D.; Tian, Z.; Sun, X.; Wei, Z. Experimental investigations into cleaning mechanism of ship shell plant surface involved in dry laser cleaning by controlling laser power. Appl. Phys. A 2020, 126, 866. [Google Scholar] [CrossRef]
  27. Sun, B.; Xu, C.; He, J.; Lu, L.; Zhang, Y. Cleanliness prediction of rusty iron in laser cleaning using convolutional neural networks. Appl. Phys. A 2020, 126, 179. [Google Scholar] [CrossRef]
  28. Lu, Y.F.; Takai, M.; Komuro, S.; Shiokawa, T.; Aoyagi, Y. Surface cleaning of metals by pulsed-laser irradiation in air. Appl. Phys. A 1994, 59, 281–288. [Google Scholar] [CrossRef]
  29. Yue, L.; Wang, Z.; Li, L. Multiphysics modelling and simulation of dry laser cleaning of micro-slots with particle contaminants. Phys. D Appl. Phys. 2012, 45, 135401. [Google Scholar] [CrossRef]
  30. Belli, R.; Miotello, A.; Mosaner, P.; Toniutti, L. Laser cleaning of artificially aged textiles. Appl. Phys. A 2006, 83, 651–655. [Google Scholar] [CrossRef]
  31. Li, X.; Wang, D.; Gao, J.; Zhang, W.; Li, C.; Wang, N.; Lei, Y. Influence of ns-Laser Cleaning Parameters on the Removal of the Painted Layer and Selected Properties of the Base Metal. Materials 2020, 13, 5363. [Google Scholar] [CrossRef] [PubMed]
  32. Meja, P.; Autric, M.; Alloncle, P.; Pasquet, P.; Oltra, R.; Boquillon, J.P. Laser cleaning of oxidized iron samples: The influence of wavelength and environment. Appl. Phys. A 1999, 69, S687–S690. [Google Scholar] [CrossRef]
  33. Zhang, G.; Hua, X.; Li, F.; Zhang, Y.; Shen, C.; Cheng, J. Effect of laser cleaning process parameters on the surface roughness of 5754-grade aluminum alloy. Adv. Manuf. Technol. 2019, 105, 2481–2490. [Google Scholar] [CrossRef]
Figure 1. Different mechanisms of laser dry cleaning [9].
Photonics 13 00642 g001
Figure 2. (a) Single-factor low-frequency and high-energy cleaning; (b) single-factor high-frequency and fast-scan cleaning; (c) stepwise laser cleaning.
Photonics 13 00642 g002
Figure 3. (a) Original surface; (b) sectional drawing.
Photonics 13 00642 g003
Figure 4. Surface energy spectrum of the original sample.
Photonics 13 00642 g004
Figure 5. (a) Schematic diagram of laser cleaning system; (b) laser scanning path.
Photonics 13 00642 g005
Figure 6. Surface morphology after multiple laser cleaning passes under different energy densities (a) 50.9 J/cm2 & single, (b) 50.9 J/cm2 & three times, (c) 50.9 J/cm2 & five times, (d) 25.5 J/cm2 & single, (e) 25.5 J/cm2 & three times, (f) 25.5 J/cm2 & five times, (g) 17.0 J/cm2 & single, (h) 17.0 J/cm2 & three times, (i) 17.0 J/cm2 & five times.
Photonics 13 00642 g006
Figure 7. Oxygen element proportion after multiple laser cleaning under different energy densities.
Photonics 13 00642 g007
Figure 8. The optical mirror image of the substrate surface after the first laser cleaning (a) 50.9 J/cm2 & U: 80%, (b) 50.9 J/cm2 & U: 60%, (c) 50.9 J/cm2 & U: 40%, (d) 25.5 J/cm2 & U: 80%, (e) 25.5 J/cm2 & U: 60%, (f) 25.5 J/cm2 & U: 40%, (g) 17.0 J/cm2 & U: 80%, (h) 17.0 J/cm2 & U: 60%, (i) 17.0 J/cm2 & U: 40%.
Photonics 13 00642 g008
Figure 9. The microstructure of the substrate surface after the first step of laser cleaning (a) 50.9 J/cm2 & U: 80%, (b) 50.9 J/cm2 & U: 60%, (c) 50.9 J/cm2 & U: 40%, (d) 25.5 J/cm2 & U: 80%, (e) 25.5 J/cm2 & U: 60%, (f) 25.5 J/cm2 & U: 40%, (g) 17.0 J/cm2 & U: 80%, (h) 17.0 J/cm2 & U: 60%, (i) 17.0 J/cm2 & U: 40%.
Photonics 13 00642 g009
Figure 10. The 3D morphology of the substrate surface after the first step of laser cleaning (a) 50.9 J/cm2 & U: 80%, (b) 50.9 J/cm2 & U: 60%, (c) 50.9 J/cm2 & U: 40%, (d) 25.5 J/cm2 & U: 80%, (e) 25.5 J/cm2 & U: 60%, (f) 25.5 J/cm2 & U: 40%, (g) 17.0 J/cm2 & U: 80%, (h) 17.0 J/cm2 & U: 60%, (i) 17.0 J/cm2 & U: 40%.
Photonics 13 00642 g010
Figure 11. The roughness Sz of the matrix surface after laser cleaning in the second step.
Photonics 13 00642 g011
Figure 12. Measurement method for laser cleaning thinning amount.
Photonics 13 00642 g012
Figure 13. The thinning amount of laser cleaning under different process parameters.
Photonics 13 00642 g013
Figure 14. Microscopic morphology of the substrate surface after laser cleaning in the second step. (a) 17.0 J/cm2 & 3000 mm/s, (b)17.0 J/cm2 & 4000 mm/s, (c) 17.0 J/cm2 & 5000 mm/s, (d) 12.7 J/cm2 & 3000 mm/s, (e) 12.7 J/cm2 & 4000 mm/s, (f) 12.7 J/cm2 & 5000 mm/s, (g) 10.2 J/cm2 & 3000 mm/s, (h) 10.2 J/cm2 & 4000 mm/s, (i) 10.2 J/cm2 & 5000 mm/s.
Photonics 13 00642 g014
Figure 15. Deep focal microscopy image of the substrate surface after laser cleaning in the second step. (a) 17.0 J/cm2 & 3000 mm/s, (b) 17.0 J/cm2 & 4000 mm/s, (c) 17.0 J/cm2 & 5000 mm/s, (d) 12.7 J/cm2 & 3000 mm/s, (e) 12.7 J/cm2 & 4000 mm/s, (f) 12.7 J/cm2 & 5000 mm/s, (g) 10.2 J/cm2 & 3000 mm/s, (h) 10.2 J/cm2 & 4000 mm/s, (i) 10.2 J/cm2 & 5000 mm/s.
Photonics 13 00642 g015
Figure 16. The 3D morphology of the substrate surface after the second step of laser cleaning. (a) 17.0 J/cm2 & 3000 mm/s, (b) 17.0 J/cm2 & 4000 mm/s, (c) 17.0 J/cm2 & 5000 mm/s, (d) 12.7 J/cm2 & 3000 mm/s, (e) 12.7 J/cm2 & 4000 mm/s, (f) 12.7 J/cm2 & 5000 mm/s, (g) 10.2 J/cm2 & 3000 mm/s, (h) 10.2 J/cm2 & 4000 mm/s, (i) 10.2 J/cm2 & 5000 mm/s.
Photonics 13 00642 g016
Figure 17. The roughness variation in the matrix surface after laser cleaning in the second step.
Photonics 13 00642 g017
Figure 18. The content of oxygen elements on the surface of the sample after laser cleaning in the second step.
Photonics 13 00642 g018
Figure 19. X-ray diffraction pattern (a) before laser cleaning; (b) after laser cleaning.
Photonics 13 00642 g019
Figure 20. Metallographic structure topography (a) before laser cleaning; (b) after laser cleaning.
Photonics 13 00642 g020
Figure 21. The macroscopic morphology of the sample surface: (a) the uncleaned surface; (b) the surface after the first step of laser cleaning; (c) the surface after laser cleaning in the second step.
Photonics 13 00642 g021
Figure 22. Sputtering products and vibration signals at different pulse frequencies. (a) 20 kHz; (b) 40 kHz; (c) 60 kHz; (d) 80 kHz; (e) 100 kHz.
Photonics 13 00642 g022
Figure 23. Particle mass and sample vibration acceleration at different pulse frequencies.
Photonics 13 00642 g023
Table 1. Chemical composition of carbon structural steel (wt.%).
ElementCMnSPFe
Content0.14~0.220.3~0.65≤0.05≤0.045Balance
Table 2. Main technical parameters of laser.
ParametersValue
Wavelength λ/(nm)1064
Power P/(W)≤20
Pulse width τ/(ns)100
Frequency f/(kHz)20~200
Scan speed v/(mm·s−1)≤10,000
Spot shapeCircle
Spot diameter D/(μm)50
Table 3. Single-factor cleaning experiment parameters.
f/kHzv/mm·s−1F/J·cm−2
2040050.9
4080025.5
60120017.0
Table 4. The first-step laser cleaning experimental parameters.
NO.f/kHzv/mm·s−1F/J·cm−2Ux/y%
12020050.980
22040050.960
32060050.940
44040025.580
54080025.560
640120025.540
76060017.080
860120017.060
960180017.040
Table 5. The second-step laser cleaning experiment parameters.
NO.f/kHzv/mm·s−1F/J·cm−2
160300017.0
260400017.0
360500017.0
480300012.7
580400012.7
680500012.7
7100300010.2
8100400010.2
9100500010.2
Disclaimer/Publisher’s Note: The statements, opinions and data contained in all publications are solely those of the individual author(s) and contributor(s) and not of MDPI and/or the editor(s). MDPI and/or the editor(s) disclaim responsibility for any injury to people or property resulting from any ideas, methods, instructions or products referred to in the content.