1. Introduction
OCM, as a variant of OCT, is increasingly critical for biomedical applications demanding cellular-level detail, such as in ophthalmology [
1,
2] and dermatology [
3,
4]. Achieving the required 2–3 µm lateral resolution typically calls for high-NA sample optics [
5], which is why MOs have become the prevailing choice in OCM system design [
5,
6,
7]. The integration of MOs has been foundational to the success of OCM, enabling many of the seminal demonstrations of cellular-level imaging. Their multi-element constructions correct spherical aberration, coma, and field curvature over useful fields, and they have enabled many landmark demonstrations—e.g., Olympus 10× objective for corneal nerve imaging [
8,
9,
10,
11], for material characterization [
12] and 20× objective for industrial inspection [
13], Nikon series 50× objective for corneal imaging [
14], Nikon 20× objective for biomedical tissue imaging [
15], Nikon CFI Plan Fluor for textile assessment [
16,
17], and Mitutoyo NIR series in recent corneal nerve studies [
18,
19,
20,
21] as well as cell imaging studies [
22].
However, this high level of optical correction is typically achieved using a more complex optical structure. To achieve such high-performance aberration control, even these premier NIR-optimized objectives must employ significant volumes of glass and numerous optical interfaces. While this complex multi-element structure supports strong aberration correction, it can also lead to lower total optical throughput. Even with high-quality anti-reflection coatings, the cumulative transmission loss through multiple elements limits the photon collection efficiency [
23]. In high-speed OCM applications, where acquisition rates approach the MHz regime [
24] and exposure times are minimal, this reduction in photon collection efficiency becomes a critical constraint on system sensitivity.
In this study, we investigate the feasibility of utilizing a cost-effective, aspherized achromatic lens as the primary imaging element in OCM systems. We demonstrate that this lens achieves the high spatial resolution required for OCM while providing superior optical throughput compared to standard MOs. Specifically, we evaluate two configurations: FF-TD-OCM and LF-SD-OCM. Both systems feature a lateral resolution of approximately 2 µm and benefit from a 2–3 dB improvement in transmission efficiency over “gold standard” MO-based setups. We validate the imaging performance using both biological and non-biological samples, resolving cellular-level structures in both axial and lateral dimensions. Finally, these results are compared against images acquired with standard MOs to demonstrate comparable, and in some cases superior, image quality.
2. Materials and Methods
2.1. Imaging Lenses Selection
The primary aim of this study is to explore practical alternatives to microscope objectives in broadband OCM systems by separating lens selection from system validation: candidate lenses were first screened by simulation, and the selected design was then tested experimentally. The design process was driven by the practical requirements for in vivo cellular-level imaging (e.g., cornea imaging), which dictates several key design trade-offs. The primary requirement was achieving a target lateral resolution in the 2–3 µm range. For in vivo applications, this goal must be balanced with the need for a safe working distance (ideally >20 mm) and a sufficient depth of focus to maintain image quality during minor patient motion. Furthermore, a preference for system compactness favored shorter focal length optics that fit standard 1′′ mounts.
To satisfy the 2–3 µm lateral resolution target with a source wavelength of ~840 nm, the imaging optics require a numerical aperture (NA) in the range of 0.17 to 0.25. Based on the compactness and working distance requirements, a focal length of 20–30 mm was identified as the optimal range. The resolution target also dictates the sampling requirements for the detection path. Analogous to the Nyquist-Shannon sampling theorem, reliably resolving a 2 µm feature requires an effective pixel size at the sample plane of less than 1.0 µm. The selected camera (FLIR BFS-U3-17S7M-C, Edmund Optics Inc., Barrington, NJ, USA) has a 9 µm pixel size, necessitating a system magnification greater than 9× to achieve this sampling. A ~10× magnification was therefore targeted, which can be implemented by pairing a common 200–300 mm tube lens with the selected 20–30 mm focal length imaging lens. This configuration results in an effective pixel size of ~0.9 µm, fulfilling the Nyquist criterion. Additionally, considering the 1100-pixel dimension of the camera, this magnification yields a lateral field of view (FOV) of approximately 0.99 mm.
Rather than pursuing a custom lens design which would increase the cost and complexity of the system, we focused on identifying a suitable lens from commercially available lenses. The lenses used in commercial OCT systems are typically telecentric scan lenses, which minimise scan-angle-dependent magnification (fan-beam distortion) and provide good aberration correction over a wide field of view. They also generally have a relatively low NA, resulting in larger depth of field that allows the entire OCT imaging volume (typically on the order of several millimeters) to remain within focus as an important requirement for many OCT requirements. Whilst these specifications do not meet the criteria defined in our study, where higher resolution at a larger working distance is required. For example, the LSM03-BB scan lens used in the OCT-LK2-BB, part of the Thorlabs (Newton, NJ, USA) Ganymede series SD-OCT system, offers the smallest spot size of ~9 µm which is still too large to achieve the targeted 2–3 µm lateral resolution.
We surveyed lens offerings from two major suppliers: Edmund Optics (Barrington, NJ, USA) and Thorlabs. We filtered the candidate pool based on the derived specifications: focal length (20–30 mm), effective NA (0.17–0.25), and optical design type (aspheric singlets, spheric achromatic doublets, or aspherized achromatic doublets). Priority was given to lenses with coatings suitable for broadband transmission in the visible and NIR regions. This process led to the formation of a shortlist of candidate lenses (summarized in
Table 1) for subsequent optical simulation and experimental validation. In this study, the Zemax screening step was confined to the shortlisted catalog lenses under the intended OCT system conditions, whereas the microscope objectives were used later as practical benchmark optics in the experimental comparisons.
2.2. Performance Evaluation Using Ansys Zemax OpticsStudio Simulation
To assess the optical performance of the shortlisted imaging lenses under broadband OCT conditions, sequential simulations were carried out using Ansys Zemax OpticStudio 2023 R1.00 (Ansys, Canonsburg, PA, USA). These simulations were used to compare candidate commercial lenses in terms of focusing behavior and chromatic performance.
Each candidate lens in
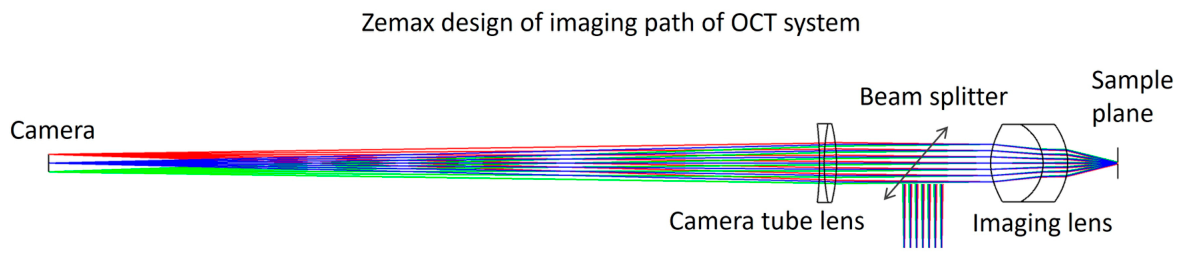
Table 1 was modelled under a collimated input beam with a diameter of 11 mm, consistent with the beam size produced by the RC12APC reflective fibre collimator in the actual system. The detection path was assumed to include a tube lens with a focal length of 250 mm, resulting in 10× magnification in
Figure 1.
The simulated light source ranged from 750 nm to 900 nm in 25 nm increments. The following simulation outputs were analyzed for each lens: Two-dimensional PSFs were generated at each wavelength to extract the full width at half maximum (FWHM), which serves as the primary estimate of lateral resolution under broadband conditions. Wavelength-dependent spot diagrams were used to evaluate the lateral dispersion of the focal spot and to compare the size and distribution of each focal point to the Airy disc.
The Zemax simulations were used as a comparative screening step to identify candidate lenses with suitable on-axis broadband imaging performance under conditions matched as closely as possible to the intended OCT system geometry. The evaluation was carried out with an effective sample-plane sampling scale of approximately 0.9 μm and a practical imaging field on the order of 1 mm, consistent with the experimental LF-SD-OCM configuration. In this way, the simulated spot/PSF behavior was assessed under conditions relevant to the final imaging system rather than in an abstract lens-only setting. Additional Zemax outputs are provided in the
Supplementary Materials.
2.3. Custom OCM Systems
In our previous studies [
16,
17,
19], we developed two parallel OCM systems equipped with ‘gold standard’ MOs, both capable of high-resolution imaging. In the present work, we leverage these established architectures and reconstruction methods to evaluate the proposed lens. While point-scanning OCM is another prominent modality [
21,
25,
26], it shares a similar Fourier-domain methodology with LF-OCM, where axial resolution is primarily determined by the bandwidth of the light source. Therefore, we adopted the LF-SD-OCM configuration as a representative model for Fourier-domain OCM systems. The FF-TD-OCM system was also built to further demonstrate that the identified lens can also provide satisfactory lateral resolution in FF-TD-OCM settings, representative model for time-domain OCM systems.
2.3.1. Line-Field Spectral-Domain OCM
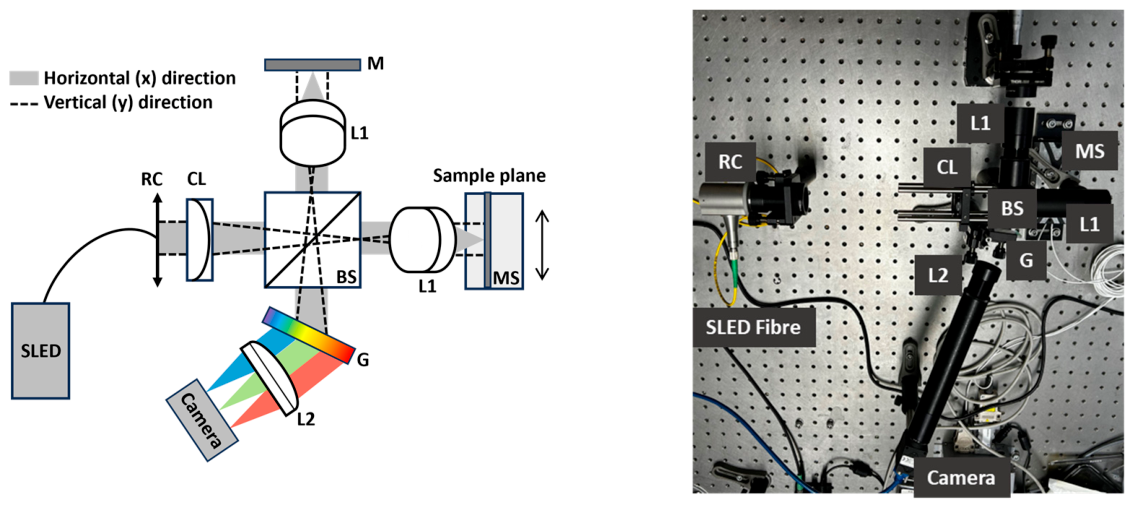
The LF-SD-OCM system was developed to evaluate the designed imaging optics under full system conditions. The system schematic diagram is shown in
Figure 2. The light source used was a broadband SLD from EXALOS (Schlieren, Switzerland), centered at 840 nm with a spectral range of 750–920 nm and a FWHM bandwidth of 130 nm. The light was coupled into a single-mode fiber (NA = 0.13) and collimated using a Thorlabs RC12APC-P01 reflective collimator, which produced a 1/e
2 beam diameter of approximately 11 mm at 780 nm.
A cylindrical lens with a focal length of 100 mm was used to shape the beam into a line profile. The imaging lens was the Edmund Optics #85302 aspherized achromatic doublet (f = 25 mm), selected based on prior Zemax simulation results. The sample was mounted on a motorized linear translation stage that enabled horizontal movement perpendicular to the illumination line.
The backscattered signal from the sample was collected and relayed to the 2D CMOS camera (FLIR BFS-U3-17S7M-C) with a resolution of 1600 × 1100 pixels and a pixel size of 9 µm. The detection path included a tube lens with a focal length of 250 mm (Thorlabs AC254-250-B), providing a 10× magnification when paired with the 25 mm imaging lens. As a result, the effective pixel size at the sample plane was approximately 0.9 µm. The 1100-pixel line direction on the camera defined a lateral field of view of ~0.99 mm. The interferometric spectrum was acquired at a fixed camera frame rate of 180 frames per second for all measurements.
For the reconstruction process, the recorded raw interferometric frames were first corrected by DC/background subtraction, using manually acquired reference frames. The calibrated wavelength axis was then converted to wavenumber space, and the spectrum was resampled onto a linear-k grid by interpolation. Depth-resolved structural signals were subsequently obtained by Fourier transformation. The data were reconstructed using our previously reported method [
27]. B-scan images were formed directly from the reconstructed depth profiles, and volumetric datasets were acquired by continuous lateral scanning using the motorised stage. En face images at selected depths were then extracted from the reconstructed volumes for comparison. No threshold-based structural segmentation was applied to the resolution-target images; background removal refers only to standard DC/background subtraction within the interferometric reconstruction pipeline. For the onion dataset, the en face images were extracted directly from the reconstructed volume. For the porcine dataset, surface flattening was applied before en face extraction to improve depth consistency within the stromal region. This flattening step was used for both porcine lens datasets and was introduced only for stromal-layer comparison.
For the LF-SD-OCM comparisons, the 250 mm camera lens was kept unchanged when switching between the Edmund Optics #85302 lens and the Mitutoyo MY10X-823 objective (Thorlabs, Newton, NJ, USA). Although replacing the camera lens to match the nominal 10× condition of the microscope objective would have adjusted the magnification, doing so would also have required recalibration of the spectrometer. To avoid introducing this additional variable, all LF-SD-OCM measurements were therefore performed with the same 250 mm camera lens. As a result, the Edmund Optics #85302 configuration provided a line-direction field of view of approximately 0.99 mm with an effective pixel size of about 0.9 μm, whereas the Mitutoyo MY10X-823 configuration provided a line-direction field of view of approximately 0.729 mm with an effective pixel size of about 0.72 μm, corresponding to an effective magnification of about 12.5×. For direct image comparison, the reconstructed datasets were subsequently resampled to a common pixel size of 0.9 μm.
2.3.2. Full-Field Time-Domain OCM
The FF-OCM was configured as in a Linnik interferometer setup to validate the lateral-resolution performance of the proposed Edmund Optics #85302 lens and to compare it with two reference 10× microscope objectives, Mitutoyo MY10X-823 and Nikon CFI Plan Fluor 10× (Nikon, Tokyo, Japan). These two objectives have both been used successfully in OCM-related imaging tasks at different wavelength ranges, with the Mitutoyo objective representing a near-infrared-optimised option and the Nikon objective representing a visible-range design [
16,
20]. They were therefore selected as practical benchmark lenses for the present experimental study. The FF-OCM schematic diagram is shown in
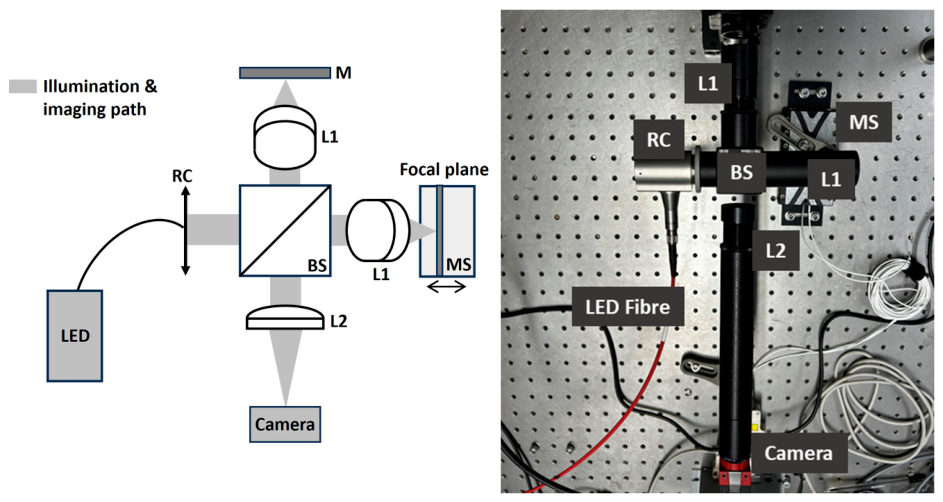
Figure 3. A broadband LED light source centered at 850 nm with 30 nm bandwidth was used, and the illumination was divided into sample and reference arms by a 50/50 non-polarizing beam splitter. The interferometric signal was recorded by a 2D CMOS camera (816 × 624 pixels, 9 μm pixel size). All FF-TD-OCM measurements were acquired at a fixed camera frame rate of 300 frames per second. Keeping the acquisition speed constant across the tested optical configurations ensured that the comparison was not influenced by changes in detector integration conditions. For the Edmund Optics #85302 configuration, the camera was focused by an achromatic doublet (AC254-250-B), yielding an effective pixel size of approximately 0.9 μm at the sample plane. For measurements performed with the two 10× microscope objectives, the camera lens was replaced by an f = 200 mm tube lens (AC254-200-B) to match the 200 mm back focal length specified for these objectives and to provide a fair comparison under the same imaging configuration of system magnification.
In the present FF-TD-OCM implementation, no piezoelectric phase-shifting element was used. Instead, the sample was translated axially using a high-precision motorised stage to acquire a densely sampled sequence of en face interferometric frames along the z direction. The sample was translated axially using a high-precision motorised stage with 10 nm translation resolution. After DC/background removal, the depth-dependent OCT envelope was extracted from the axial interferometric sequence using a Hilbert-transform-based envelope-detection method, from which depth-resolved structural information was reconstructed by our developed method [
16,
28].
3. Results and Discussion
3.1. Zemax Simulation
3.1.1. Matrix Spot Diagram Analysis
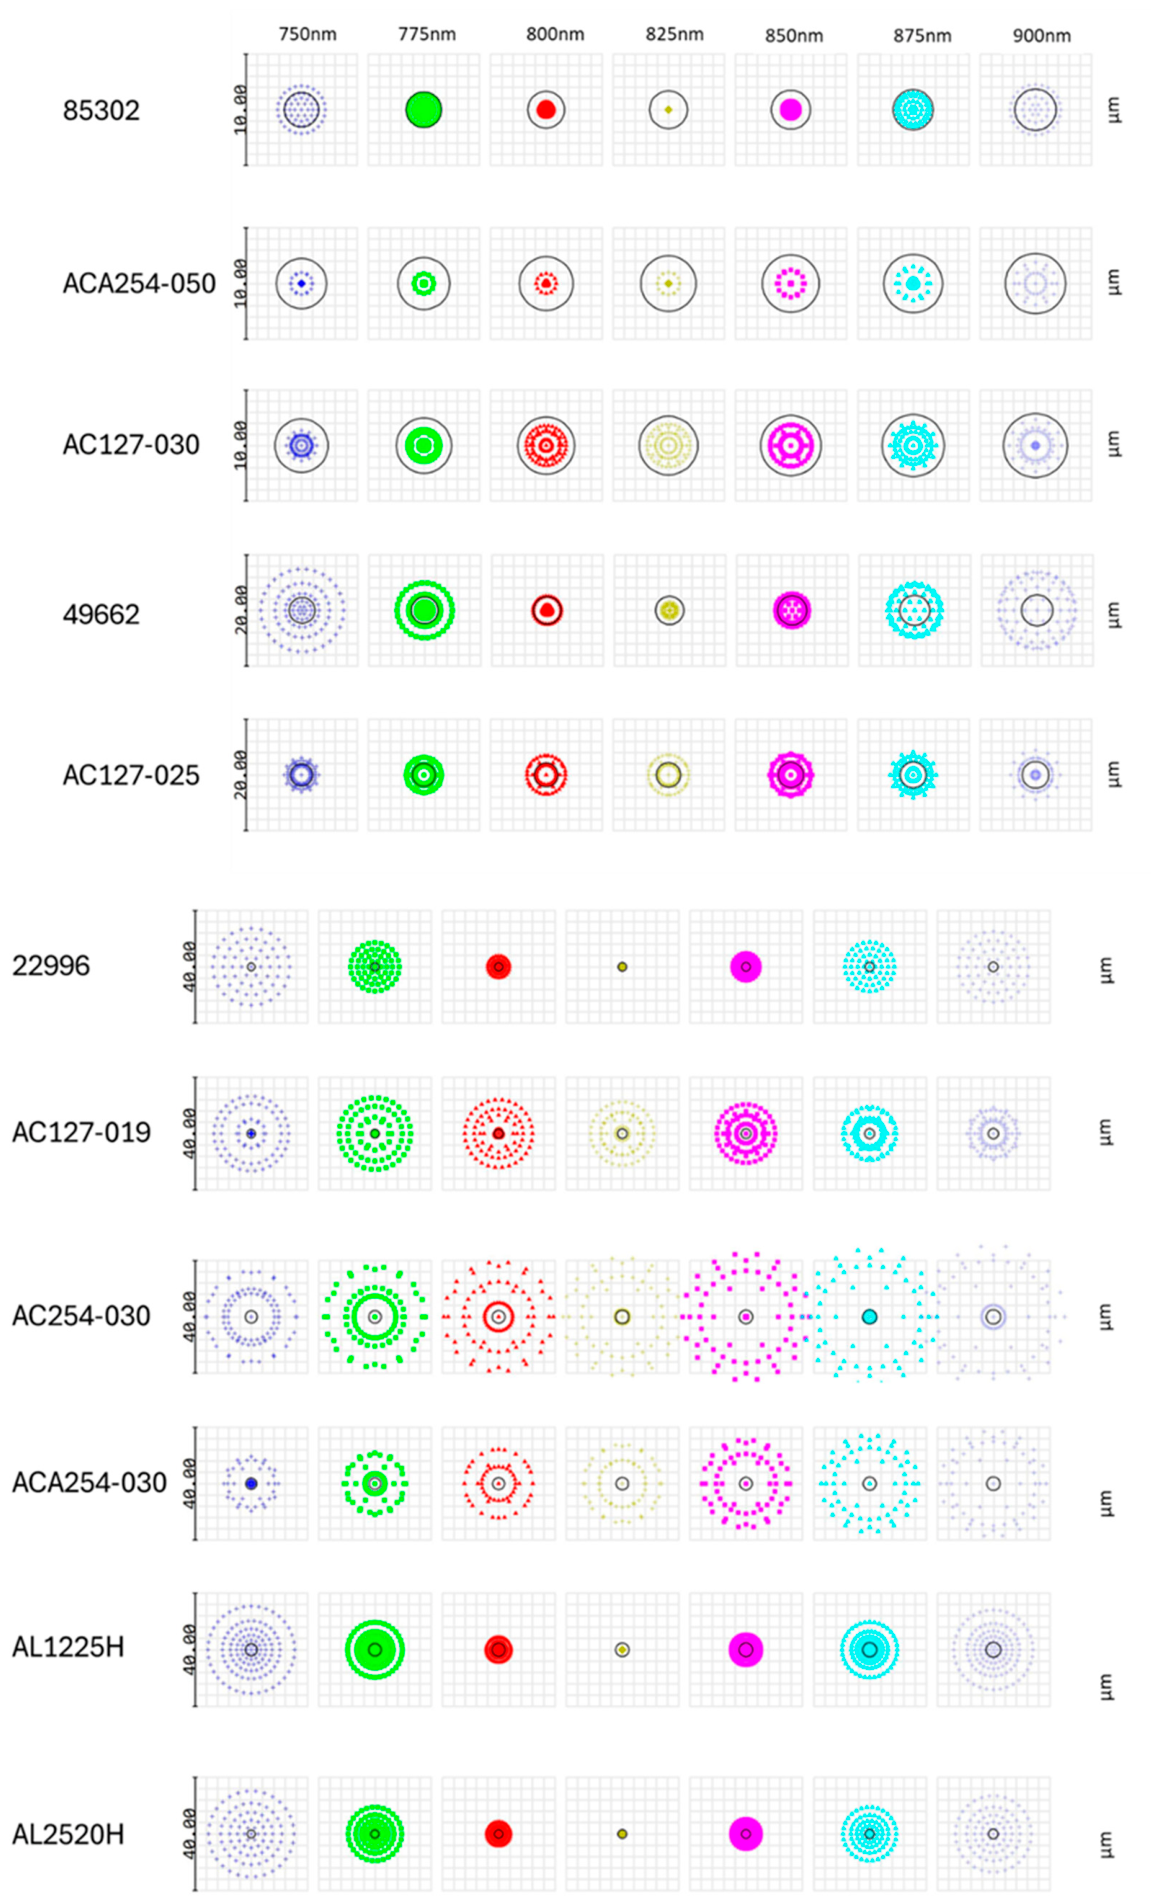
Figure 4 presents the simulated spot diagrams of all 14 candidate lenses at discrete wavelengths from 750 nm to 900 nm in 25 nm increments. Each spot diagram is therefore monochromatic at the indicated wavelength, while the full matrix is used to assess wavelength-dependent performance across the broadband range relevant to the OCM system. Each row corresponds to a different lens, and each column to a different wavelength. The spot diagrams were computed using Zemax OpticStudio 2023 R1.00 with a fixed collimated beam diameter of 11 mm, matching the experimental condition. The black circles overlaid on each plot indicate the Airy disc radius calculated for the corresponding wavelength and numerical aperture. They are included as monochromatic diffraction-limited reference scales for the individual spot diagrams.
The simulation highlights the strong wavelength dependence of focusing performance. Lenses incorporating achromatic and aspheric elements—such as #85302 and #49662—consistently produce tightly focused spots that remain within or near the Airy disc boundary across the broadband range, reflecting effective chromatic aberration correction. In contrast, conventional achromatic lenses such as AC127 series or low-NA singlets like #22996 exhibit larger, dispersed spot patterns, especially at shorter wavelengths, suggesting increased chromatic blurring and off-axis aberration.
Lense AL2520H and #16981 show excellent performance at central wavelengths but rapidly degrade at spectral extremes, emphasizing the importance of broadband compatibility for OCT applications. The results demonstrate that broadband spot diagram analysis is a critical tool for screening lens candidates and underline the superior chromatic performance of aspherized achromatic designs in broadband OCT imaging.
3.1.2. Point Spread Function Analysis
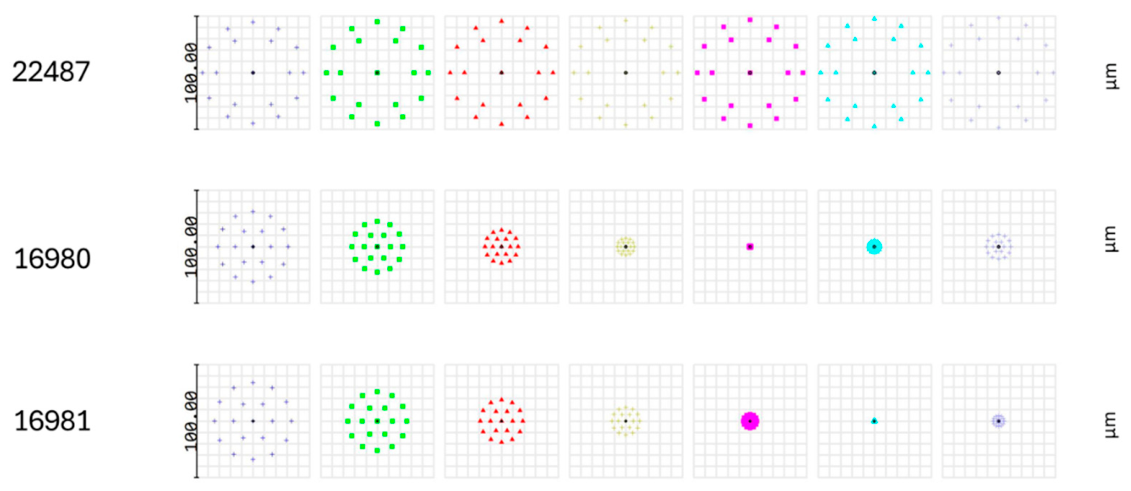
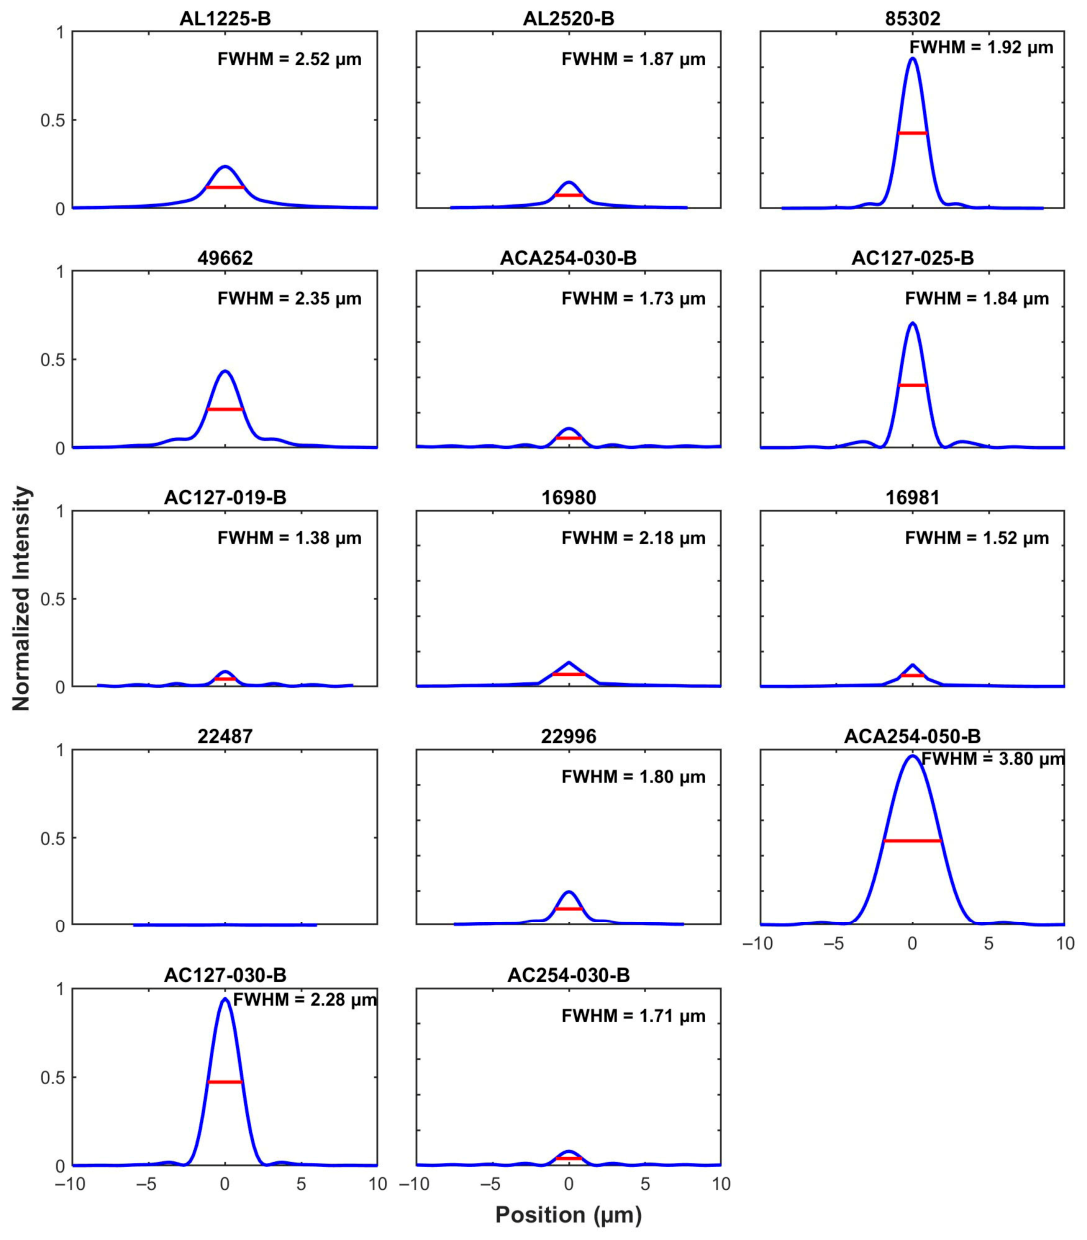
Lateral resolution performance was further evaluated under broadband conditions using the Zemax polychromatic Huygens PSF function. The PSF analysis combined the full source range to represent the broadband focusing behavior of each lens. This method computes the irradiance distribution in the image plane by coherently summing contributions from multiple wavelengths, providing a wavelength-weighted model of the optical system’s focusing performance under broadband illumination. The simulations were performed assuming: A collimated input beam diameter of 11 mm, matching the beam size in the experimental setup. A wavelength ranges from 750 nm to 900 nm, consistent with the spectrum of the SLD used in the LF-OCM system. A centered (on-axis) point object, without any field displacement, to evaluate diffraction-limited focusing performance at the system’s optical axis. Each PSF profile was exported and analysed in MATLAB R2025b (MathWorks, Natick, MA, USA) to compute the FWHM. The irradiance distributions are plotted in
Figure 5, where the red horizontal lines mark the FWHM extent. These plots allow visual inspection of beam shapes, sidelobes, and peak symmetry, which are critical for high-contrast OCT imaging.
The key performance metrics for all candidate lenses are summarized in
Table 2, including the Airy disc radius, RMS spot size, geometric spot size, PSF FWHM, and Strehl ratio. The values summarized in
Table 2 were obtained under the broadband simulation setting corresponding to the SLD source range used in the LF-SD-OCM system. The Airy disc radius is included as a wavelength-based reference quantity, while the RMS spot size, geometric spot size, PSF FWHM, and Strehl ratio reflect the broadband simulation results. The Edmund Optics #85302 lens demonstrates a superior balance of performance characteristics suitable for high-resolution OCM. It achieves a Strehl ratio of 0.851, which is well above the 0.8 threshold typically considered for diffraction-limited performance, indicating excellent wavefront quality. Furthermore, its simulated PSF FWHM of 1.92 µm is consistent with the target lateral resolution of 2–3 µm. In contrast, while some achromatic doublets (e.g., ACA254-050-B) exhibit high Strehl ratios, their longer focal lengths or larger FWHM values do not meet the system’s compactness or resolution requirements. Conversely, the simple aspheric lenses (e.g., #16981, #22487) show significantly degraded Strehl ratios (<0.2) and expanded spot sizes, confirming their inability to correct for chromatic aberrations in a broadband system.
Strehl ratio provides critical insight into wavefront integrity and aberration control, while PSF width and spot size more directly inform resolution. Therefore, all metrics must be interpreted together when assessing the practical imaging quality of each lens.
Overall, the Zemax analysis pointed to the Edmund Optics #85302 lens as the best candidate for the present work. Under polychromatic conditions, it maintained a good balance between wavefront quality and focusing performance, as reflected by its Strehl ratio, PSF FWHM, and spot-size-related metrics. This made it a suitable lens for the target 2–3 µm lateral-resolution range and for the compact system configuration used here. The following sections therefore examine its experimental performance in the FF-TD-OCM and LF-SD-OCM systems.
3.2. LF-SD-OCM Experimental Validation Using the Selected Lens
Based on the Zemax analysis in
Section 3.1, the Edmund Optics #85302 lens was selected for experimental study because it showed the most favourable balance between polychromatic Strehl ratio, PSF FWHM, and spot-size-related performance within the target system geometry. The next step was to evaluate the selected lens in the final broadband LF-SD-OCM system, where both lateral and axial performance could be assessed under the intended operating conditions of the study. The lateral resolution performance of the system was evaluated using a USAF 1951 resolution target. The test was conducted using a broadband SLD source centered at 840 nm, with a full bandwidth of approximately 130 nm, under the optical design parameters described in
Section 2.3.1. The system’s resolution was characterized along both the line illumination (vertical) and scanning (horizontal) directions.
Figure 6 shows the lateral-resolution validation of the selected Edmund Optics #85302 lens in the LF-SD-OCM system.
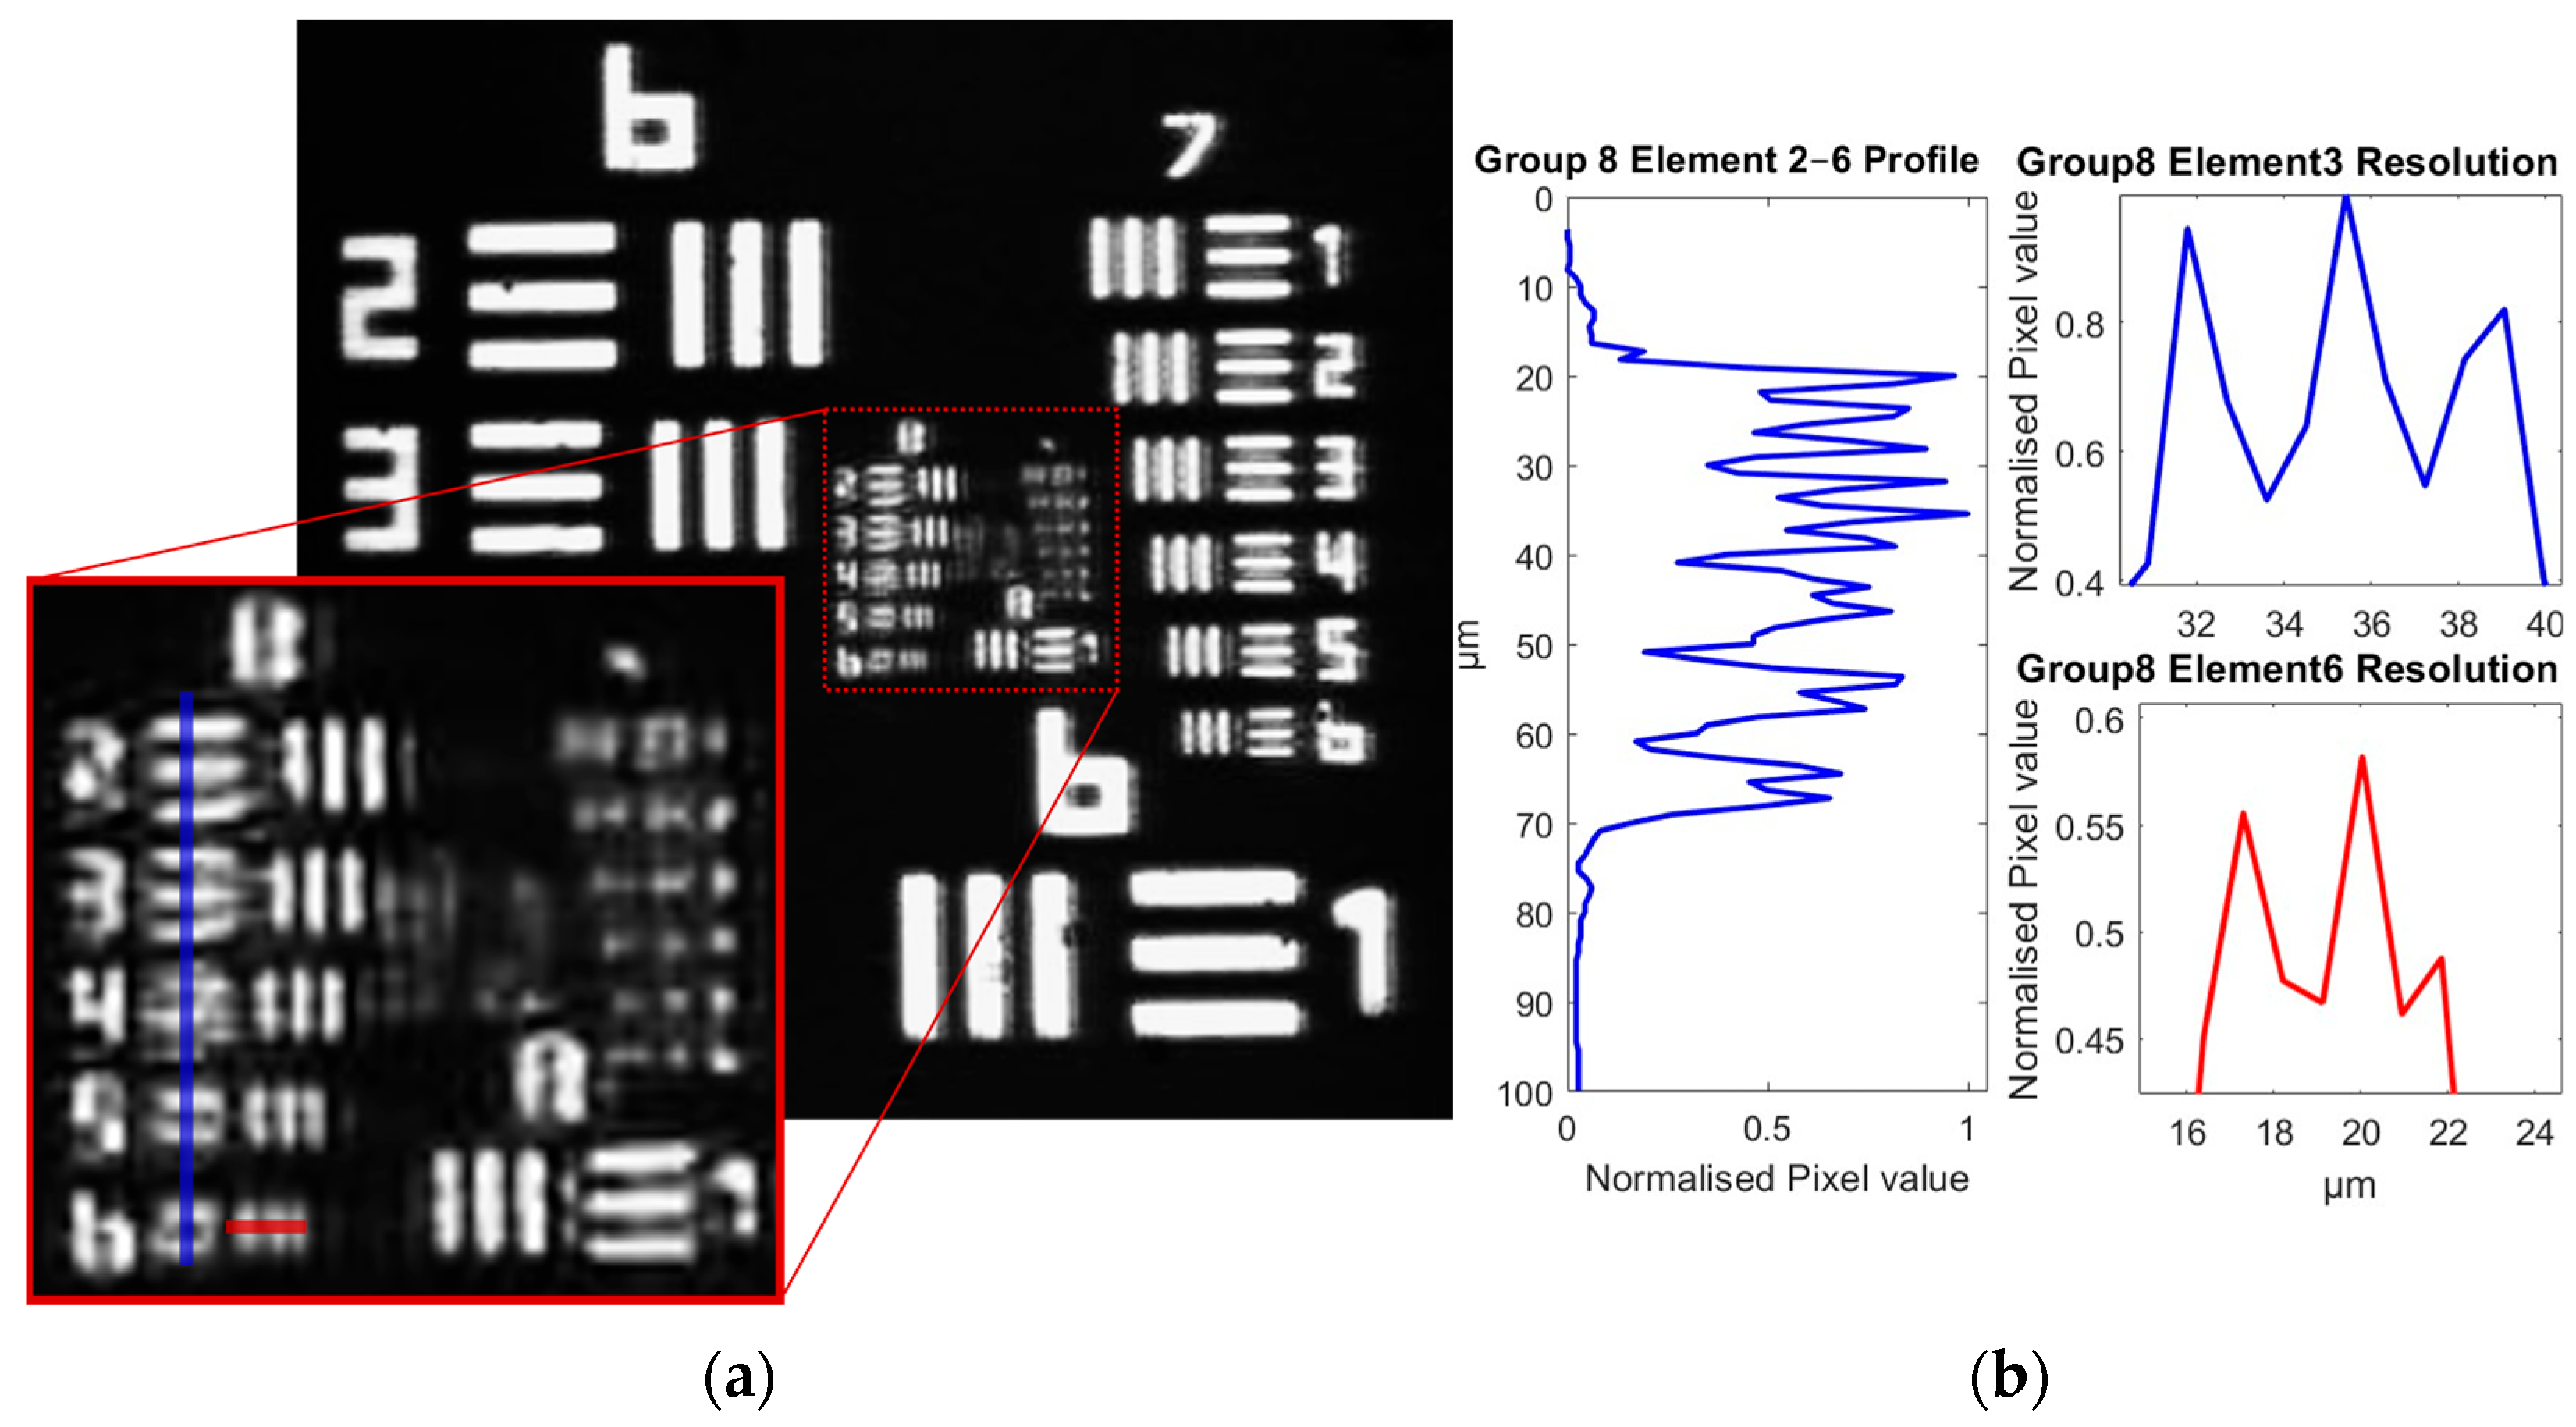
Figure 6a shows the en face OCM image of the USAF 1951 target, including Groups 6–8. The Group 8 region is highlighted by the red dashed box and enlarged in the lower-left inset to show the finest resolvable features more clearly. The blue and red lines in the inset indicate the positions used for extracting the normalized intensity profiles shown in
Figure 6b. The vertical direction corresponds to the line-illumination direction, whereas the horizontal direction corresponds to the lateral-scanning direction. In the line direction, the system resolved features up to Group 8, Element 3, corresponding to bar widths of approximately 1.55 μm. In the scanning direction, finer structures were distinguishable, with resolution reaching Group 8, Element 6, corresponding to a bar width of 1.10 μm.
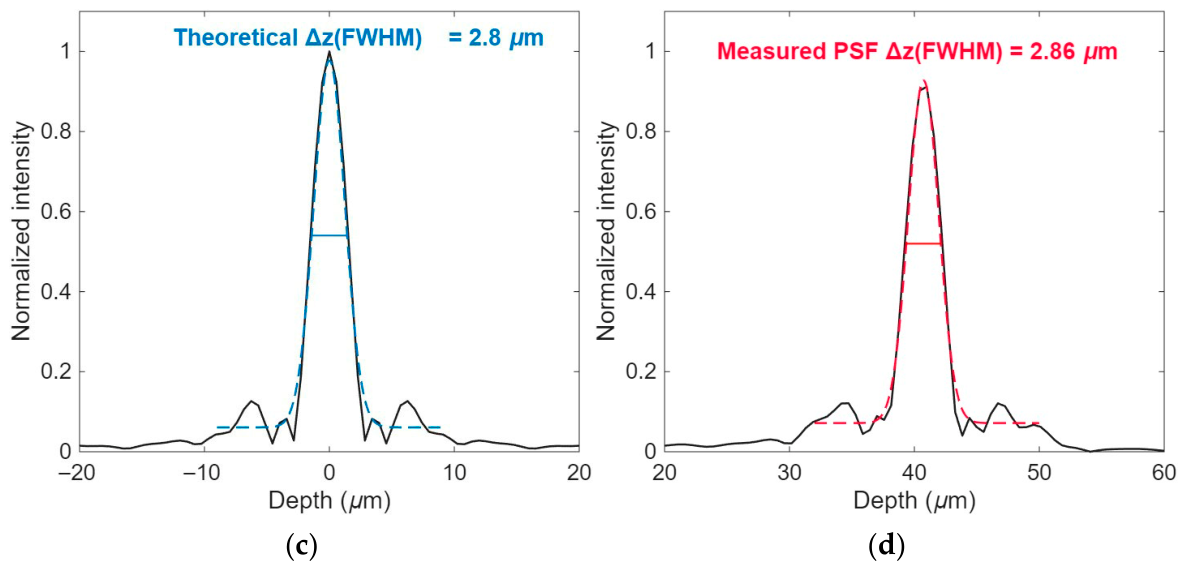
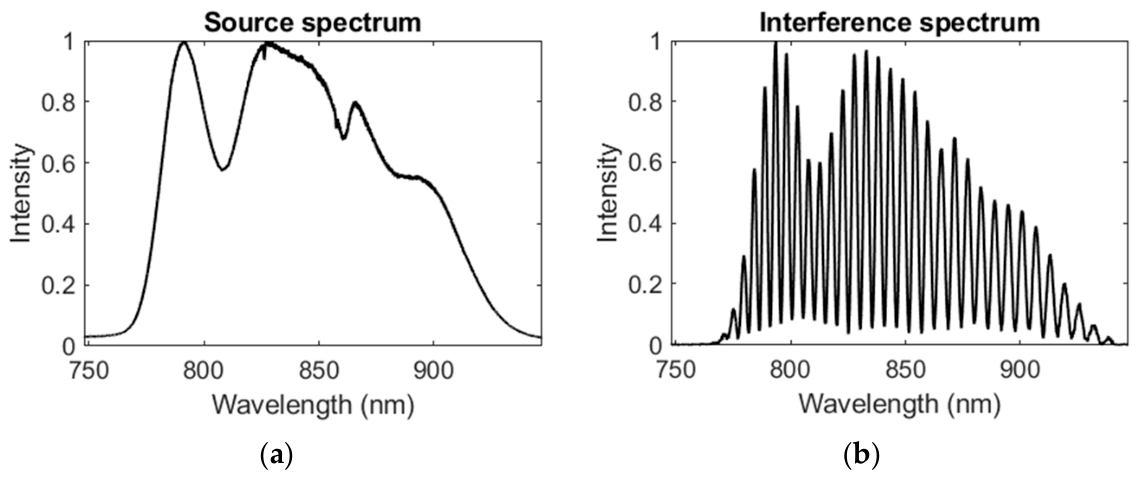
Figure 7a,b show the recorded spectrum in the absence and presence of a single reflector in the sample arm, respectively, using the LF-SD-OCM configuration equipped with the selected Edmund Optics #85302 lens. Spectral data were processed by removing the DC background, resampling to linear wavenumber, and then computing the inverse FFT to obtain the axial PSF. As shown in
Figure 7c,d. The FWHM of 2.8 µm and 2.86 µm are obtained by Gaussian fitting to the signal peaks, representing the theoretical and experimental axial resolution. The small discrepancy between theoretical and experimental resolution may result from residual group-dispersion mismatch in the optics between the reference and sample arms. Assuming a representative biological-tissue group refractive index of approximately 1.38 [
29], this corresponds to an estimated axial resolution of about 2.1 μm in tissue.
Note that for Gaussian spectrum with moderate bandwidth, one can estimate the axial resolution in air as [
6]:
.
For a non-Gaussian spectrum such as the one used here, the axial resolution is obtained from the coherence function, which is the Fourier transform of the source spectrum [
30].
3.3. Biological-Sample Imaging with the Selected Lens in LF-SD-OCM
In the previous section, we reported quantitative lateral resolution measurements using a gold-standard resolution target. To further assess system performance, we imaged biological samples for a qualitative comparison between the Edmund lens and the reference Mitutoyo objective. Onion epidermis and ex vivo porcine cornea were selected as representative specimens to evaluate performance on complex biological structures within an identical LF-SD-OCM configuration. As shown below, the Edmund lens delivers image quality comparable to the reference objective for these biologically relevant samples.
3.3.1. Onion Epidermal Tissue
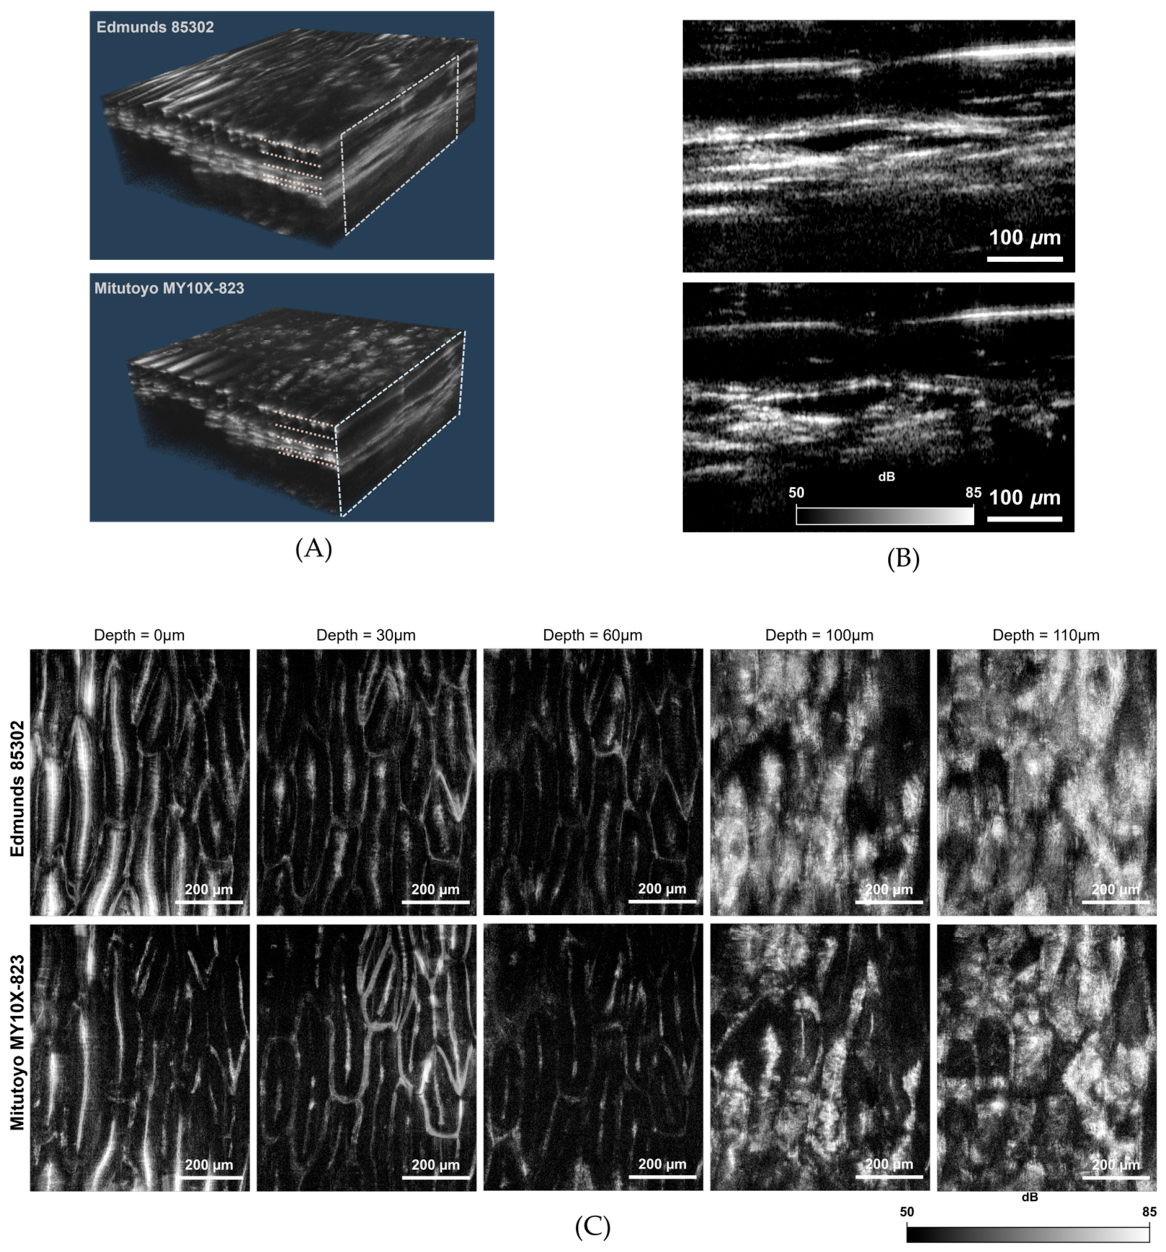
Figure 8 compares OCM images of onion tissue acquired using the Edmund lens and the reference Mitutoyo objective in an LF-SD-OCM configuration. The sample consisted of an onion layer with the onion epidermis still attached to its surface. In this experiment, the sample arm was adjusted so that the focus was positioned approximately 30 μm below the air/sample interface to visualize subsurface onion structures.
Figure 8A shows the 3D renderings of the volumetric datasets, and
Figure 8B shows representative B-scan images showing the internal structure of the onion layer.
The multi-depth en face comparison is shown in
Figure 8C, where images were extracted from the same region of interest (ROI) at depths of 0, 30, 60, 100, and 110 μm below the sample surface. In the superficial layers, both Edmund lens and Mitutoyo objective clearly revealed the elongated onion epidermal cell boundaries and overall cellular morphology. Near the intended subsurface focal region (e.g., 30 μm), the Mitutoyo objective shows slightly finer and sharper structural details, whereas the Edmund lens provides images of similar quality across a depth range from 0 to 60 μm. These results qualitatively show that the Edmund lens delivers image quality comparable to the reference objective for onion sample.
3.3.2. Ex Vivo Porcine Cornea
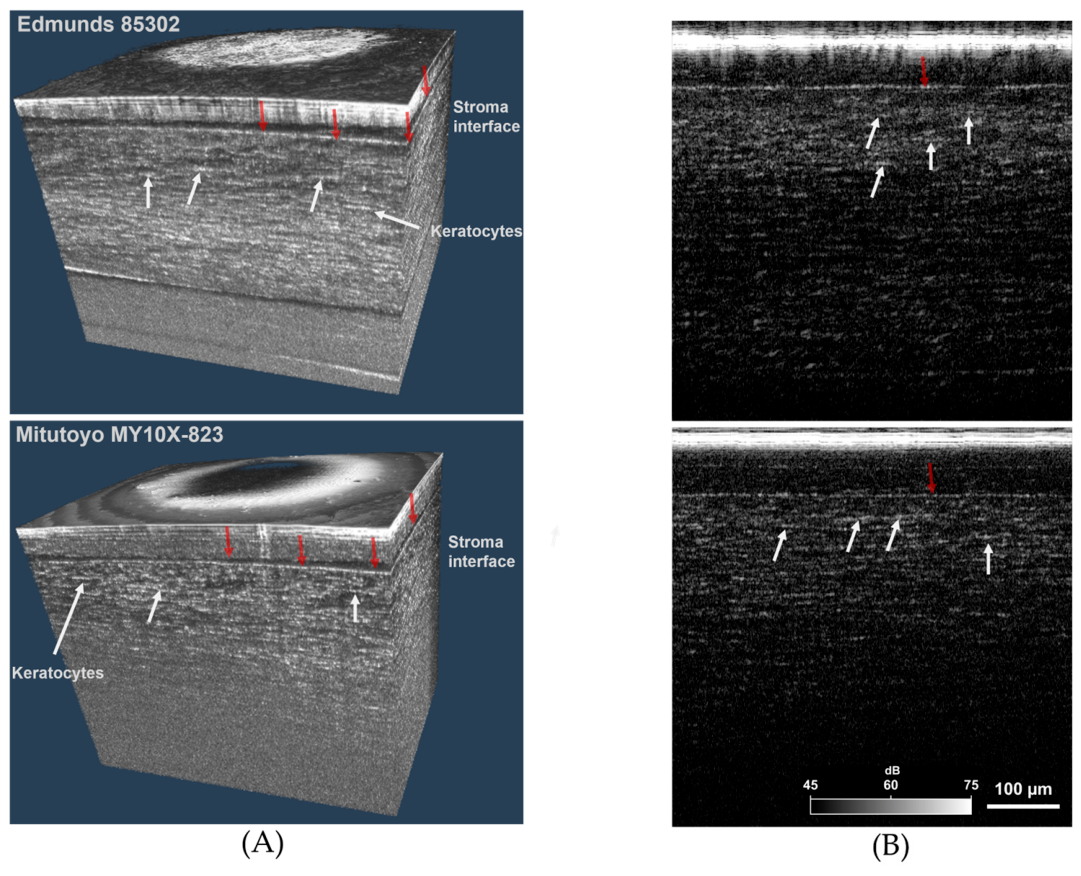
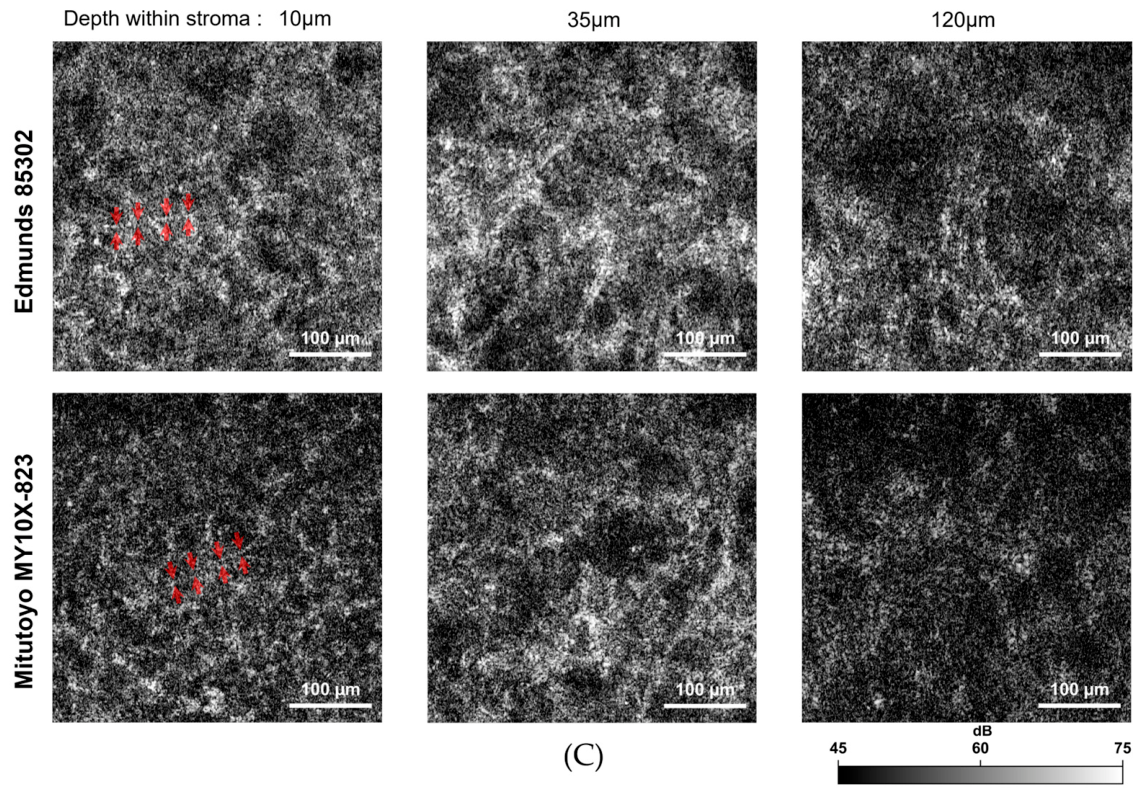
Figure 9 compares OCM images obtained using the Edmund lens and the reference Mitutoyo objective in an identical LF-SD-OCM configuration. For this experiment, the focal plane was positioned near the stromal interface of the porcine cornea.
Figure 9A presents the 3D renderings of the reconstructed volumetric datasets, whilst
Figure 9B shows representative B-scan images, in which the red arrows indicate the stromal interface and the white arrows indicate keratocyte-like structural features within the stroma. The en face images in
Figure 9C were extracted after surface flattening to improve depth consistency within the stromal region and are shown at depths of 10, 35, and 120 μm within the stroma. The same flattening procedure was applied to both datasets.
In the superficial stromal region, like the onion results, both the Edmund lens and the reference Mitutoyo objective provide images with comparable stromal texture and similar line-shaped reflective features, marked by the red arrows. Mitutoyo objective provided slightly better contrast and finer structural features near the focal plane. The stromal patterns remained visible but became less clearly defined at increasing depths in both cases. At greater stromal depths, the principal reflective features were still identifiable, although their contrast and structural definition were reduced.
It is worth noting that the porcine eye is deforming and degrading during the imaging alignment and acquisition due to its intrinsic biological nature; it is not possible to use the same porcine eye for all experiments. Because the results presented here were obtained from two eyes, the depth-dependent trends in the B-scan and en face views should be interpreted qualitatively, not as a point-to-point comparison at identical tissue locations. Nevertheless, these qualitative results again show that the Edmund lens delivers image quality comparable to the reference objective for porcine cornea samples.
3.4. Optical Throughput Comparison in the LF-SD-OCM Detection Configuration
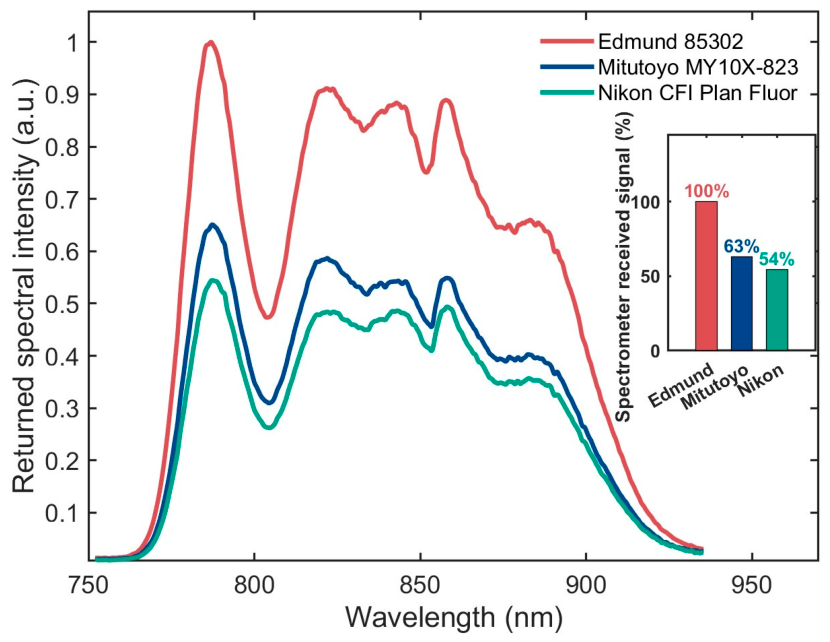
For the optical-throughput comparison, the reference arm was blocked, and a silver mirror was positioned at the focal plane of the sample arm. The returned spectrum was recorded using the LF-SD-OCM spectrometer. Because the light passed through the lens under test on both the forward and return paths, the recorded spectrum represents the double-pass returned spectral intensity from that arm under the system detection configuration. The Edmund Optics #85302 lens was compared with the Mitutoyo MY10X-823 objective and the Nikon CFI Plan Fluor 10× objective using an identical measurement arrangement and detection path. This comparison therefore reflects the practical signal level delivered to the detection system, rather than the intrinsic transmission of each optic in isolation.
Figure 10 shows the measured returned spectral intensity, normalized to the peak value of the Edmund lens. Across the wavelength range, the Edmund lens exhibited the highest returned intensity, while both microscope objectives showed consistently lower detected signal. Integration of the spectra (
Figure 10 insert) indicates that the Mitutoyo and Nikon retained approximately 63% and 54% of the signal, respectively, corresponding to ~ 2.0 dB and ~2.7 dB lower than Edmund lens under the same double-pass measurement condition.
The shot noise absolute sensitivity limit for any OCT or OCM-based system is determined by the number of photons collected from the sample. Therefore, a higher transmission system will have a higher absolute sensitivity if all other factors are equal. The detector power of OCM systems can be expressed as [
31]:
For in vivo OCT imaging, the optical power incident on the eye is fundamentally limited by the Maximum Permissible Exposure (MPE), whilst is typically adjusted close to the detector full-well capacity. Under this constraint, improving sensitivity relies on maximizing the efficiency of light delivery and collection, making higher transmission optics in the sample arm particularly beneficial. The higher returned signal measured with the Edmund lens therefore provides a practical system-level advantage for the implemented LF-SD-OCM configuration, while maintaining acceptable imaging performance, including lateral resolution.
3.5. FF-TD-OCM Experimental Validation of the Selected Lens
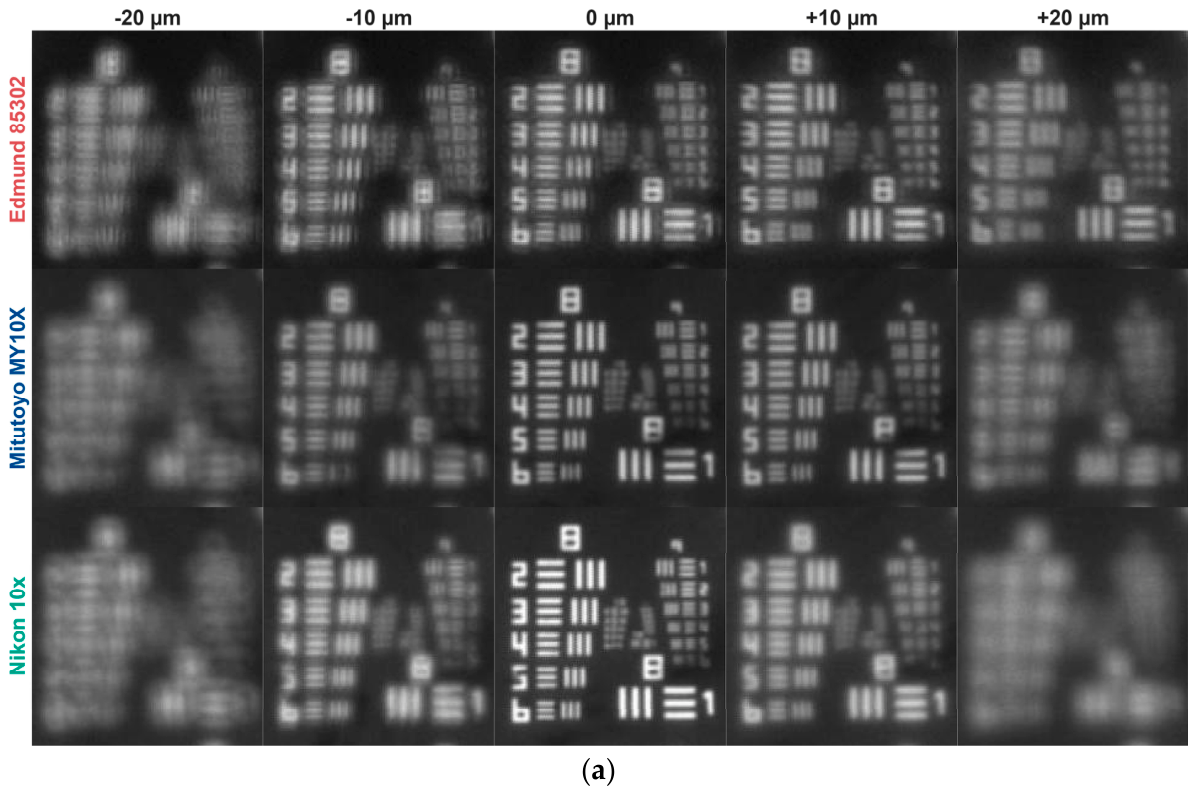
Additional validation was performed using an FF-TD-OCM configuration to further demonstrate that the selected lens is also suitable for time-domain OCM, complementing the frequency-domain OCM results. A USAF 1951 target was imaged under 850 nm LED illumination.
Figure 11a shows through-focus images of Group 8 for the proposed Edmund Optics #85302 lens and two reference 10× objectives (Mitutoyo MY10X-823 and Nikon CFI Plan Fluor 10×) at defocus positions of −20, −10, 0, +10, and +20 µm. All results were measured using identical acquisition, normalization, and registration procedures to ensure direct comparison of the same bar pattern. All en face images in
Figure 11a are normalised to the global maximum within each lens dataset across all defocus positions. In all cases, the sharpest images occurred near focus, with progressively reduced feature visibility away from the focal plane.
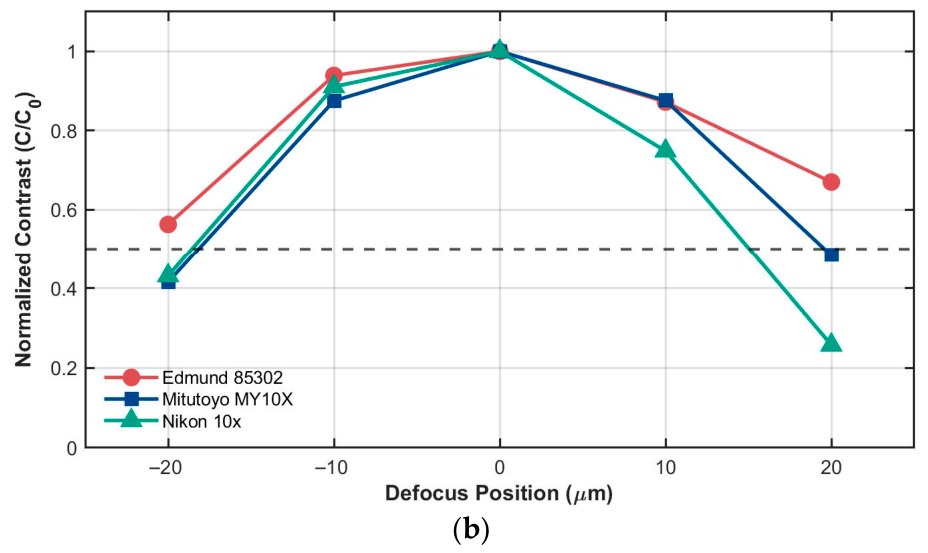
To provide a quantitative comparison of practical through-focus behavior, the normalized Michelson contrast was calculated from a selected USAF element that remained reliably modulated across all three optics and all selected defocus positions. A common ROI containing the same bar pattern was defined and applied consistently to all lenses and all tested defocus positions. A one-dimensional intensity profile was extracted in the direction perpendicular to the bar orientation, and the Michelson contrast was calculated as
where
and
denote the corresponding peak and valley intensities in the extracted profile. The contrast at each defocus position was then normalized by the corresponding in-focus contrast at 0 μm for the same lens, yielding the quantity C/
, where
denotes the in-focus Michelson contrast. The resulting contrast-retention curves are shown in
Figure 11b. All three optics reached peak contrast at 0 μm and exhibited reduced modulation away from focus. Within the tested ±20 μm range, the Edmund Optics #85302 lens maintained normalized contrast above the selected practical threshold of 0.5 and showed contrast retention comparable in order to the two reference objectives. These results indicate that the proposed lens does not impose an impractically narrow focusing tolerance under the present FF-TD-OCM configuration.
The FF-OCM system utilizes a spatially incoherent LED source centered at 850 nm, which facilitates the accurate characterization of high lateral resolution by suppressing coherent crosstalk and eliminating the need for scanning. This configuration allows for a high-fidelity analysis of focusing performance, specifically for depth of focus measurements, as illustrated in
Figure 11.
At an axial position of 10 µm, the resolution patterns in Group 8 are clearly resolved using both the proposed Edmund lens and the Mitutoyo objective; in contrast, the images acquired with the Nikon objective appear blurred. From an optical throughput perspective, the Edmund lens produces brighter patterns than the Mitutoyo objective, demonstrating better transmission efficiency even when resolving the same spatial frequencies. When the axial displacement is increased to 20 µm, the patterns are no longer resolvable using either the Mitutoyo or Nikon objectives. However, the proposed lens maintains the ability to resolve Group 8 patterns while simultaneously providing higher signal intensity than its counterparts.
4. Discussion
The main value of the proposed Edmund Optics #85302 lens is not that it fully reproduces the performance of a conventional microscope objective in every respect, but that it offers a different system-level balance. In the tested broadband OCM configurations, the lens was able to maintain micron-scale imaging performance while also providing higher throughput, a compact form factor, and lower optical complexity. This makes it a practical alternative in situations where light efficiency and system simplicity are important.
At the same time, the present results also show that the proposed lens should not be interpreted as equivalent to a conventional microscope objective with the same nominal NA. In particular, its focusing performance still differs from that of a standard MO, and the achieved imaging behaviour does not fully match what would be expected from the theoretical NA alone. This is an important limitation, but it is also part of the trade-off considering different application scenarios. The same optical characteristics that reduce the sharpness of the focus relative to a conventional MO are also associated with a longer depth of focus. Depending on the application, this may be either a disadvantage or a practical benefit. In other words, the proposed lens does not simply outperform a microscope objective, but instead shifts the balance between focusing performance, depth tolerance, throughput, and complexity.
The additional biological imaging experiments help clarify this point. The onion experiment provided a direct same-ROI comparison and showed that the proposed lens preserved the main epidermal features seen with the reference objective. The porcine corneal experiment further showed that the lens could still provide useful stromal structural information in a biologically relevant sample.
The present validation also has an important boundary. Because the imaging experiments were performed using lateral stage translation, the current results mainly reflect the on-axis performance of the system. Further validation of practical usability should therefore include scanning-based imaging conditions, where off-axis behaviour becomes more important. This would help determine more fully how the proposed lens performs under realistic imaging geometries and would provide a stronger basis for judging its suitability in broader OCM applications.
5. Conclusions
This study presented a theoretical evaluation and experimental validation of a cost-effective imaging lens solution for high-resolution, broadband OCM systems. The Edmund Optics #85302 lens was selected through comparative optical simulations of shortlisted commercial lenses, including PSF analysis, Strehl ratio evaluation and spot diagram assessment. Simulation results indicated strong on-axis focusing performance, proper chromatic correction, and field uniformity under the tested conditions.
Experimentally, the selected lens was further validated in both FF-TD-OCM and LF-SD-OCM configurations, including through focus analysis and additional biological-sample imaging. The results showed that the Edmund Optics #85302 lens maintained micron-scale imaging performance while also providing the highest measured optical throughput among the three tested optics.
In the biological imaging experiments, the proposed lens preserved the main structural features visible with the reference microscope objective, including onion epidermal cellular features and porcine stromal structures. The through-focus comparison further showed that the lens retained practically useful contrast around focus under the tested FF-TD-OCM configuration.
Consequently, this proposed alternative offers a practical combination of compactness, high throughput, and micron-scale resolution in the tested OCM configurations. The present results support the Edmund Optics #85302 lens as a practical alternative for broadband OCM system design. This throughput advantage may be particularly useful in high-speed OCT/OCM imaging applications, where photon collection efficiency is an important practical consideration.
Supplementary Materials
The following supporting information can be downloaded at:
https://www.mdpi.com/article/10.3390/photonics13040384/s1, Figure S1: Supplementary Zemax focal-shift analysis of shortlisted lens candidates; Figure S2: Supplementary Zemax optical path difference (OPD) fan analysis of shortlisted lens candidates; Figure S3: Supplementary Zemax ray fan analysis of shortlisted lens candidates; Figure S4: Supplementary depth-of-focus (DOF) analysis showing the analysis method and representative data; Figure S5: FFOCM USAF target results obtained using a 660 nm illumination source; Figure S6: USAF target results obtained using the Mitutoyo lens in the LF-OCM configuration; Table S1: Supplementary through-focus analysis.
Author Contributions
Conceptualization, Y.S. and Y.Z.; methodology, X.Z., Z.Z., S.L. and X.Y.; software, X.Z., Z.Z., S.L. and X.Y.; writing—original draft preparation, X.Z.; writing—review and editing, Z.Z. and S.L.; validation, X.Z.; formal analysis, X.Z.; investigation, X.Z.; visualization, X.Z.; supervision, Y.S. and Y.Z.; project administration, Y.S. and Y.Z.; funding acquisition, Y.S. and Y.Z. All authors have read and agreed to the published version of the manuscript.
Funding
This research was partly funded by MRC, grant number MR/Z506175/1, and EPSRC EP/X01441X/1 and EP/W006405/1.
Institutional Review Board Statement
Not applicable.
Informed Consent Statement
Not applicable.
Data Availability Statement
The data presented in this study are available from the corresponding author upon reasonable request.
Conflicts of Interest
The authors declare no conflicts of interest.
References
- Geitzenauer, W.; Hitzenberger, C.K.; Schmidt-Erfurth, U.M. Retinal optical coherence tomography: Past, present and future perspectives. Br. J. Ophthalmol. 2011, 95, 171–177. [Google Scholar] [CrossRef]
- Duker, J.S.; Waheed, N.K.; Goldman, D. Handbook of Retinal OCT: Optical Coherence Tomography E-Book; Elsevier Health Sciences: Philadelphia, PA, USA, 2021. [Google Scholar]
- Mogensen, M.; Thrane, L.; Jørgensen, T.M.; Andersen, P.E.; Jemec, G.B.E. OCT imaging of skin cancer and other dermatological diseases. J. Biophotonics 2009, 2, 442–451. [Google Scholar] [CrossRef]
- Ruini, C.; Schuh, S.; Sattler, E.; Welzel, J. Line-field confocal optical coherence tomography—Practical applications in dermatology and comparison with established imaging methods. Skin Res. Technol. 2021, 27, 340–352. [Google Scholar] [CrossRef]
- Dubois, A.; Vabre, L.; Boccara, A.-C.; Beaurepaire, E. High-resolution full-field optical coherence tomography with a Linnik microscope. Appl. Opt. 2002, 41, 805–812. [Google Scholar] [CrossRef]
- Drexler, W.; Fujimoto, J.G. Optical Coherence Tomography: Technology and Applications; Springer Science & Business Media: New York, NY, USA, 2008. [Google Scholar]
- Boppart, S.A.; Bouma, B.E.; Pitris, C.; Southern, J.F.; Brezinski, M.E.; Fujimoto, J.G. In Vivo Cellular Optical Coherence Tomography Imaging; Nature Publishing Group: New York, NY, USA, 1998. [Google Scholar]
- Mazlin, V.; Xiao, P.; Scholler, J.; Irsch, K.; Grieve, K.; Fink, M.; Boccara, A.C. Real-time non-contact cellular imaging and angiography of human cornea and limbus with common-path full-field/SD OCT. Nat. Commun. 2020, 11, 1868. [Google Scholar] [CrossRef]
- Mazlin, V.; Xiao, P.; Irsch, K.; Scholler, J.; Groux, K.; Grieve, K.; Fink, M.; Boccara, A.C. Optical phase modulation by natural eye movements: Application to time-domain FF-OCT image retrieval. Biomed. Opt. Express 2022, 13, 902–920. [Google Scholar] [CrossRef] [PubMed]
- Mazlin, V. Optical tomography in a single camera frame using fringe-encoded deep-learning full-field OCT. Biomed. Opt. Express 2023, 15, 222–236. [Google Scholar] [CrossRef] [PubMed]
- Mazlin, V.; Irsch, K.; Paques, M.; Sahel, J.-A.; Fink, M.; Boccara, C.A. Curved-field optical coherence tomography: Large-field imaging of human corneal cells and nerves. Optica 2020, 7, 872–880. [Google Scholar] [CrossRef]
- Choi, W.-J.; Min, G.-H.; Lee, B.-H.; Eom, J.-H.; Kim, J.-W. Counterfeit detection using characterization of safety feature on banknote with full-field optical coherence tomography. J. Opt. Soc. Korea 2010, 14, 316–320. [Google Scholar] [CrossRef]
- Choi, W.J.; Jung, S.P.; Shin, J.G.; Yang, D.; Lee, B.H. Characterization of wet pad surface in chemical mechanical polishing (CMP) process with full-field optical coherence tomography (FF-OCT). Opt. Express 2011, 19, 13343–13350. [Google Scholar] [CrossRef] [PubMed]
- Liba, O.; Lew, M.D.; SoRelle, E.D.; Dutta, R.; Sen, D.; Moshfeghi, D.M.; Chu, S.; de la Zerda, A. Speckle-modulating optical coherence tomography in living mice and humans. Nat. Commun. 2017, 8, 15845. [Google Scholar] [CrossRef]
- Knott, E.J.; Sheets, K.G.; Zhou, Y.; Gordon, W.C.; Bazan, N.G. Spatial correlation of mouse photoreceptor-RPE thickness between SD-OCT and histology. Exp. Eye Res. 2011, 92, 155–160. [Google Scholar] [CrossRef]
- Zhang, Z.; Ikpatt, U.; Lawman, S.; Williams, B.; Zheng, Y.; Lin, H.; Shen, Y. Sub-surface imaging of soiled cotton fabric using full-field optical coherence tomography. Opt. Express 2019, 27, 13951–13964. [Google Scholar] [CrossRef]
- Zhang, Z.; Williams, B.; Zheng, Y.; Lin, H.; Shen, Y. Differentiating Generic versus Branded Pharmaceutical Tablets Using Ultra-High-Resolution Optical Coherence Tomography. Coatings 2019, 9, 326. [Google Scholar] [CrossRef]
- Chen, K.; Abbasi, N.; Wong, A.; Bizheva, K. In vivo, contactless, cellular resolution imaging of the human cornea with Powell lens based line field OCT. Sci. Rep. 2024, 14, 22553. [Google Scholar] [CrossRef] [PubMed]
- Lawman, S.; Alam, U.; Shen, Y.-C.; Zheng, Y. Eye-Screen: A Compact Line-Field Spectral-Domain Optical Coherence Microscopy Design for Diabetic Peripheral Neuropathy Screening. In European Conferences on Biomedical Optics; Technical Digest Series; Optica Publishing Group: München, Germany, 2025; p. W3A.23. [Google Scholar] [CrossRef]
- Han, L.; Tan, B.; Hosseinaee, Z.; Chen, L.K.; Hileeto, D.; Bizheva, K. Line-scanning SD-OCT for in-vivo, non-contact, volumetric, cellular resolution imaging of the human cornea and limbus. Biomed. Opt. Express 2022, 13, 4007–4020. [Google Scholar] [CrossRef] [PubMed]
- Tan, B.; Hosseinaee, Z.; Han, L.; Kralj, O.; Sorbara, L.; Bizheva, K. 250 kHz, 1.5 µm resolution SD-OCT for in-vivo cellular imaging of the human cornea. Biomed. Opt. Express 2018, 9, 6569–6583. [Google Scholar] [CrossRef]
- Ge, X.; He, J.; Chen, S.; Ni, G.; Xiong, Q.; Yang, J.; Yu, L.; Liu, L.; Bo, E. FMMAS-OCT: Aberration correction for high-resolution cellular imaging. Opt. Lasers Eng. 2024, 174, 107964. [Google Scholar] [CrossRef]
- Bouma, B.E.; de Boer, J.F.; Huang, D.; Jang, I.-K.; Yonetsu, T.; Leggett, C.L.; Leitgeb, R.; Sampson, D.D.; Suter, M.; Vakoc, B.J.; et al. Optical coherence tomography. Nat. Rev. Methods Primers 2022, 2, 79. [Google Scholar] [CrossRef] [PubMed]
- Klein, T.; Huber, R. High-speed OCT light sources and systems. Biomed. Opt. Express 2017, 8, 828–859. [Google Scholar] [CrossRef]
- Lee, H.C.; Liu, J.J.; Sheikine, Y.; Aguirre, A.D.; Connolly, J.L.; Fujimoto, J.G. Ultrahigh speed spectral-domain optical coherence microscopy. Biomed. Opt. Express 2013, 4, 1236–1254. [Google Scholar] [CrossRef]
- Ahsen, O.O.; Tao, Y.K.; Potsaid, B.M.; Sheikine, Y.; Jiang, J.; Grulkowski, I.; Tsai, T.-H.; Jayaraman, V.; Kraus, M.F.; Connolly, J.L.; et al. Swept source optical coherence microscopy using a 1310 nm VCSEL light source. Opt. Express 2013, 21, 18021–18033. [Google Scholar] [CrossRef] [PubMed]
- Zhang, Z.; Yang, X.; Zhao, Z.; Zeng, F.; Ye, S.; Baldock, S.J.; Lin, H.; Hardy, J.G.; Zheng, Y.; Shen, Y. Rapid imaging and product screening with low-cost line-field Fourier domain optical coherence tomography. Sci. Rep. 2023, 13, 10809. [Google Scholar] [CrossRef] [PubMed]
- Zhang, J.; Williams, B.M.; Lawman, S.; Atkinson, D.; Zhang, Z.; Shen, Y.; Zheng, Y. Non-destructive analysis of flake properties in automotive paints with full-field optical coherence tomography and 3D segmentation. Opt. Express 2017, 25, 18614–18628. [Google Scholar] [CrossRef] [PubMed]
- Tearney, G.J.; Brezinski, M.E.; Southern, J.F.; Bouma, B.E.; Hee, M.R.; Fujimoto, J.G. Determination of the refractive index of highly scattering human tissue by optical coherence tomography. Opt. Lett. 1995, 20, 2258–2260. [Google Scholar] [CrossRef] [PubMed]
- Lawman, S.; Dong, Y.; Williams, B.M.; Romano, V.; Kaye, S.; Harding, S.P.; Willoughby, C.; Shen, Y.-C.; Zheng, Y. High resolution corneal and single pulse imaging with line field spectral domain optical coherence tomography. Opt. Express 2016, 24, 12395–12405. [Google Scholar] [CrossRef]
- Yaqoob, Z.; Wu, J.; Yang, C. Spectral domain optical coherence tomography: A better OCT imaging strategy. Biotechniques 2005, 39, S6–S13. [Google Scholar] [CrossRef]
Figure 1.
Zemax design of OCT imaging path.
Figure 1.
Zemax design of OCT imaging path.
Figure 2.
System schematic diagram of LF-SD-OCM system for validating the imaging performance of selected imaging lens. RC: Reflective collimator; BS: Beam splitter; L1: Imaging lens f = 25 mm; L2: Camera tube lens f = 250 mm; M: Mirror; CL: Cylindrical lens f = 100 mm; G: Transmission grating; MS: Motorised stage; SLED: SLD light source; Camera: CMOS camera.
Figure 2.
System schematic diagram of LF-SD-OCM system for validating the imaging performance of selected imaging lens. RC: Reflective collimator; BS: Beam splitter; L1: Imaging lens f = 25 mm; L2: Camera tube lens f = 250 mm; M: Mirror; CL: Cylindrical lens f = 100 mm; G: Transmission grating; MS: Motorised stage; SLED: SLD light source; Camera: CMOS camera.
Figure 3.
System schematic diagrams of FF-TD-OCM system for validating the imaging performance of selected imaging lens. RC: Reflective collimator; BS: Beam splitter; L1: Imaging lens f = 25 mm; L2: Camera tube lens f = 250 mm; M: Mirror; MS: Motorised stage; LED: LED light source; Camera: CMOS camera.
Figure 3.
System schematic diagrams of FF-TD-OCM system for validating the imaging performance of selected imaging lens. RC: Reflective collimator; BS: Beam splitter; L1: Imaging lens f = 25 mm; L2: Camera tube lens f = 250 mm; M: Mirror; MS: Motorised stage; LED: LED light source; Camera: CMOS camera.
Figure 4.
Matrix spot diagrams of shortlisted lens candidates. The 14 rows correspond to the lenses listed in
Table 1. The columns show performance at different wavelengths from 750 nm to 900 nm. The
y-axis scale for each row is in micrometers (µm), with maximum scales of 10, 20, 40, or 100 µm. The black circles indicate the Airy disc radius. The Airy disc circle shown in each subfigure is included as a monochromatic reference scale for the corresponding wavelength.
Figure 4.
Matrix spot diagrams of shortlisted lens candidates. The 14 rows correspond to the lenses listed in
Table 1. The columns show performance at different wavelengths from 750 nm to 900 nm. The
y-axis scale for each row is in micrometers (µm), with maximum scales of 10, 20, 40, or 100 µm. The black circles indicate the Airy disc radius. The Airy disc circle shown in each subfigure is included as a monochromatic reference scale for the corresponding wavelength.
Figure 5.
PSFs of shortlisted lens candidates under broadband simulation conditions. The blue curves represent the normalized irradiance distributions, and the red horizontal lines indicate the FWHM of each PSF.
Figure 5.
PSFs of shortlisted lens candidates under broadband simulation conditions. The blue curves represent the normalized irradiance distributions, and the red horizontal lines indicate the FWHM of each PSF.
Figure 6.
Experimental lateral-resolution measurement of the selected Edmund Optics #85302 lens in the LF-SD-OCM system using a USAF 1951 target. (a) En face OCM image showing Groups 6–8 of the USAF target. The red dashed box marks the Group 8 region, which is enlarged in the lower-left inset for clearer visualization of the finest resolved features. The blue and red lines indicate the positions used to extract the intensity profiles along the line-illumination and lateral-scanning directions, respectively. (b) Corresponding normalized intensity profiles.
Figure 6.
Experimental lateral-resolution measurement of the selected Edmund Optics #85302 lens in the LF-SD-OCM system using a USAF 1951 target. (a) En face OCM image showing Groups 6–8 of the USAF target. The red dashed box marks the Group 8 region, which is enlarged in the lower-left inset for clearer visualization of the finest resolved features. The blue and red lines indicate the positions used to extract the intensity profiles along the line-illumination and lateral-scanning directions, respectively. (b) Corresponding normalized intensity profiles.
Figure 7.
Axial-resolution measurement of the selected Edmund Optics #85302 lens in the LF-SD-OCM system. (a) Normalized spectrum of the broadband SLD source. (b) Corresponding interference spectrum acquired from a single reflector. (c) Theoretical axial resolution from the source spectrum. The blue dashed lines show the Gaussian fits to the PSF. The blue line indicates the FWHM of the Gaussian fits. (d) Measured axial resolution from the interference spectrum. The red dashed lines show the Gaussian fits to the measured PSF. The red line denotes the FWHM of the Gaussian fits.
Figure 7.
Axial-resolution measurement of the selected Edmund Optics #85302 lens in the LF-SD-OCM system. (a) Normalized spectrum of the broadband SLD source. (b) Corresponding interference spectrum acquired from a single reflector. (c) Theoretical axial resolution from the source spectrum. The blue dashed lines show the Gaussian fits to the PSF. The blue line indicates the FWHM of the Gaussian fits. (d) Measured axial resolution from the interference spectrum. The red dashed lines show the Gaussian fits to the measured PSF. The red line denotes the FWHM of the Gaussian fits.
Figure 8.
Volumetric, cross-sectional, and en face comparison of onion epidermal tissue imaged using the proposed Edmund Optics #85302 lens and the reference Mitutoyo MY10X-823 objective. (A) Three-dimensional renderings of the volumetric datasets acquired with the two optical configurations. The dashed plane indicates the location of the representative B-scan, and the horizontal markers indicate the approximate positions of the en face slices shown in panel (C). (B) Representative B-scan images extracted from the corresponding volumes. (C) En face images acquired from the same ROI at depths of 0, 30, 60, 100, and 110 μm below the sample surface. In the superficial layers, both optical configurations reveal the elongated onion epidermal cell boundaries and overall cellular morphology, while image contrast and structural definition decrease at greater depths for both cases. Scale bars: 100 μm in (B) and 200 μm in (C). Display range: 50 to 85 dB.
Figure 8.
Volumetric, cross-sectional, and en face comparison of onion epidermal tissue imaged using the proposed Edmund Optics #85302 lens and the reference Mitutoyo MY10X-823 objective. (A) Three-dimensional renderings of the volumetric datasets acquired with the two optical configurations. The dashed plane indicates the location of the representative B-scan, and the horizontal markers indicate the approximate positions of the en face slices shown in panel (C). (B) Representative B-scan images extracted from the corresponding volumes. (C) En face images acquired from the same ROI at depths of 0, 30, 60, 100, and 110 μm below the sample surface. In the superficial layers, both optical configurations reveal the elongated onion epidermal cell boundaries and overall cellular morphology, while image contrast and structural definition decrease at greater depths for both cases. Scale bars: 100 μm in (B) and 200 μm in (C). Display range: 50 to 85 dB.
Figure 9.
Volumetric, cross-sectional, and en face comparison of ex vivo porcine corneal apex tissue imaged using the proposed Edmund Optics #85302 lens and the reference Mitutoyo MY10X-823 objective. (A) Three-dimensional renderings of the volumetric datasets acquired with the two optical configurations. The red arrows indicate the stromal interface, and the white arrows indicate keratocyte-like structural features within the stroma. (B) Representative B-scan images extracted from the corresponding volumes, where the red arrows indicate the stromal interface and the white arrows indicate keratocyte-like structural features. (C) En face images extracted after surface flattening at depths of 10, 35, and 120 μm within the stromal region. The red arrows in the 10 μm images indicate similar line-shaped reflective features visible in both optical configurations. The two datasets were acquired from different porcine eyes. Scale bars: 100 μm in (B) and 100 μm in (C). Display range: 45 to 75 dB.
Figure 9.
Volumetric, cross-sectional, and en face comparison of ex vivo porcine corneal apex tissue imaged using the proposed Edmund Optics #85302 lens and the reference Mitutoyo MY10X-823 objective. (A) Three-dimensional renderings of the volumetric datasets acquired with the two optical configurations. The red arrows indicate the stromal interface, and the white arrows indicate keratocyte-like structural features within the stroma. (B) Representative B-scan images extracted from the corresponding volumes, where the red arrows indicate the stromal interface and the white arrows indicate keratocyte-like structural features. (C) En face images extracted after surface flattening at depths of 10, 35, and 120 μm within the stromal region. The red arrows in the 10 μm images indicate similar line-shaped reflective features visible in both optical configurations. The two datasets were acquired from different porcine eyes. Scale bars: 100 μm in (B) and 100 μm in (C). Display range: 45 to 75 dB.


Figure 10.
Optical throughput comparison of three sample-arm optics measured using the LF-SD-OCM detection path. The main panel shows the returned spectral intensity recorded for the Edmund Optics #85302 lens, the Mitutoyo MY10X-823 objective, and the Nikon CFI Plan Fluor 10× objective, normalized to the peak value of the Edmund lens. Inset: wavelength-integrated returned signal for the three tested configurations.
Figure 10.
Optical throughput comparison of three sample-arm optics measured using the LF-SD-OCM detection path. The main panel shows the returned spectral intensity recorded for the Edmund Optics #85302 lens, the Mitutoyo MY10X-823 objective, and the Nikon CFI Plan Fluor 10× objective, normalized to the peak value of the Edmund lens. Inset: wavelength-integrated returned signal for the three tested configurations.
Figure 11.
FF-TD-OCM through focus comparison under 850 nm illumination. (a) Group 8 region of a USAF 1951 resolution target imaged using the proposed Edmund Optics #85302 lens and two reference 10× microscope objectives, Mitutoyo MY10X-823 and Nikon CFI Plan Fluor 10×, at defocus positions of −20, −10, 0, +10, and +20 μm relative to the nominal best-focus plane. (b) Normalized Michelson contrast as a function of defocus, calculated from a selected USAF element that remained reliably modulated across all three optics and all selected positions. The dashed line indicates the practical contrast-retention threshold of 0.5.
Figure 11.
FF-TD-OCM through focus comparison under 850 nm illumination. (a) Group 8 region of a USAF 1951 resolution target imaged using the proposed Edmund Optics #85302 lens and two reference 10× microscope objectives, Mitutoyo MY10X-823 and Nikon CFI Plan Fluor 10×, at defocus positions of −20, −10, 0, +10, and +20 μm relative to the nominal best-focus plane. (b) Normalized Michelson contrast as a function of defocus, calculated from a selected USAF element that remained reliably modulated across all three optics and all selected positions. The dashed line indicates the practical contrast-retention threshold of 0.5.
Table 1.
Lens candidate specifications.
Table 1.
Lens candidate specifications.
| Lens Model | Manufacturer | Focal Length (mm) | Clear Aperture (mm) | Numerical Aperture | Design Type |
|---|
| #85302 | Edmund Optics | 25 | 25 | 0.5 | Aspherized achromatic |
| #22487 | Edmund Optics | 30 | 25 | 0.417 | Achromatic |
| #49662 | Edmund Optics | 30 | 25 | 0.417 | Aspherized achromatic |
| #16980 | Edmund Optics | 25 | 25 | 0.5 | Aspheric |
| #16981 | Edmund Optics | 18.75 | 25 | 0.667 | Aspheric |
| #22996 | Edmund Optics | 22.5 | 15 | 0.333 | Aspheric |
| AC127-019-B | Thorlabs | 19 | 12.5 | 0.329 | Achromatic |
| AC127-025-B | Thorlabs | 25 | 12.5 | 0.25 | Achromatic |
| AC127-030-B | Thorlabs | 30 | 12.5 | 0.208 | Achromatic |
| AC254-030-B | Thorlabs | 30 | 25 | 0.417 | Achromatic |
| ACA254-030-B | Thorlabs | 30 | 25 | 0.417 | Achromatic doublet |
| ACA254-050-B | Thorlabs | 50 | 25 | 0.25 | Achromatic doublet |
| AL1225H-B | Thorlabs | 25 | 12.5 | 0.25 | Aspheric |
| AL2520H-B | Thorlabs | 20 | 25 | 0.625 | Aspheric |
Table 2.
Lens performance simulation results under polychromatic conditions.
Table 2.
Lens performance simulation results under polychromatic conditions.
| Lens Model | Airy Disc Radius (μm) | RMS Spot Size (μm) | Geometric Spot Size (μm) | FWHM of PSF
(μm) | Strehl Ratio |
|---|
| #85302 | 1.7 | 1.2 | 2.5 | 1.92 | 0.851 |
| #22487 | 1.2 | 40.3 | 48.6 | 1.75 | 0.002 |
| #49662 | 2.5 | 3.9 | 9 | 2.35 | 0.435 |
| #16980 | 1.06 | 15.2 | 38.4 | 2.18 | 0.138 |
| #16981 | 0.8 | 17.1 | 42.4 | 1.52 | 0.135 |
| #22996 | 1.49 | 6.8 | 15.1 | 1.8 | 0.194 |
| AC127-019-B | 1.66 | 8.3 | 18.3 | 1.38 | 0.086 |
| AC127-025-B | 2.19 | 2.6 | 5.5 | 1.84 | 0.707 |
| AC127-030-B | 2.64 | 1.3 | 3.6 | 2.28 | 0.942 |
| AC254-030-B | 2.33 | 15.5 | 25.4 | 1.71 | 0.081 |
| ACA254-030-B | 2.17 | 11.2 | 18.8 | 1.73 | 0.109 |
| ACA254-050-B | 2.48 | 0.9 | 1.9 | 3.8 | 0.964 |
| AL1225H-B | 2.35 | 6 | 15.4 | 2.52 | 0.237 |
| AL2520H-B | 1.54 | 7.3 | 18.8 | 1.87 | 0.148 |
| Disclaimer/Publisher’s Note: The statements, opinions and data contained in all publications are solely those of the individual author(s) and contributor(s) and not of MDPI and/or the editor(s). MDPI and/or the editor(s) disclaim responsibility for any injury to people or property resulting from any ideas, methods, instructions or products referred to in the content. |



 ,
,