Article

A Refined Methodological Approach for Terahertz Spectroscopy of Liquid Biosamples

1
Department of Physics and Mathematics, Center for Photonics Sciences, University of Eastern Finland, Yliopistokatu 2, 80101 Joensuu, Finland
2
School of Computing, University of Eastern Finland, Länsikatu 15, 80110 Joensuu, Finland
*
Author to whom correspondence should be addressed.
Photonics 2026, 13(4), 373; https://doi.org/10.3390/photonics13040373
Submission received: 22 February 2026 / Revised: 26 March 2026 / Accepted: 7 April 2026 / Published: 14 April 2026
(This article belongs to the Section Biophotonics and Biomedical Optics)

Abstract

Terahertz time-domain spectroscopy (THz-TDS) has emerged as a powerful tool for probing hydrated materials and biological tissues, where water dynamics dominate the dielectric response. This study focuses on improving the methodology of THz-TDS by replacing conventional cuvettes, which introduce unwanted absorption, reflections, and liquid bubbles that must be accounted for during measurement interpretation, with nitrocellulose membranes of various pore sizes. The membranes were hydrated with deionized water and sealed with food-grade cling film, and their transmission properties were measured using THz-TDS. To interpret the measurements, transfer matrix method simulations were performed using the optical constants of water reported by some experimentalists, allowing verification of our data. The findings for deionized water highlight the reliability of the methodology. Our results demonstrate that nitrocellulose membranes provide stable and reproducible transmission measurements in good agreement with theoretical reference models, supported by weight retention studies and reproducibility tests conducted in spatial, temporal, and random measurement conditions. These improvements contribute to the development of more robust THz-TDS approaches for hydrated biological materials and suggest future applications in non-invasive tissue hydration monitoring and biomedical diagnostics.

1. Introduction

Terahertz (THz) technology has gained growing attention as a powerful tool bridging the gap between electronics and photonics [1]. Operating in the 0.1–10 THz frequency range, THz radiation is non-ionizing, highly sensitive to polar molecules, and capable of probing low-energy excitations in matter [2]. These characteristics have led to applications in material science, security screening, and, increasingly, biomedical diagnostics [3,4]. The development of reliable terahertz methodologies for liquid biosamples is an ongoing area of research, as most biological samples, including saliva, blood plasma, urine and tears, are water-based. Accordingly, the focus of this study is not the investigation of water itself, but the establishment of a refined experimental approach for liquid biosample THz measurements. Water is used as a reference model due to its dielectric response in the THz range from previous studies, enabling direct comparison with our experimental results.
From a practical point of view, this frequency range is often called the THz gap, which lies between the microwave and infrared regions. Until recently, the gap was technologically underutilized as a result of a lack of efficient sources and detectors. However, advances in photoconductive antennas, femtosecond laser systems, and nonlinear optical materials have enabled broadband terahertz time-domain spectroscopy (THz-TDS) systems capable of probing this range with high signal-to-noise ratios [5]. The 0.2–2 THz range is also favorable for non-destructive evaluation, security screening, and material characterization due to its moderate penetration through dielectrics, polymers, and biological tissues, while remaining non-ionizing [6]. In addition, many materials exhibit distinct spectral “fingerprints” in this range, allowing for spectral discrimination and chemical identification. This is especially important in pharmaceuticals, biomedical diagnostics, and explosives detection [7].
Most studies employ window-based liquid cells to control sample thickness [8], while others highlight membrane-based approaches to reduce multiple reflections and background interference [9]. A frequently used substrate in optical and THz spectroscopy is crystalline quartz, i.e., cuvettes, primarily due to its mechanical and optical stability. However, quartz is suboptimal for THz applications that exhibit a relatively high refractive index in the THz range ( n 1.9 2.1 ) [10], causing substantial reflection losses at the interface with air. These limitations are particularly problematic when studying water and hydrated bio-tissues, where background substrate effects can overshadow delicate dielectric features. Chua et al. [11] were among the first to employ THz-TDS in transmission mode to measure the absorption spectra of wheat particles within the 0.1–2.0 THz frequency range. They analyzed the difference between the spectra of wet and dried wheat samples to explore how absorption correlates with the moisture content. Zahid et al. [12] utilized THz absorption spectra to monitor the water content and properties in plant leaves over a four-day period. By calculating dielectric constants, they observed an increase in the transmissivity of THz waves in leaf samples over time, alongside reductions in leaf weight and thickness, as well as morphological changes in both fresh and water-stressed leaves. Markelz [13] provided a comprehensive review of the application of THz spectroscopy to investigate biomolecular structure and function. The paper highlighted how dielectric responses depend on collective vibrational modes and relaxation processes, emphasizing the influence of temperature, hydration, molecular binding, and conformational changes.
In the THz frequency range (0.1–10 THz), water exhibits visible absorption properties due to its rotational and vibrational degrees of freedom. These include librational motions (restricted rotations), relaxation processes of the molecular dipole, and collective hydrogen-bond network vibrations [14]. This makes water both a challenge and an opportunity in THz spectroscopy transmission due to high absorption, but it also serves as a sensitive probe for studying hydration dynamics and interactions in biological systems [13,15].
Understanding water’s interaction with THz radiation is crucial for applications ranging from biomolecular hydration-shell analysis to non-invasive detection of water content in pharmaceutical and agricultural materials [16]. Moreover, characterization of the complex dielectric function of water has become a basis of THz spectroscopy because water dominates absorption in the THz and microwave regions. One of the foundational contributions came from Buchner et al. [17], who provided empirical measurements of the dielectric properties of water across a broad frequency spectrum, from megahertz (MHz) to gigahertz (GHz). Their study focused on dielectric relaxation behavior in bulk water at room temperature and low frequency ranges, using vector network analyzer techniques. This data served as a basis for understanding water’s dipolar relaxation and laid the groundwork for extrapolation to higher frequencies.
In the context of this work, the use of deionized water (DIW) on nitrocellulose (NC) membranes/substrates serves as a simplified model system for characterizing the dielectric properties of hydrated biological tissues. Leveraging previously obtained data on dielectric properties of water [18,19] for simulation and fitting provides a strong theoretical foundation for extracting and interpreting dielectric functions from experimental THz-TDS data. The complex dielectric function was evaluated using
ε ( w ) = η 2 ,
where
η = n + i κ .
Here, ε ( ω ) is the complex frequency-dependent dielectric function, η is the complex refractive index, n is the real part of the refractive index describing wave propagation in the medium, κ is the extinction coefficient accounting for absorption losses, and i is the imaginary unit.
NC membranes have emerged as a viable alternative sample-holding substrate in THz-TDS, especially when working with minute quantities of biological material or aqueous solutions. Zhao et al. [9] demonstrated the effectiveness of NC membranes for detecting α -lactose in aqueous media using THz-TDS, noting their compatibility with small sample volumes and reduced signal attenuation compared to conventional polyethylene pellets or liquid cells. Their study explored membranes of varying pore sizes (0.1 μm, 0.2 μm, and 0.45 μm), finding that increased pore size generally led to stronger absorption peaks. The hydrophilic nature and biological compatibility of NC membranes, together with their low THz background response, make them highly suitable for bio-spectroscopic applications. This is particularly advantageous for the direct measurement of hydrated specimens, where conventional liquid handling cells often introduce additional complexity.
This work addresses challenges related to measuring transmission spectra of liquid samples in the THz range. Using THz-TDS, we investigate transmission spectra of water confined within a porous NC membrane. Specifically, for confining liquid samples in THz-TDS, we investigate the use of porous NC membranes as an alternative to cuvettes. Compared with crystalline quartz, NC membranes provide low background absorption, strong water retention, and reduced Fresnel reflection losses, rendering them promising substrates for hydrated bio-spectroscopy [9]. Using experimental THz-TDS measurements of DIW confined within NC membranes, we benchmark measured transmission response against established optical and dielectric reference data reported by Bertie and Lan [18] and Zhou et al. [19]. To compare simulated and experimental transmission spectra, we modeled the dielectric responses via the transfer matrix method (TMM).
In this work, we focus on methodological innovations in spectroscopy with THz transmission, especially in terms of substrate material choice, sample containment, and signal processing with analysis in the 0.2–2 THz range. This frequency window has emerged as a core operational range in THz spectroscopy and imaging. The reason is its unique balance between penetration depth, spectral resolution, and source/detector availability. This spectral region corresponds to photon energies of approximately 0.8 to 4 meV, which align well with low-frequency molecular vibrations, phonon modes, hydrogen bonding dynamics, and rotational modes of polar molecules [16]. As such, it is susceptible to collective dynamics in biomolecules, liquid water, hydrogen-bonded networks, and low-energy excitations in semiconductors and dielectrics [20].
Unlike conventional liquid cells that rely on rigid cuvettes with fixed path lengths, the present work introduces a membrane-confined, sealed liquid configuration that minimizes multiple reflections and bubble formation. The novelty of this study lies in experimentally validating this configuration through systematic pore size comparison, gravimetrically determined effective thickness, and transfer matrix analysis to assess spectral consistency. The goal is not to redefine water dielectric properties, but to establish a robust methodology for hydrated biological samples in THz-TDS measurements.

2. Materials and Methods

THz-TDS was employed as the primary spectroscopic technique to investigate hydrated NC membranes. Unlike intensity-based spectroscopies, THz-TDS measures the transient electric field of a THz pulse in the time domain, enabling extraction of both amplitude and phase information [21]. Broadband THz pulses (0.2–3 THz) were generated and detected using photoconductive antennas gated by sub-100 fs near-infrared (NIR) pulses. This configuration provided sub-picosecond resolution, essential for determining the complex transmission spectra of aqueous samples.

2.1. Experimental Setup

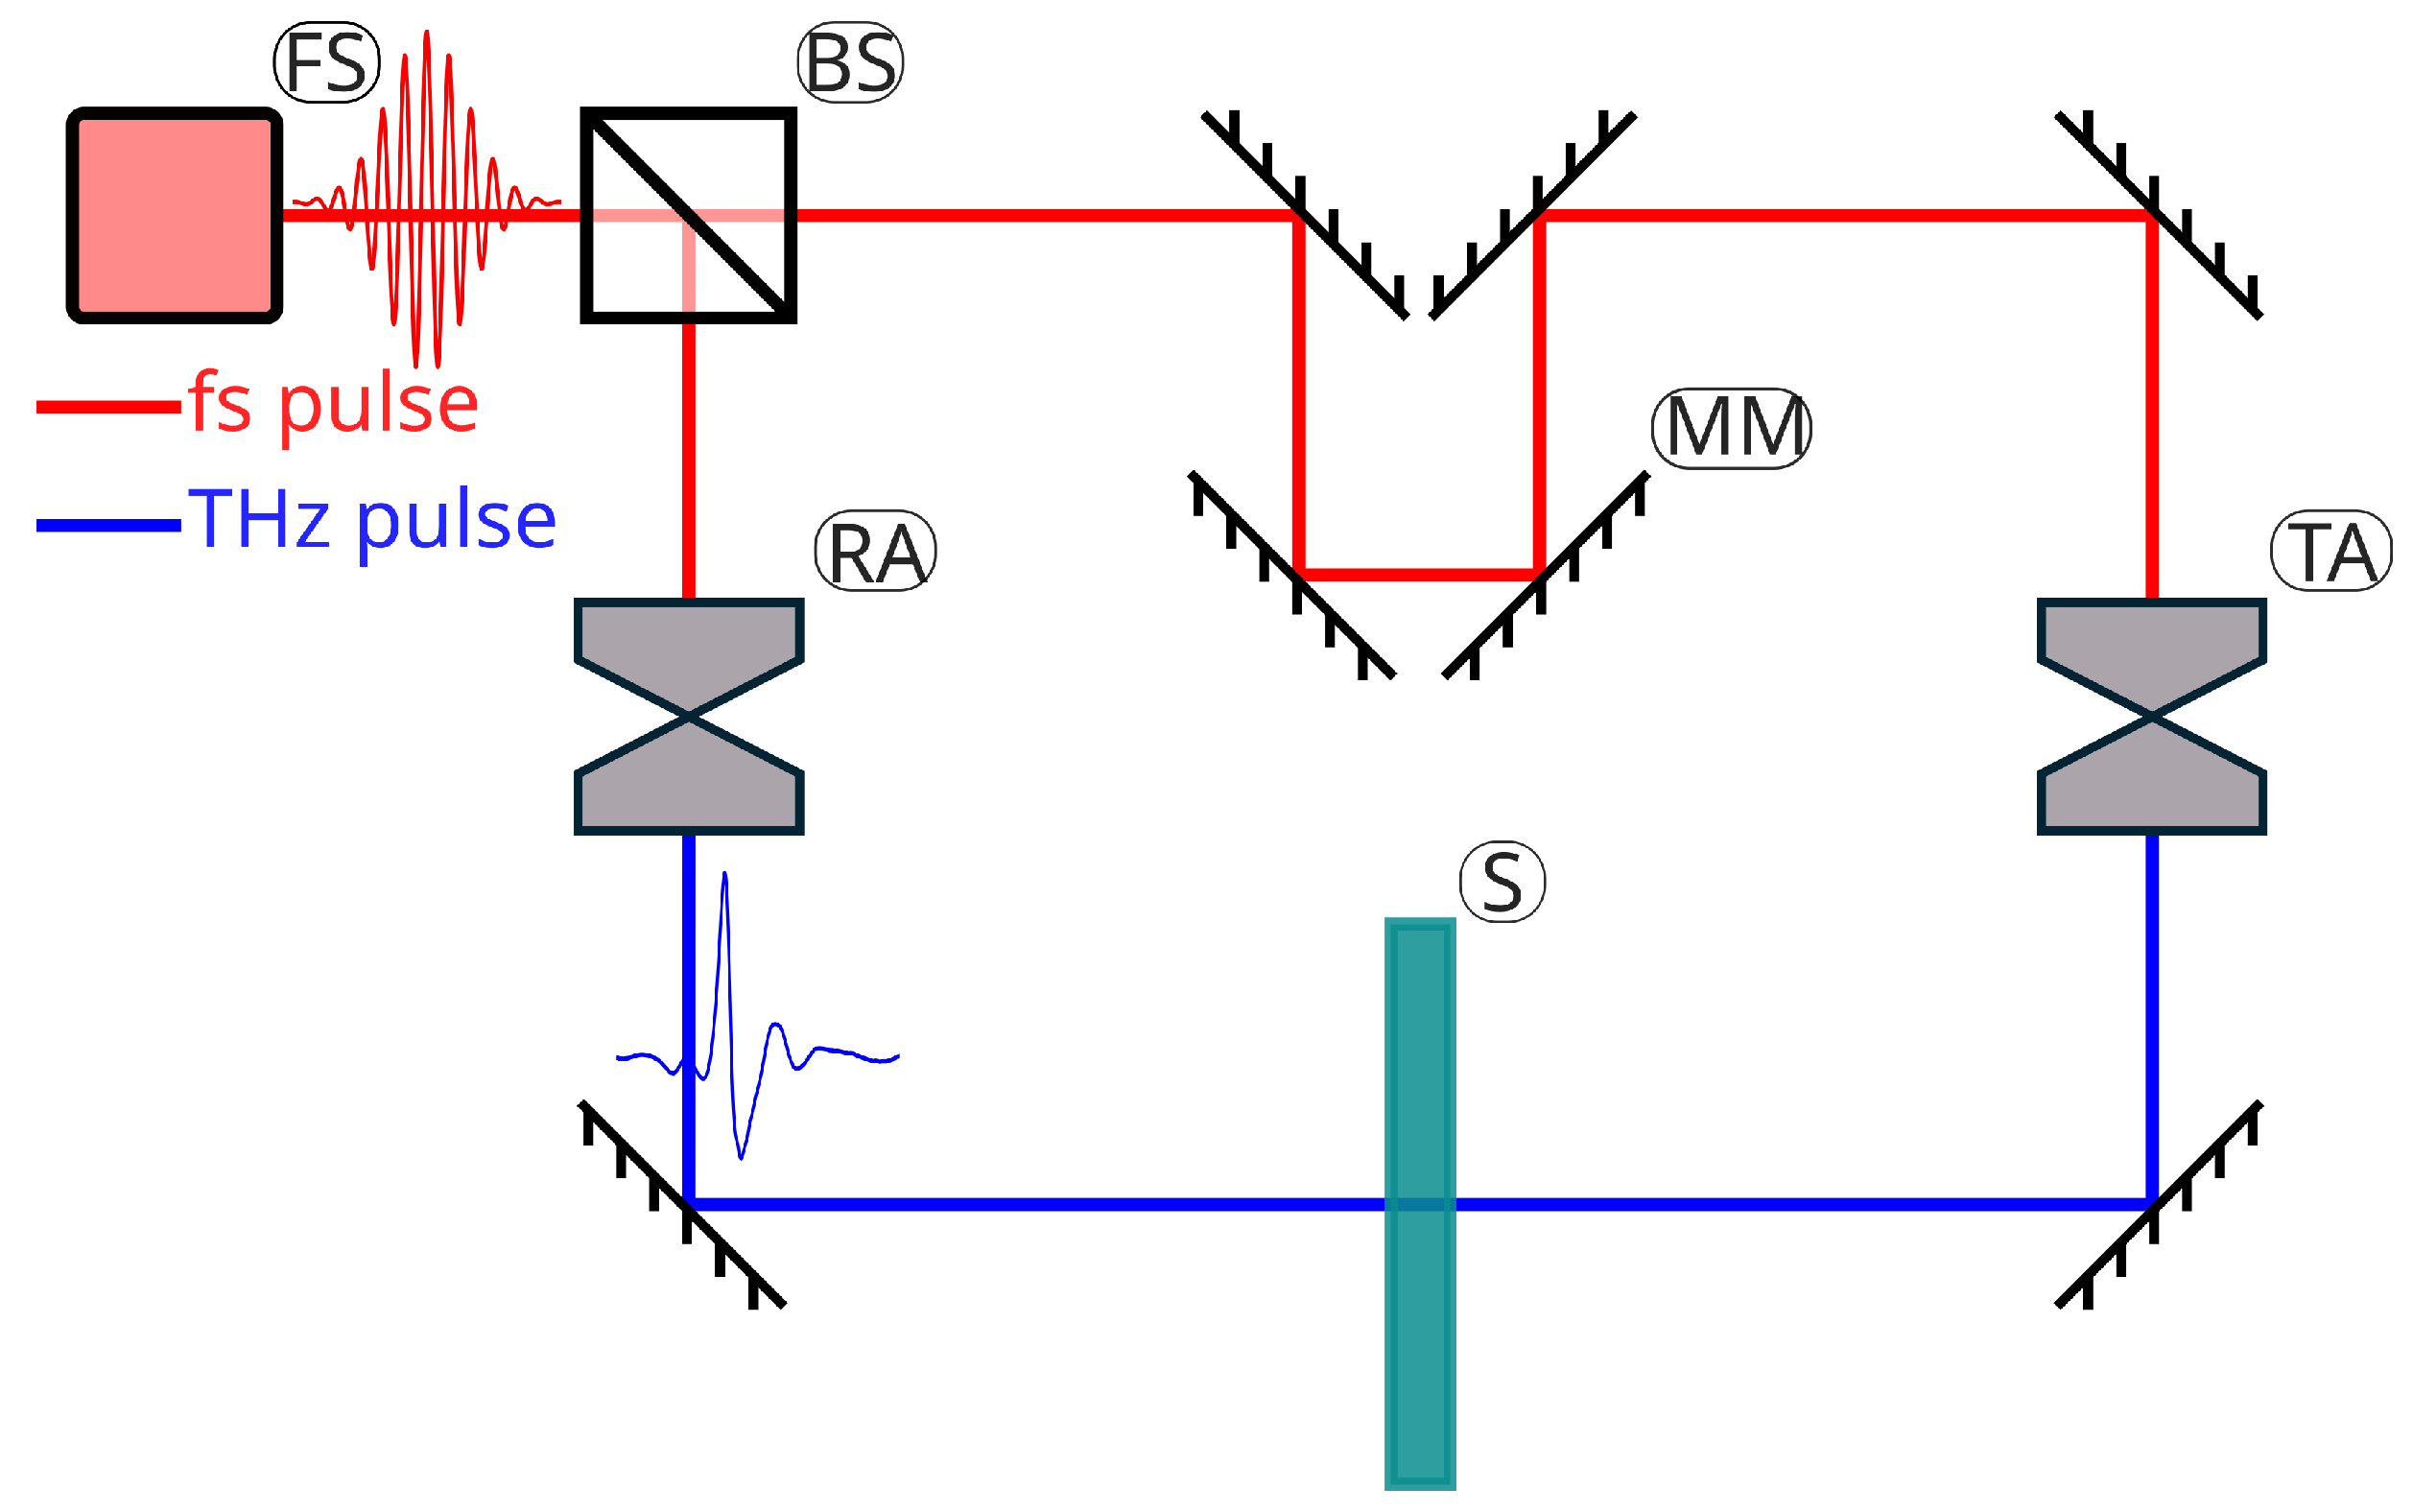
A schematic of the setup is shown in Figure 1, and the corresponding operational principle is presented in Section 2.2. The femtosecond laser pulse is split into pump and probe arms by a beam splitter. The pump beam excites the transmitter antenna (TA), generating a THz pulse, which propagates through the sample and is detected at the receiver antenna (RA). The probe beam is directed through a delay stage to introduce a variable optical path length, enabling temporal sampling of the THz waveform. To reduce moisture, the entire system is enclosed in a purge box flushed with dry air.
The THz-TDS system was driven by a femtosecond laser source operating at 780 nm with a pulse duration of 80 fs, repetition rate of 80 MHz, and average output power of 140 mW. THz radiation was generated and detected using photoconductive antennas based on GaAs on Si-GaAs, biased at a ±40 V square wave signal.
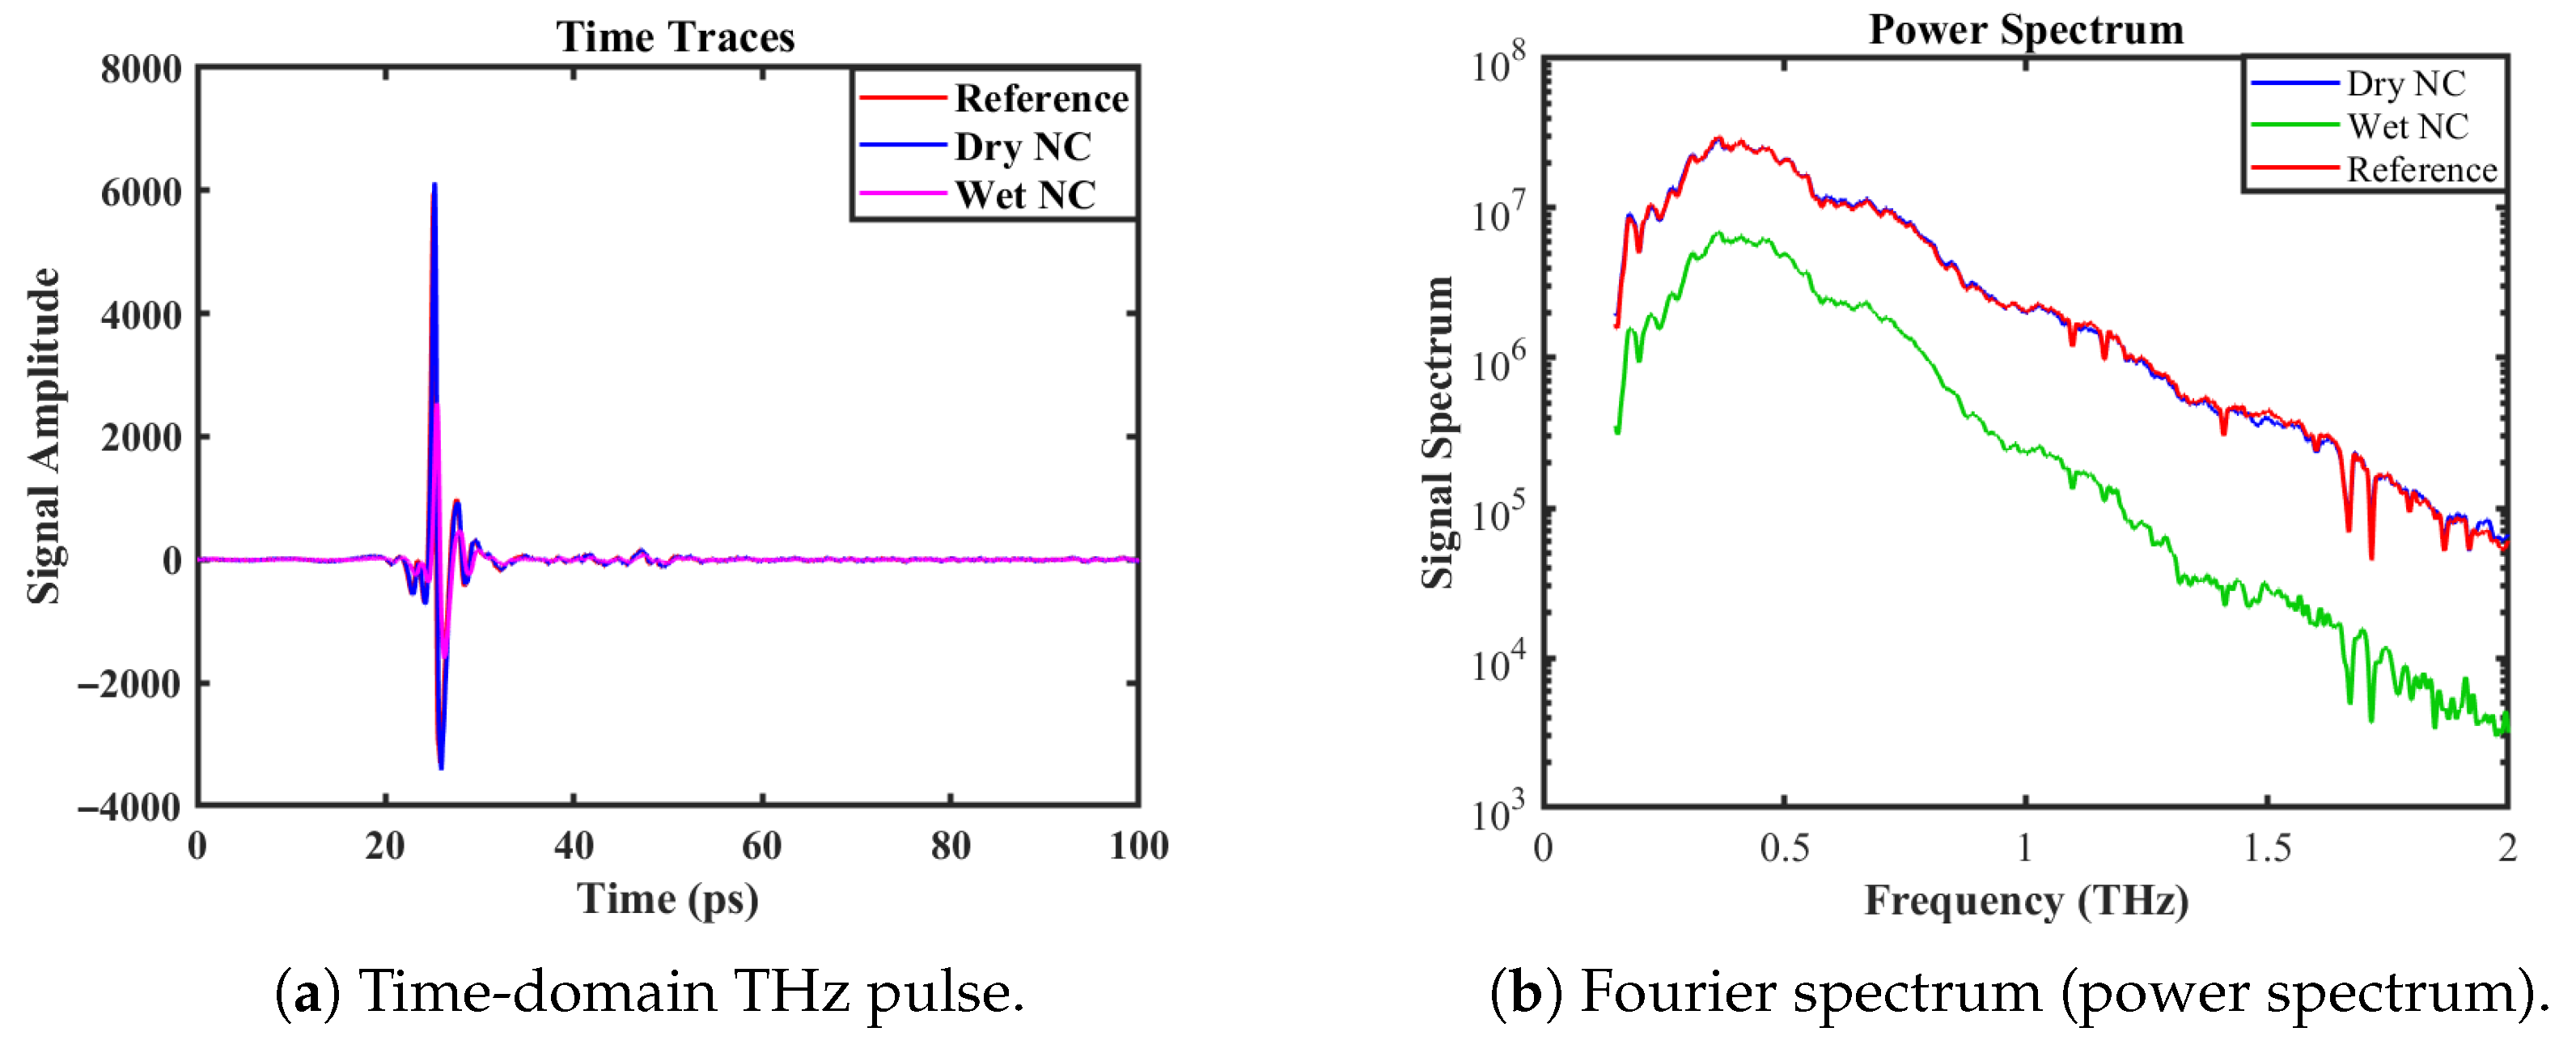
The measured time-domain THz pulse and its corresponding Fourier amplitude spectrum are shown in Figure 2. The usable spectral bandwidth extends from approximately 2 to 4 THz, with a central frequency near 0.4 THz. These parameters define the effective frequency window for the transmission measurements reported in this study.

2.2. Operational Principle

At the transmitter, the pump beam illuminated a biased photoconductive antenna, producing a broadband THz pulse. This pulse traversed the sample before reaching the receiver antenna. The probe beam, time-delayed using a movable mirror in the delay stage, reached the receiver antenna and generated photo-excited carriers. The measured photocurrent was proportional to the instantaneous electric field of the THz pulse. Scanning the delay enabled reconstruction of the complete time-domain waveform.

2.3. Sample Preparation

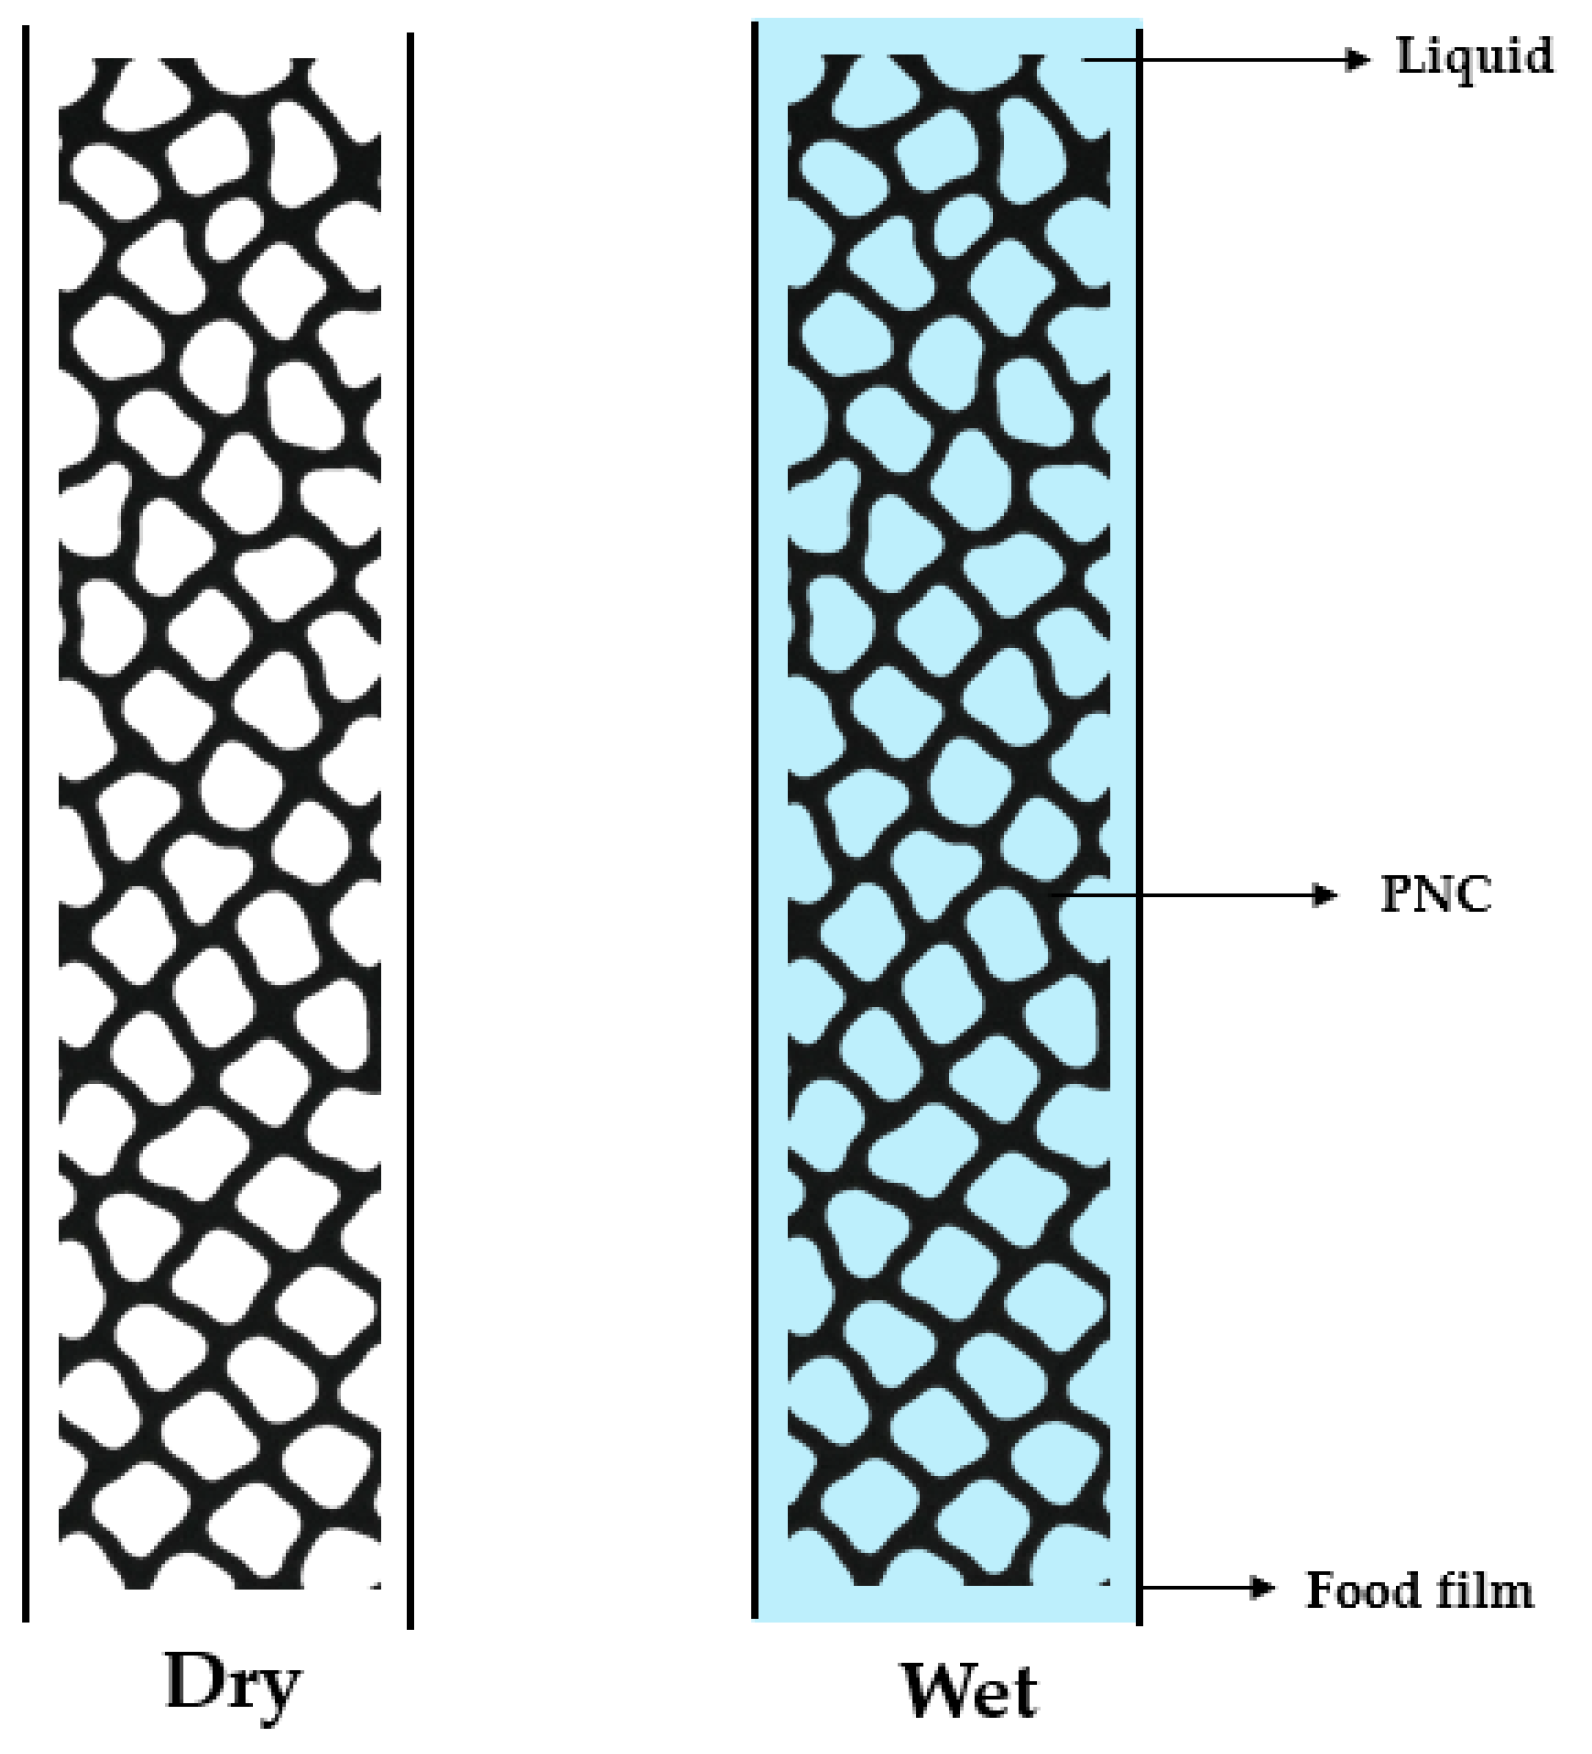
Porous NC membranes (Amersham Protran, Cytiva, Marlborough, MA, USA) with pore sizes of 0.1, 0.2, and 0.45 μm were used as sample substrates [22]. Membranes were hydrated by immersion in deionized water (DIW) until saturated and then sealed between polyethylene films (food-grade cling film) to reduce evaporation during measurement. Figure 3 shows a scheme of the NC membrane with and without the sample.
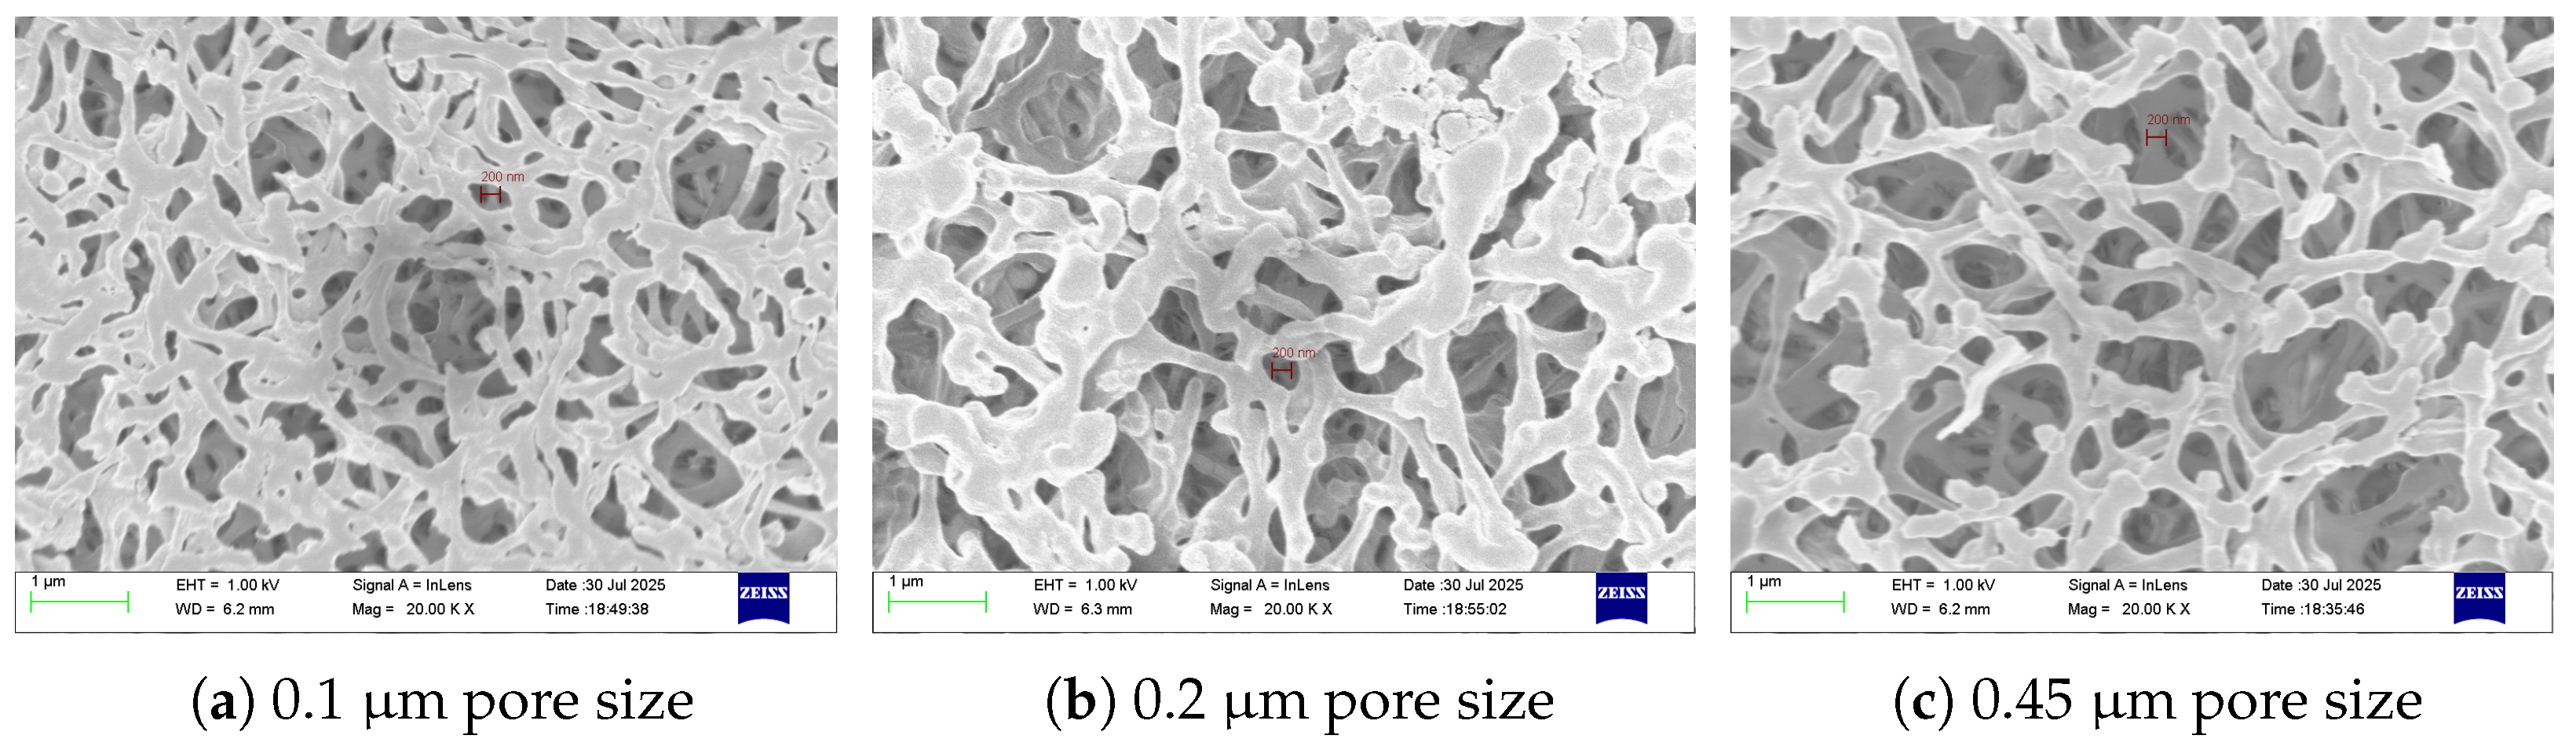
Scanning Electron Microscopy (Zeiss LEO Gemini 1550, Carl Zeiss AG, Oberkochen, Germany) was used to visualize the surface morphology and pore structure of the NC membranes (Figure 4). A thin conductive coating of chromium was deposited onto the membrane surface via sputtering. This step was necessary to prevent surface charging under the electron beam, which can otherwise distort the imaging of non-conductive polymeric samples. The sputter-coated membranes were then imaged under high vacuum, allowing a clear resolution of the pore distribution and membrane texture.

Rationale for Selection

NC membranes were chosen over quartz substrates due to:
1.
Low Reflectance: Their refractive index is closer to water and air, reducing Fabry-Pérot interference [23].
2.
Biological Relevance: Widely used in biochemical assays, NC membranes provide physiologically relevant hydration environments [9,24,25].
3.
Hydration Retention: The porous matrix of NC membranes preserves water during measurement, simulating the hydration states of biological tissues.

2.4. Sample Holder

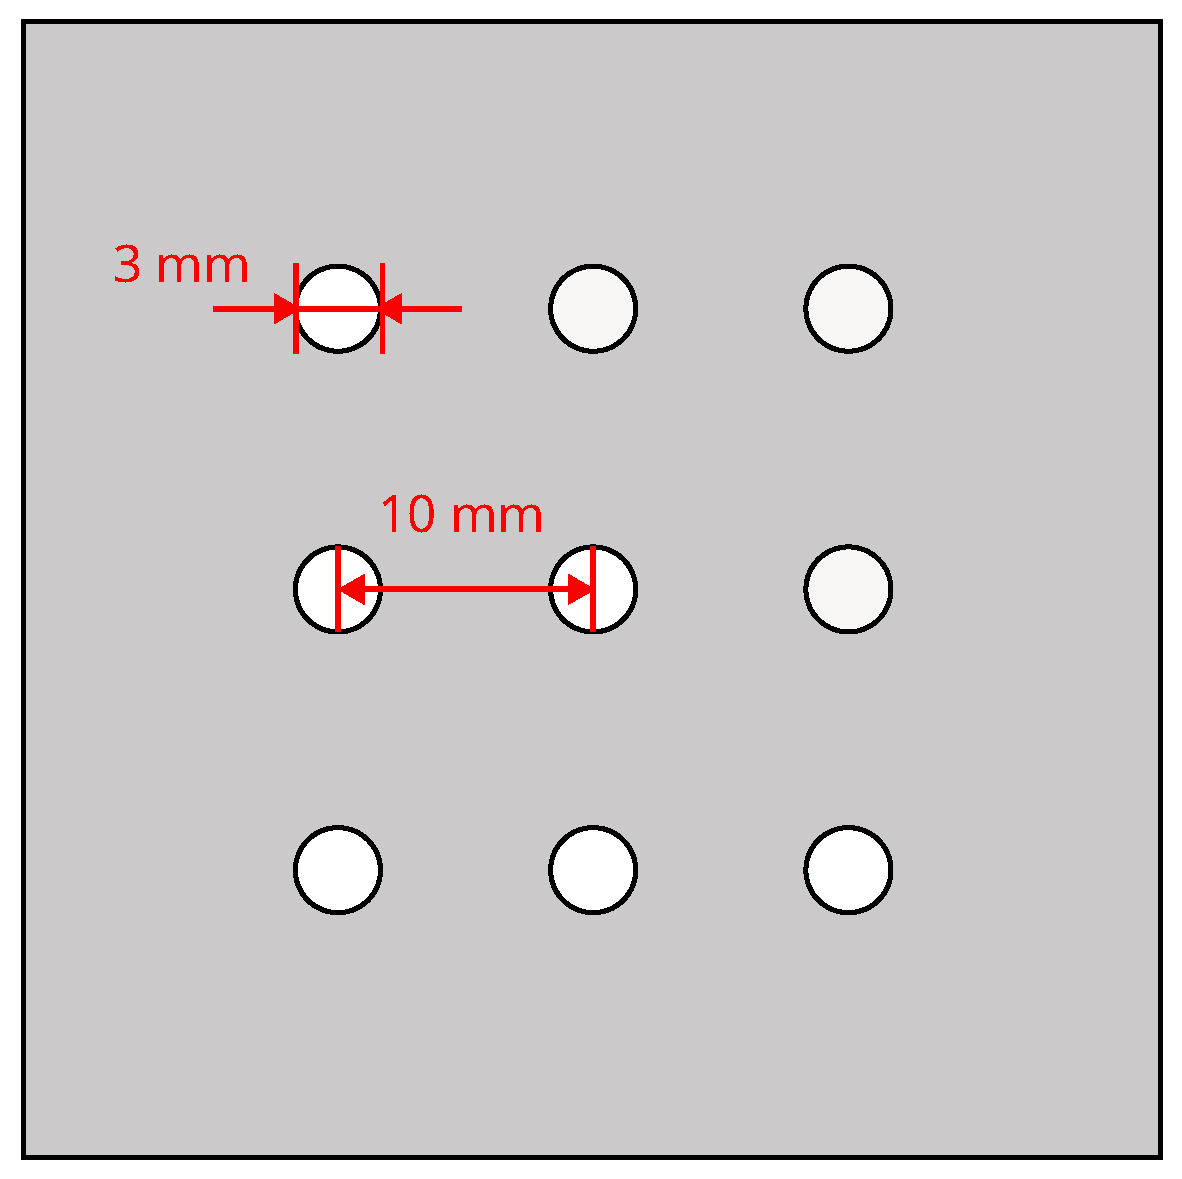
The samples were mounted on a custom steel aperture plate (Figure 5) with nine circular apertures (3 mm diameter, 10 mm spacing). The aperture diameter exceeded the THz wavelength, satisfying Rayleigh criteria for transmission measurements.

2.5. Water Effective Thickness Measurements

To model wave propagation through a water layer, the thickness of the water is a required parameter. We took measurements of water weight absorbed by different pore sizes with different areas using the Sartorius 2432 balance (Sartorius AG, Göttingen, Germany). The effective height of the water (DIW) was calculated using Equation (3), which was equated to the thickness of the water.
H e f f = Mass of Water Area of Paper × Density of Water .
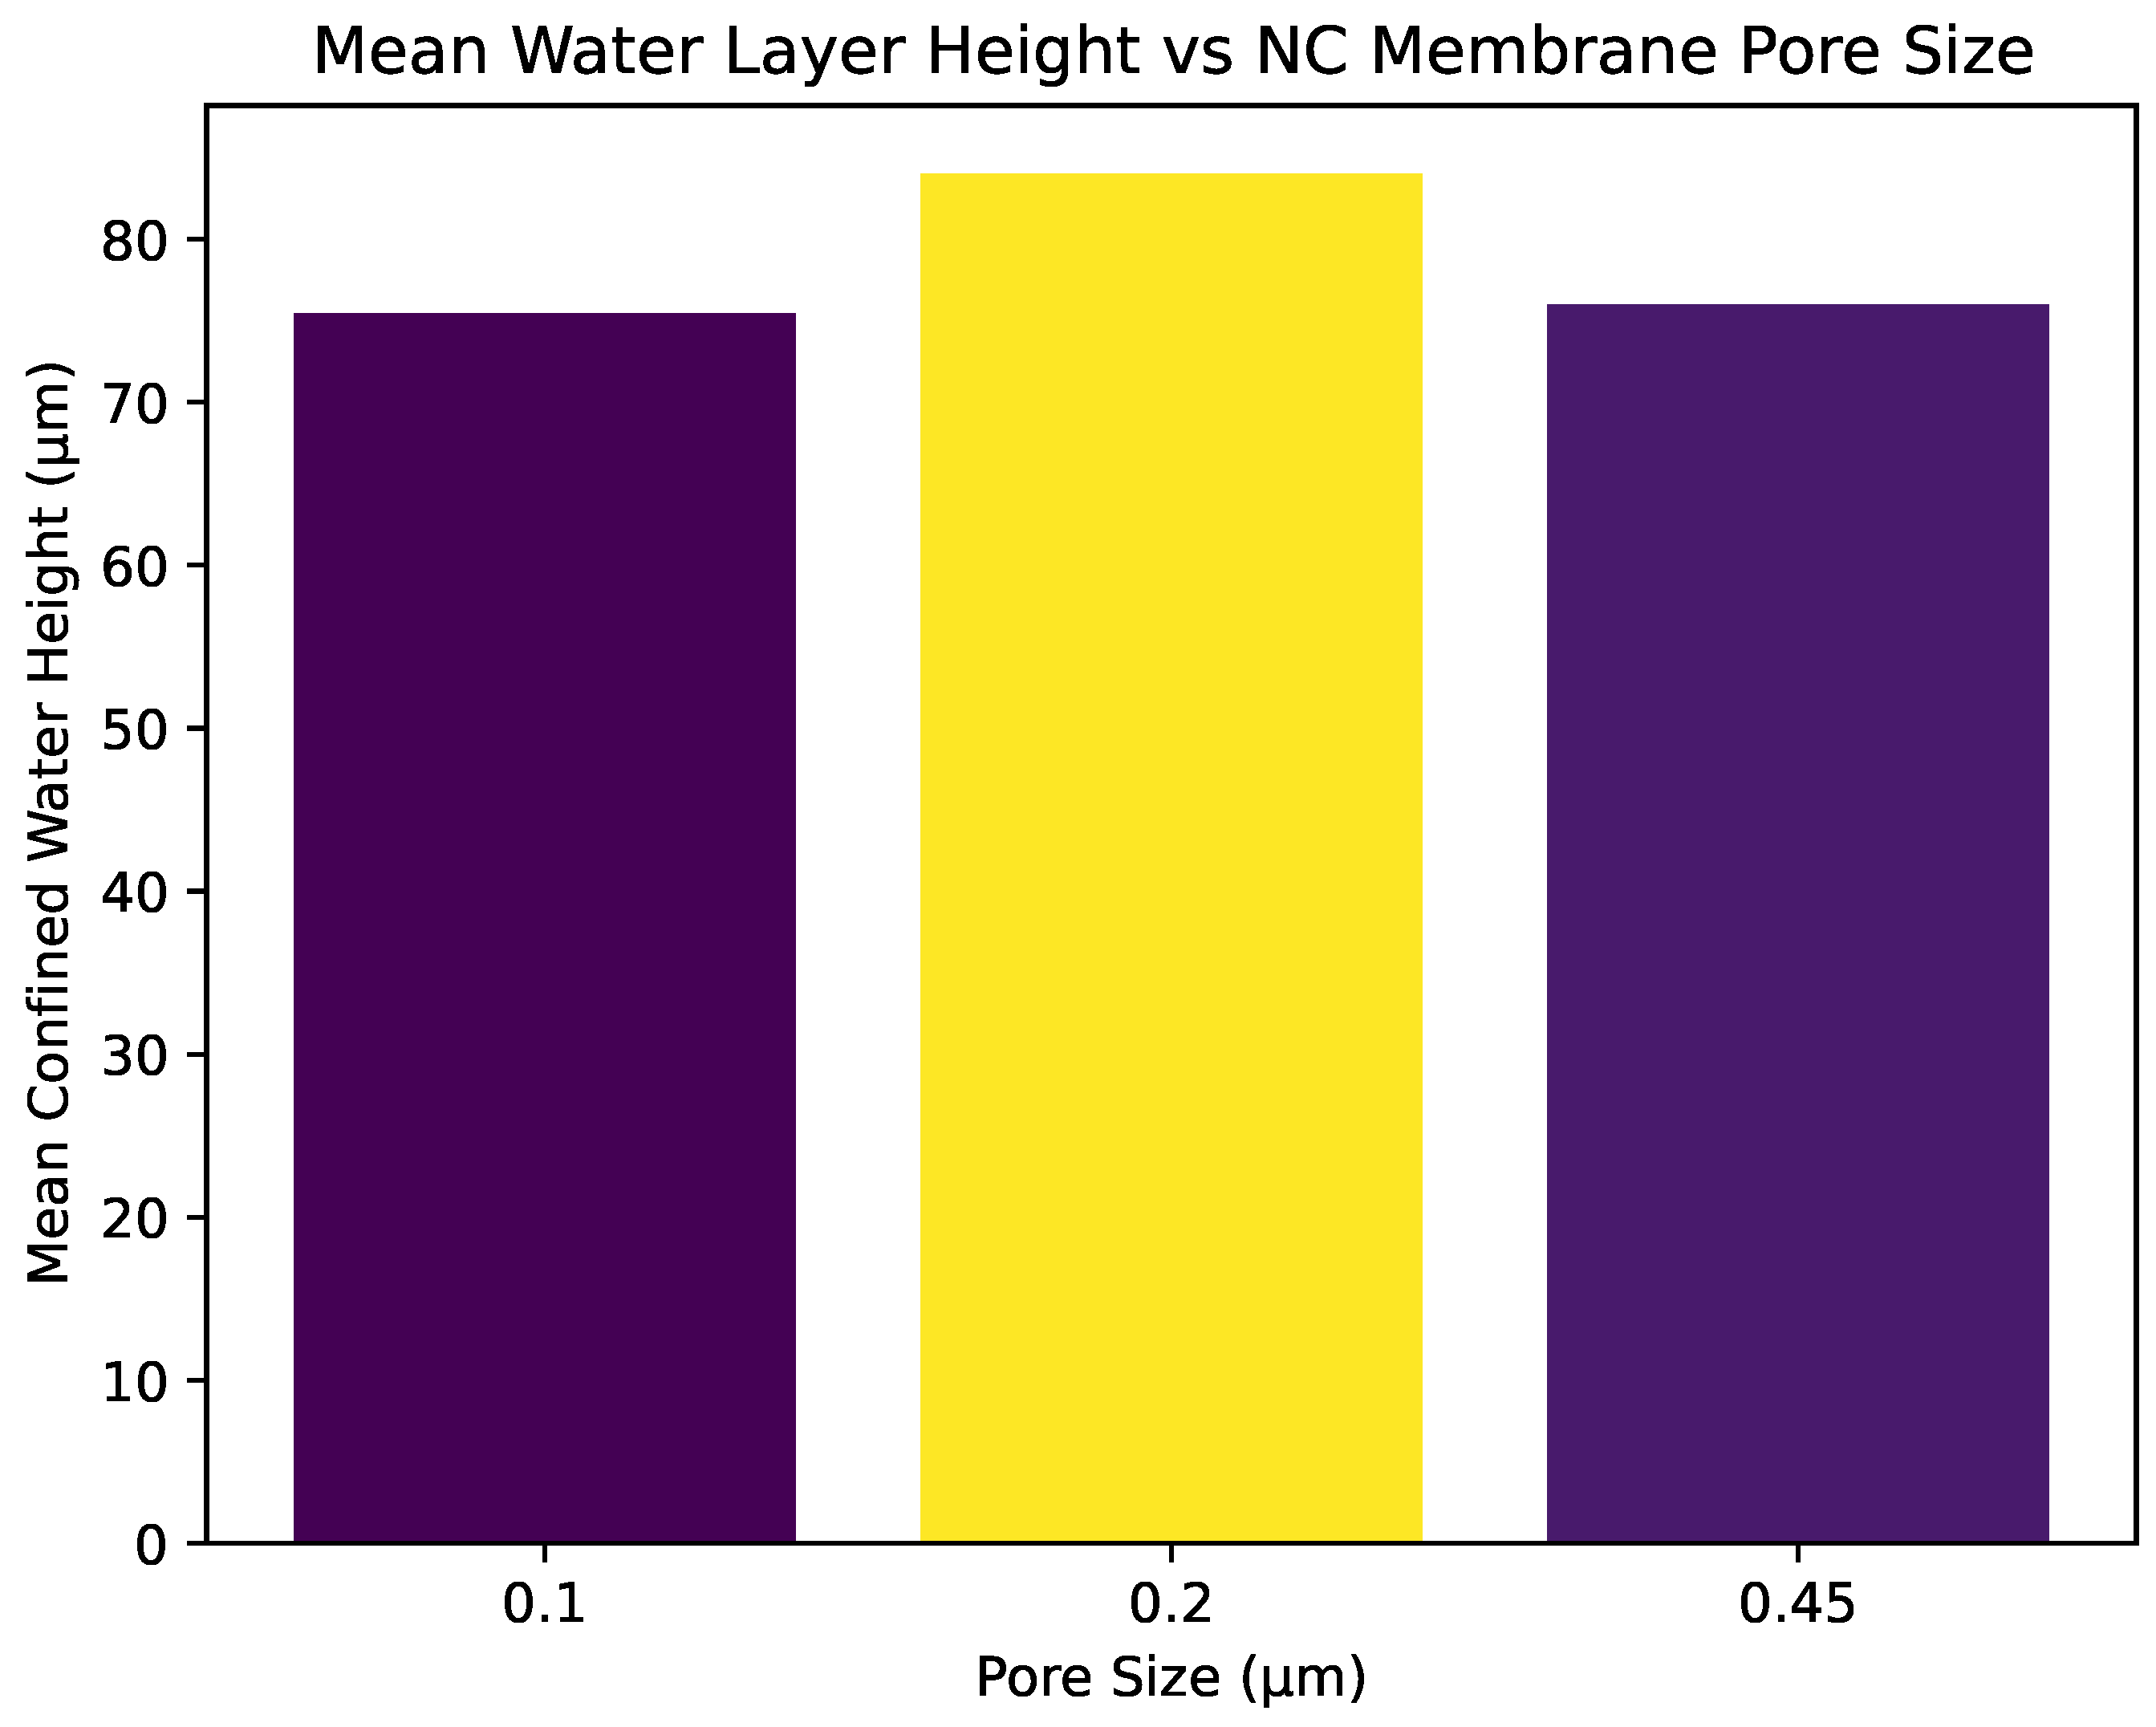
The resulting data are presented in Table 1 and Figure 6 below.

2.6. Measurements and Data Acquisition

The laser system was stabilized by a warm-up period of 90 min before data collection. The samples were aligned on the aperture plate, leaving one aperture uncovered (empty) for reference measurements. To minimize terahertz radiation absorption by water vapor, the purge box was flushed with dry air for 90 min prior to measurements.
The recorded THz signals (as shown in Figure 2) were acquired in the time domain as the electric field E ( t ) transmitted through the sample and through an empty reference aperture. Each time-domain waveform (time trace) was converted to the frequency domain by applying a discrete Fourier transform,
S ( ω k ) = t n = 0 N 1 E ( t n ) e i ω k t n ,
where t n = n t is the discrete time sampling, t is the temporal step size, N is the total number of samples, and ω k = 2 π k N t is the discrete angular-frequency grid. Applying this transform to the sample and reference signals yields the spectra S s ( ω ) and S r ( ω ) , respectively. The frequency-dependent transmission spectrum was then obtained as
T ( ω ) = | S s ( ω ) | 2 | S r ( ω ) | 2 .

2.7. Simulation Using Optical Constants from Other Works

Bertie and Lan [18] presented one of the most detailed experimental characterizations of the optical constants of liquid water in the far-infrared-to-THz region. Their study provided tabulated data for the real (n) and imaginary ( κ ) components of the complex refractive index, derived from highly controlled absorbance and reflectance measurements of water layers using Attenuated Total Reflection (ATR) and Fourier transform infrared (FTIR) spectroscopy. Also, Zhou et al. [19] conducted a systematic study of THz-TDS transmission of liquid water to quantify how its optical and dielectric properties vary with temperature. Using a temperature-controlled THz time-domain system (0.2–2.4 THz), they measured the refractive index, absorption coefficient, and complex dielectric function of water across 275–340 K. Their results showed clear increases in refractive index, absorption, and dielectric constant with rising temperature, reflecting changes in hydrogen bond dynamics and molecular relaxation processes. The experimental data were well reproduced by a double-Debye relaxation model, confirming its suitability to describe the water temperature-dependent THz response.
These optical constants are directly relevant for simulating THz transmission spectra through water. In this work, the data provided by Bertie et al. and Zhou et al. at room temperature were imported into MATLAB R2023b and used on the dielectric function given in Equations (1) and (2) to simulate transmission, which served as the theoretical model against which our experimental THz spectra were fitted.

2.7.1. Transfer Matrix Method (TMM)

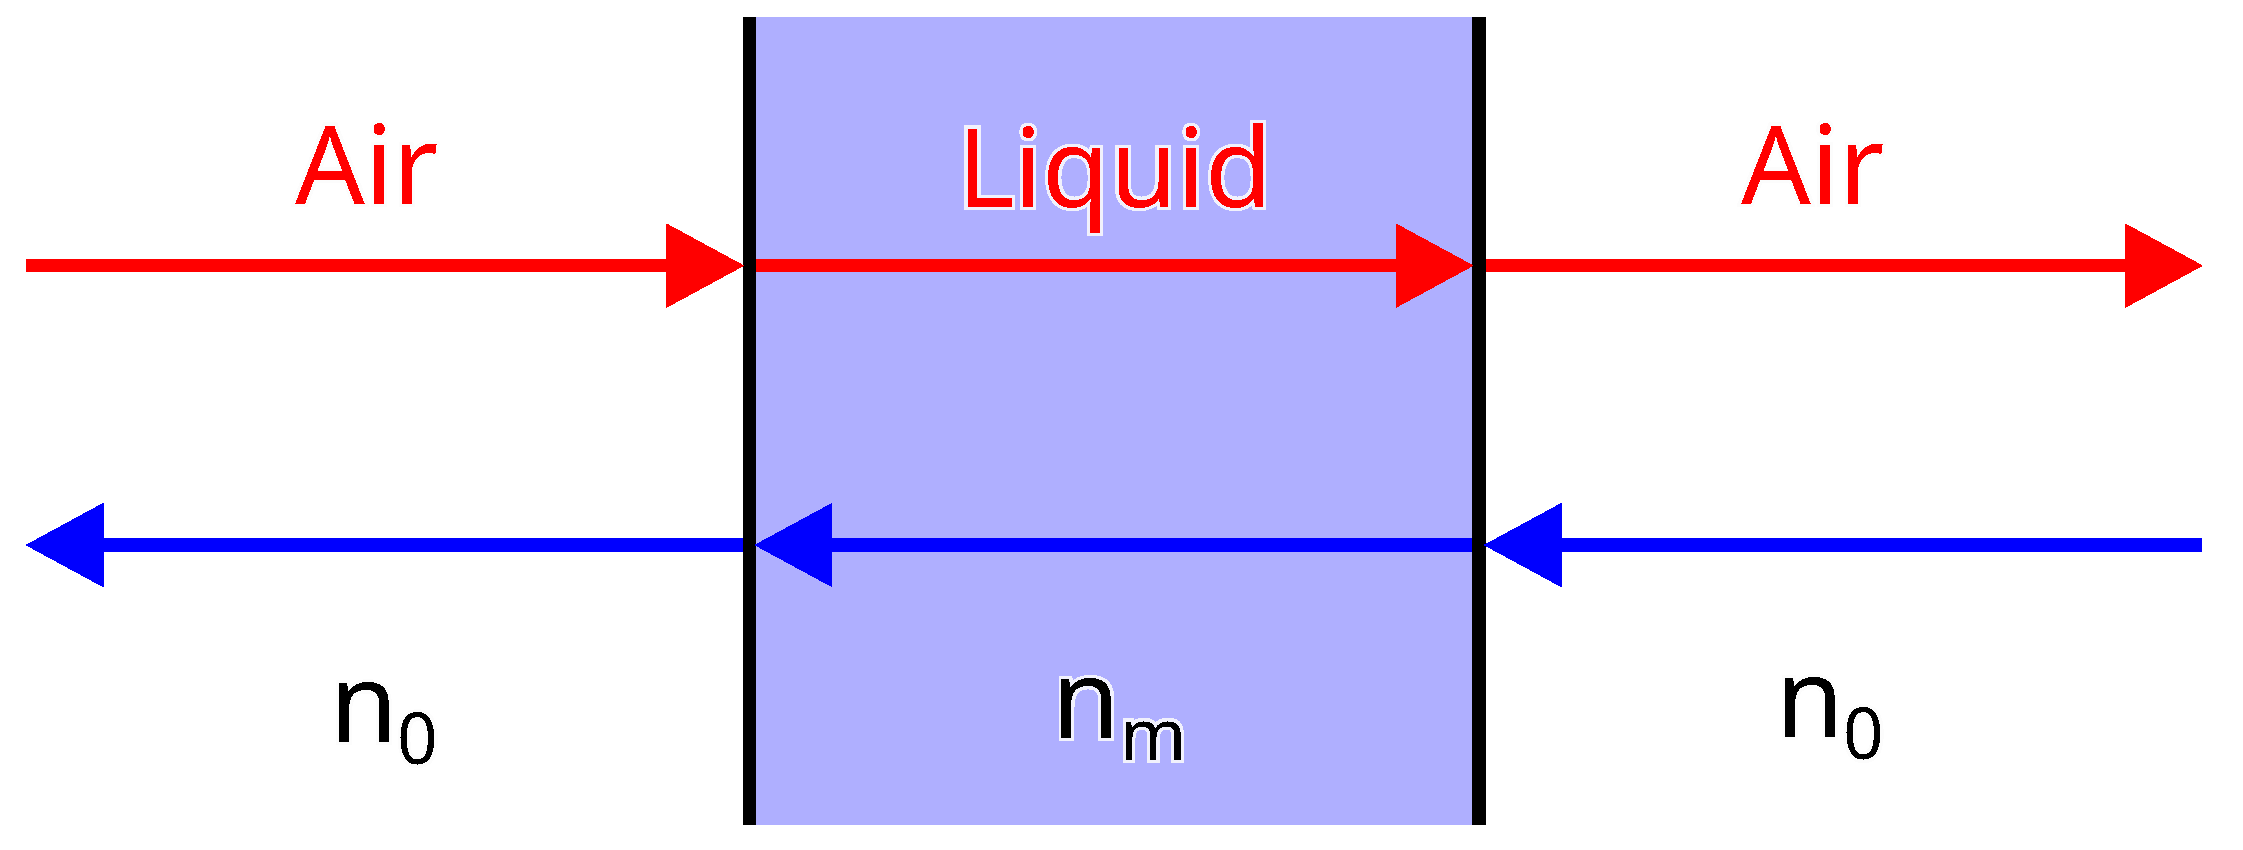
To model wave propagation through a water layer of thickness d 75 and 85 μm, the TMM is applied. This approach accounts for multiple reflections and interference effects at interfaces between layers of different refractive indices [26]. In our case, the multilayer system consists of:
  • Incident Medium: Air ( n = 1 );
  • Sample Layer: Liquid water (complex n = n r e a l + i · n i m a g );
  • Exit Medium: Air.
The magnitude of the wave vector (wavenumber) in vacuum is defined as
k = ω c .
Each interface introduces Fresnel reflection and transmission, and each layer adds a propagation phase delay. The model computes the net forward and backward amplitudes using the continuity of fields across boundaries (Figure 7).
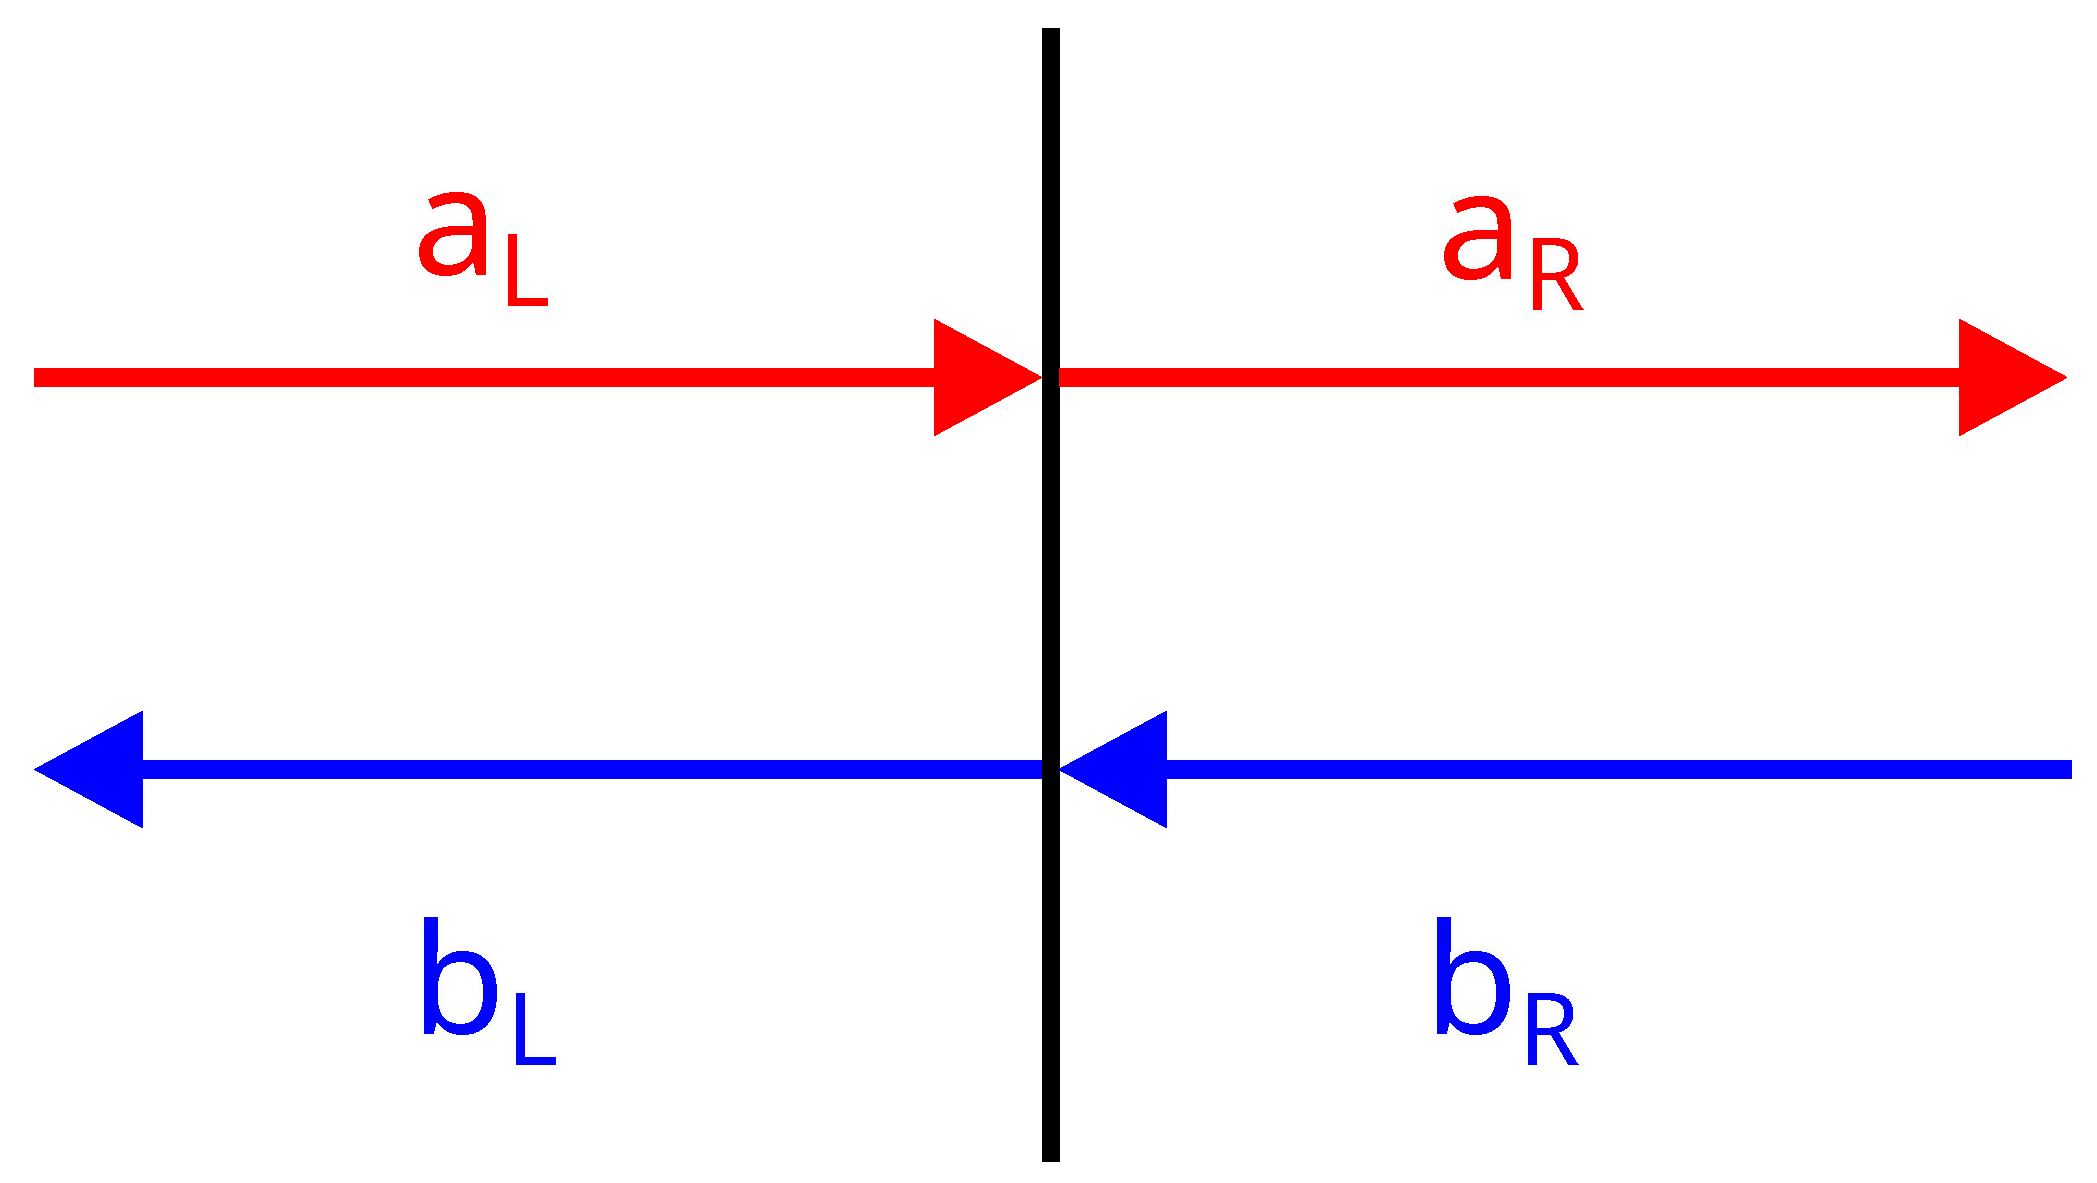
The Fresnel equations are based on boundary conditions of D, H, E and B (Maxwell’s equations), assuming k is perpendicular to the direction of the propagating field. The electromagnetic wave is represented by two complex amplitudes: a forward-traveling wave (a) and a backward-traveling wave (b). The subscripts on these amplitudes (e.g., a L and b R : L—left; R—right) denote their position relative to a boundary.
For the border: At an interface between two media with refractive indices n 0 = 1 and n m , the amplitudes are related by the continuity of the tangential electric and magnetic fields. For a wave traveling from the left to the right, the amplitudes are on the left ( a L , b L ) and right ( a R , b R ) of the boundary. So, for the border, as illustrated in Figure 8, we apply
a L = 1 2 a R 1 + n m n 0 + b R 1 n m n 0 ,
b L = 1 2 a R 1 n m n 0 + b R 1 + n m n 0 .
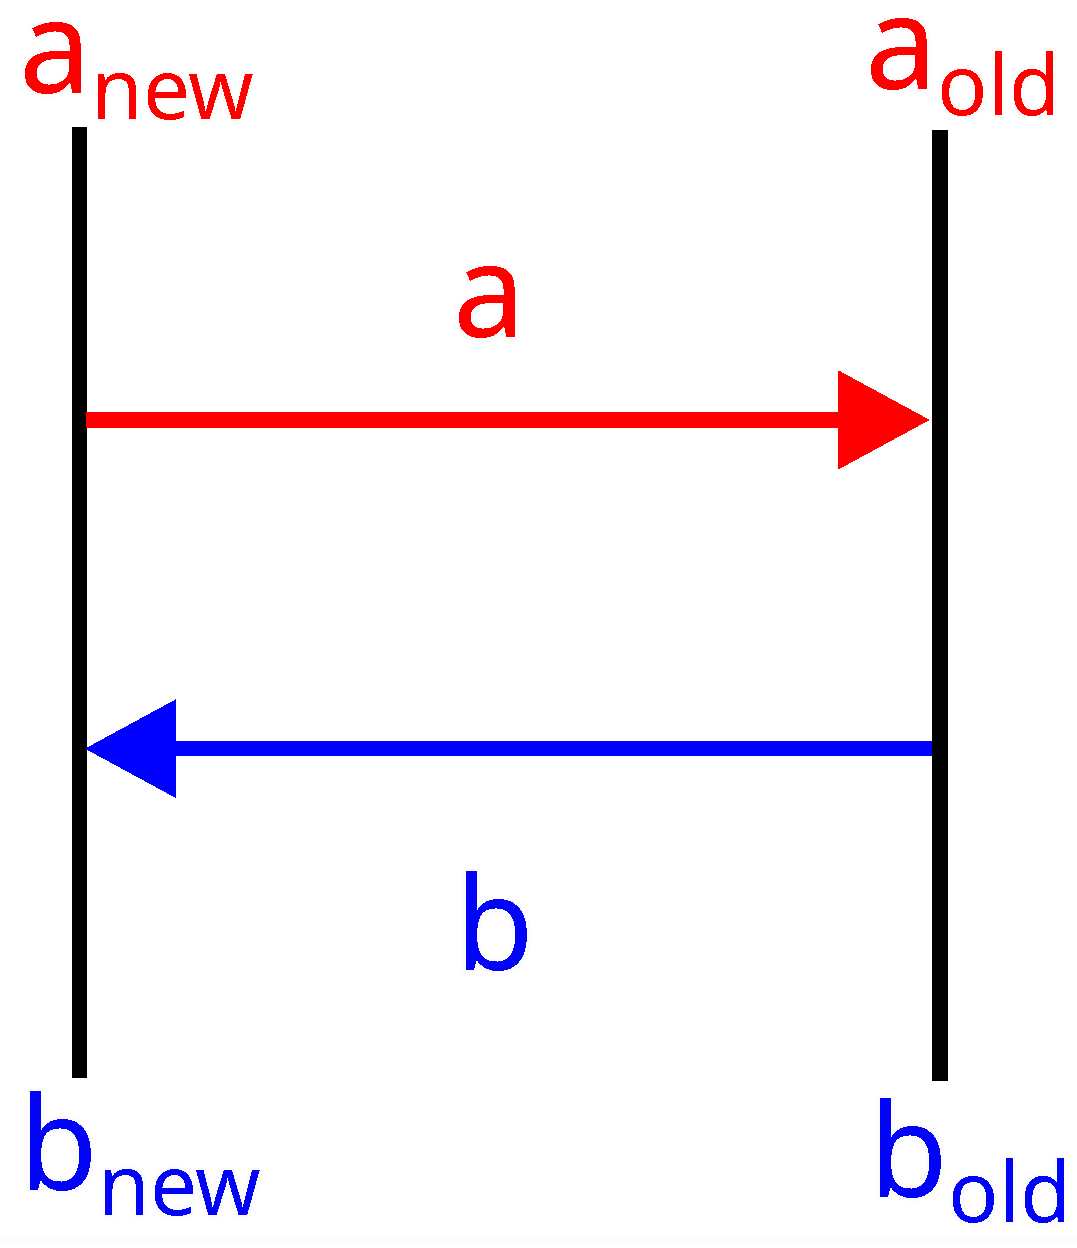
For propagation through a layer of thickness d and complex refractive index η , a propagation factor is introduced to account for phase accumulation and magnitude reduction between boundaries (Figure 9):
a new = a old · exp ( i k η m d ) ,
b new = b old · exp ( i k η m d ) .

2.7.2. Simulation Procedure and Resulting Spectra

The simulation is performed by sequentially applying the transfer matrix method across each interface and layer. We impose the boundary conditions such that the transmitted wave amplitude in the exit medium is normalized to unity ( a transmitted = 1 ) and assume that there is no backward-propagating wave in the exit region ( b exit = 0 ). Under these conditions, the corresponding incident a incident ) and reflected ( b reflected ) amplitudes at the input interface are calculated.
The transmission coefficient is finally computed from the corresponding amplitude:
T ( f ) = 1 a incident 2 .
The reflection coefficient is determined by the amplitude of the reflected wave ( b reflected ) relative to the incident wave:
R ( f ) = b reflected a incident 2 .
This procedure provides a detailed spectral response of the water layer, allowing for the characterization of its optical behavior across the frequency range of interest using our experimental data.

3. Results

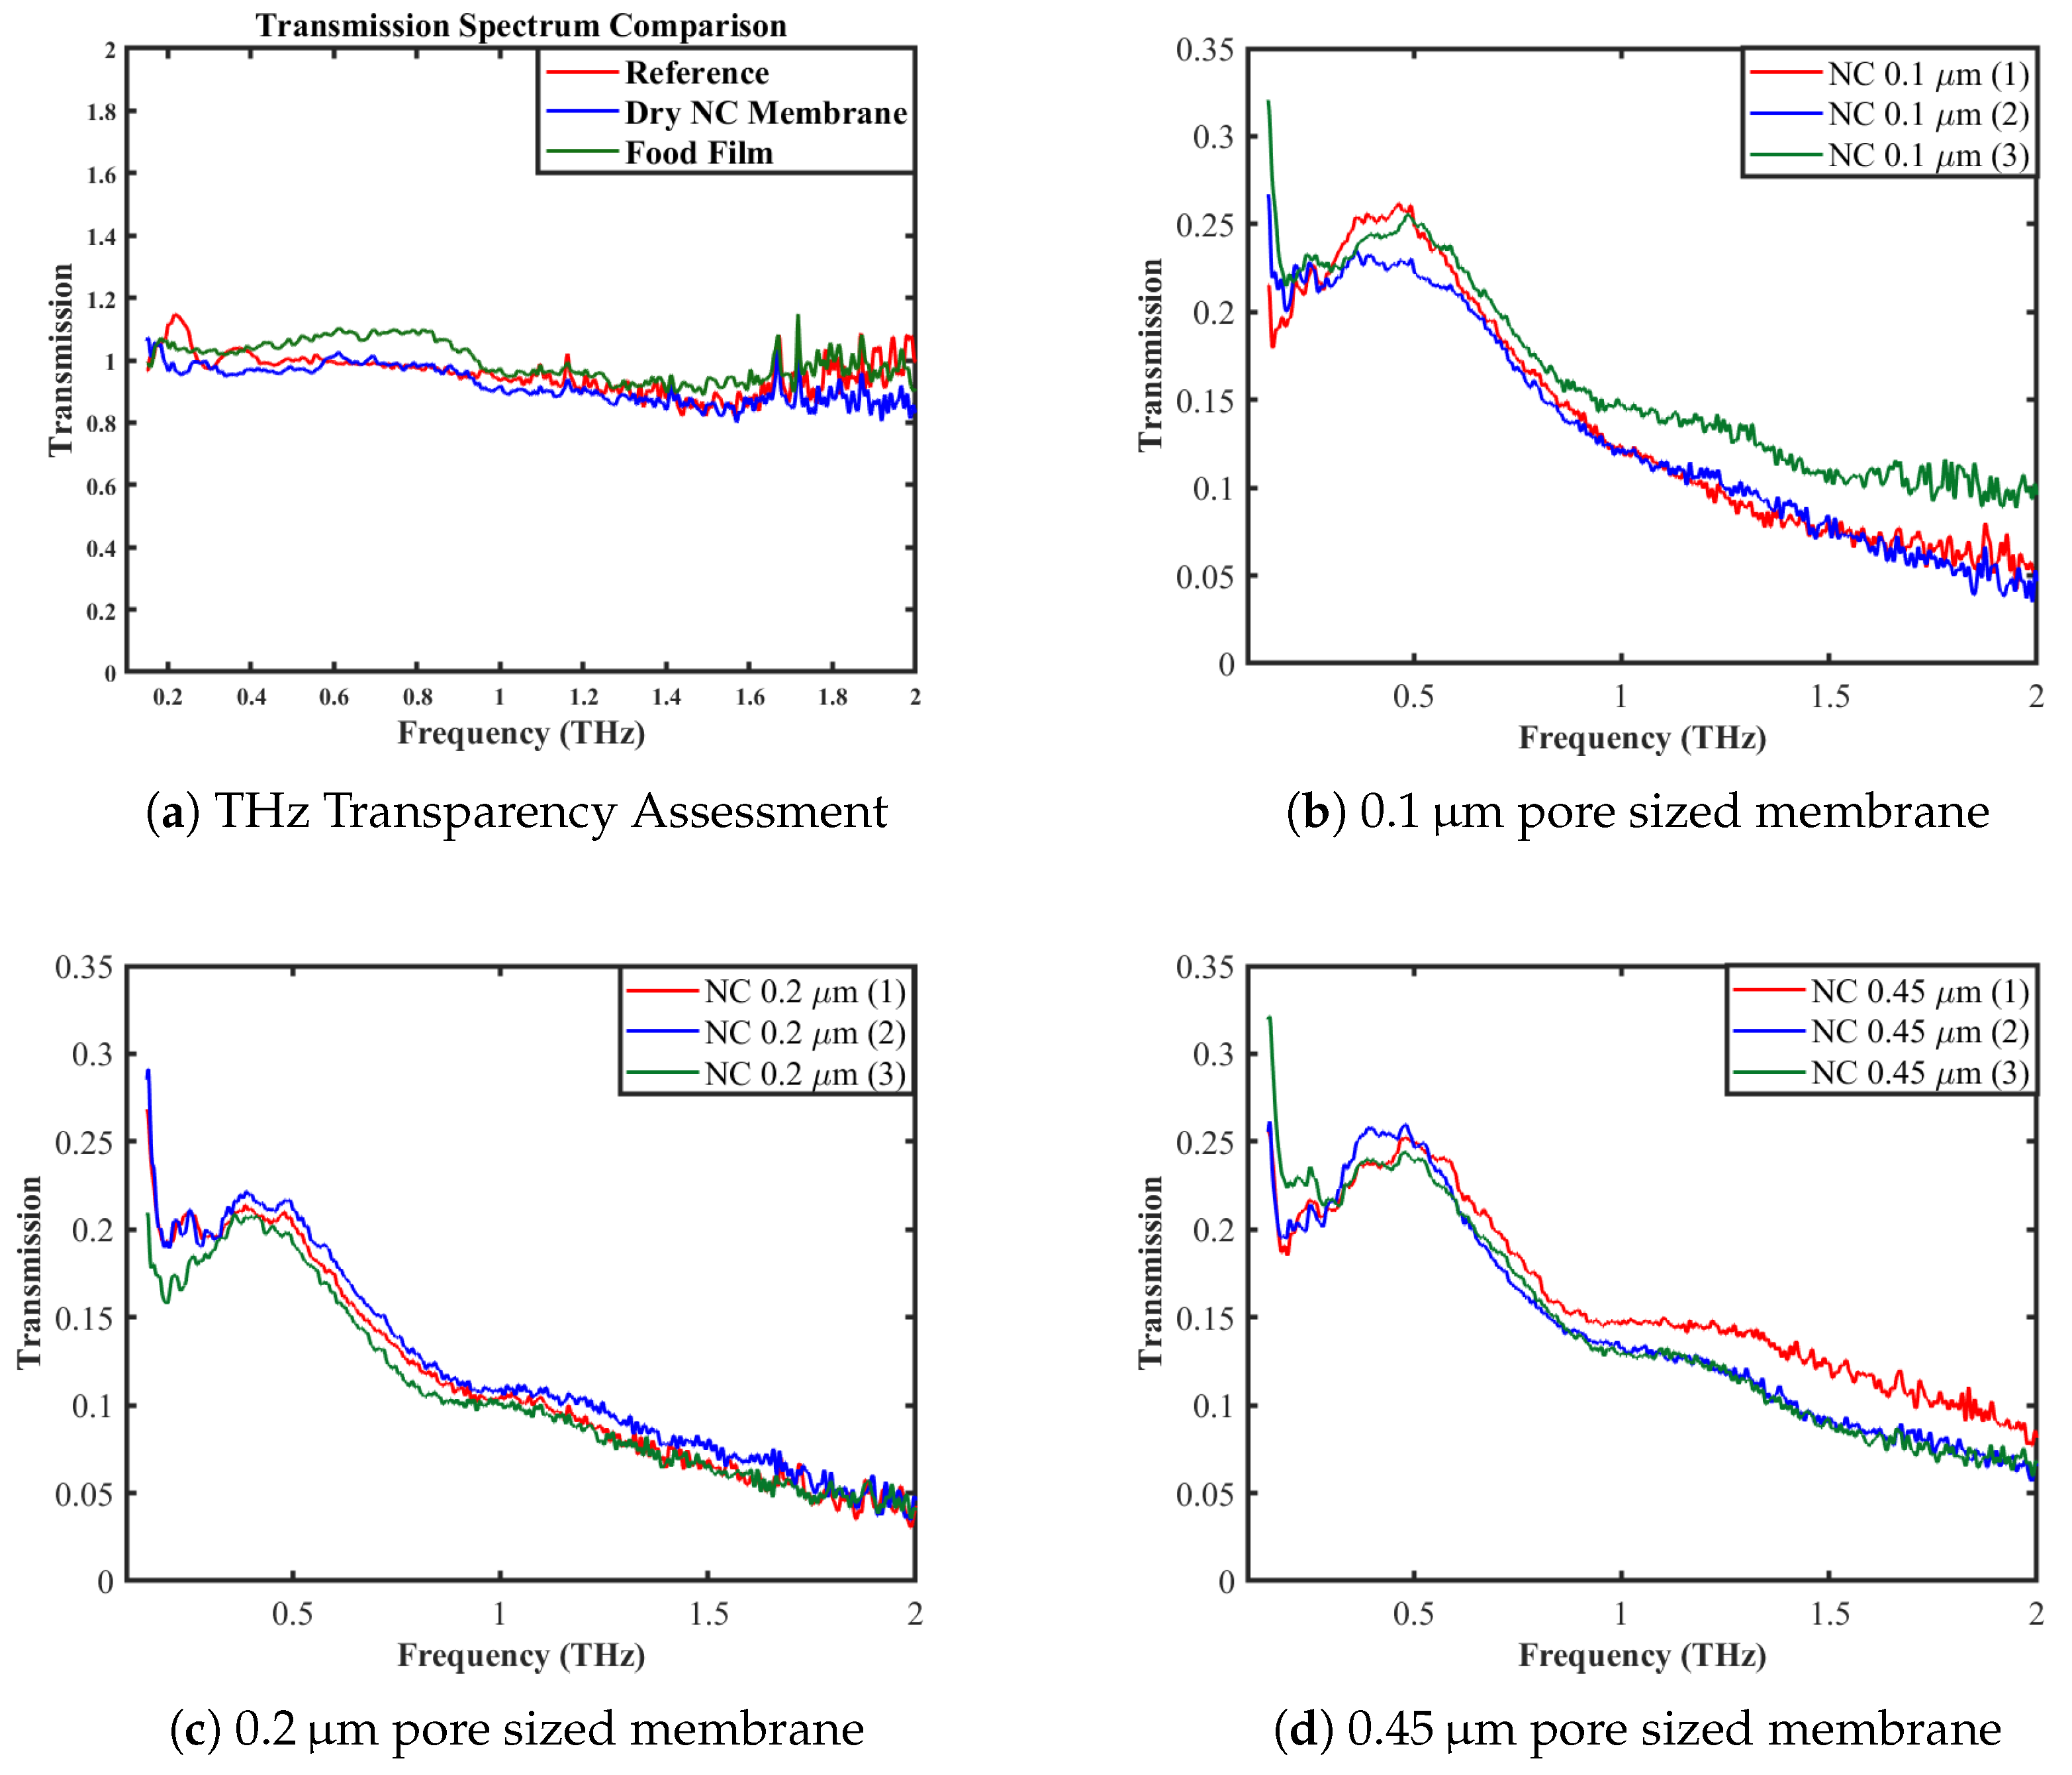
In THz-TDS, the selection of sample substrates and sealing materials must be chosen carefully because any component placed in the THz path can introduce absorption, scattering, or reflection that distorts the measurement of interest. To ensure accurate interpretation of spectral features, especially in hydrated or biological samples, it was essential to first evaluate the intrinsic transparency of supporting and sealing materials. We plotted the transmission spectra of the empty open aperture (reference), dry NC membrane, and food-grade cling film together. This was done to confirm that they are transparent and will not interfere with our liquid sample measurements.
From Figure 10a, we see that the transmission is close to 1 with a 10 % error. This is not perfectly 1 and can even exceed 1 because of the irreproducibility of our setup. However, this confirms that the food-grade cling film, dry NC membrane, and empty (open) aperture will not interfere with our liquid sample measurements.

Experimental Results

The measurements were carried out on three samples each of the different pore sizes. We immediately sealed these samples with the food-grade cling film to avoid evaporation during measurements. Afterwards, we calculated the mean of five measurements of each sample with different pore sizes. The results are presented in Figure 10.
To evaluate potential thickness variations caused by membrane swelling or nonuniform sealing, transmission measurements were performed in different regions of the same hydrated membrane. The resulting spectra, shown in Figure 10b–d, are identical, indicating that any local variations in effective thickness have a negligible impact on the measured THz transmission.
The extraction of the complex refractive index and absorption coefficient from transmission measurements requires solving inverse problems involving transcendental equations. In practice, this procedure is highly sensitive to small uncertainties in experimental parameters, including sample thickness, phase noise, and amplitude fluctuations. In the present case, the combination of strong water absorption in the THz range and the thin, membrane-confined geometry further amplifies these sensitivities, leading to significant instability in the extracted optical constants.
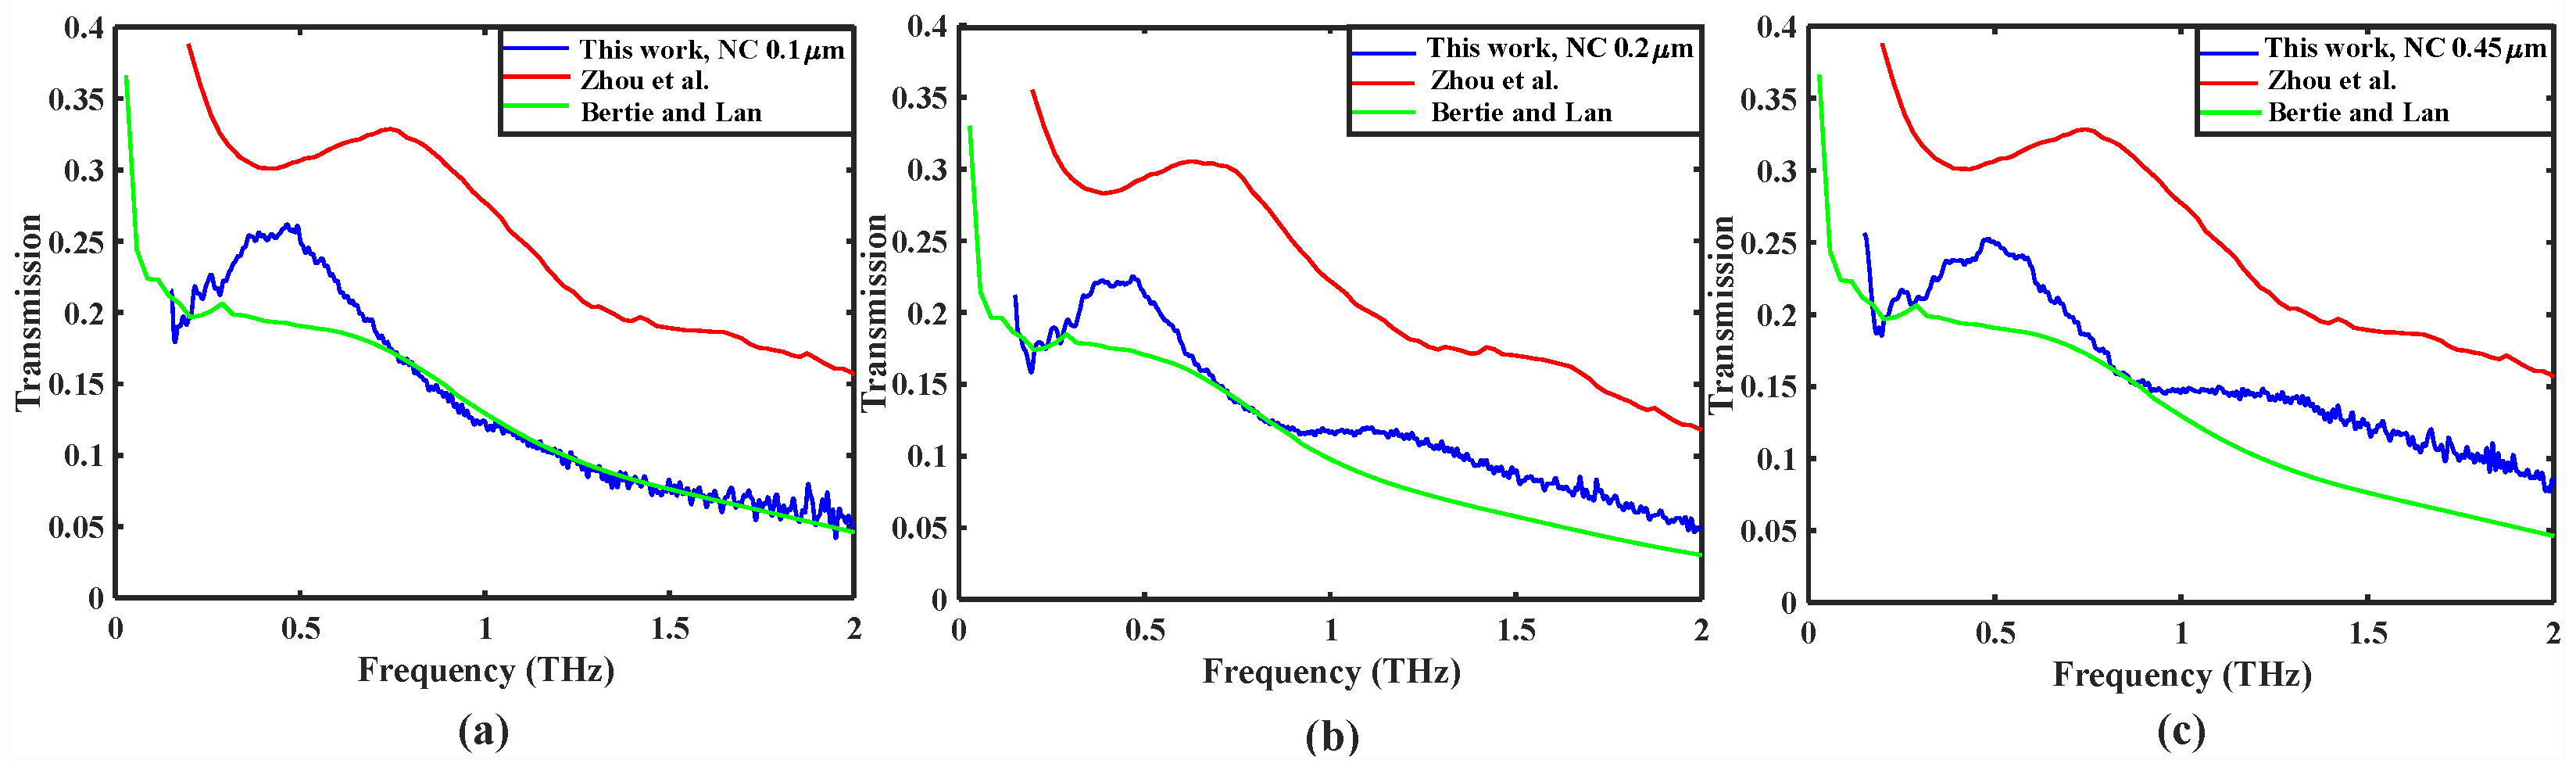
For this reason, rather than performing a direct inversion that may introduce non-physical artifacts, we adopt a forward-modeling approach. Specifically, we compute transmission spectra using transfer matrix simulations based on independently reported dielectric functions (Bertie and Lan [18]; Zhou et al. [19]) and directly compare these with our experimental measurements.
The experimental transmission spectra are found to lie within the range predicted by these literature datasets and exhibit consistent frequency-dependent behavior. This agreement provides a validation of the proposed methodology while avoiding the uncertainties associated with inverse extraction procedures.

4. Discussion

To contextualize and validate the experimental transmission measurements, previously reported optical constants of liquid water were used as reference data. Specifically, optical constants reported by Bertie and Lan [18] and measurements of dielectric properties at room temperature reported by Zhuo et al. [19] were used. These datasets were used to calculate reference transmission spectra using the transfer matrix method, enabling direct comparison with the experimentally measured spectra. It is important to note that dielectric functions of water reported in the THz range of Bertie and Zhou’s experiment exhibit noticeable differences. When these datasets are used in transfer matrix simulations, they generate distinct transmission curves, as shown in Figure 11. The experimentally measured transmission in our work lies within this reported range and follows the same frequency-dependent trend. This consistency supports the physical reliability of the proposed membrane-based methodology.
The non-monotonous frequency dependence can be explained as a manifestation of Debye relaxation in water, as explained in the paper [27]. Discussion of these phenomena is out of scope of the current work devoted to the methodology of THz spectroscopy of liquid samples.
The transmission measurements demonstrate a high degree of reproducibility for water confined within porous NC membranes. As shown in Figure 10, three independently prepared samples for each membrane thickness exhibit nearly identical transmission spectra, indicating that the sample preparation procedure and measurement protocol are reliable and stable. This reproducibility is a key requirement for methodological development in THz spectroscopy of liquids.
At the same time, systematic differences are observed between membranes with different pore sizes. In particular, the overall transmission through water-filled membranes with pore sizes of 0.1 μm and 0.45 μm is higher than that observed for the 0.2 μm membrane. Although higher transmission may appear advantageous at first glance, this effect must be interpreted in the context of sample retention and effective liquid thickness within the porous matrix.
Based on experimental observations and sample handling behavior, the 0.2 μm NC membrane retains a larger and more stable amount of liquid water compared to the other pore sizes. This conclusion is supported by the mass measurements summarized in Table 1 and Figure 6, which show that the effective water content confined within the 0.2 μm membrane is higher. In contrast, membranes with larger pores (0.45 μm) exhibited increased liquid leakage and evaporation during preparation and measurement, while the smallest pores (0.1 μm) likely limited uniform water distribution due to reduced permeability.
The intermediate pore size of 0.2 μm therefore provides a balance between permeability and liquid retention, promoting a more homogeneous distribution of water within the membrane structure. This results in a transmission response that is consistent and physically meaningful compared to the transmission spectra calculated using established dielectric properties of water, as illustrated in Figure 11. Importantly, the experimentally measured transmission spectra fall within the range defined by calculations based on previously reported optical constants, confirming that the membrane-confined water behaves as expected without introducing strong substrate-induced artifacts.
These findings support the use of porous NC membranes as an effective alternative to conventional liquid cuvettes for THz spectroscopy of liquid biosamples. The results further indicate that membrane pore size is a critical parameter influencing both sample stability and electromagnetic response. The present comparison provides a starting point for systematic investigations into how membrane morphology governs THz transmission, with direct implications for extending this methodology to more complex biological liquids.
To end, the usability of the NC membrane configuration was evaluated based on three criteria:
i.
  Consistency of the measured transmission spectra with the expected frequency-dependent absorption behavior of water;
ii.
 Reproducibility of measurements across different positions of the same hydrated membrane;
iii.
Agreement with transfer matrix simulations based on previously reported dielectric datasets of water.
Together, these observations demonstrate that NC membranes provide a stable platform for THz-TDS measurements of confined liquid samples.

5. Conclusions

Because the pore sizes (0.1–0.45 μm) are much smaller than the THz wavelength (300 μm), the electromagnetic field does not resolve the internal microstructure of the membrane. The NC scaffold therefore does not introduce additional scattering or resonant contributions and acts primarily as a low-index, low-loss mechanical support. Under these conditions, the effective dielectric response of the hydrated membrane is governed predominantly by the liquid filling fraction, while the intrinsic dielectric contribution of the NC matrix introduces only a minor correction within experimental uncertainty. Representing the membrane as an effective liquid layer with reduced thickness thus directly reflects the actual liquid content rather than serving as an arbitrary fitting parameter. Therefore, explicitly introducing a full Effective Medium Theory formalism would not meaningfully alter the extracted liquid optical constants, since the THz response is dictated by the liquid properties and the NC scaffold is effectively transparent in this spectral range.
Beyond improved liquid handling, porous NC membranes exhibit favorable performance as THz sample-support substrates, providing a practical alternative to quartz cuvettes for liquid-based measurements. Due to their low refractive index and inherently porous structure, NC membranes substantially reduce Fresnel reflection losses compared to cuvettes. These properties are important to consider in the terahertz range where the free-space wavelength (≈300 μm at 1 THz) renders quartz interfaces highly reflective. The membranes enable stable confinement of micrometer-scale liquid layers while preserving the transmitted field amplitude required for reliable extraction of optical constants. Despite these advantages, the approach is limited by membrane pore morphology: viscous liquids or samples containing particles >100 nm cannot be reliably confined, and, for example, blood cells are incompatible due to cellular dimensions exceeding the pore size. Within these constraints, porous NC membranes provide a technically robust, low-loss platform for THz spectroscopic probing of aqueous and plasma-based biosamples.


Author Contributions

Conceptualization, P.K. and G.F.; methodology, D.A.A., A.M. and J.P.; software, D.A.A., M.G. and A.M.; validation, D.A.A., M.G., A.M. and G.F.; formal analysis, D.A.A.; investigation, D.A.A., A.M. and G.F.; data curation, D.A.A.; writing—original draft preparation, D.A.A.; writing—review and editing, P.K.; visualization, D.A.A., M.G. and G.F.; supervision, G.F. and P.K.; project administration, G.F. and P.K.; funding acquisition, G.F. and P.K. All authors have read and agreed to the published version of the manuscript.

Funding

The work was supported by the Research Council of Finland (Flagship Programme PREIN, decision 368653; research project, decision 357033) and EU Horizon 2024 MSCA project 101236439 (HERMES).

Institutional Review Board Statement

Not applicable.

Informed Consent Statement

Not applicable.

Data Availability Statement

Data underlying the results presented in this paper are not publicly available at this time but may be obtained from the authors upon reasonable request.

Conflicts of Interest

The authors declare no conflicts of interest.

References

  1. Nagatsuma, T. Terahertz technologies: Present and future. IEICE Electron. Express 2011, 8, 1127–1142. [Google Scholar] [CrossRef]
  2. Chen, M.; Wang, Y.; Wang, X.; Li, L. Advances in terahertz detection and imaging. Front. Phys. 2022, 10, 855623. [Google Scholar] [CrossRef]
  3. Wu, J.Z.; Li, X.Q.; Sun, L.J.; Liu, C.L.; Sun, X.R.; Yu, L. Advances in the application of terahertz time-domain spectroscopy and imaging technology in crop quality detection. Spectrosc. Spectr. Anal. 2022, 42, 358–367. [Google Scholar]
  4. Zhang, L.; Zhang, M.; Mujumdar, A.S. Terahertz spectroscopy: A powerful technique for food drying research. Food Rev. Int. 2023, 39, 1733–1750. [Google Scholar] [CrossRef]
  5. Zhang, X.-C.; Xu, J. Introduction to THz Wave Photonics; Springer: New York, NY, USA, 2010. [Google Scholar]
  6. Ferguson, B.; Zhang, X.-C. Materials for terahertz science and technology. Nat. Mater. 2002, 1, 26–33. [Google Scholar] [CrossRef] [PubMed]
  7. Siegel, P.H. Terahertz technology in biology and medicine. IEEE Trans. Microw. Theory Tech. 2004, 52, 2438–2447. [Google Scholar] [CrossRef]
  8. Thrane, L.; Jacobsen, R.H.; Jepsen, P.U.; Keiding, S.R. THz reflection spectroscopy of liquid water. Chem. Phys. Lett. 1995, 240, 330–333. [Google Scholar] [CrossRef]
  9. Zhao, X.; Liu, S.; Wang, C.; Zuo, J.; Zhang, C. Nitrocellulose membrane sample holder using for terahertz time domain spectroscopy. In Infrared, Millimeter-Wave, and Terahertz Technologies IV; SPIE: Bellingham, WA, USA, 2016; Volume 10030, pp. 404–409. [Google Scholar]
  10. Naftaly, M.; Gregory, A. Terahertz and microwave optical properties of single-crystal quartz and vitreous silica and the behavior of the boson peak. Appl. Sci. 2021, 11, 6733. [Google Scholar] [CrossRef]
  11. Chua, H.S.; Obradovic, J.; Haigh, A.D.; Upadhya, P.C.; Hirsch, O.; Crawley, D.; Gibson, A.A.P.; Gladden, L.F.; Linfield, E.H. Terahertz time-domain spectroscopy of crushed wheat grain. In Proceedings of the IEEE MTT-S International Microwave Symposium Digest, Long Beach, CA, USA, 12–14 June 2005; pp. 2103–2106. [Google Scholar]
  12. Zahid, A.; Abbas, H.T.; Imran, M.A.; Qaraqe, K.A.; Alomainy, A.; Cumming, D.R.S.; Abbasi, Q.H. Characterization and water content estimation method of living plant leaves using terahertz waves. Appl. Sci. 2019, 9, 2781. [Google Scholar] [CrossRef]
  13. Markelz, A.G. Terahertz dielectric sensitivity to biomolecular structure and function. IEEE J. Sel. Top. Quantum Electron. 2008, 14, 180–190. [Google Scholar] [CrossRef]
  14. Heyden, M.; Sun, J.; Funkner, S.; Mathias, G.; Forbert, H.; Havenith, M.; Marx, D. Dissecting the THz spectrum of liquid water from first principles via correlations in time and space. Proc. Natl. Acad. Sci. USA 2010, 107, 12068–12073. [Google Scholar] [CrossRef]
  15. Hobza, P.; Müller-Dethlefs, K. Non-Covalent Interactions: Theory and Experiment; No. 2; Royal Society of Chemistry: Cambridge, UK, 2010. [Google Scholar]
  16. Jepsen, P.U.; Cooke, D.G.; Koch, M. Terahertz spectroscopy and imaging—Modern techniques and applications. Laser Photon. Rev. 2011, 5, 124–166. [Google Scholar] [CrossRef]
  17. Buchner, R.; Barthel, J.; Stauber, J. The dielectric relaxation of water between 0 °C and 35 °C. Chem. Phys. Lett. 1999, 306, 57–63. [Google Scholar] [CrossRef]
  18. Bertie, J.E.; Lan, Z. Infrared intensities of liquids XX: The intensity of the OH stretching band of liquid water revisited, and the best current values of the optical constants of. Appl. Spectrosc. 1996, 50, 1047–1057. [Google Scholar] [CrossRef]
  19. Zhou, J.; Rao, X.; Liu, X.; Li, T.; Zhou, L.; Zheng, Y.; Zhu, Z. Temperature dependent optical and dielectric properties of liquid water studied by terahertz time-domain spectroscopy. AIP Adv. 2019, 9, 035328. [Google Scholar] [CrossRef]
  20. Tonouchi, M. Cutting-edge terahertz technology. Nat. Photon. 2007, 1, 97–105. [Google Scholar] [CrossRef]
  21. Baxter, J.B.; Guglietta, G.W. Terahertz spectroscopy. Anal. Chem. 2011, 83, 4342–4368. [Google Scholar] [CrossRef]
  22. Cytiva Life Sciences. Amersham Protran 0.2 NC Nitrocellulose Membranes. 2025. Available online: https://www.cytivalifesciences.com/en/fi/shop/protein-analysis/blotting-and-detection/blotting-membranes/amersham-protran-0-2-nc-nitrocellulose-western-blotting-membranes-p-00169 (accessed on 18 May 2025).
  23. Davies, C.L.; Patel, J.B.; Xia, C.Q.; Herz, L.M.; Johnston, M.B. Temperature-dependent refractive index of quartz at terahertz frequencies. J. Infrared Millimeter Terahertz Waves 2018, 39, 1236–1248. [Google Scholar] [CrossRef]
  24. Li, A.; Wang, Y.; Deng, L.; Zhao, X.; Yan, Q.; Cai, Y.; Lin, J.; Bai, Y.; Liu, S.; Zhang, Y. Use of nitrocellulose membranes as a scaffold in cell culture. Cytotechnology 2013, 65, 71–81. [Google Scholar] [CrossRef]
  25. Fridley, G.E.; Holstein, C.A.; Oza, S.B.; Yager, P. The evolution of nitrocellulose as a material for bioassays. MRS Bull. 2013, 38, 326–330. [Google Scholar] [CrossRef]
  26. Katsidis, C.C.; Siapkas, D.I. General transfer-matrix method for optical multilayer systems with coherent, partially coherent, and incoherent interference. Appl. Opt. 2002, 41, 3978–3987. [Google Scholar] [CrossRef] [PubMed]
  27. Fiedler, J.; Boström, M.; Persson, C.; Brevik, I.; Corkery, R.; Buhmann, S.Y.; Parsons, D.F. Full-spectrum high-resolution modeling of the dielectric function of water. J. Phys. Chem. B 2020, 124, 3103–3113. [Google Scholar] [CrossRef] [PubMed]
Figure 1. Schematic of the THz-TDS setup. A femtosecond laser pulse (red) is split into a pump and a probe. The pump excites the transmitter antenna (TA), generating a THz pulse (blue), which passes through the sample (S) before reaching the receiver antenna (RA). The probe pulse passes through a delay stage with a movable mirror (MM) to temporally sample the THz pulse at the detector.
Photonics 13 00373 g001
Figure 2. Measured signals during THz measurements.
Photonics 13 00373 g002
Figure 3. Schema showing NC membrane with and without the liquid sample.
Photonics 13 00373 g003
Figure 4. Visualization of different porous NC membrane pore sizes using SEM.
Photonics 13 00373 g004
Figure 5. Aperture plate used for sample mounting. Nine apertures (3 mm diameter) enabling simultaneous placement of samples and leaving an aperture open for reference measurements.
Photonics 13 00373 g005
Figure 6. Water effective thickness.
Photonics 13 00373 g006
Figure 7. Schematics of multilayer system.
Photonics 13 00373 g007
Figure 8. Schema of transmission at border.
Photonics 13 00373 g008
Figure 9. Schema for phase accumulation.
Photonics 13 00373 g009
Figure 10. (a) Transmission spectra of NC membranes (dry) and food-grade cling film relative to an empty aperture. (bd) Mean transmission spectra of DIW confined in NC membranes of different pore sizes.
Photonics 13 00373 g010
Figure 11. Transmission spectrum: Experimental results vs. theoretical reference [18,19]. (a) NC 0.1 μm pore size, (b) NC 0.2 μm pore size, (c) NC 0.45 μm pore size.
Photonics 13 00373 g011
Table 1. DIW weight measurement of diffferent pore sizes.
Pore Size (μm)Area (cm2)Dry Paper (g)Wet Paper (g)Water (g)Height (μm)
0.110.32850.33550.007070
20.33280.34820.015477
30.33830.36140.023177
40.34460.37440.029875
60.35510.40220.047279
7.50.36390.42010.056275
90.37270.43980.067175
0.210.32810.33670.008686
20.33320.34980.016583
30.33840.36290.024481
40.34460.37760.033183
60.35470.40510.050484
7.50.36210.42540.063384
90.37030.44830.077987
0.4510.32630.33390.007676
20.33030.34560.015477
30.33400.35750.023578
40.33820.36840.030275
60.34680.39170.044975
7.50.35340.41020.056876
90.35960.42710.067575
Disclaimer/Publisher’s Note: The statements, opinions and data contained in all publications are solely those of the individual author(s) and contributor(s) and not of MDPI and/or the editor(s). MDPI and/or the editor(s) disclaim responsibility for any injury to people or property resulting from any ideas, methods, instructions or products referred to in the content.