Article

Optimization of Unrepeatered Optical Communication Systems and the Applications in Cabled Ocean Observatories

1
State Key Laboratory of Marine Geology, School of Ocean and Earth Science, Tongji University, Shanghai 200092, China
2
Naval University of Engineering, Wuhan 430030, China
3
Ocean College, Zhejiang University, Zhoushan 316000, China
4
HMN Technologies Co., Limited, Tianjin 300467, China
*
Author to whom correspondence should be addressed.
Photonics 2025, 12(9), 930; https://doi.org/10.3390/photonics12090930
Submission received: 27 July 2025 / Revised: 10 September 2025 / Accepted: 16 September 2025 / Published: 18 September 2025
(This article belongs to the Special Issue Exploring Optical Fiber Communications: Technology and Applications)

Abstract

Conventional repeatered optical communication systems face inherent limitations in terms of reliability, flexibility in optical fiber configuration, and power supply modes, particularly when applied to large-scale cabled ocean observatories, which have highly variable load demands. To address these challenges, a novel hybrid optimization algorithm (GA + PSO + SA) has been developed to enable simultaneous optimization of multiple critical parameters, including the pump light wavelength, the length of the erbium-doped fiber, and the placement of the remote optical amplifier. This approach represents a significant advancement over conventional single-algorithm methods because it effectively overcomes local optima and achieves global performance optimization. Comprehensive simulations and experimental validation demonstrate that the optimized unrepeatered system achieves transmission distances of 691.8 km using G.654E fibers and over 400 km with standard G.652D fibers, while maintaining excellent signal quality and exceptional stability. This work provides a systematic framework for the design and optimization of ultra-long-haul unrepeatered systems, highlighting their practical applicability in cabled ocean observatories.

1. Introduction

Cabled ocean observatories (COOs) provide electrical power and communication bandwidths for underwater instruments, thereby enabling continuous, real-time, long-term data acquisition via submarine cables that span hundreds to thousands of kilometers, e.g., NEPTUNE [1,2] and S-NET [3,4,5,6]. These systems typically employ submarine optical repeaters to compensate for the attenuation and dispersion of optical signals during transmission in the fibers. These repeaters contain many active components and operate under a constant current power supply mode because the loads in the conventional submarine communication system generally do not fluctuate appreciably. However, COOs integrate various instruments that introduce significant load variations. Consequently, most COOs adopt a constant voltage power supply mode, which requires customized repeaters. Thus, eliminating repeaters would significantly reduce construction costs.
The absence of submarine repeaters in unrepeatered transmission systems offers a more cost-effective and reliable solution. These systems have unique advantages over repeatered transmission systems; specifically, the lack of repeaters facilitates cable burial protection and enables a greater number of fibers in the submarine cables. Furthermore, unrepeatered systems can allow temporary fiber cross-connections in certain fault scenarios. As shown in Figure 1a, when multiple fault points appear in the system and cannot be immediately repaired, a temporary cross-connection approach (Figure 1b) can be applied to temporarily activate more fibers. In contrast, it is difficult to implement this type of temporary measure in a repeatered system because each repeater requires pre-configured pumps.
To extend the potential communication distance of unrepeatered systems, it is essential to investigate the impacts of various factors (e.g., modulation formats, pump wavelengths, pump power, system noise, nonlinear effects, fiber attenuation, effective area, and light source performance). Numerous studies have explored these issues, including the use of ultra-low loss and large effective area fiber [7,8,9,10,11,12,13], application and optimization of the remote optical pumping amplifier (ROPA) [7,8,9,11,12,13,14], high-order Raman amplification [8,9,12,13,15], nonlinearity management techniques [10,11], high order modulation and Forward Error Correction (FEC) [10,11,12,15,16]. For large-scale COOs, the lengths of the backbone cables often reach 300–1000 km. For example, the length of the backbone cable of DONET is approximately 320 km [17,18], 450 km for DONET2 [19,20,21], 800 km for NEPTUNE [1,2], and 900 km for the RCA [22,23,24]. In the S-NET system, the five subnetworks each span approximately 800 km [3,4,5,6]. These lengths approach or exceed the maximum distances supported by available unrepeatered systems. Therefore, to enable this technology for COOs, further investigations are needed to fully leverage the capabilities of Raman amplifiers. The present study aims to optimize the length of erbium-doped fibers (EDFs) and the ROPA under various conditions to enhance amplifier performance.

2. Principle and Key Components

2.1. High-Order Raman Amplification

Ultra-long span unrepeatered optical communication relies on Raman amplification technology. The fundamental operating principle involves energy transfer from the pump light into the signal light in the form of Stokes photons according to the stimulated Raman scattering effect, thereby amplifying the signal light [25]. High-order Raman pumping is required to mitigate fiber attenuation, nonlinear effects, effective area, and the output power of the light source in order to maximize the communication span. Currently, third-order Raman amplifiers [26,27,28,29,30] are the most commonly used in ultra-long span fiber optic communication.
As shown in Figure 2, the gain range of the 1450 nm pump is limited. For larger communication spans, a 1360 nm pump is required to amplify the 1450 nm pump, thereby extending its gain range. For even longer spans, a 1270 nm pump can be used to amplify the 1360 nm pump, which further extends the gain of the 1450 nm pump. This approach ultimately enables the amplification of the 1550 nm signal light over an ultra-long span. In practical applications, fourth-order Raman amplifiers are rarely used because they require very high pump power, and any loss of the pump light will be significant.

2.2. Remote Optical Pumping Amplifier

The key to realizing ultra-long span unrepeatered optical communication lies in the application of the ROPA [31,32,33], which can enable repeatered communication applications in areas without power supply or monitoring, thus representing a power compensation solution for ultra-long span transmission. A ROPA is an extended application of an erbium-doped fiber amplifier (EDFA) in an unrepeatered system, and its amplification principle is similarly based on the simulated radiation.
The ROPA system, illustrated in Figure 3, consists of two parts: a remote gain unit (RGU) and a remote pumping unit (RPU). The RGU comprises a gain medium EDF and related passive components, which are connected to the gain medium via a fiber link through the cable junction box; specifically, an EDF is fused to the transmission fiber at an appropriate position. Because the pump source is located at the terminal site, the pump light must pass through a section of transmission fiber to reach the gain medium. Therefore, the gain unit may also be referred to as a remote gain unit. The RPU comprises remote optical pumps (ROPs) and Raman boards, which generate pumping light to provide the energy needed to amplify the signal light within the transmission fiber. In the proposed scheme, high-order Raman amplification at the terminal sites is first employed to boost the 1480 nm pump light. This amplified pump light is then transmitted to remotely pump the RGU. When the 1550 nm signal light arrives at the ROPA, it is amplified by the gain provided by the RGU. This configuration facilitates long-distance, broadband, low-noise, distributed online amplification [25,34].
EDFAs typically use pump lights with wavelengths of approximately 1480 or 980 nm. However, for an ROPA, because the RPU and RGU are not at the same position on the fiber link, the pump light must travel a long distance to reach the EDF. The attenuation coefficient of a 980 nm pump light in a standard single-mode fiber is >1.1 dB/km, whereas that of a 1480 nm pump light is approximately 0.2 dB/km. Therefore, the RPU usually uses a pump light with a wavelength of approximately 1480 nm.
For practical applications, the RGU is usually placed inside the connector box, and the RPU, which provides the pump light, is installed with the submarine line terminal equipment (SLTE) at the transmitter or receiver side of the system, where high power is generated. The high-power pump light is transmitted to the gain unit via the transmission optical fiber, which provides energy for the gain medium in the RGU on the line. This amplifies the signal light, which significantly increases the optical power output, thereby enabling passive unrepeatered transmission of the signal light.
The biggest difference between using a remote pump versus a standard EDFA is that in the former, the pumping laser and the gain medium are at different locations along the fiber link. In the latter, the pump laser and the gain medium are at the same location to amplify the signal light at the optical amplifier boards. The RGU of the remote pump subsystem and the RPU of the receiver are connected by a transmission fiber, such that the signal light and pump light can be transmitted through the same or different fibers.

3. System Optimization

3.1. Optimization Methodology

The system architecture for 400 km transmission employs a bidirectional Raman amplification scheme integrated with ROPA technology, as illustrated in Figure 4. This configuration addresses the critical challenge of power budget management in ultra-long span transmission via distributed amplification mechanisms.
The parameter design of this system primarily involves optimizing Raman amplifiers and remote pumping systems. A central aspect of this optimization is determining the pump power and wavelength for the Raman amplifier. Although higher pump power is theoretically advantageous, it faces practical constraints such as fiber capacity and nonlinear effects. Additionally, excessively high pump power can adversely impact gain flatness. Moreover, higher pump power leads to rapid cost increases, while the resulting gains asymptotically approach a maximum value. From an economic perspective, a moderate pump power is typically selected. For a second-order pump, although higher power is beneficial to a certain extent, it is necessary to reach an optimal balance between first- and second-order pump sources to ensure that the second-order pump light operates within a specific range. According to the fundamental principles of Raman amplification, the pump wavelength is related to the signal light wavelength. For each signal light, there is an optimal pump wavelength; for higher-order pumps, it is necessary to determine the second-order and higher-order pump wavelengths.
For a ROPA, the amplification effect depends on the dopant type, doping concentration, and effective area of the EDF, as well as its length. Under a given pump power and input ROPA power, there is an optimal EDF length that influences the maximum gain and noise figure of the signal. Another critical parameter is the position of the EDF. If the EDF is further from the receiver, less pump light enters the ROPA, which decreases its gain and noise characteristics. In contrast, if the EDF is too close to the receiver, the input signal to the ROPA becomes weaker, thus deteriorating its noise performance. Ultimately, there exists an optimal position for the EDF to maximize system performance.
The length of the EDF should be matched with the remaining pump power to fully leverage the capabilities of the ROPA and achieve maximum gain. Assuming that both the input signal power and the OSNR into the ROPA are fixed, i.e., the optical path before the ROPA is predetermined, then the distance between the ROPA and the receiver should be as large as possible to maximize the overall transmission distance.
In summary, for the system shown in Figure 4, the primary optimization parameters include the ROPA position, EDF length, and pump wavelength. The pump power allocation can be determined after these three parameters are finalized.
Because the Raman scattering equations comprise a system of differential equations [35], their solutions cannot be directly employed as design targets. Therefore, linear optimization algorithms are not suitable for this problem, and nonlinear optimization algorithms must be used instead. Common methods include Genetic Algorithm (GA), Particle Swarm Optimization (PSO), and Simulated Annealing (SA), among others.
Extensive research has focused on optimizing Raman amplifiers or selecting parameters using these algorithms [36,37,38,39,40,41,42]. However, available studies have typically employed either a single algorithm or a sequential combination of multiple algorithms. These approaches often result in suboptimal solutions, i.e., locating only approximate optimal regions or requiring excessive computational time and resources.
To address these limitations, this paper proposes a hybrid algorithm that integrates the advantages of GA, PSO, and SA. The key innovations include the following: (i) introducing the concepts of individual best and global best from PSO into the selection operation of GA; (ii) comparing individual fitness with individual and global bests to select superior individuals; (iii) incorporating individual and global bests information into crossover operations to enhance offspring quality; (iv) and integrating concepts from SA, such as cooling temperature and acceptance probability, into mutation operations. If a new individual exhibits inferior fitness after mutation, it may still be accepted with a certain probability, which decreases as “temperature” decreases. This mechanism helps avoid falling into local optima.
Although this optimization process is performed only once during the system design phase, pursuing a globally near-optimal solution is justified by the substantial performance improvements obtained. In ultra-long-span unrepeatered systems, with significant power constraints, even a 1–2 dB gain in OSNR is highly meaningful for applications such as COOs. Although the proposed hybrid algorithm (GA + PSO + SA) is more computationally demanding than a single algorithm approach, it effectively avoids local optima and converges to a near-global optimum. The computational expense is justifiable considering the one-time nature of the design process. Moreover, the iterative refinement strategy, whereby the step size is gradually reduced during the search, strikes a balance between precision and computational efficiency.
Furthermore, we evaluated the marginal returns of incorporating additional algorithmic modules, such as ant colony optimization or differential evolution. Our conclusion is that, under the current system model, the potential performance gains from such enhancements are very limited and unlikely to exceed the theoretical system limits, while they would incur an exponential increase in computational cost. A single execution of our hybrid algorithm already requires several hours. Introducing further algorithmic dimensions would drastically increase the number of simulations required. More importantly, from an engineering perspective, real-world constraints—such as manufacturing tolerances, environmental variations, and measurement uncertainties—make a robust, “engineering-satisfactory” solution far more valuable than a fragile ‘theoretical optimum’ that offers only marginal metric improvements. Overly complex algorithms also introduce a multitude of interacting parameters, substantially raising the difficulty of debugging and the risk of failure.
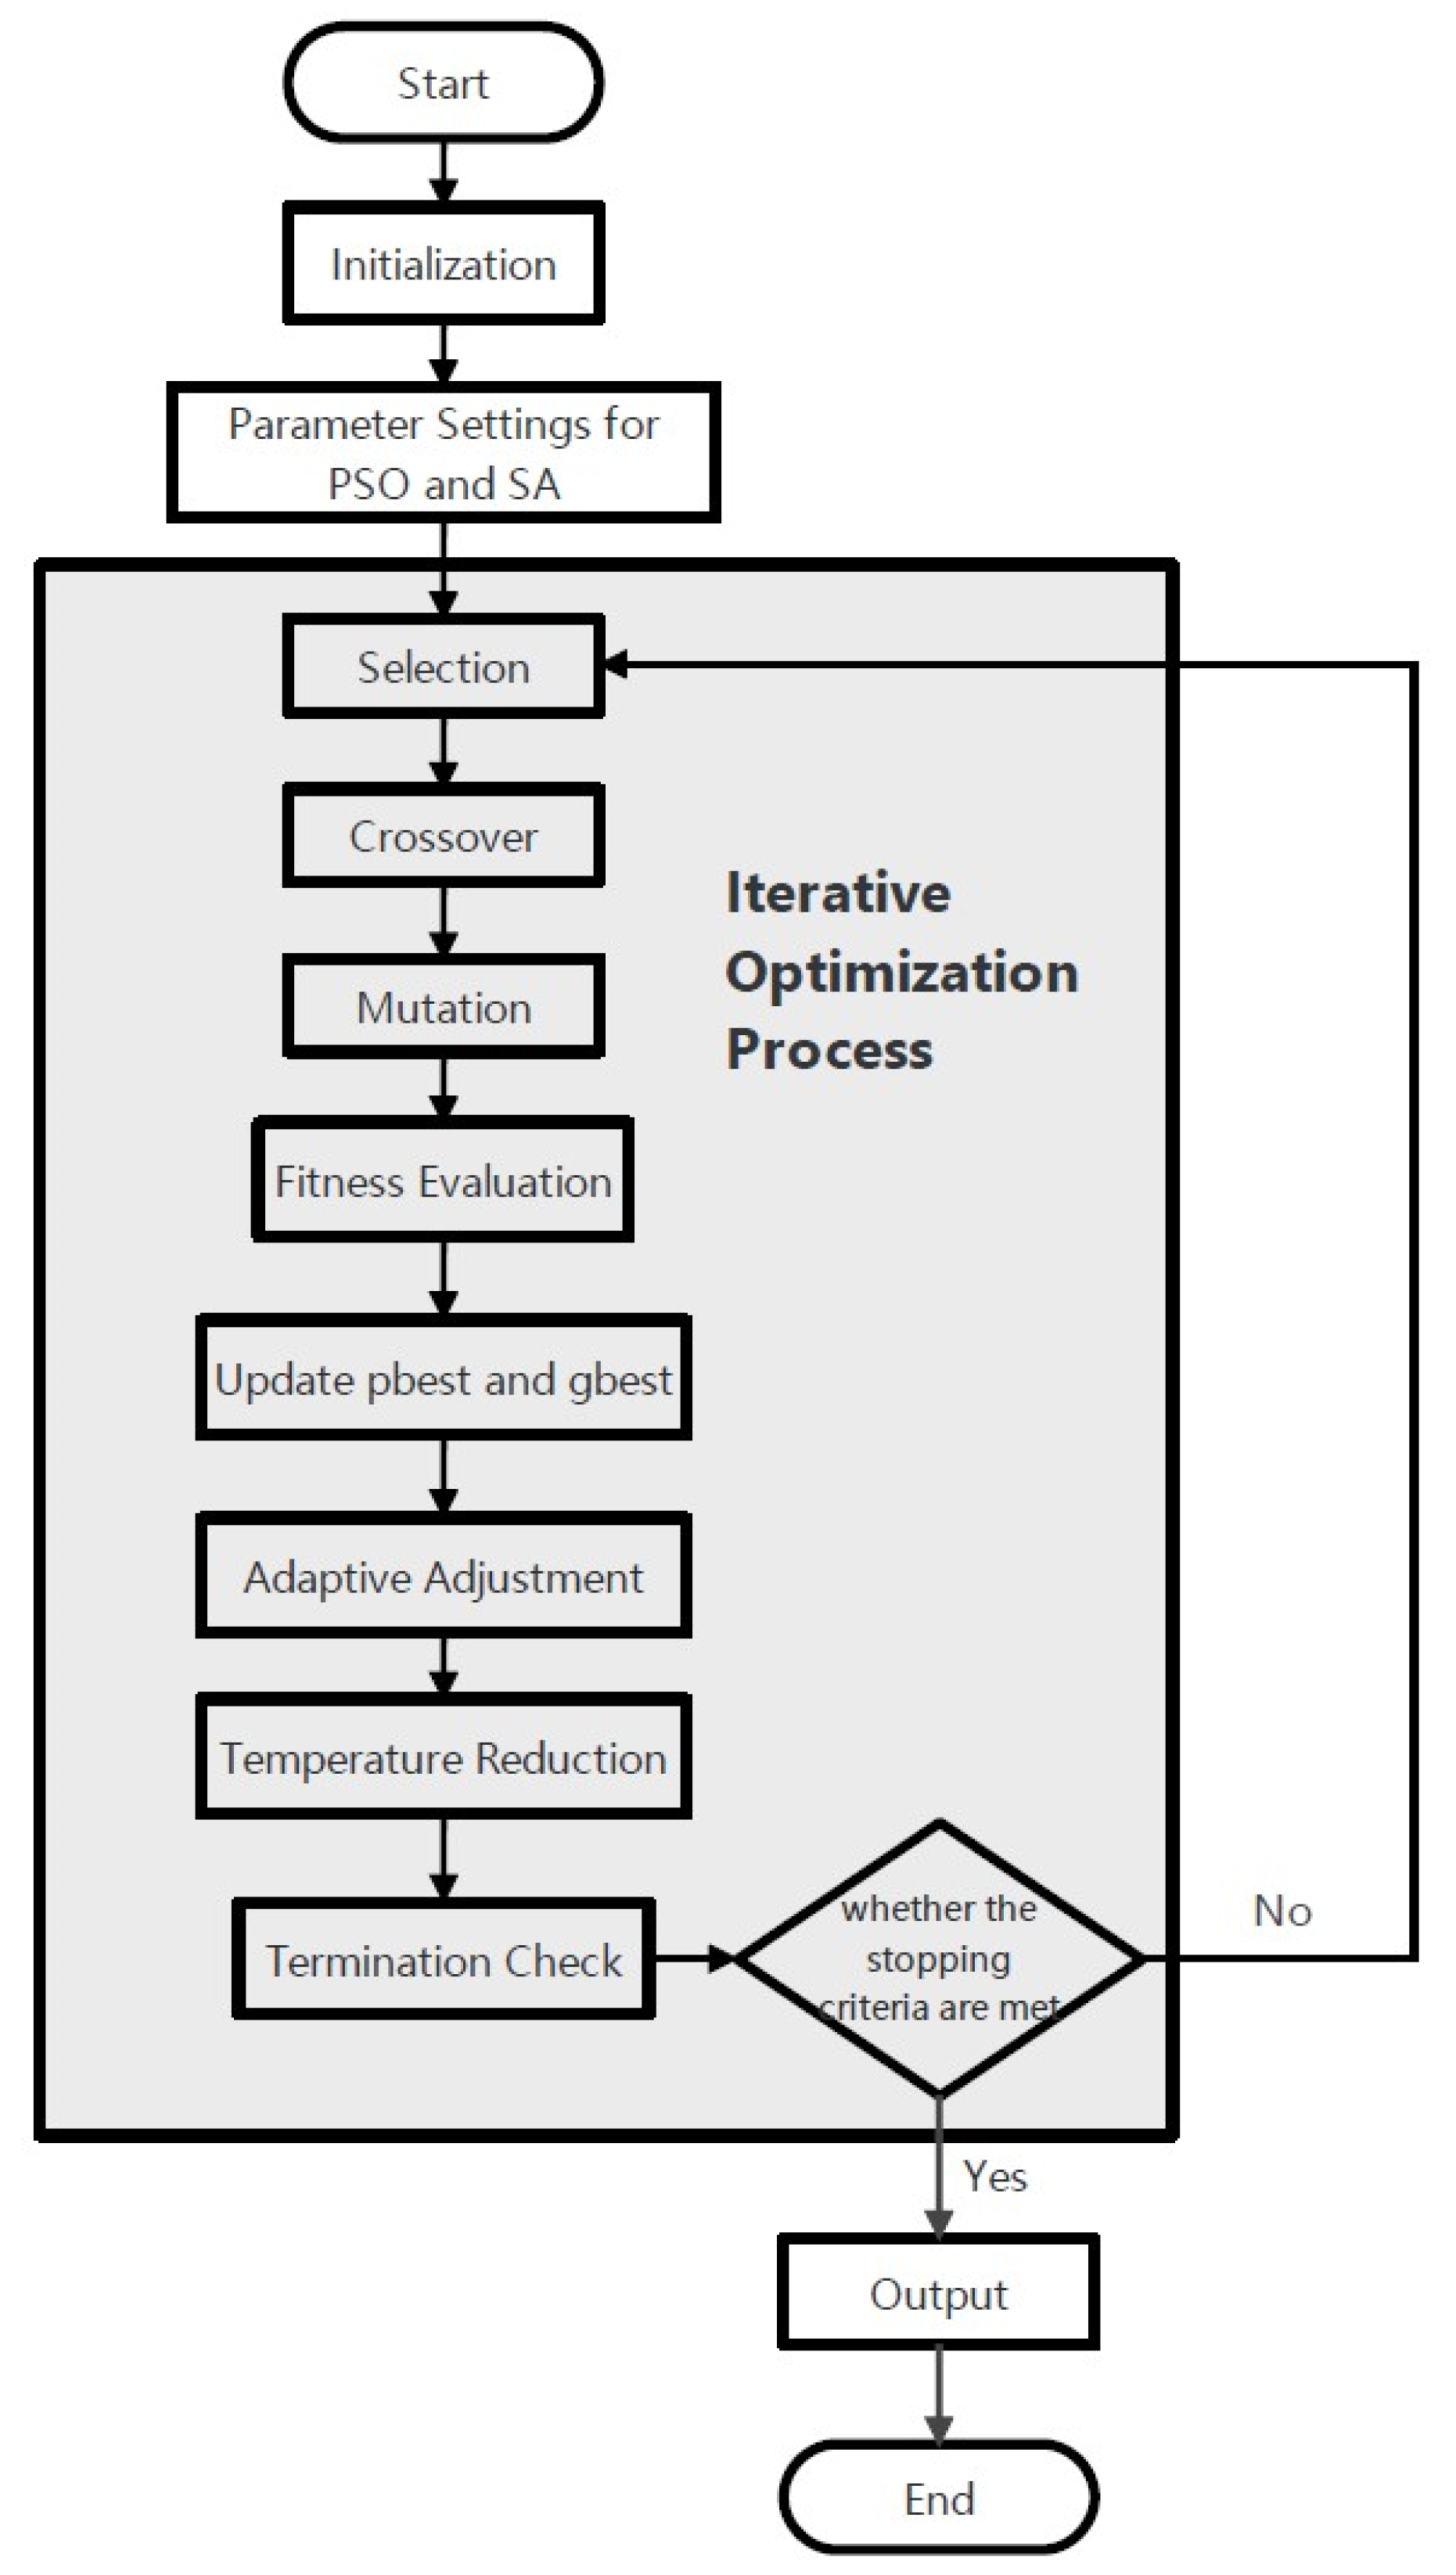
The proposed algorithm leverages GA’s framework to maintain genetic diversity, incorporates PSO for efficient global search capabilities, and integrates SA to ensure the ability to escape local optima. The specific implementation process is shown in Figure 5.
(1)
Initialization
The initialization process involves several key variables: range of pump power and wavelength, range of EDF length, and range of ROPA position. Additionally, an important step in the initialization stage is defining the fitness function, which has a critical role in the optimization problem. In this context, the fitness function f(λp, LEDF, xROPA) computes the OSNR value for each individual. Its construction primarily considers factors such as the optical signal gain, the noise, and the power of the pump light, which are discussed further below.
a.
Signal Gain
The gain of the Raman amplification system is primarily determined by the pump wavelength and the EDF length. The gain G can be expressed as follows:
G λ p , L E D F = k · P p · L E D F · g R λ p
where k is a constant related to fiber characteristics; Pp is the pump power; LEDF is the length of the EDF; and gR(λp) is the Raman gain coefficient, which can be expressed as g R λ p = α S R S ( λ p ) ρ , where α S R S represents the simulated Raman scattering (SRS) gain coefficient, and ρ is the fiber density.
b.
Noise
The noise in the system comprises multiple components; however, this study primarily considered Amplified Spontaneous Emission (ASE) and pump-induced noise. The total noise N can be expressed as follows:
N = N A S E · B + N p u m p
where NASE is the ASE noise coefficient; B is the signal bandwidth; and Npump is the pump-induced noise, which is typically determined by the pump power and the EDF length.
c.
Pump Noise
The pump noise Npump can be expressed as follows:
N p u m p = k p u m p · P p · L E D F
where kpump is a constant associated with the pump characteristics.
The expression provided here is not a fundamental physical law, but rather an engineering simplification that models the ASE noise power as increasing linearly with both pump energy and the scale of interaction. In this model, Pp represents the absolute pump power—higher power leads to stronger noise coupling—while LEDF corresponds to the physical path over which noise accumulates. A longer EDF results in an extended interaction length between pump noise and ASE, making the process of noise accumulation and amplification more pronounced.
When calculating the OSNR within the signal bandwidth, the direct noise contribution from the pump source is typically not integrated, because the pump and signal occupy distinct wavelength bands. This spectral separation isolates the noise transfer pathways. Thus, the pump noise is considered indirect and is often analyzed separately or omitted in the OSNR evaluation.
d.
Attenuation of Signal Light in the EDF
The attenuation of the signal light in the EDF can be expressed as follows:
N a t t e n u a t i o n = α E D F · L E D F + x R O P A x s e n d e r c
where α E D F is the attenuation coefficient of the EDF; x s e n d e r is the position of the transmitter; and c is the speed of light.
When optimizing the ROPA position, it is necessary to normalize the total path loss into an equivalent length for computational convenience. The total attenuation experienced by the signal light in the ROPA is equal to the product of the EDF attenuation coefficient α E D F and an “equivalent total length,” which includes both the physical spatial length L E D F and an equivalent temporal length ( x R O P A x s e n d e r ) / c , as shown in Equation (4).
The physical spatial length refers to the actual propagation length of the signal within the EDF, denoted as LEDF. Since the pump is remotely located, changes in the pump state require a finite time to propagate to the gain medium. This time delay, ( x R O P A x s e n d e r )/c, is treated as an equivalent temporal length, effectively converting the pump transmission delay into a virtual additional propagation length for the signal within the ROPA. This conversion accounts for the impact of pump state dynamics on the signal amplification process at a given gain state.
Thus, N a t t e n u a t i o n represents the number of signal photons per second that are consumed by the intrinsic loss of the EDF—rather than being utilized for amplification or effective transmission—after considering this spatio-temporal equivalence. This mathematical approach allows the total attenuation to be uniformly calculated based on an equivalent path length, thereby facilitating the joint optimization of ROPA position, EDF length, and pump power within a computationally tractable model.
e.
Position of the ROPA
Because the ROPA position x R O P A affects system performance, this can be indirectly considered by adjusting to the following equation:
G λ p , L E D F , x R O P A = G λ p , L E D F · e α E D F · L E D F + x R O P A x s e n d e r c
where α E D F is the attenuation coefficient of the EDF, and x s e n d e r is the position of the transmitter; c is the speed of light.
Equation (1) is a simplified model for an idealized scenario. This approximation assumes that the gain is uniform over the entire EDF length and proportional to the launched pump power P p , the interaction length L E D F , the Raman gain coefficient g R λ p , and a proportionality constant k (which encompasses other factors not explicitly modeled). Equation (5) is derived based on Equations (1) and (4), and applying the exponential attenuation model (Beer–Lambert Law) e α L to describe the loss process. This equation represents a net gain model that simultaneously considers gain, intrinsic attenuation, and the influence of the remote pump position, ultimately describing the net gain of the signal light after accounting for the ROPA position and the attenuation within the EDF.
Combining these factors, the fitness function f λ p , L E D F , x R O P A can be defined as follows:
f λ p , L E D F , x R O P A = k · P p · L E D F · g R λ p · e α E D F · L E D F + x R O P A x s e n d e r c N A S E · B + k p u m p · P p · L E D F + α E D F · L E D F + x R O P A x s e n d e r c
This function represents the system’s OSNR, where a higher value indicates better system performance. The subsequent optimization process aims to maximize this fitness function to achieve optimal system performance.
(2)
Parameter Settings
The primary parameters to be set are those for the GA, PSO, and SA. For GA, the key parameters include population size, crossover probability pc, and mutation probability pm. For PSO, the most important parameters include the inertia weight w and learning factors c1 and c2. For SA, the critical parameters include the initial temperature T0, terminal temperature Tend, and cooling rate. These parameters are carefully configured to optimize algorithm performance and ensure efficient convergence.
(3)
GA-Selection
The GA selection process employs roulette wheel selection based on fitness values to generate a new parent population.
  • Fitness Value Computation
For each individual, the fitness value is calculated using the fitness function as follows:
f i = f λ p i , L E D F i , x R O P A i
where i represents the index of the individual.
b.
Cumulative Probability Calculation
The total fitness sum f i is computed by aggregating the fitness values of all individuals. Subsequently, for each individual, the relative fitness r i and cumulative probability C i are determined as follows:
r i = f i f i
C i = j = 1 i r j
c.
Parent Selection
A random number r ∈ [0, 1) is generated. The corresponding individual in the cumulative probability distribution is then selected as a parent for the next generation.
r = r a n d [ 0,1 ) i f   C 1 r C 2   s e l e c t   i n d i v i d u a l   2 i f   C 2 r C 3   s e l e c t   i n d i v i d u a l   3 …… i f   C N r 1   s e l e c t   i n d i v i d u a l   N
(4)
GA-Crossover
The crossover operation uses single-point crossover to generate new individuals.
  • Parent Selection
The two parent individuals, denoted as P1 and P2, are randomly selected from the population.
P 1 = λ p 1 , L E D F 1 , x R O P A 1
P 2 = λ p 2 , L E D F 2 , x R O P A 2
b.
Crossover Point Selection
A random crossover point c is chosen according to the following:
c = r a n d ( 0,1 )
c.
Gene Exchange
The segments before the crossover point are exchanged between the two parents, resulting in two offspring individuals, C1 and C2:
C 1 = λ p 1 · c + λ p 2 · 1 c , L E D F 1 · c + L E D F 2 · 1 c , x R O P A 1 · c + x R O P A 2 · 1 c
C 2 = λ p 1 · 1 c + λ p 2 · c , L E D F 1 · 1 c + L E D F 2 · c , x R O P A 1 · 1 c + x R O P A 2 · c
(5)
GA-Mutation
Gaussian mutation is employed to introduce new genetic material and enhance population diversity.
  • Mutation Individual Selection
One or more individuals are randomly selected for mutation:
x i = λ p u m p i , L E D F i , x R O P A i
b.
Mutation Gene Determination
The mutation probability, pm, is defined, representing the likelihood of each gene being mutated. For each gene, a random number in the interval [0, 1) is generated independently. If this random number is less than pm, the corresponding gene undergoes mutation as follows:
M u t a t i o n   G e n e = r a n d ( 0,1 )
c.
Gaussian Mutation
For the selected parent individual, a Gaussian mutation is applied to generate new candidate solutions. For each variable x i , a random number δ is sampled from the normal distribution N ( 0 , σ 2 ) , and this value is added to the original value to obtain the mutated value as follows:
x i = x i + δ
where x i m i n x i x i m a x . Here, x i m i n and x i m a x represent the lower and upper bounds of the parameter’s predefined range, respectively. Additionally, δ N ( 0 , σ 2 ) indicates a normal distribution with a mean of 0 and a variance of σ 2 .
The above operations are repeated for each variable. After mutation, the fitness of the mutated individual is computed and compared to that of the original individual. If the mutated individual exhibits higher fitness, it is retained; otherwise, the mutation result is discarded.
(6)
PSO—Fitness Evaluation
a.
Initialization
After GA completes the initial optimization, its optimal solution is used for the initial particle positions in the PSO algorithm. In the PSO algorithm, each particle i in a D-dimensional space is represented by D variables x i = [ x i 1 , x i 2 , , x i D ] , corresponding to the pump wavelength, EDF length, and ROPA position.
The initial positions of the particle swarm are randomly generated within the search space, and velocities can be either randomly initialized or based on heuristic methods.
b.
Fitness Computation
For the i-th particle:
Current velocity: v i t = [ v i 1 t , v i 2 t , v i 3 t ]
Current position: x i t = [ λ i 1 t , L E D F i t , x R O P A i t ]
Personal best position: p b e s t i t = [ λ p i b e s t , L E D F i b e s t , x R O P A i b e s t ]
Global best position: g b e s t t = [ λ p g b e s t , L E D F g b e s t , x R O P A g b e s t ]
The fitness value of each particle is computed based on the fitness function: f λ p i , L E D F i , x R O P A i .
(7)
PSO—Updating Personal and Global Best Positions
a.
Updating Personal Best Position
If the current fitness value is higher than the historical best value p b e s t i , then p b e s t i is updated as follows:
p b e s t i t = x i t   i f   f x i t > f ( p b e s t i t 1 )
b.
Updating Global Best Position
If the current particle’s fitness value is higher than the global best value g b e s t , then g b e s t is updated as follows:
g b e s t t = x i t   i f   f x i t > f ( g b e s t t 1 )
(8)
PSO—Updating Velocity and Position
The PSO algorithm updates the velocity and position of particles using the following equations:
v i t + 1 = ω · v i t + c 1 · r 1 · p b e s t i t x i t + c 2 · r 2 · g b e s t t x i t
x i t + 1 = x i t + v i t + 1
where v i j t + 1 is the velocity of the i-th particle in the j-th dimension at generation t + 1; x i j t + 1 is the position of the i-th particle in the j-th dimension at generation t + 1; and ω is the inertia weight, typically in the range (0, 1). c1 and c2 are acceleration constants, usually in the range (1, 2); r1 and r2 are random numbers uniformly distributed between 0 and 1; p b e s t i j t is the historical best position of particle i in dimension j at generation t; and g b e s t j t is the global best position in dimension j at generation t.
Specifically, for pump wavelength, EDF length, and ROPA position, the following are established:
v i 1 t + 1 = ω · v i 1 t + c 1 · r 1 · λ p i b e s t λ p i t + c 2 · r 2 · λ p g b e s t λ p i t
v i 2 t + 1 = ω · v i 2 t + c 1 · r 1 · L E D F i b e s t L E D F i t + c 2 · r 2 · L E D F g b e s t L E D F i t
v i 3 t + 1 = ω · v i 3 t + c 1 · r 1 · λ R O P A i b e s t x R O P A i t + c 2 · r 2 · x R O P A g b e s t x R O P A i t
x i 1 t + 1 = x i 1 t + v i 1 t + 1
x i 2 t + 1 = x i 2 t + v i 2 t + 1
x i 3 t + 1 = x i 3 t + v i 3 t + 1
Steps (6–8) above are repeated until the maximum number of iterations is reached or the fitness value satisfies the convergence criterion. After completing the PSO optimization, the best solution is input into the SA algorithm for further refinement to avoid local optima.
(9)
SA—Temperature Reduction
First, it is necessary to set the initial temperature T0 and final temperature Tend. Typically, T0 should be sufficiently high to allow the algorithm to escape local optima.
For the temperature reduction strategy, an exponential temperature reduction approach was adopted due to its superior convergence properties and relatively simple parameter tuning. The cooling process is governed by the following:
T k + 1 = T k · α
where T k + 1 represents the temperature at iteration k + 1; T k is the temperature at iteration k; and α (0.9 < α < 1) denotes the cooling rate factor.
The decision to accept a new solution follows the Metropolis criterion. If the new solution has higher fitness, it is always accepted. For inferior solutions, acceptance depends on the following probability:
P a c c e p t = min 1 , exp f n e w f c u r r e n t k B · T
where   f n e w   and   f c u r r e n t   represent the fitness of the new and current solutions, respectively; kB is the Boltzmann constant; and T is the current temperature. If P a c c e p t > r a n d ( 0,1 ) , the new solution x n e w is accepted. Subsequently, the temperature is updated according to the cooling strategy, and the process is repeated until T < Tend.
After completing steps (1–9), steps (3–9) are repeated until one of the following termination conditions is met: the maximum iteration count is reached, the fitness improvement stagnates, or the output values satisfy system requirements.
Notably, the convergence time of the algorithm depends on the magnitudes of variable changes, such that larger magnitudes make it difficult to obtain optimal values, and excessively small magnitudes result in significantly prolonged convergence times. A balance between these two extremes can be achieved by initially employing larger magnitudes to roughly identify the interval containing the optimal value, followed by smaller magnitudes within this interval through iterative refinement.

3.2. Computational Results

A hierarchical iterative strategy was employed to optimize the system performance. The process began with a coarse-grained search over wide parameter ranges to identify promising regions of the solution space, followed by progressively refined iterations to pinpoint the optimal values for the ROPA position, EDF length, and pump frequencies.
The initial iteration, with larger step sizes, indicated that the optimal ROPA position was between 250 and 300 km from the transmitter. Subsequent iterations narrowed this range and refined the other parameters. Through this process, the optimal configuration was systematically determined as: ROPA position = 272 km, EDF length = 10.8 m, first-order pump frequency = 201.5 THz (≈1487.8 nm), and second-order pump frequency = 216.5 THz (≈1387.9 nm). A final iteration for pump power matching indicated that a first-order pump power of 0.4 W and a second-order pump power of 1 W yielded the highest OSNR.
The detailed step-by-step results of each iteration, including the corresponding figures (Figure A1, Figure A2, Figure A3, Figure A4, Figure A5 and Figure A6) and data, are provided in Appendix A.
In the target application scenario, the communication distance exceeds 600 km, meaning that the aforementioned configuration alone is insufficient, and further signal light amplification is necessary. One potential approach is to use the output power derived from previous calculations as the input power for a second stage of amplification. Then, the EDF length and ROPA placement for this second amplification stage can be determined using similar methods. Figure 6 presents the block diagram of the simulation system after adding the second-stage amplification system based on Figure 4.
The input signal power for the second amplification stage can also be set to −40 dBm. If the input power of the first stage signal light is set to 0 dBm, the attenuation coefficient of the fiber is 0.155 dB/km, and the remaining power of the signal light after amplification in the first stage is approximately 20 dBm.
Analogous calculations indicate that the optimal EDF length in the second-stage amplification system is approximately 10 m, and the ROPA can be up to 185 km from the receiver. Experimental verification was conducted based on these computational results (refer to Section 4).

3.3. Simulation Results

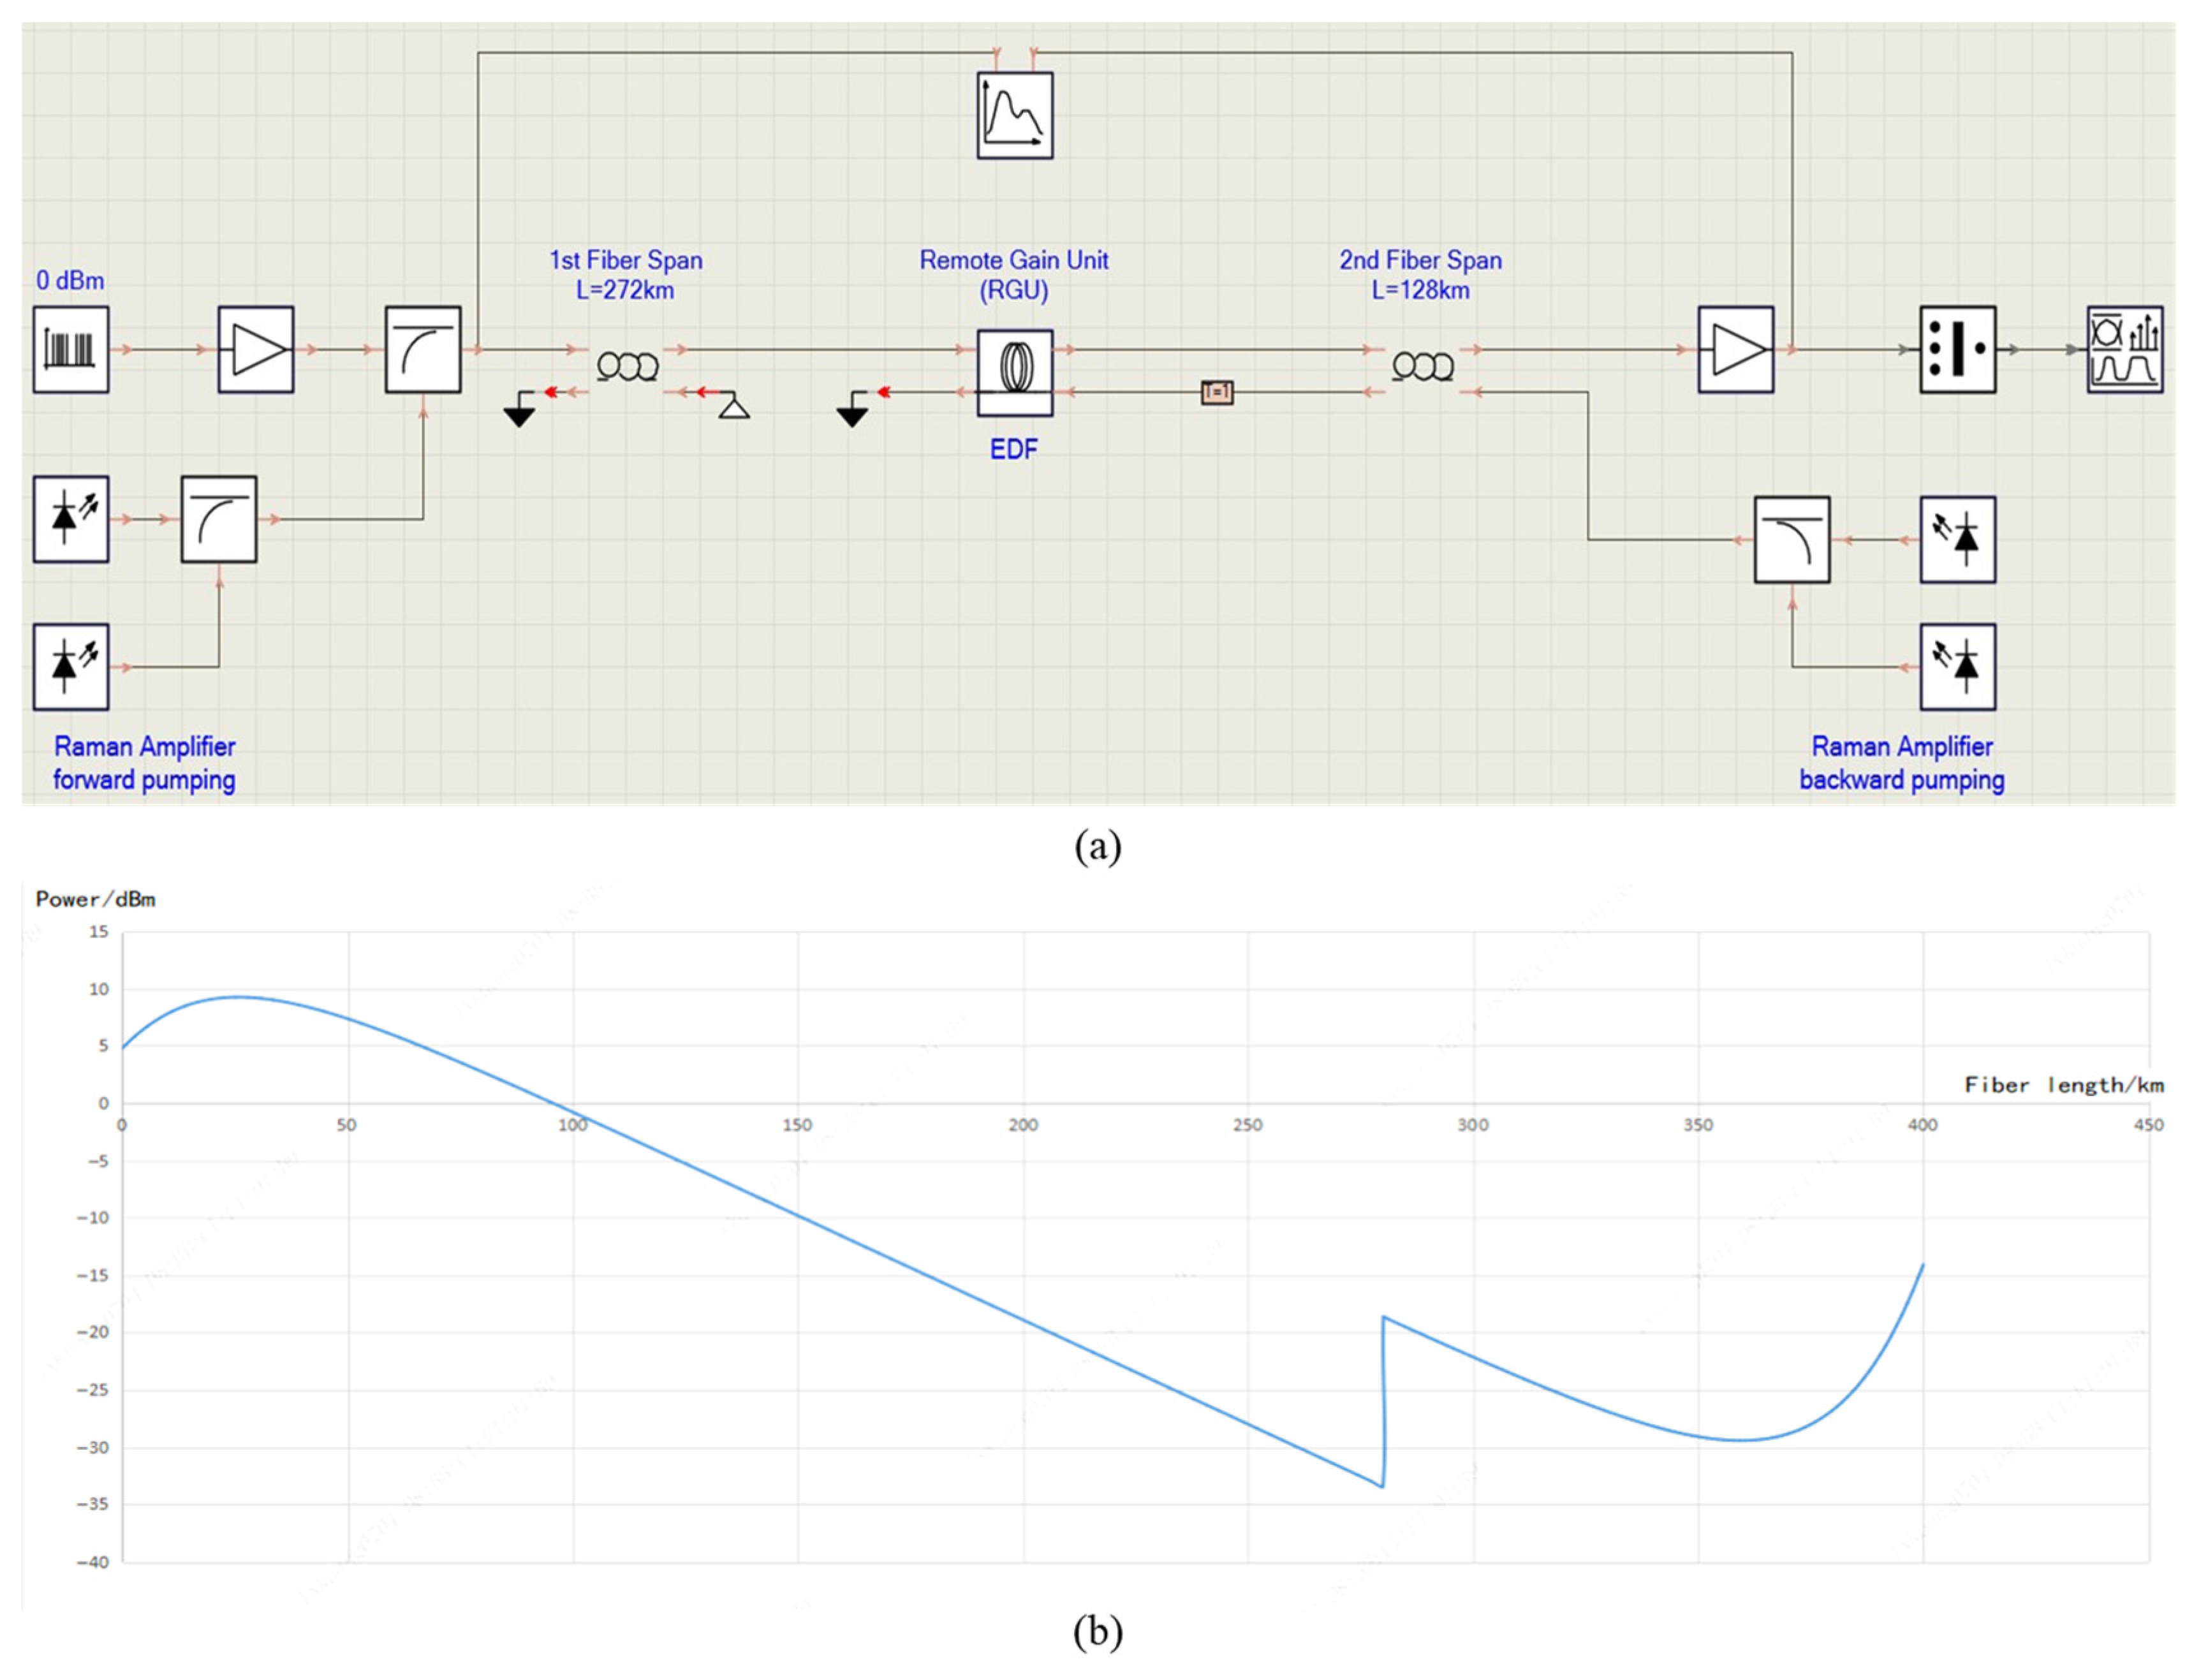
A VPI photonics (version 11.4) software was used for simulation validation based on the computational results. A schematic diagram of the system is shown in Figure 4, with the optical link comprising a forward Raman amplifier + fiber (272 km, G.652) + RGU (same fiber with forward remote pump and different fiber with backward remote pump) + fiber (128 km, G.652) + backward Raman amplifier. The simulation system configuration and results are presented in Figure 7.
For longer transmission systems, G.654 fiber is required. An experimental system was constructed to validate the computational findings.

4. Experimental Verification

4.1. Experimental Configuration

Considering that most mainstream commercial submarine communication systems operate at a rate of 100 Gb/s, the experiments conducted in this study aimed to verify the maximum transmission distance under 100 Gb/s conditions.
(1)
Optical Fiber
The experiment employed an ultra-low-loss, large effective area fiber; its basic parameters are summarized in Table 1.
The total length of the tested fiber was 691.8 km, as shown in Figure 10.
(2)
Light Source and Optical Amplifier Module
The basic parameters of the light sources and optical amplifier modules are presented in Table 2.
The pump light source’s frequency limitation dictates the optimal signal wavelength (1563.86 nm), which serves as the experimental baseline.
(3)
Transmission Equipment
A third-order Raman amplification scheme was employed in the experiment, and the associated equipment is shown in Figure 8b–d.

4.2. Experimental Design

The logical connection diagram of the experimental system is shown in Figure 9.
A different fiber remote pumping scheme was employed, in which the signal light and the pump light propagated through different optical links. A total of seven optical links were established. The first three links served as signal links (lines 1, 2, 3), using optical fibers with an effective area of 130 μm2 and a loss coefficient of 0.150 dB/km. Optical fibers with such large effective areas and low losses can reduce nonlinear effects and transmit high-power optical signals.
The forward ROPA was 124.8 km away from the transmitting equipment, and the backward ROPA was 182.1 km away from the receiving equipment. The distance between the two ROPAs was 384.9 km, and the total length of the optical path was 691.8 km, with a span loss of 106.1 dB (excluding the losses of the ROPAs). The average fiber loss coefficient (including welding loss) was 0.1534 dB/km, and the transmission wavelength was 1563.86 nm.
Figure 10 presents the test results for signal optical links (Line1, Line2, and Line3) by OTDR.
The other four links functioned as pumping links (lines 4, 5, 6, 7), using optical fibers with an effective area of 110 μm2. The lengths of the forward and backward pumping optical links were 125.6 and 181.6 km, respectively, and filters were configured to reduce the frequency of the pumping light to maximize the pumping power.
On the transmitter side, the integrated coherent board generates a dual-carrier modulated signal to produce a GS-BPSK format for a 100 Gb/s signal. Then, the signal passes through a wavelength selection switch (WSS) and is compensated by a dispersion compensation module (DCM) at −850 ps/nm dispersion. After amplification by the EDFA module, the signal enters the first-order Raman amplifier board. Following this amplification stage, the signal enters the fiber with an effective area of 130 μm2. Finally, after passing through two ROPA units, the signal enters the backward third-order Raman amplifier, followed by the WSS channel for de-multiplexing after amplification by the EDFA.

4.3. Experimental Results and Analysis

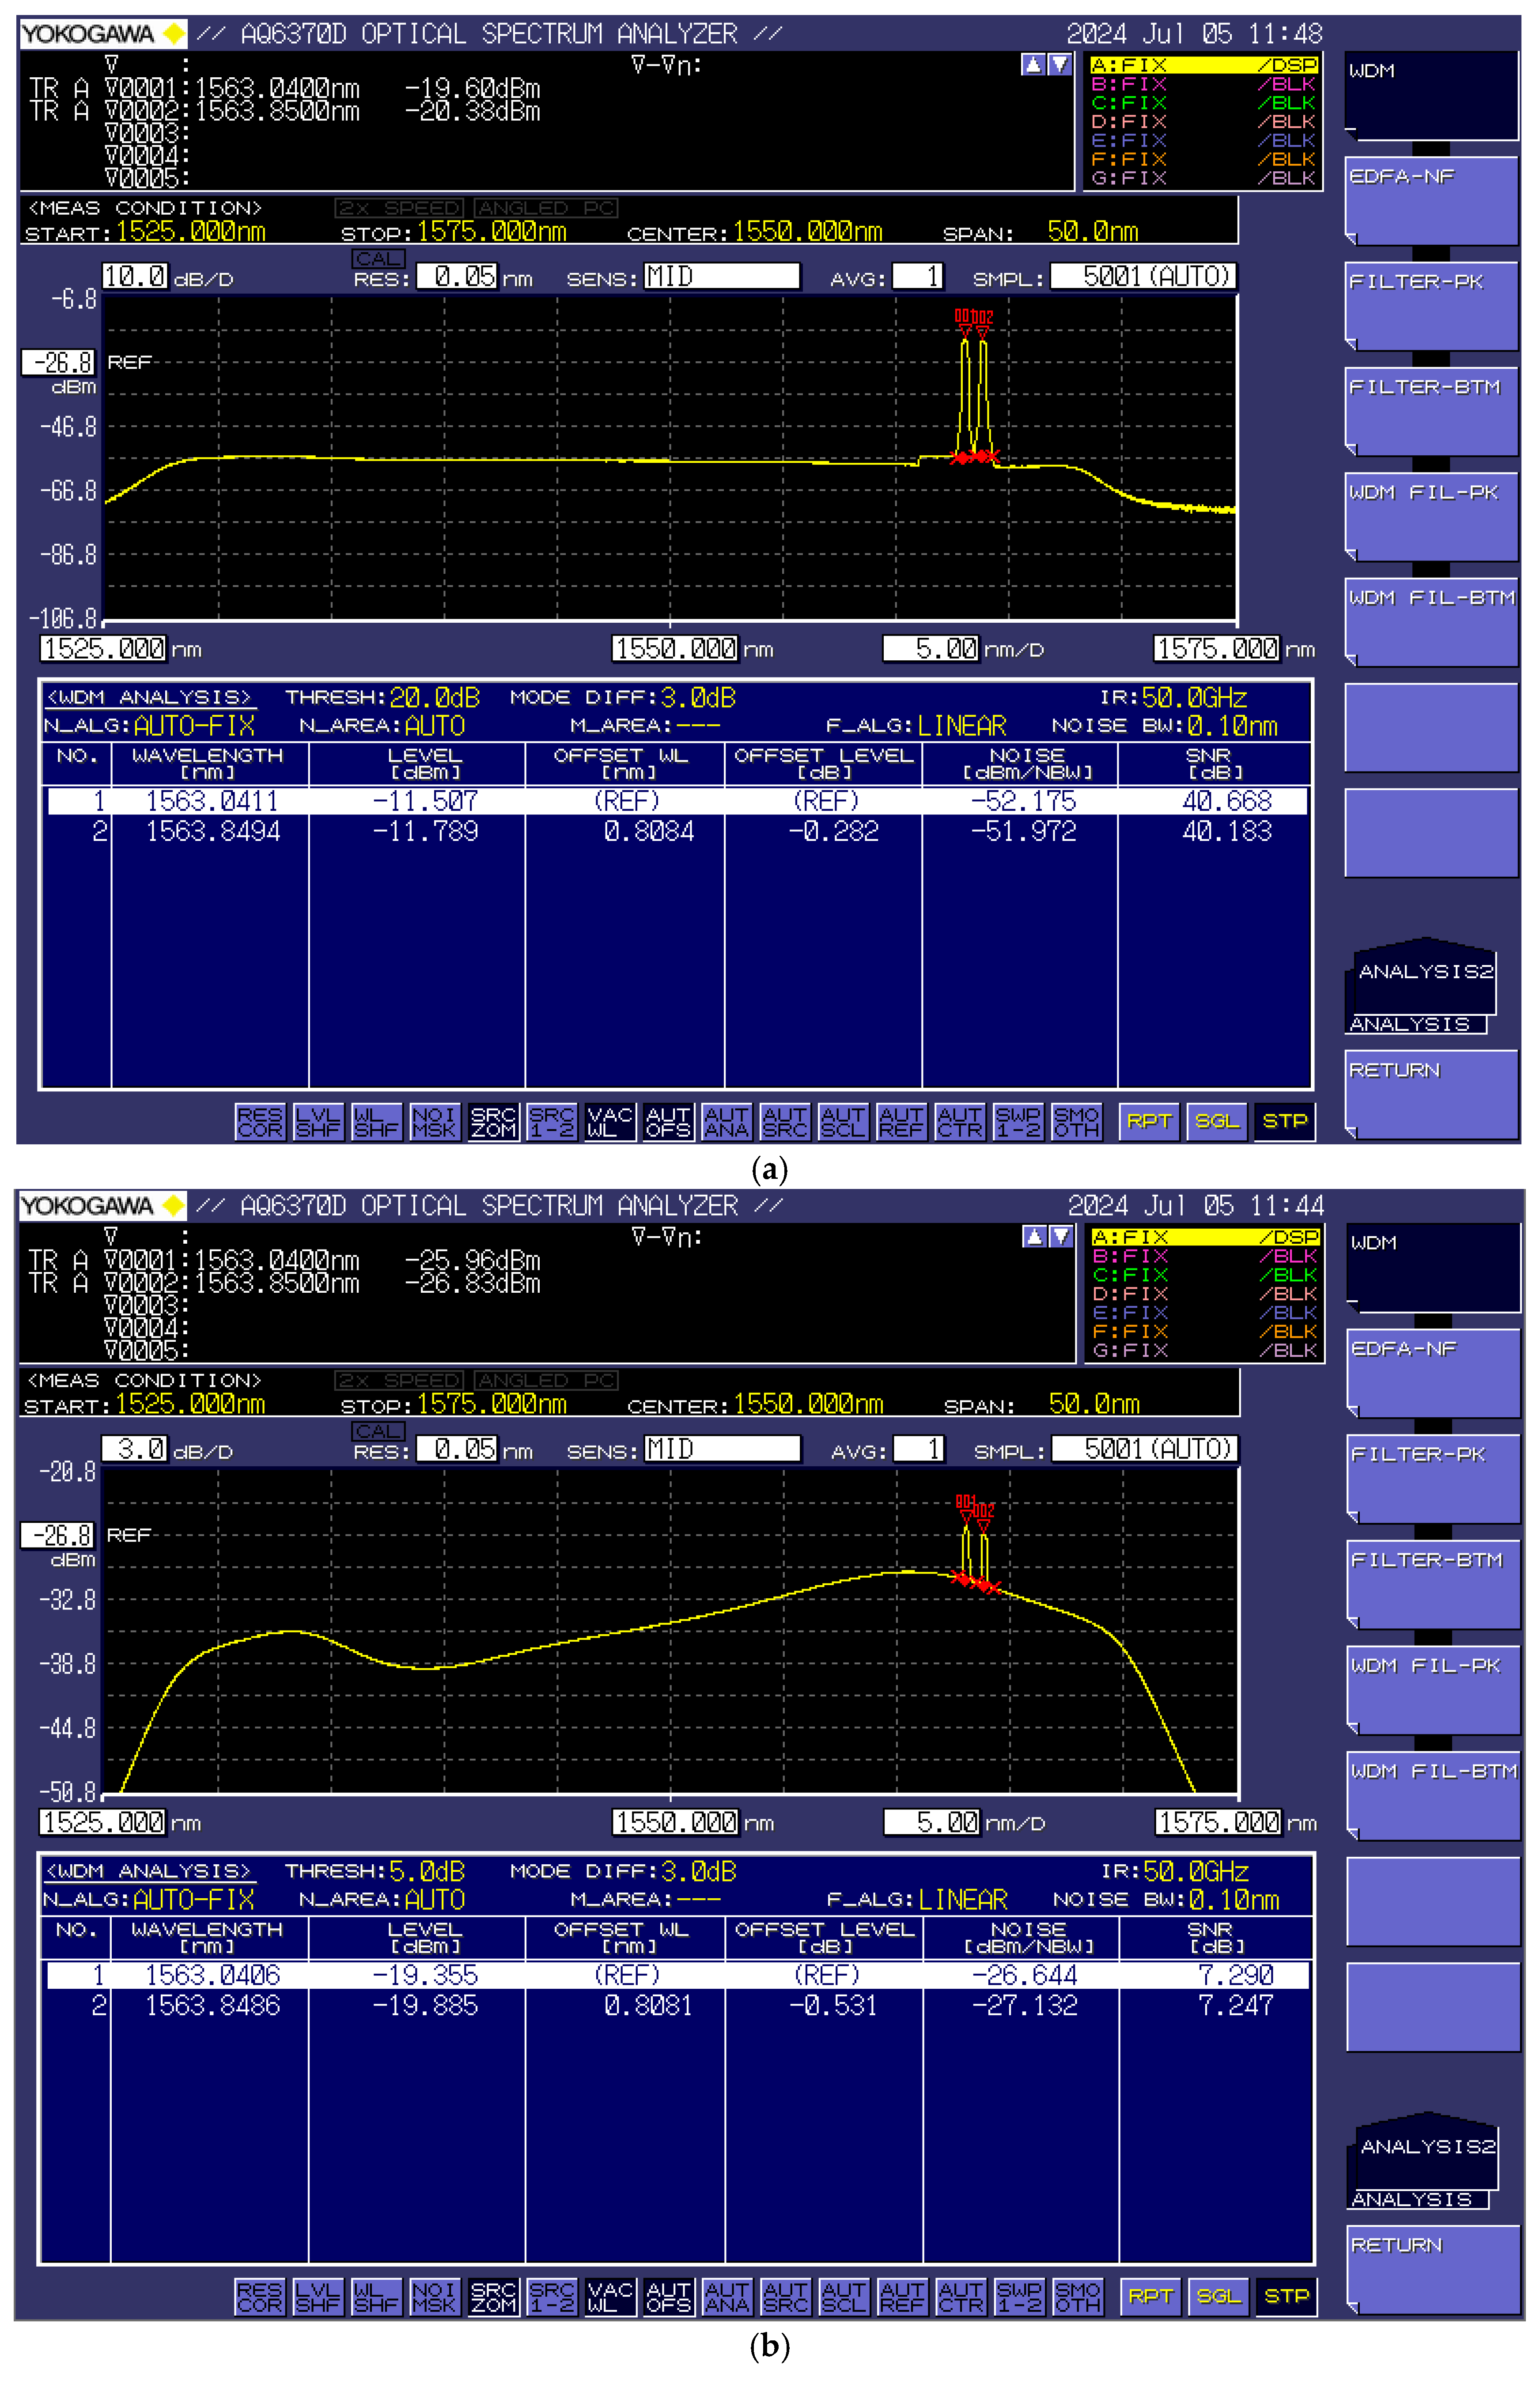
Figure 11 shows the power of the transmitter and the receiver, and Figure 12a shows the average power distribution of the signal light over the distance of 691.8 km. The signal light first undergoes forward-distributed Raman amplification and is then amplified by the forward ROPA, attenuated by the fiber, and amplified by the backward ROPA. Finally, the signal light undergoes backward-distributed Raman amplification. The OSNR measured at the receiver was 7.29 dB/0.1 nm.
Long-term system stability was rigorously evaluated through continuous 24-h Q-factor monitoring (Figure 12b). The experimental results reveal exceptional stability with a mean Q-value of 5.15 dB and limited peak-to-peak fluctuation (within 0.1 dB), thus satisfying the strict requirements for submarine communication systems.
Overall, the simulation model effectively guided the experimental design and showed strong agreement in terms of trends and optimal parameter selection, although some quantitative differences existed due to distinct system configurations and practical conditions. Specifically, the simulation for the 400 km G.652D fiber system predicted an OSNR of ~20 dB and an optimal EDF length of ~10.8 m, which are consistent with the experimental baseline. For the 691.8 km G.654E fiber validation test, the measured OSNR was 7.29 dB/0.1 nm, and the received optical power was stable at the designed level, e.g., values were consistent with the extended distance and different fiber type, despite being lower than in the 400 km simulation. The discrepancies were attributed to practical factors such as additional splice losses, component variability, and the use of dual ROPAs in the long-haul experiment, which introduced extra noise that was not fully captured in the simplified simulations.
Indeed, these results demonstrate successful ultra-long-haul transmission over 691.8 km using G.654E fiber. However, it is crucial to understand the performance limitations when employing the more common G.652D fibers for distances exceeding 400 km, as highlighted by the simulations. Simulation data indicate that G.652D fiber exhibits significantly more OSNR degradation than G.654E fiber in unrepeatered transmissions exceeding 400 km. Analysis based on the generalized nonlinear Schrödinger equation and the Gaussian noise model revealed that this was due to the smaller effective area of G.652D fiber (~80 μm2), which led to a higher nonlinear coefficient (γ ≈ 1.3 W−1 km−1) than for the G.654E fiber (γ ≈ 0.8 W−1 km−1). Under the same input power, stronger nonlinear effects interacting with dispersion convert the signal power fluctuations into additional nonlinear interference noise, which becomes the dominant factor in OSNR degradation.
Under the conditions where P0 = 20 dBm and L = 400 km, the estimated NLI noise power is approximately –18.5 dBm, which is higher than the estimated ASE noise power (approximately –22 dBm), making it the primary limiting factor for the system’s OSNR. Therefore, from a practical engineering perspective, it is more feasible to select large effective area fibers (i.e., G.654E rather than G.652D) to ensure reliable transmission beyond 400 km.
This type of ultra-long span unrepeatered system nearly reaches the transmission distance limit of current technology. For other distances, rates, wavenumbers, and frequencies, the pump wavelength, pump power, RGU position, and many other system parameters may be different; the interested reader can refer to a previous report [41] for additional details and configurations.

5. Applications in Cabled Ocean Observatories

5.1. Case Study: Repeatered vs. Unrepeatered Schemes

(1)
Repeatered Scheme
Established large-scale COOs, such as NEPTUNE, OOI, DONET, and DONET2 [1,17,18,19,20,21,22,23,24], adopt repeatered schemes, in which a submarine optical repeater is installed every few tens of kilometers to extend the communication distance. The core component of such submarine optical repeaters is an EDFA, and power feeding equipment (PFE) must be deployed at onshore (or offshore) stations to supply power. This setup represents a continuation of long-distance submarine optical cable communication system schemes.
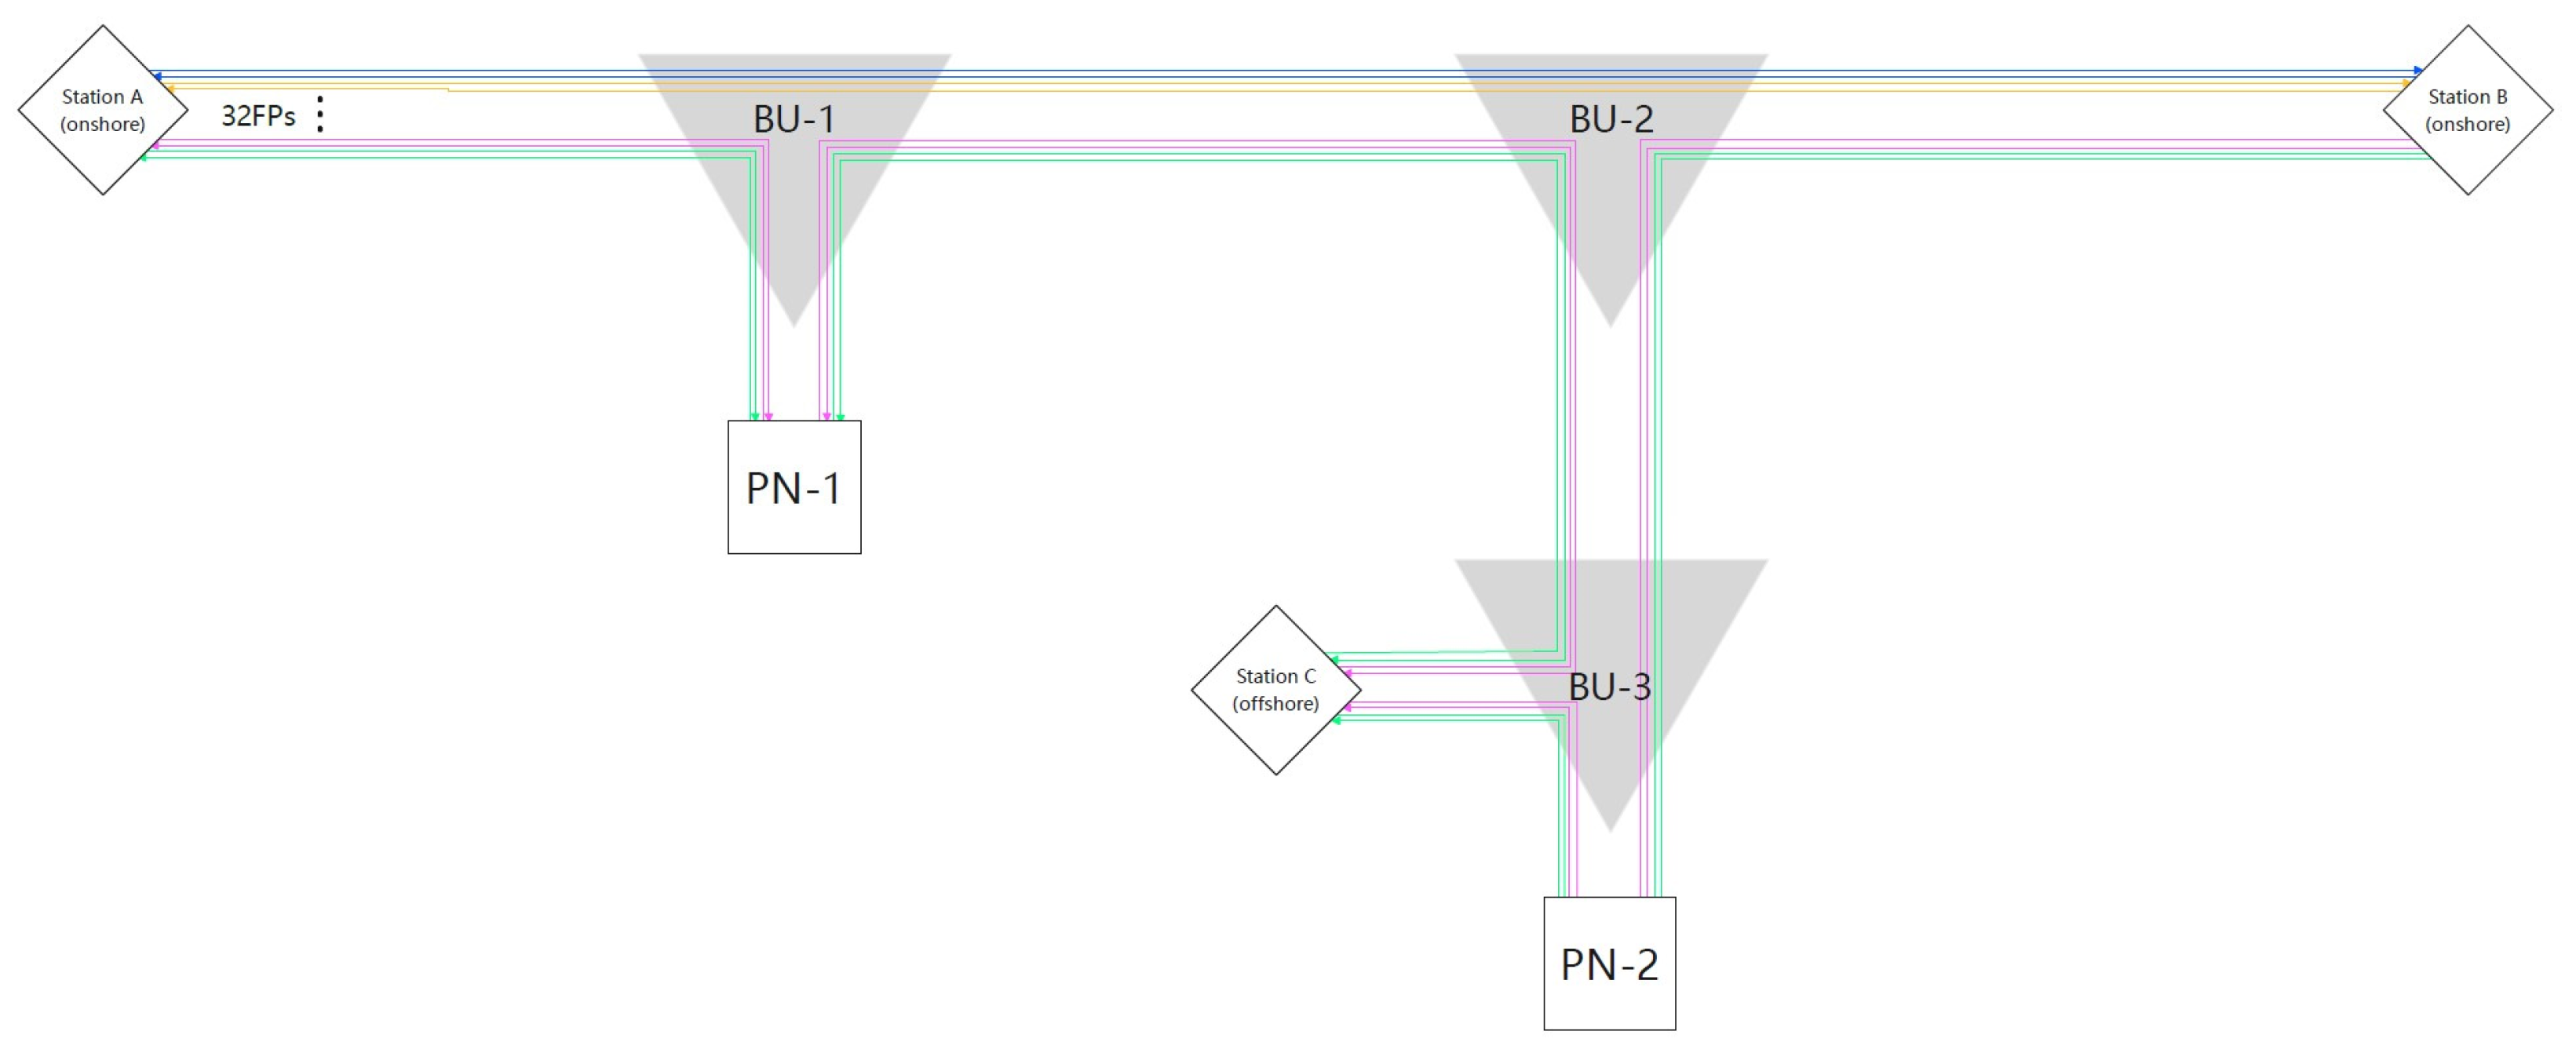
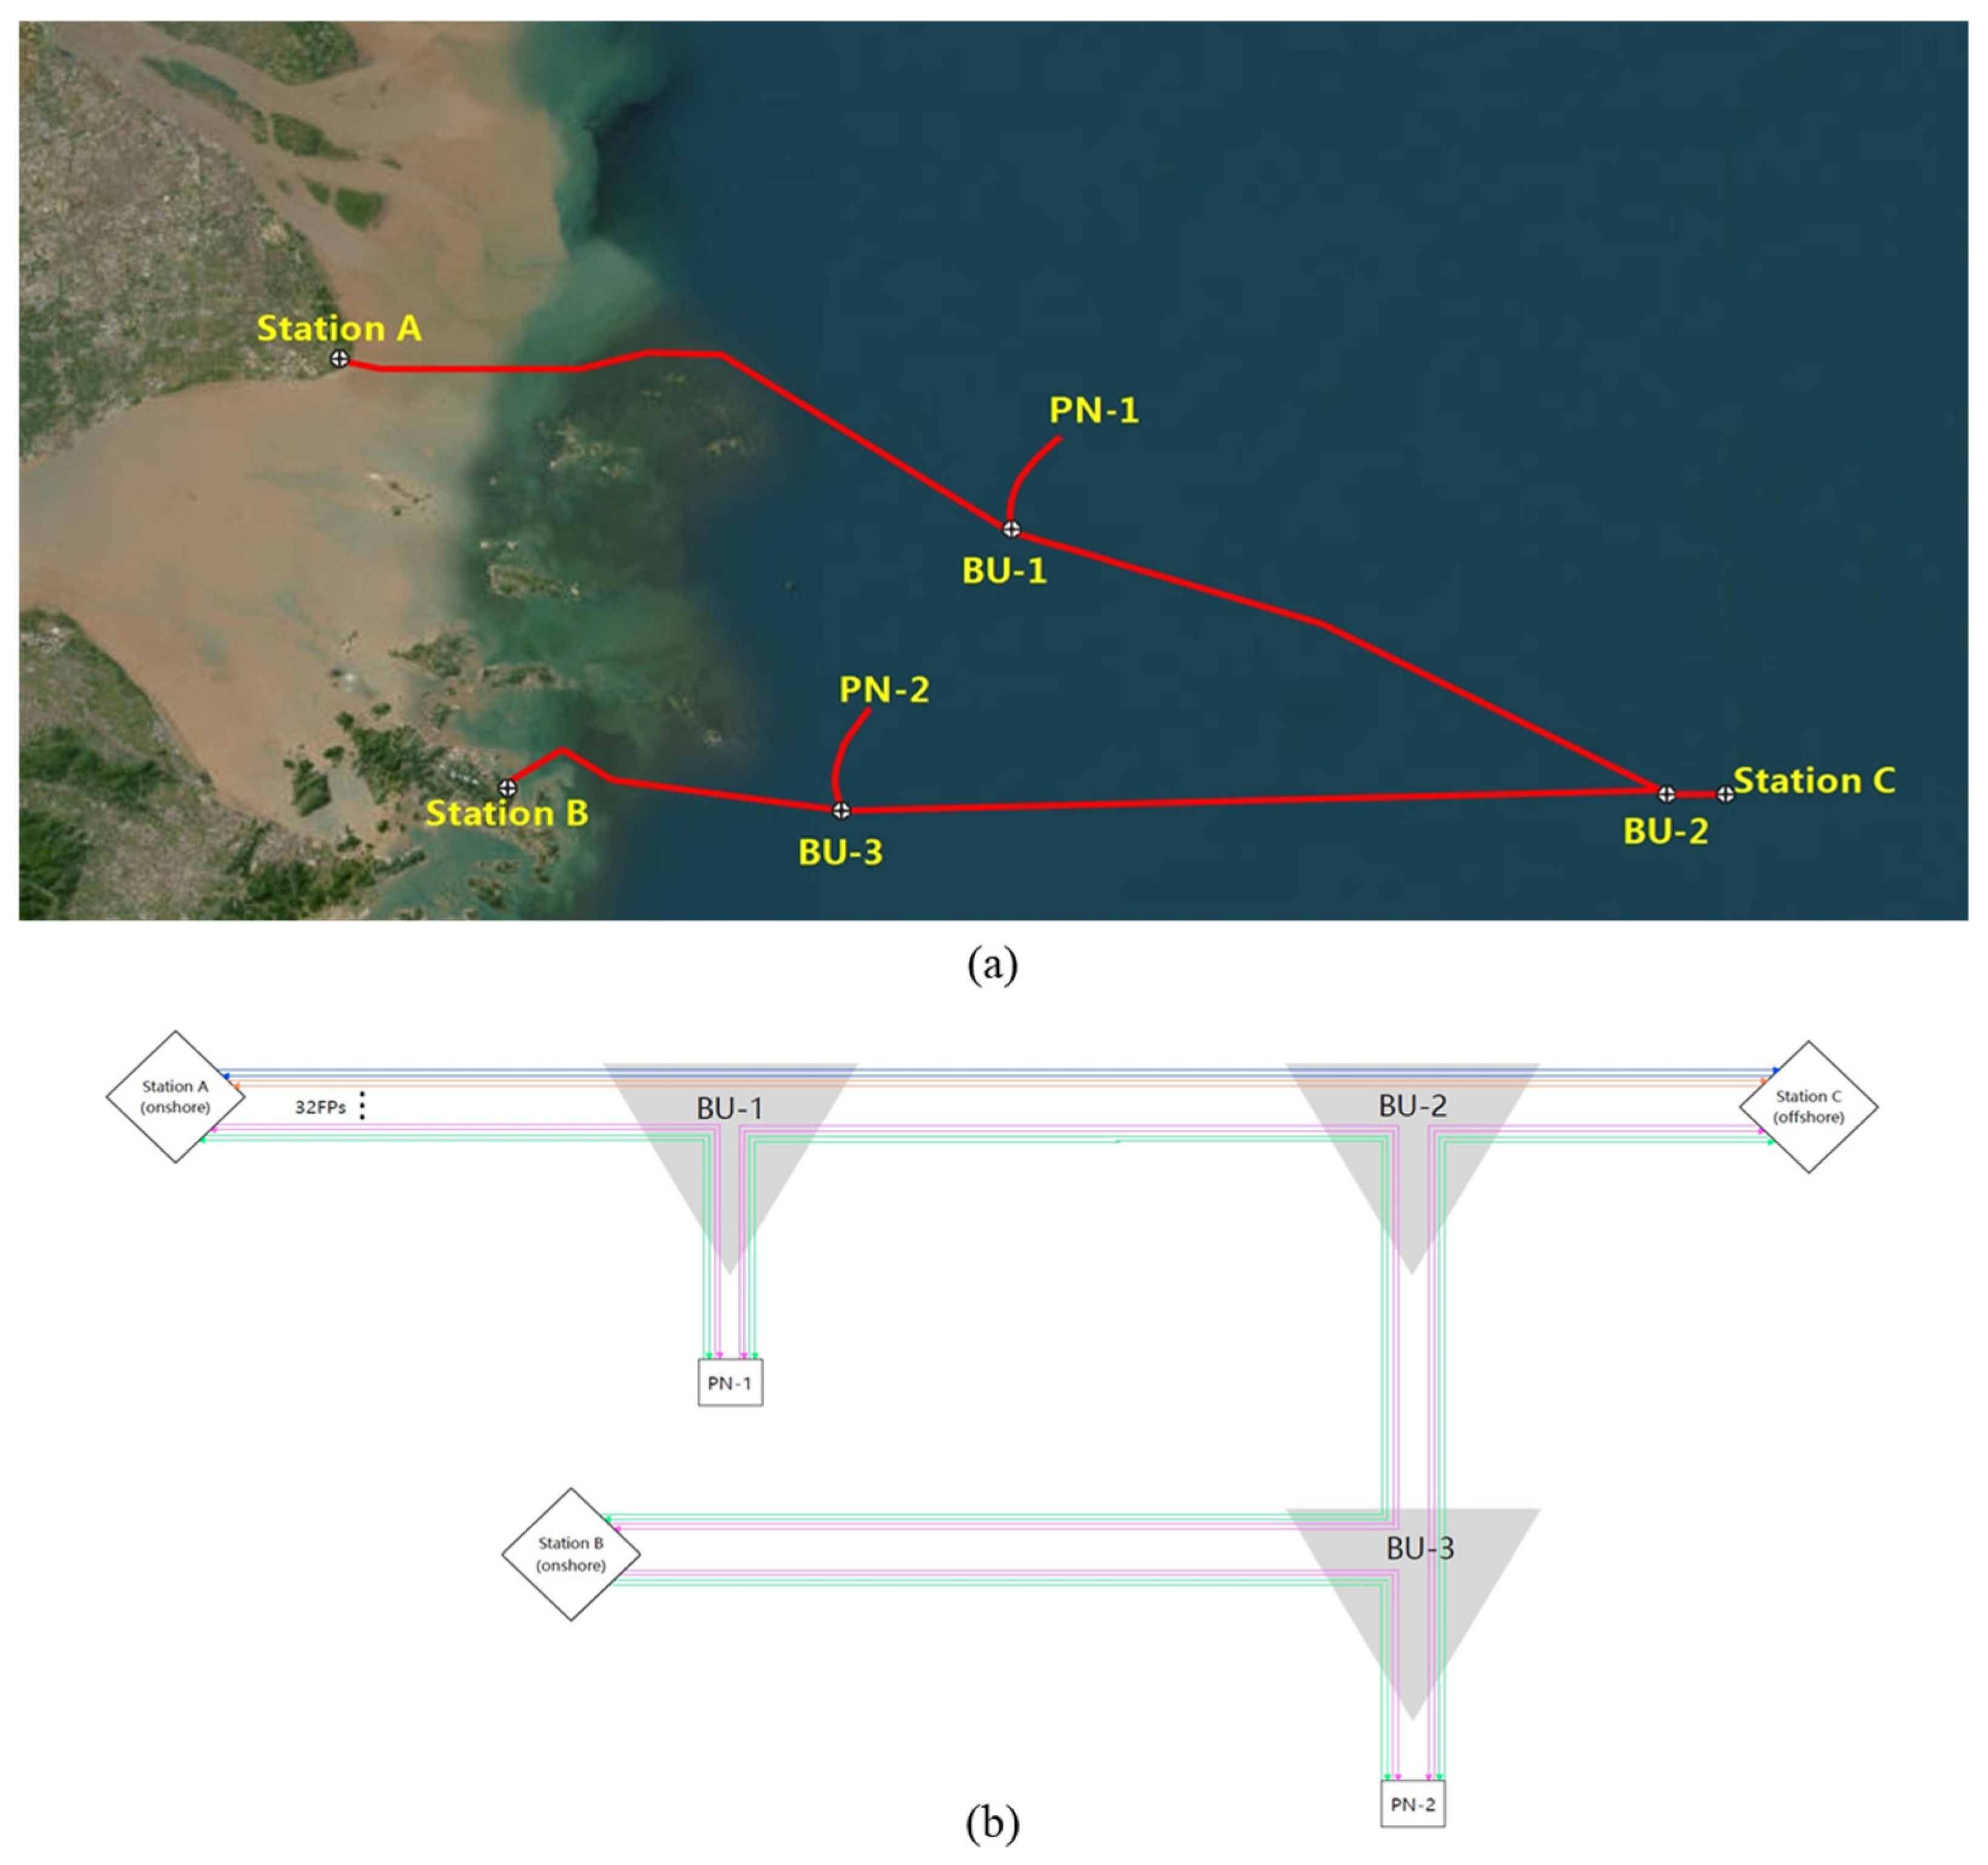
As an example for discussions, this study considers a COO (simplified structure) in the East China Sea, with two landing stations (Station A and Station B), two primary nodes, and one expandable access point (Station C). Based on the observation task and the sea area conditions, a Y-shaped route is planned, as shown in Figure 13a.
The total length of the backbone is approximately 544 km, and therefore, according to the traditional design scheme, a repeatered system is required, with optical amplifiers supporting the communication link. If the relay segment length calculation is omitted, the overall design scheme of the optical relay section for the backbone communication system is shown in Figure 13b, indicating that seven repeaters are required between Station A and Station B. In addition to the Station A-to-Station B section, two repeaters are required between Station C and BU-2. Thus, in total, nine repeaters are required for the entire backbone, and three branch units (BUs) are included to achieve the Y-shaped routing with access to two primary nodes and a reserve of an expandable access point.
(2)
Unrepeatered Scheme
The lengths of the three optical links on the backbone are as follows: Station A to Station C is ~363 km; Station B to Station C is ~266 km; and Station A to Station B is ~459 km. The lengths of the Station A-to-Station C and Station B-to-Station C optical links are both less than 400 km. The system optical link configuration is illustrated in Figure 14.
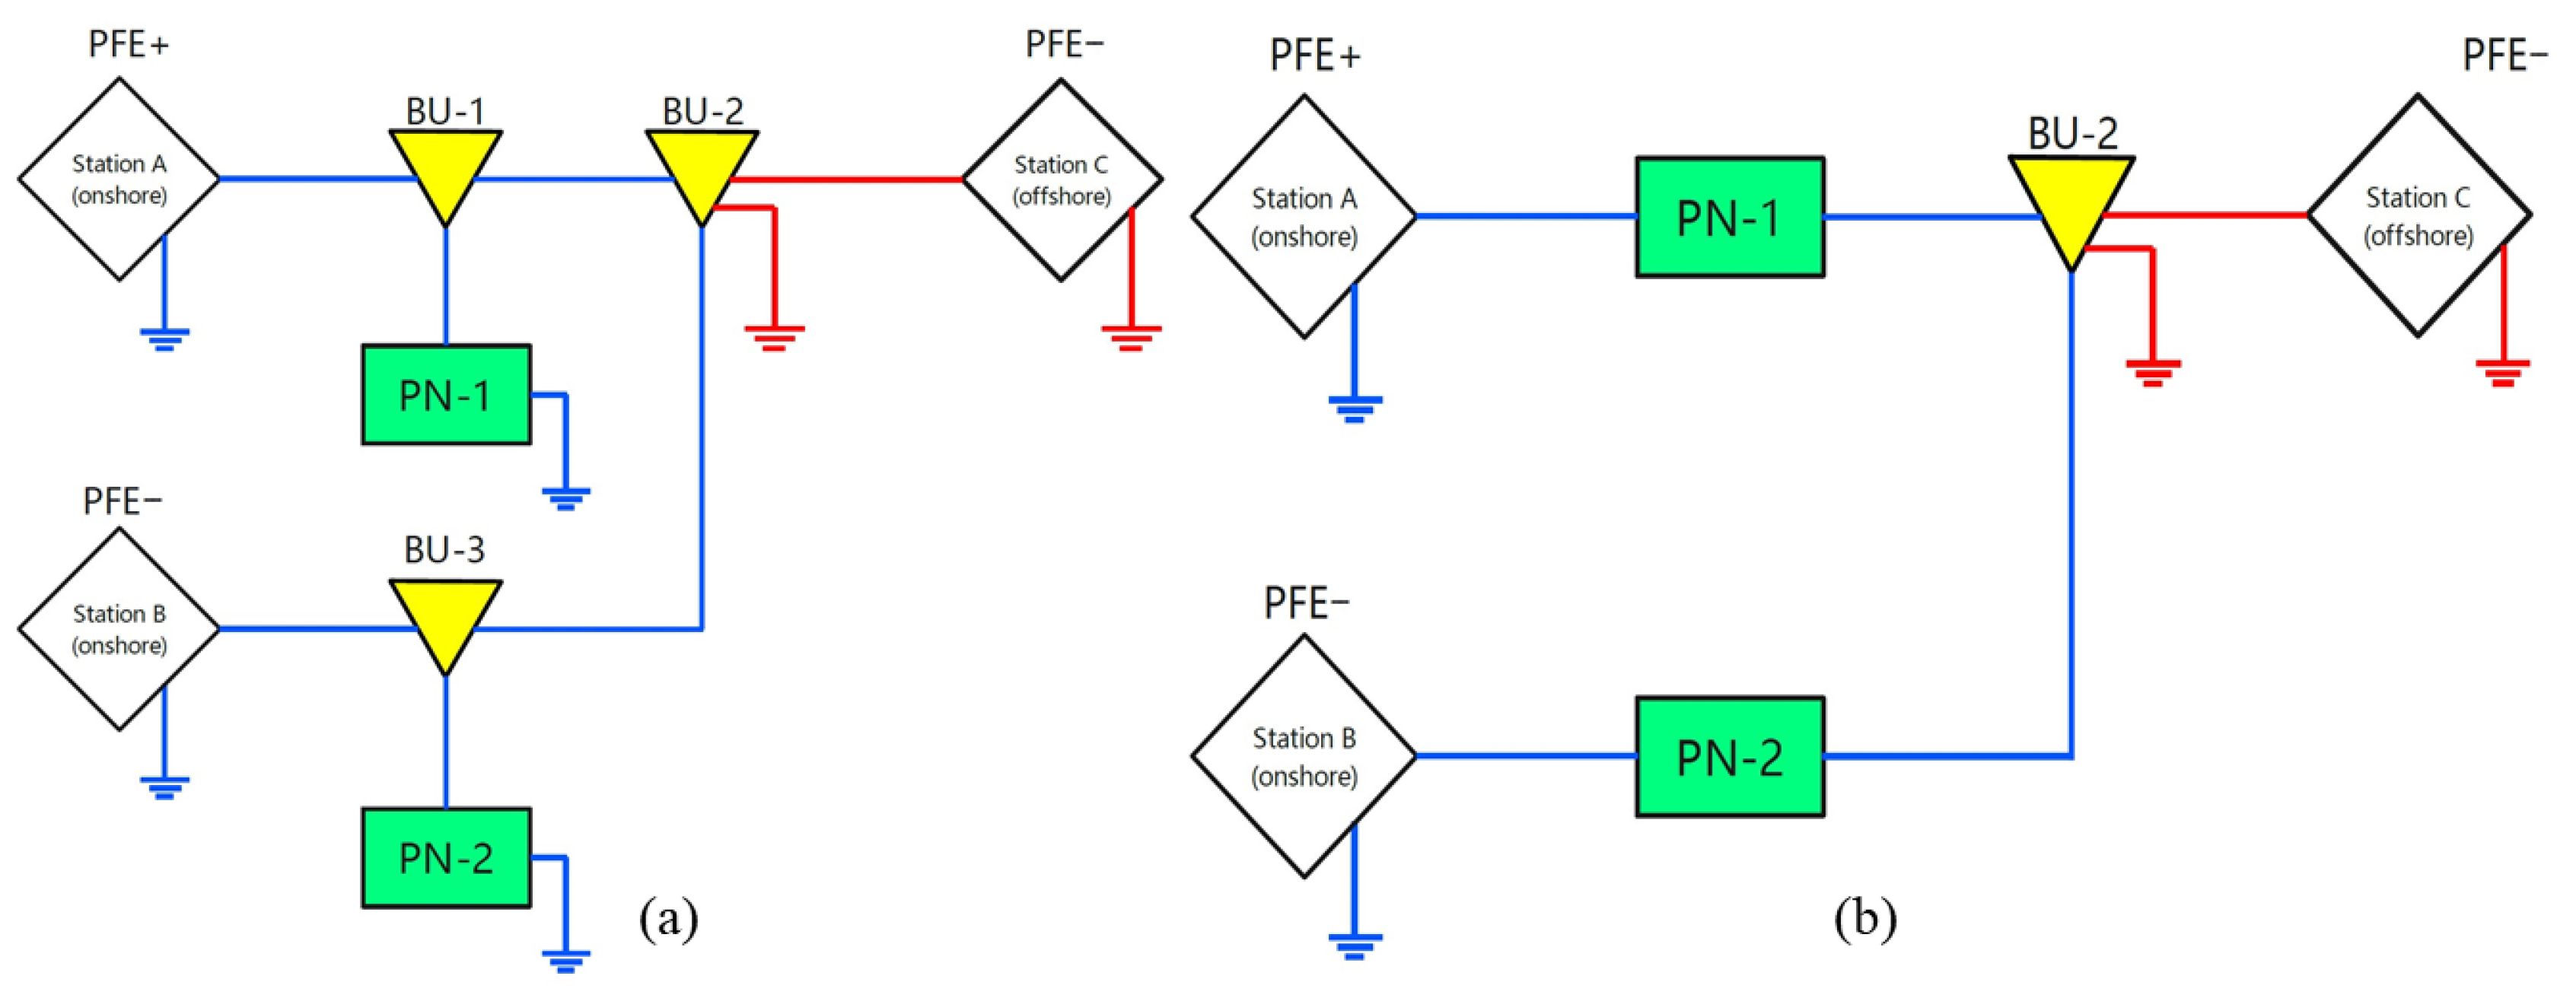
In terms of power supply, the constant current mode and the constant voltage mode both have advantages and disadvantages. Considering that numerous reports have evaluated these power supply modes, they are not discussed in detail herein; only a schematic diagram of the two modes is provided (Figure 15).
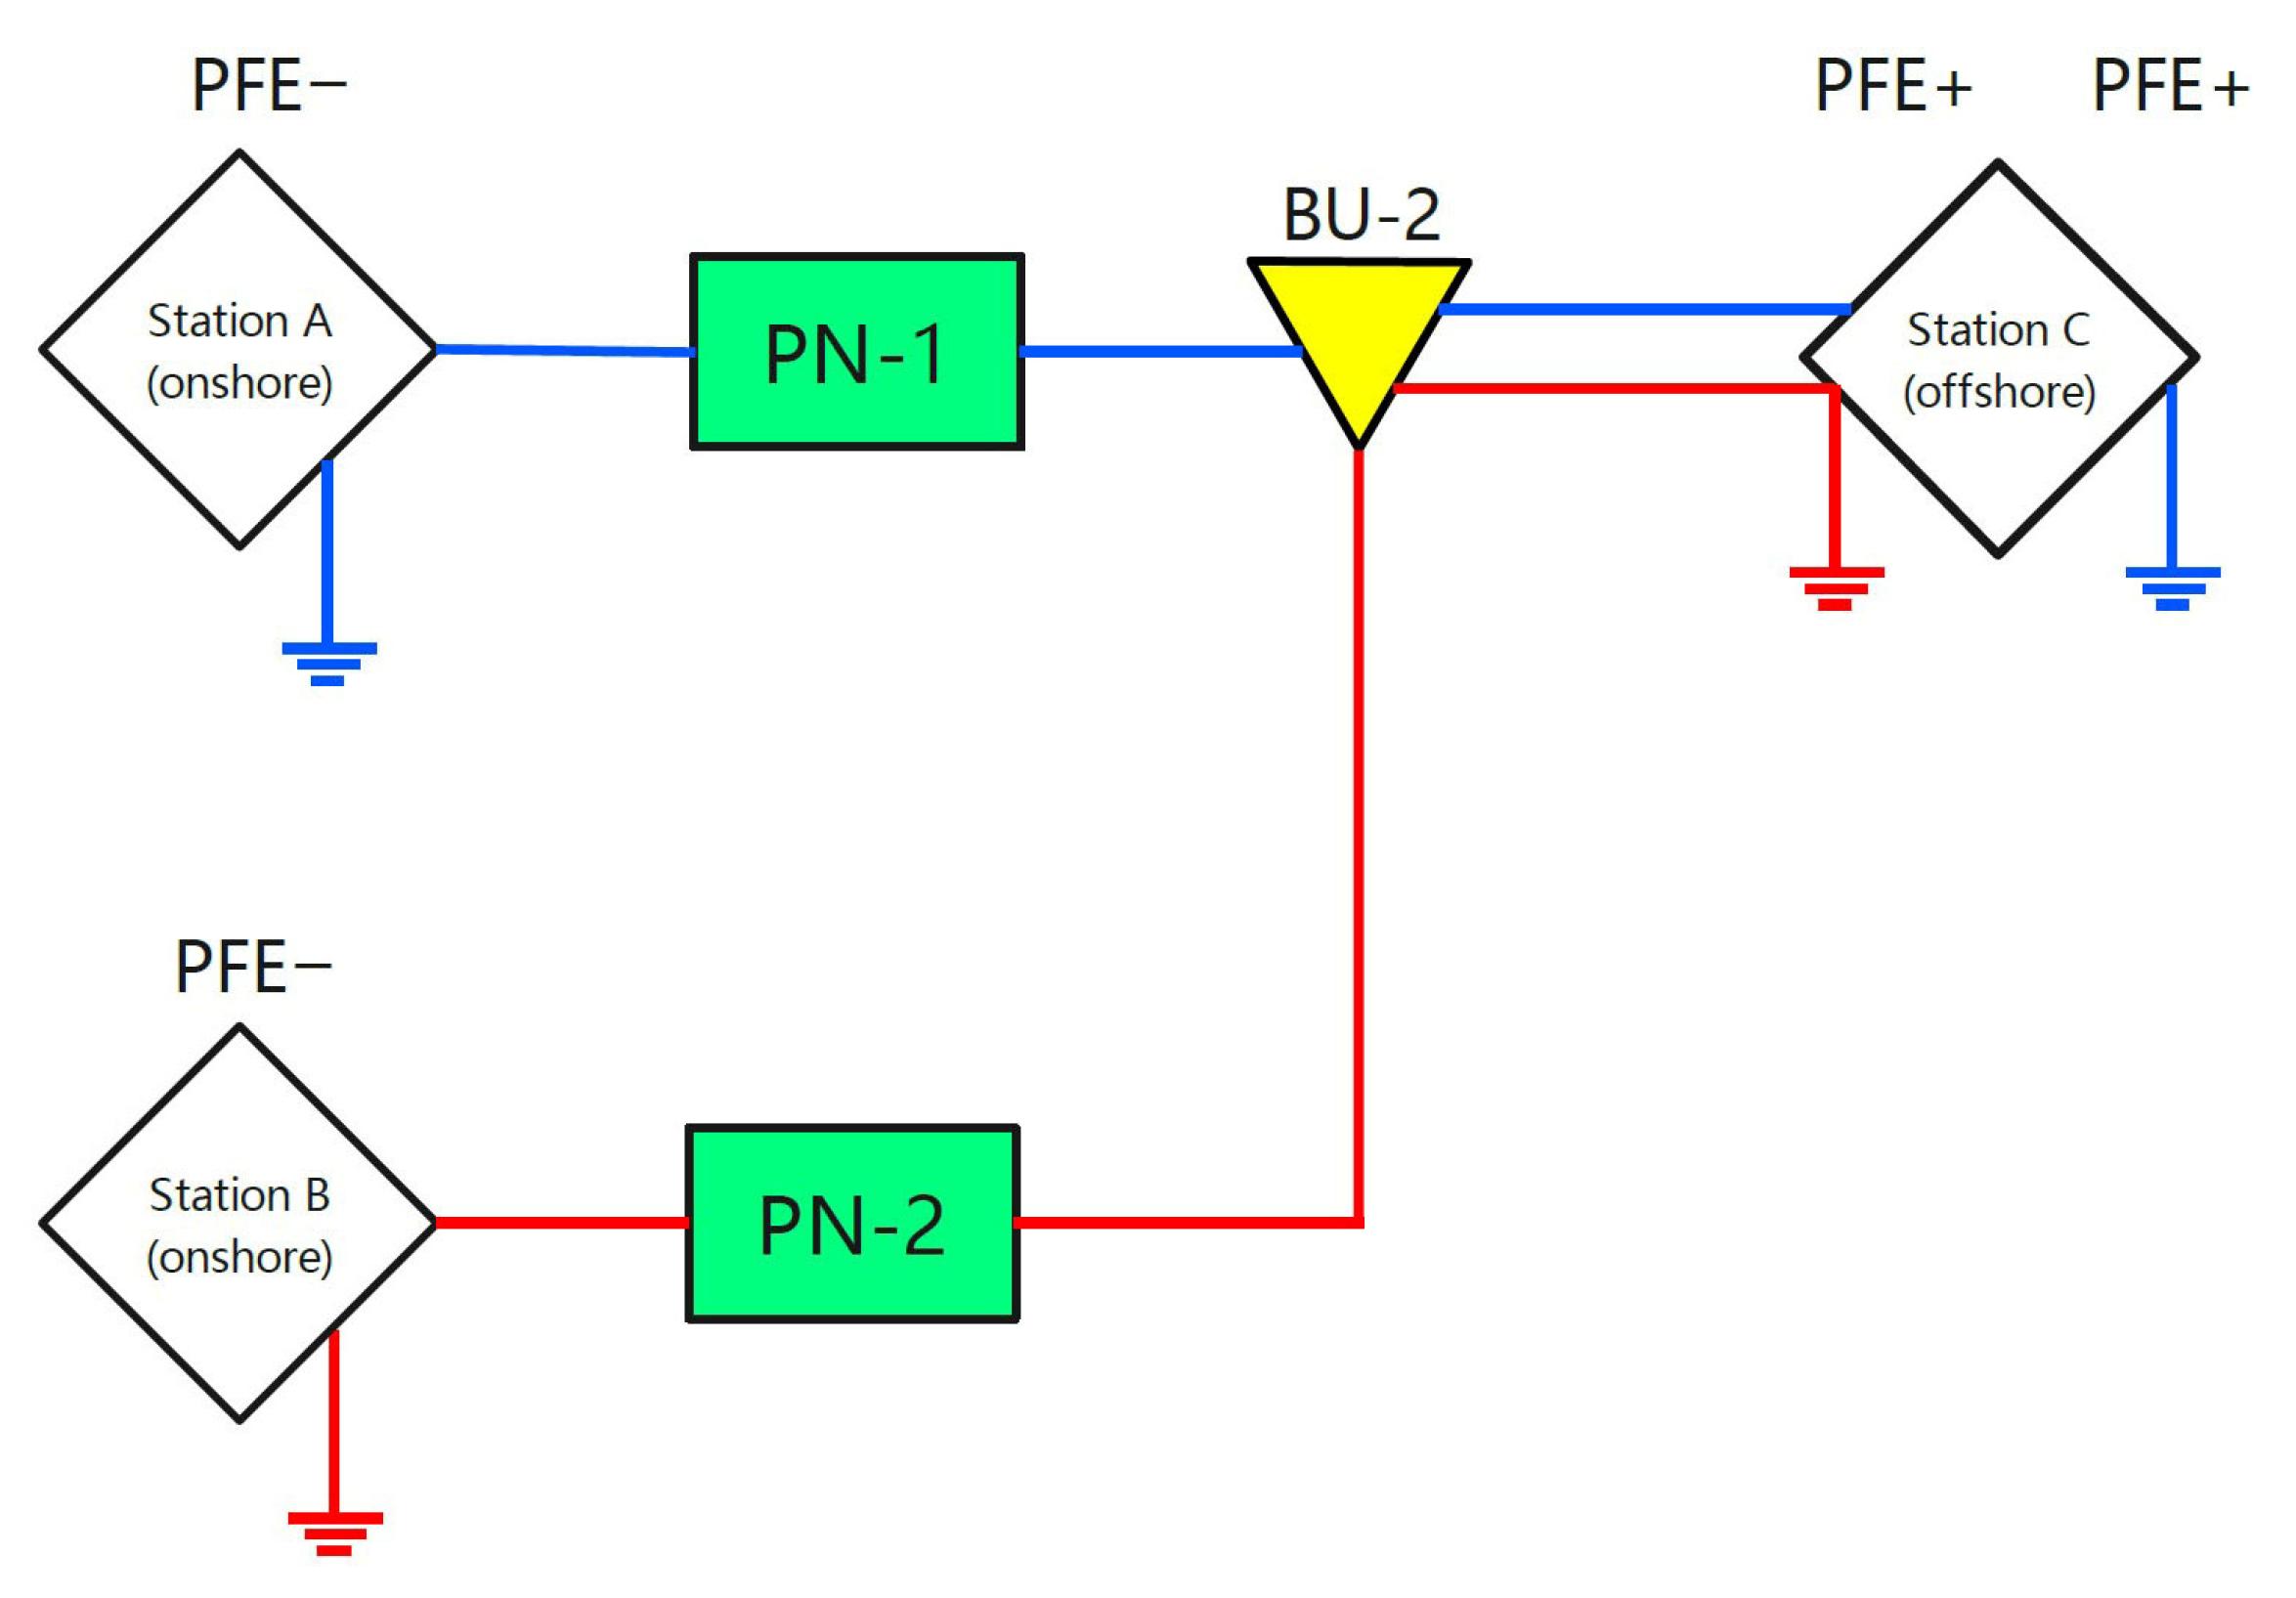
Notably, only two single-ended power supply systems can be used for the Y-shaped cable routing scheme, meaning that there must be a station with a single power supply mode provided to BU-2. A double-ended power supply mode cannot cover all primary nodes and would lead to low reliability. There are two potential approaches to address this issue:
(1)
Adjust the Cable Type
Any branch can be changed into a dual-conductor submarine cable. Taking Station C to BU-2 as an example, the power supply scheme after adjusting the cable type is depicted in Figure 16.
Because the system adopts an unrepeatered transmission mode, there is no need to adapt the dual-conductor submarine cable to repeaters, thus highlighting increased engineering feasibility relative to the analogous repeatered mode. Nevertheless, the performance stability when manufacturing long dual-conductor submarine cables remains a concern.
(2)
Adjust the Routing Scheme
Changing the Y-shaped route to a V-shaped route (Figure 17a) maintains coverage of the target observation area but increases the route length.
This V-shaped route is approximately 652 km in length, and its optical link configuration with an unrepeatered scheme (Figure 17b) would require the use of G.654E fibers.

5.2. Stimulation for Unrepeatered Scheme

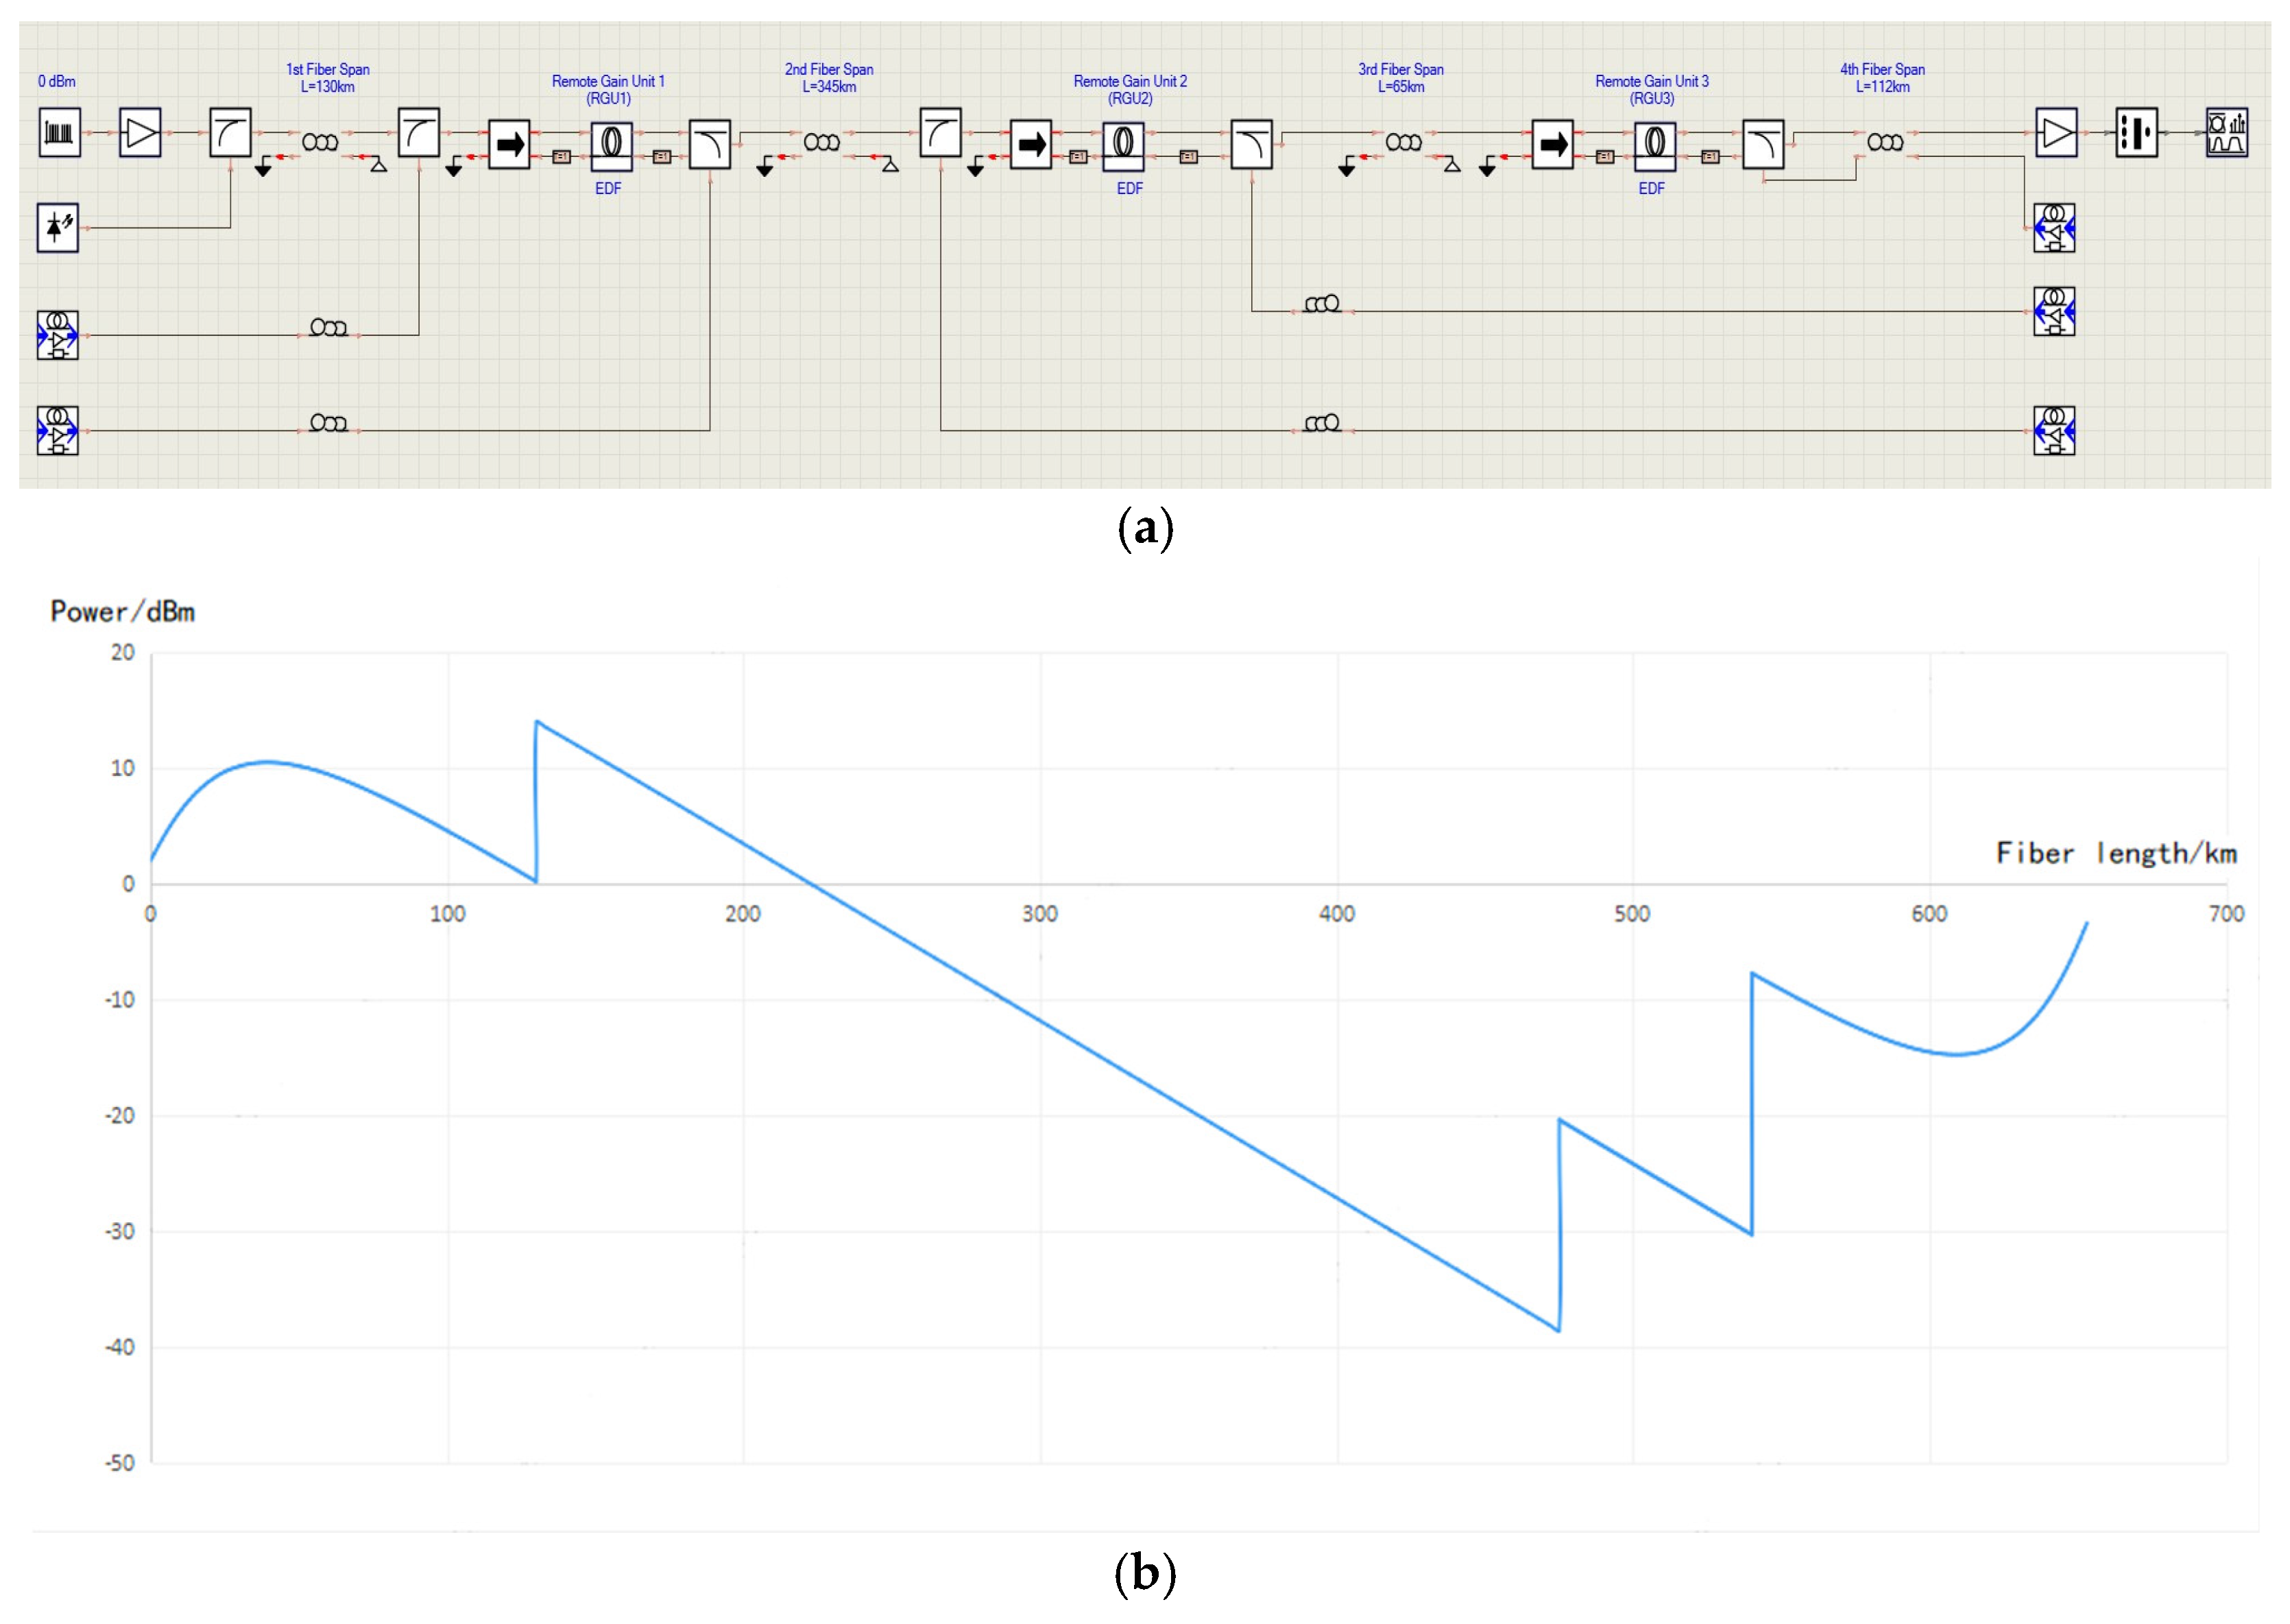
Preliminary simulations were conducted for the V-shaped routing scheme shown in Figure 17a using a wavelength of 1562.0 nm and an optical link comprising a forward Raman amplifier + fiber (130 km) + RGU (same fiber with forward remote pump and different fiber with backward remote pump) + fiber (345 km) + RGU (same fiber with forward remote pump and different fiber with backward remote pump) + fiber (65 km) + RGU (different fiber with backward remote pump) + fiber (112 km) + backward Raman amplifier. This system is depicted in Figure 18a, and the simulation results are presented in Figure 18b.
According to the simulation results, the OSNR at the receiver is ≥14 dB, which meets the transmission requirements of the system.
Despite exhibiting superior performance with G.654E fibers, the proposed architecture has limited applicability for G.652D fibers (which are used in most COOs) due to their smaller effective area (80 vs. 130 μm2). This fundamental physical constraint leads to exacerbated nonlinear effects at equivalent power levels, as described by the generalized nonlinear Schrödinger equation. Moreover, the loss coefficient is 0.18 dB/km (@1550 nm), which is approximately 20% higher than that of a G.654E fiber, meaning that the gain achieved by the third-order Raman amplifier is also smaller.
If a G.652D fiber is used, the scheme can be realized if the length is shortened accordingly. According to the simulation results (refer to Figure 7b), the unrepeatered scheme can be applied to the Station A-to-Station C and Station B-to-Station C links, and a G.652D fiber can be used. The section from Station A to Station B exceeds 400 km, according to the previous simulation and experimental results; however, the unrepeatered scheme can be applied on this link as well. Nevertheless, considering the convenience of system configuration and maintenance, it is recommended to use a G.654E optical fiber for this length or greater.

5.3. Comprehensive Comparison

Implementing this solution significantly increases the number of optical fibers that can be configured in the system. This allows for more observation services (e.g., using idle fibers for large-scale distributed acoustic sensing applications), and the signal will not be affected by repeaters. In terms of power supply, this scheme involves stringing together all the primary nodes on the backbone, such that the backbone becomes a chain structure. This setup facilitates a double-ended power supply to cover all the primary nodes with higher reliability, and it is not limited by the power supply mode of the repeaters or the working current. Schematic diagrams of the two potential power supply modes are presented in Figure 19.
The repeatered and unrepeatered schemes are compared in Table 3.

6. Conclusions

This study demonstrates applications of ultra-long span unrepeatered optical communication technology in COOs. The main contributions of this work are threefold: First, a novel hybrid algorithm (GA-PSO-SA) is developed, combining mechanisms from genetic algorithms, particle swarm optimization, and simulated annealing to optimize multi-parameter coupling involving pump wavelength, EDF length, and ROPA placement. Second, systematic simulations and iterative refinement establish the optimal configurations for 400 km transmission using G.652D fibers. The results are extended to achieve a record 691.8 km unrepeatered transmission over G.654E fibers, which is experimentally validated under 100 Gb/s conditions. Third, practical unrepeatered routing schemes are designed exhibiting enhanced reliability, increased fiber capacity, flexible power supply options, and reduced cost compared to traditional repeatered systems. In summary, this work provides an efficient optimization methodology, experimentally validated system parameters, and a practical framework for implementing high-performance unrepeatered systems in large-scale cabled ocean observatories.
With the continuous development of ultra-long span unrepeatered communication technology, communication capabilities will undoubtedly be further improved. However, practical engineering applications are often influenced by many factors, and the actual communication distance is often discounted in the experimental data. Moreover, if the routing distance is too long, there are additional considerations in terms of maintenance, especially when approaching the communication capability limits. Once a fiber failure occurs, the attenuation due to the required maintenance is likely to lead to the entire system failure.
Future research efforts will introduce hollow optical fibers, thereby opening new avenues for increasing the potential distance of unrepeatered communication. The theoretical minimum loss of a hollow fiber can be as low as 0.05 dB/km (the lowest loss measured to date is 0.13 dB/km), and the theoretical limit of a glass-core fiber is approximately 0.14 dB/km. In terms of nonlinear effects, a hollow optical fiber is 3–4 orders of magnitude lower than an ordinary glass-core fiber, leading to higher optical power. All of these characteristics can contribute to increasing transmission distances, thereby broadening the potential application scope of unrepeatered optical communication technology in COOs. The power conversion efficiency and comparison of electrically fed repeaters and optically pumped remote amplifiers are additional key dimensions in the design of cabled ocean observatories. These factors directly influence the overall power budget and system sustainability, thus representing a valuable direction for future research aimed at holistic optimization of long-distance underwater communication systems.

Author Contributions

C.S.: Formal analysis, Investigation, Methodology, Writing—original draft, Writing—review and editing; F.L.: Conceptualization, Investigation, Writing—review and editing, Funding acquisition; R.X.: Conceptualization, Investigation; J.L.: Validation; X.W.: Data curation; L.X.: Methodology. All authors have read and agreed to the published version of the manuscript.

Funding

This work was supported by the National Key Research and Development Program of China (2023YFB2905300), the Shanghai Science and Technology Innovation Action Plan Breakthrough Project (23DZ1203900), the Yangtze River Delta Science and Technology Innovation Community Joint Key Project (2024CSJGG2600), and the Major National Science and Technology Infrastructure of China National Scientific Seafloor Observatories (CNSSO).

Institutional Review Board Statement

Not applicable.

Informed Consent Statement

Not applicable.

Data Availability Statement

Data are contained within the article.

Conflicts of Interest

Author Jianping Li was employed by HMN Technologies Co., Ltd. The remaining authors declare that the research was conducted in the absence of any commercial or financial relationships that could be construed as a potential conflict of interest.

Appendix A

(1)
First Iteration
For the initial setup:
The ROPA position is set within the range of 100 to 300 km from the transmitter, with a step size of 20 km.
The EDF length ranges between 6 and 12 m, with a step size of 2 m.
The first-order and second-order pump frequencies are confined to 195–225 THz and 210–240 THz, respectively, with a step size of 10 THz.
The signal light is 1563 nm in the C-band.
The first-order and second-order pump powers are 100 mW and 1 W, respectively.
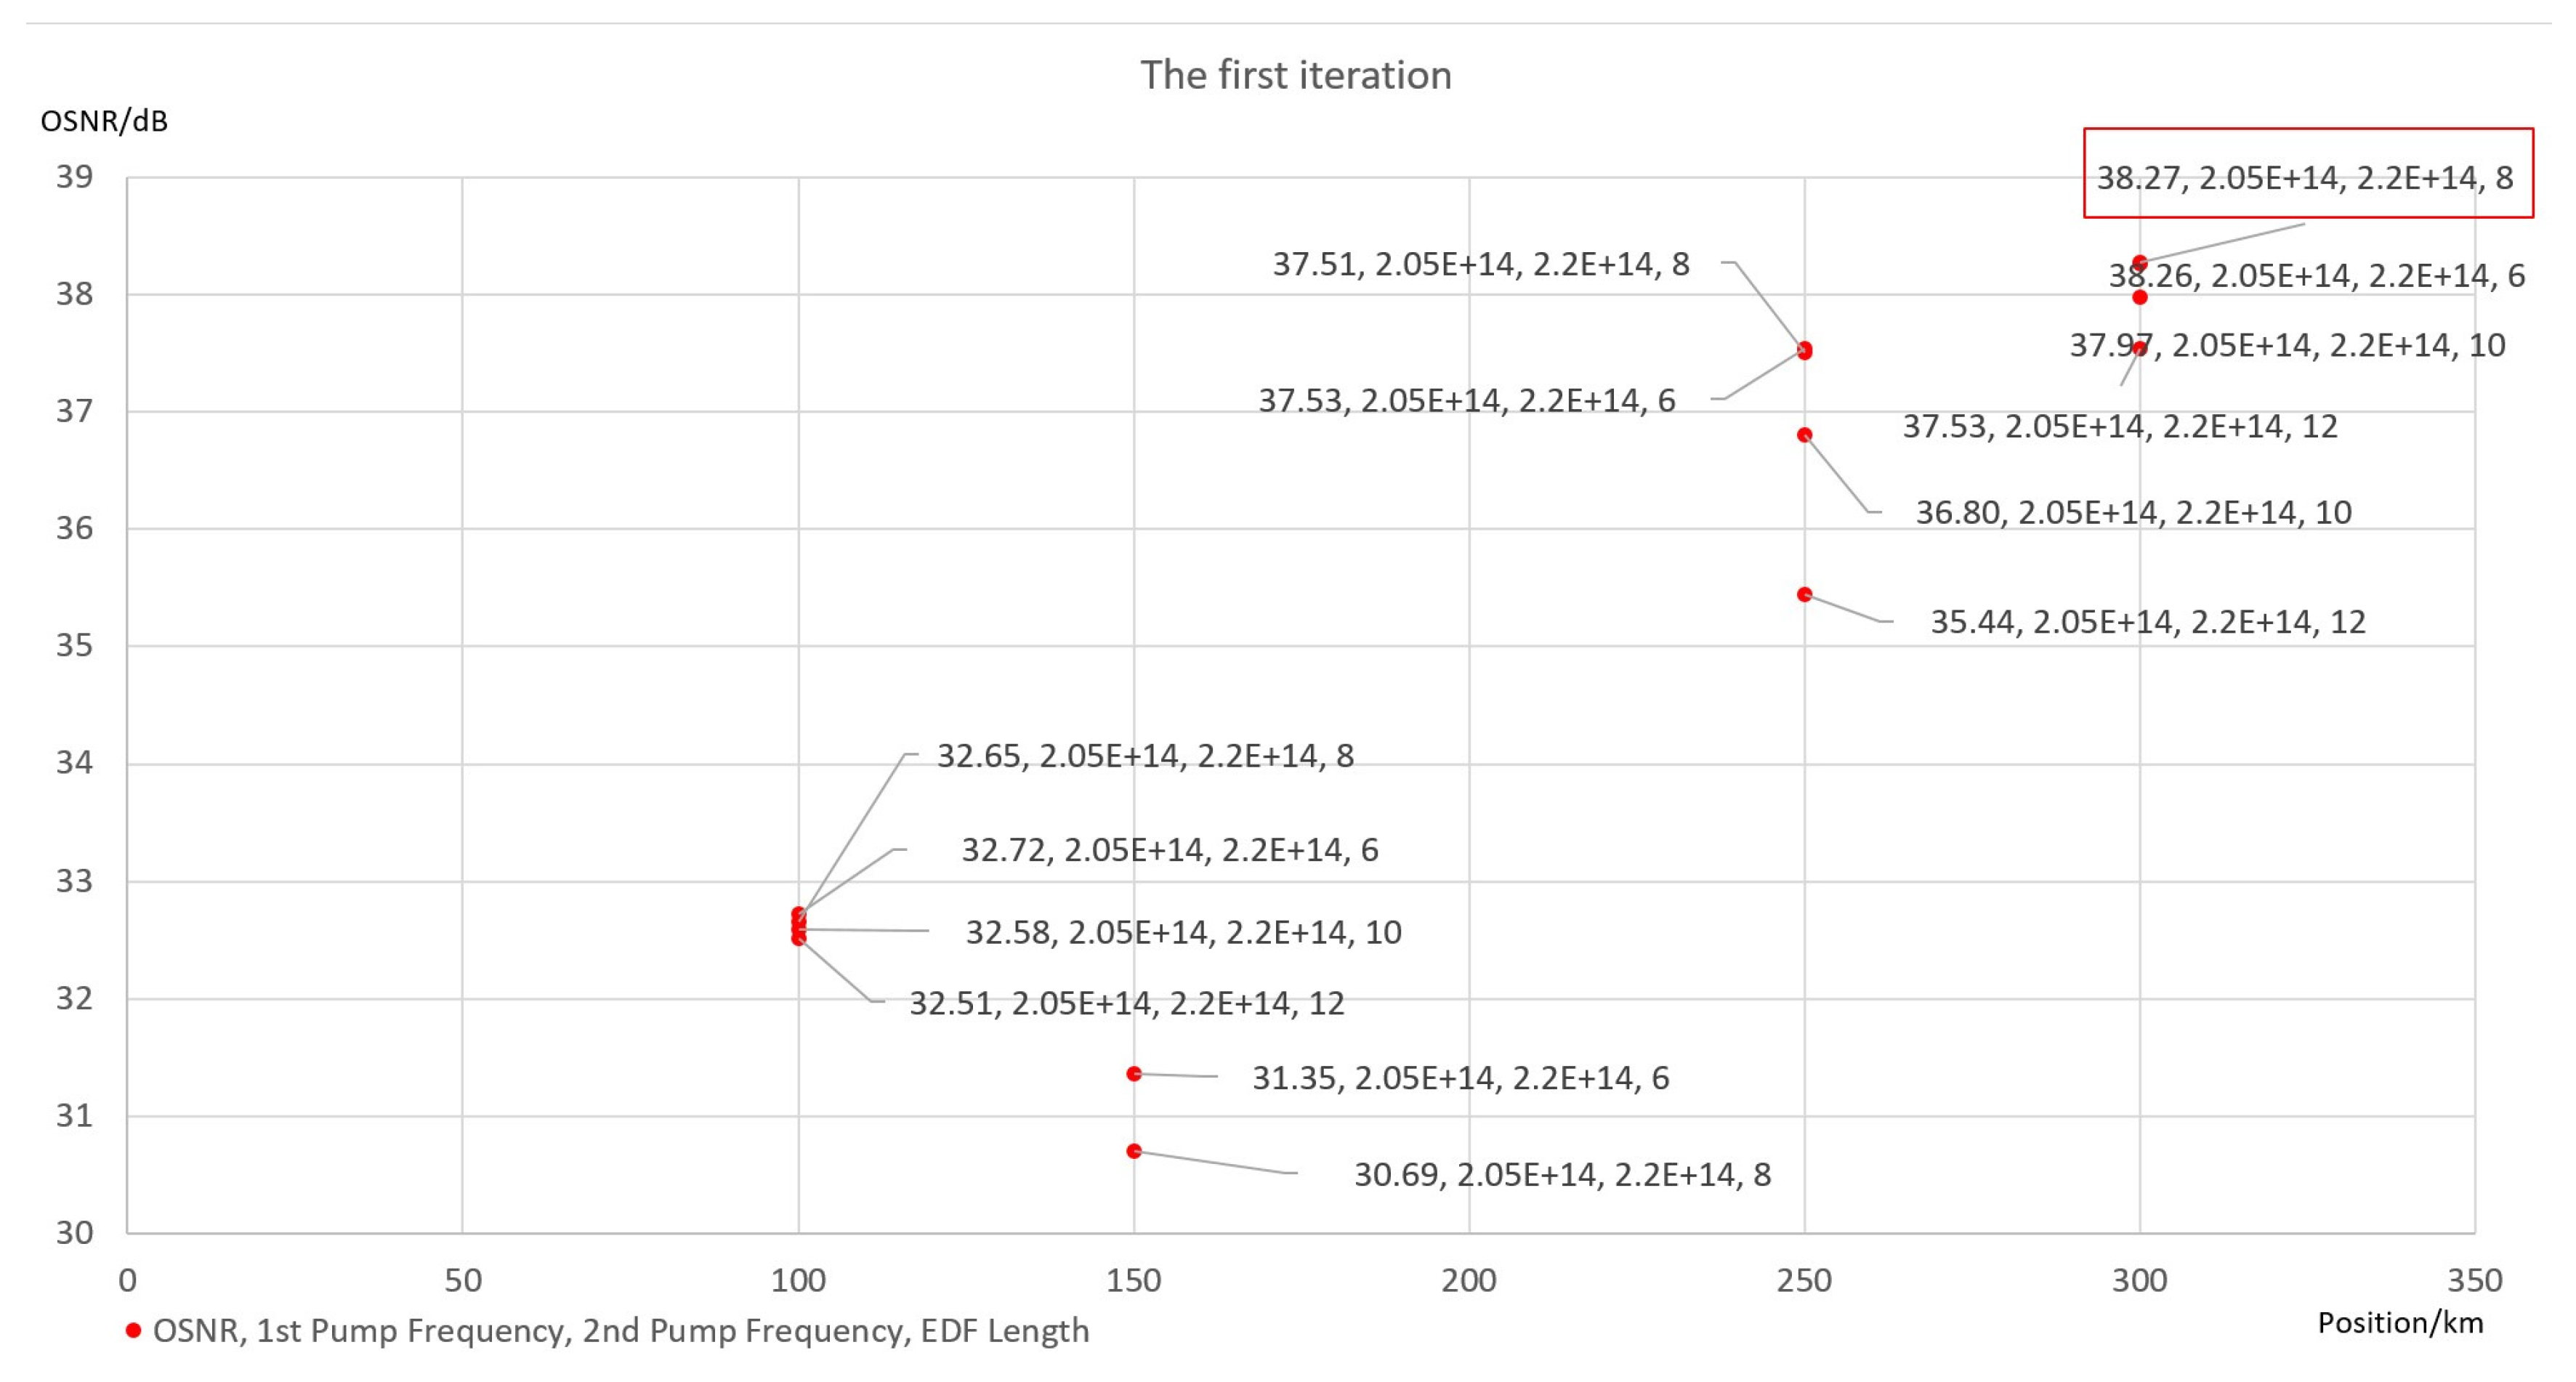
These computations lead to 80 sets of results, as shown in Figure A1 (only OSNR values greater than 30 dB are shown). The red box highlights the maximum OSNR obtained in this iteration, along with its corresponding first-order and second-order pump frequencies and EDF length. These preliminary results indicate that the optimal ROPA position is between 250 and 300 km from the transmitter, and the first-order and second-order pump frequencies are approximately 205 and 220 THz, respectively. However, the distribution of the optimal EDF length cannot be clearly determined at this stage.
Figure A1. OSNR vs. pump frequencies and EDF length for various ROPA positions (100–300 km); max OSNR = 38.27 dB.
Photonics 12 00930 g0a1
(2)
Second Iteration
Because the target problem involves three variables, simultaneously employing smaller magnitudes for all variables would require a prohibitively large computational load. However, considering that variable combinations near the previously identified intervals satisfy the solutions of the Raman scattering equations and meet the 400 km transmission requirements, an iterative approach can be adopted, whereby the magnitude of each variable’s range is gradually reduced to pinpoint their optimal values.
The next set of computations builds on the previous results as follows:
The ROPA position is narrowed to within 250 and 300 km from the transmitter, with a step size reduced to 10 km.
The EDF length remains in the range of 6–12 m, but its step size is adjusted to 1.5 m.
The first-order and second-order pump frequencies are confined to 195–215 THz and 210–230 THz, respectively, with a step size of 5 THz.
The signal light wavelength and pump powers remain the same as in the first iteration.
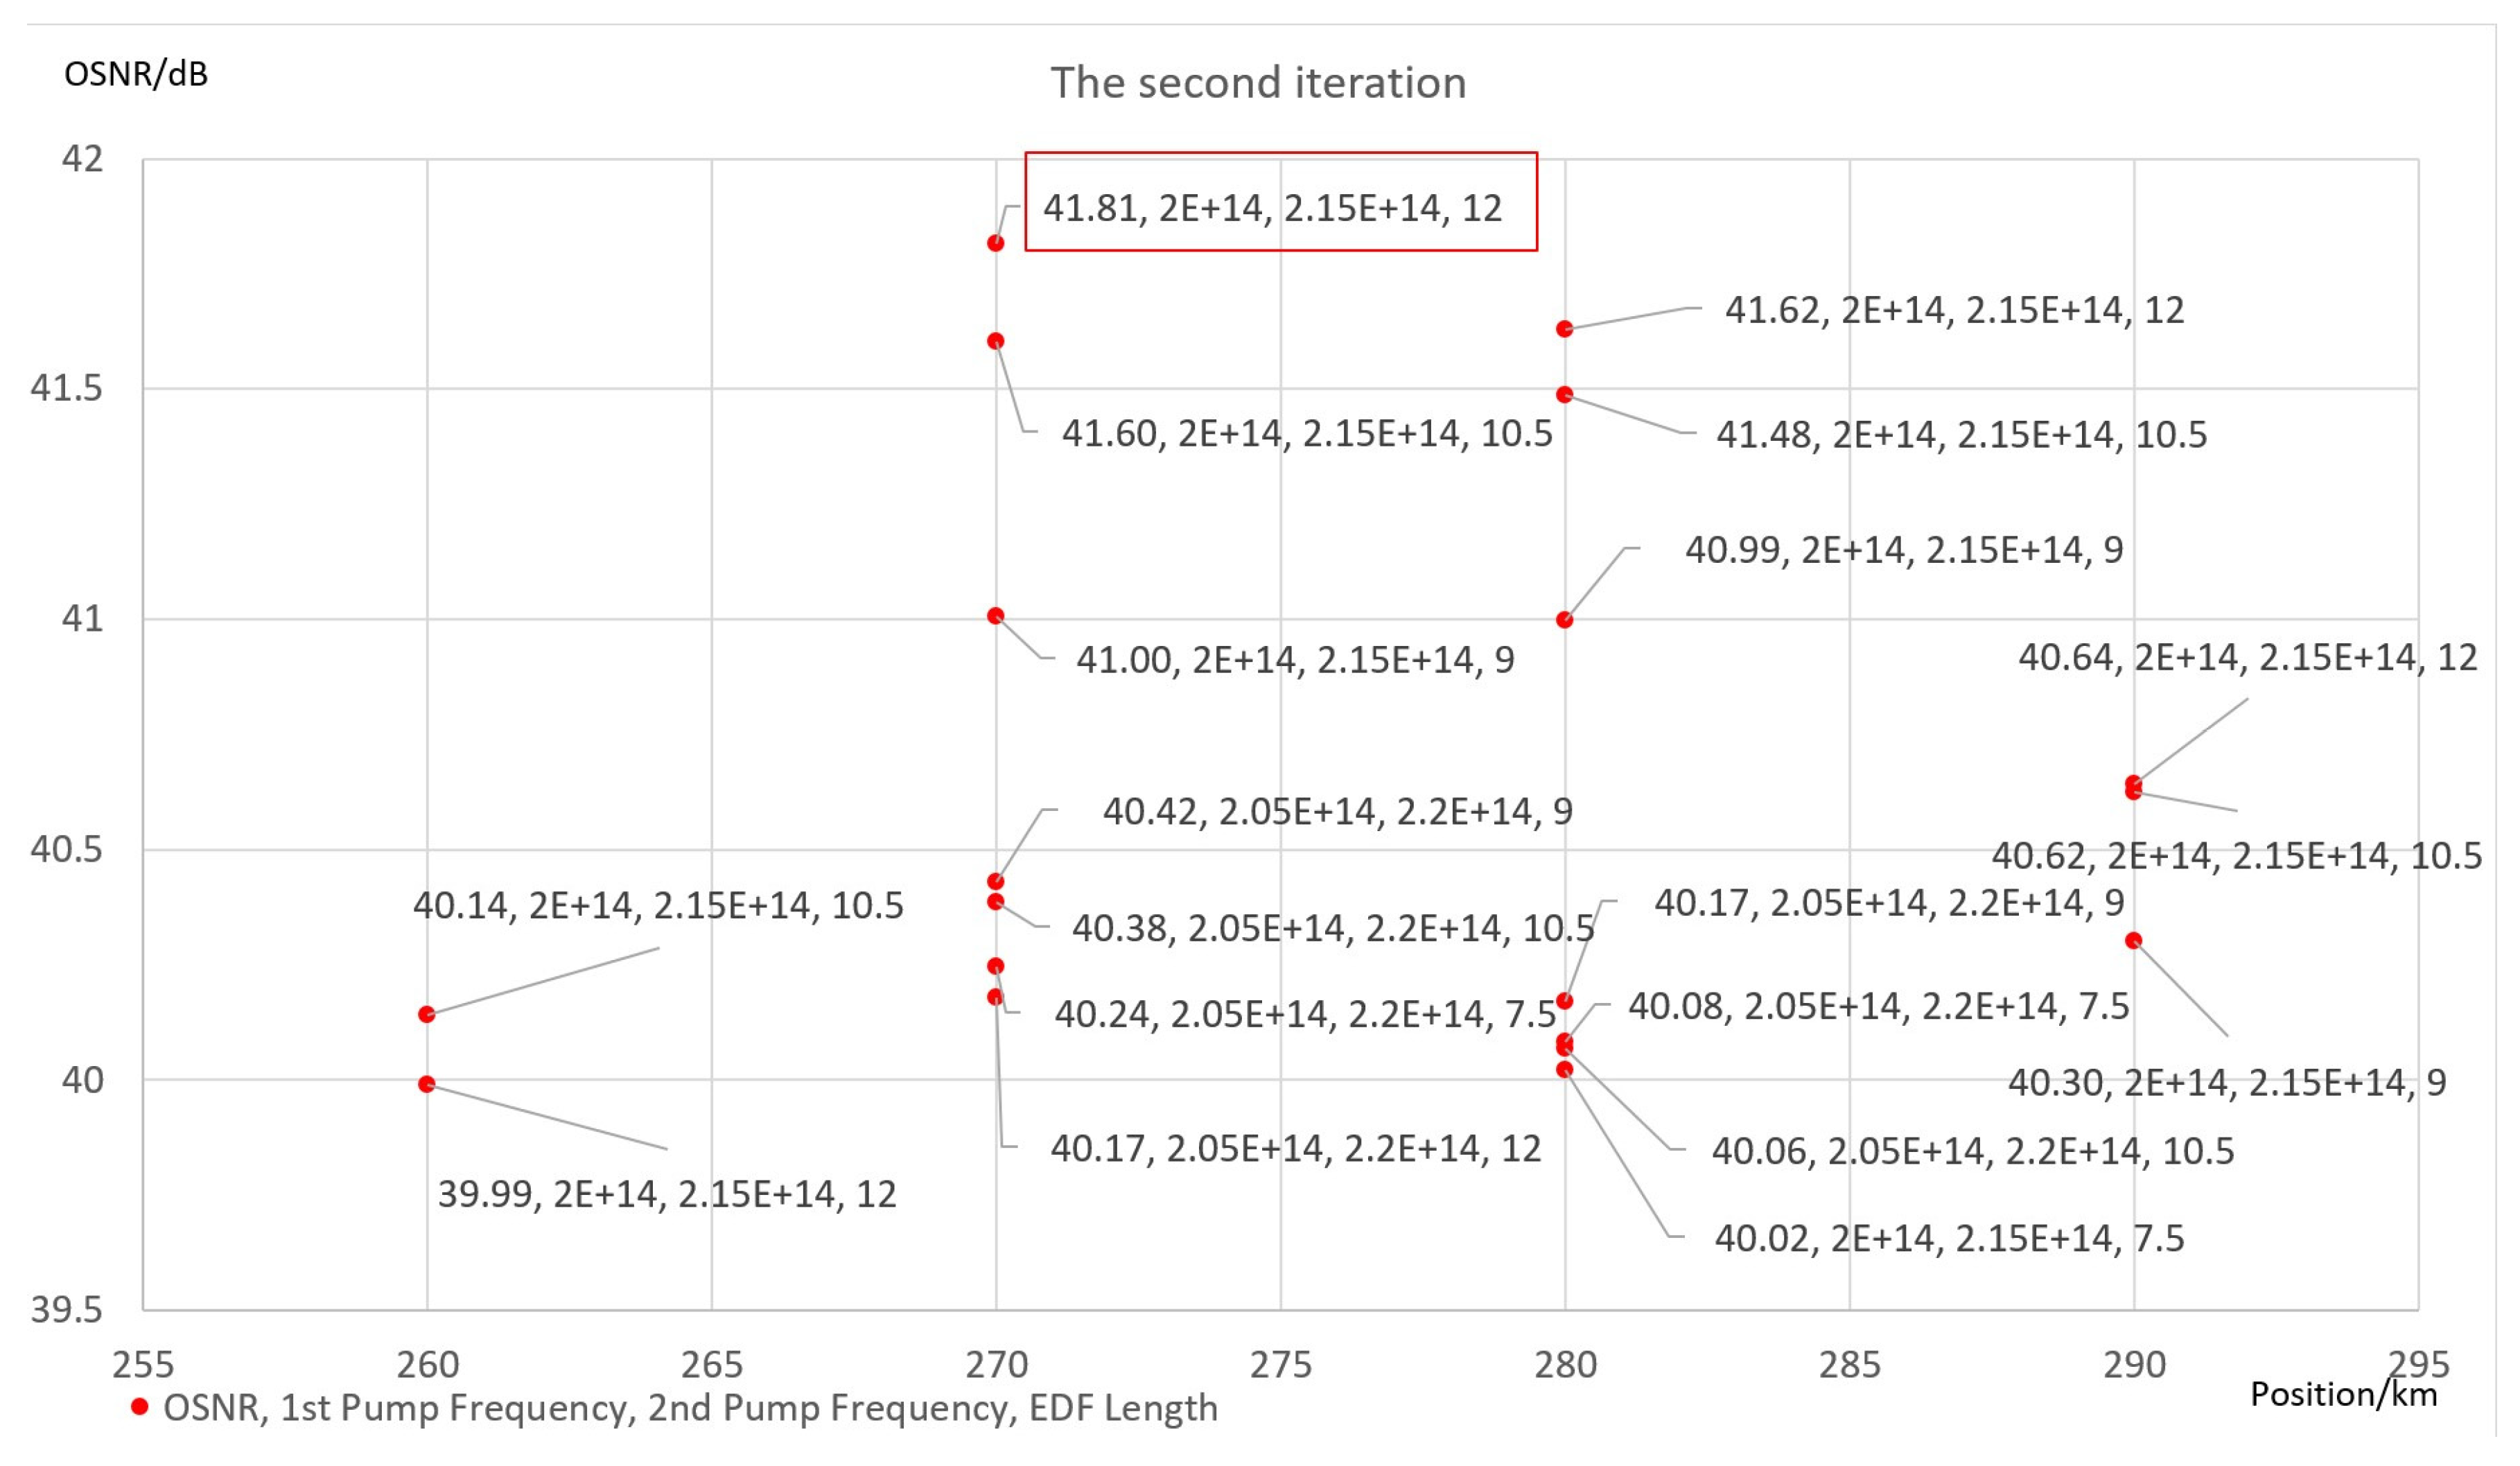
Following this refined computation, 150 sets of results are obtained, as shown in Figure A2 (only OSNR values greater than 40 dB are shown). The red box highlights the maximum OSNR obtained in this iteration, along with its corresponding first-order and second-order pump frequencies and EDF length.
Based on these findings:
The optimal ROPA position is narrowed to within 270–280 km from the transmitter.
The first-order and second-order pump frequencies are approximately 200 and 215 THz, respectively.
The optimal EDF length is within the range of 9–12 m.
(3)
Third Iteration
A similar approach is employed to refine the ranges and reduce the step sizes to further improve the OSNR results:
The ROPA position is narrowed to within 270–280 km from the transmitter, with a step size of 2 km.
The EDF length is confined to within 9–12 m, with its step size adjusted to 1 m.
Figure A2. OSNR after narrowing the ROPA range to 250–300 km; max OSNR = 41.81 dB.
Photonics 12 00930 g0a2
The first-order and second-order pump frequencies are confined to 196–204 THz and 211–219 THz, respectively, with a step size of 2 THz.
This refined computation yields 120 sets of results, as shown in Figure A3 (only OSNR values greater than 42 dB are shown). The red box highlights the maximum OSNR obtained in this iteration, along with its corresponding first-order and second-order pump frequencies and EDF length.
Based on these findings:
The optimal ROPA position is approximately 272 km from the transmitter.
The optimal EDF length is approximately 10 m.
Figure A3. OSNR with ROPA at 270–280 km; optimal point ≈ 272 km, optimal EDF length ≈ 10 m; max OSNR = 42.31 dB.
Photonics 12 00930 g0a3
(4)
Fourth Iteration
To obtain OSNR values closer to the optimal value, the ranges are refined, and the step sizes are reduced based on the third iteration:
The ROPA position is confined to 272–274 km from the transmitter, with a step size of 0.4 km.
The EDF length is set within 9–11 m, with its step size adjusted to 0.2 m.
The first- and second-order pump frequencies are confined to 201–203 THz and 216–218 THz, respectively, with a step size of 0.5 THz.
This iteration yields 275 sets of results, as shown in Figure A4 (only OSNR values greater than 42.3 dB are shown). The red box highlights the maximum OSNR obtained in this iteration, along with its corresponding first-order and second-order pump frequencies and EDF length.
Based on these findings:
The optimal ROPA position is approximately 272 km from the transmitter.
The optimal EDF length is approximately 10.8 m.
Figure A4. Fine-tuning of EDF length and ROPA position. Optimal EDF length = 10.8 m; optimal ROPA position = 272 km; max OSNR = 42.32 dB.
Photonics 12 00930 g0a4
(5)
Pump Frequency Matching
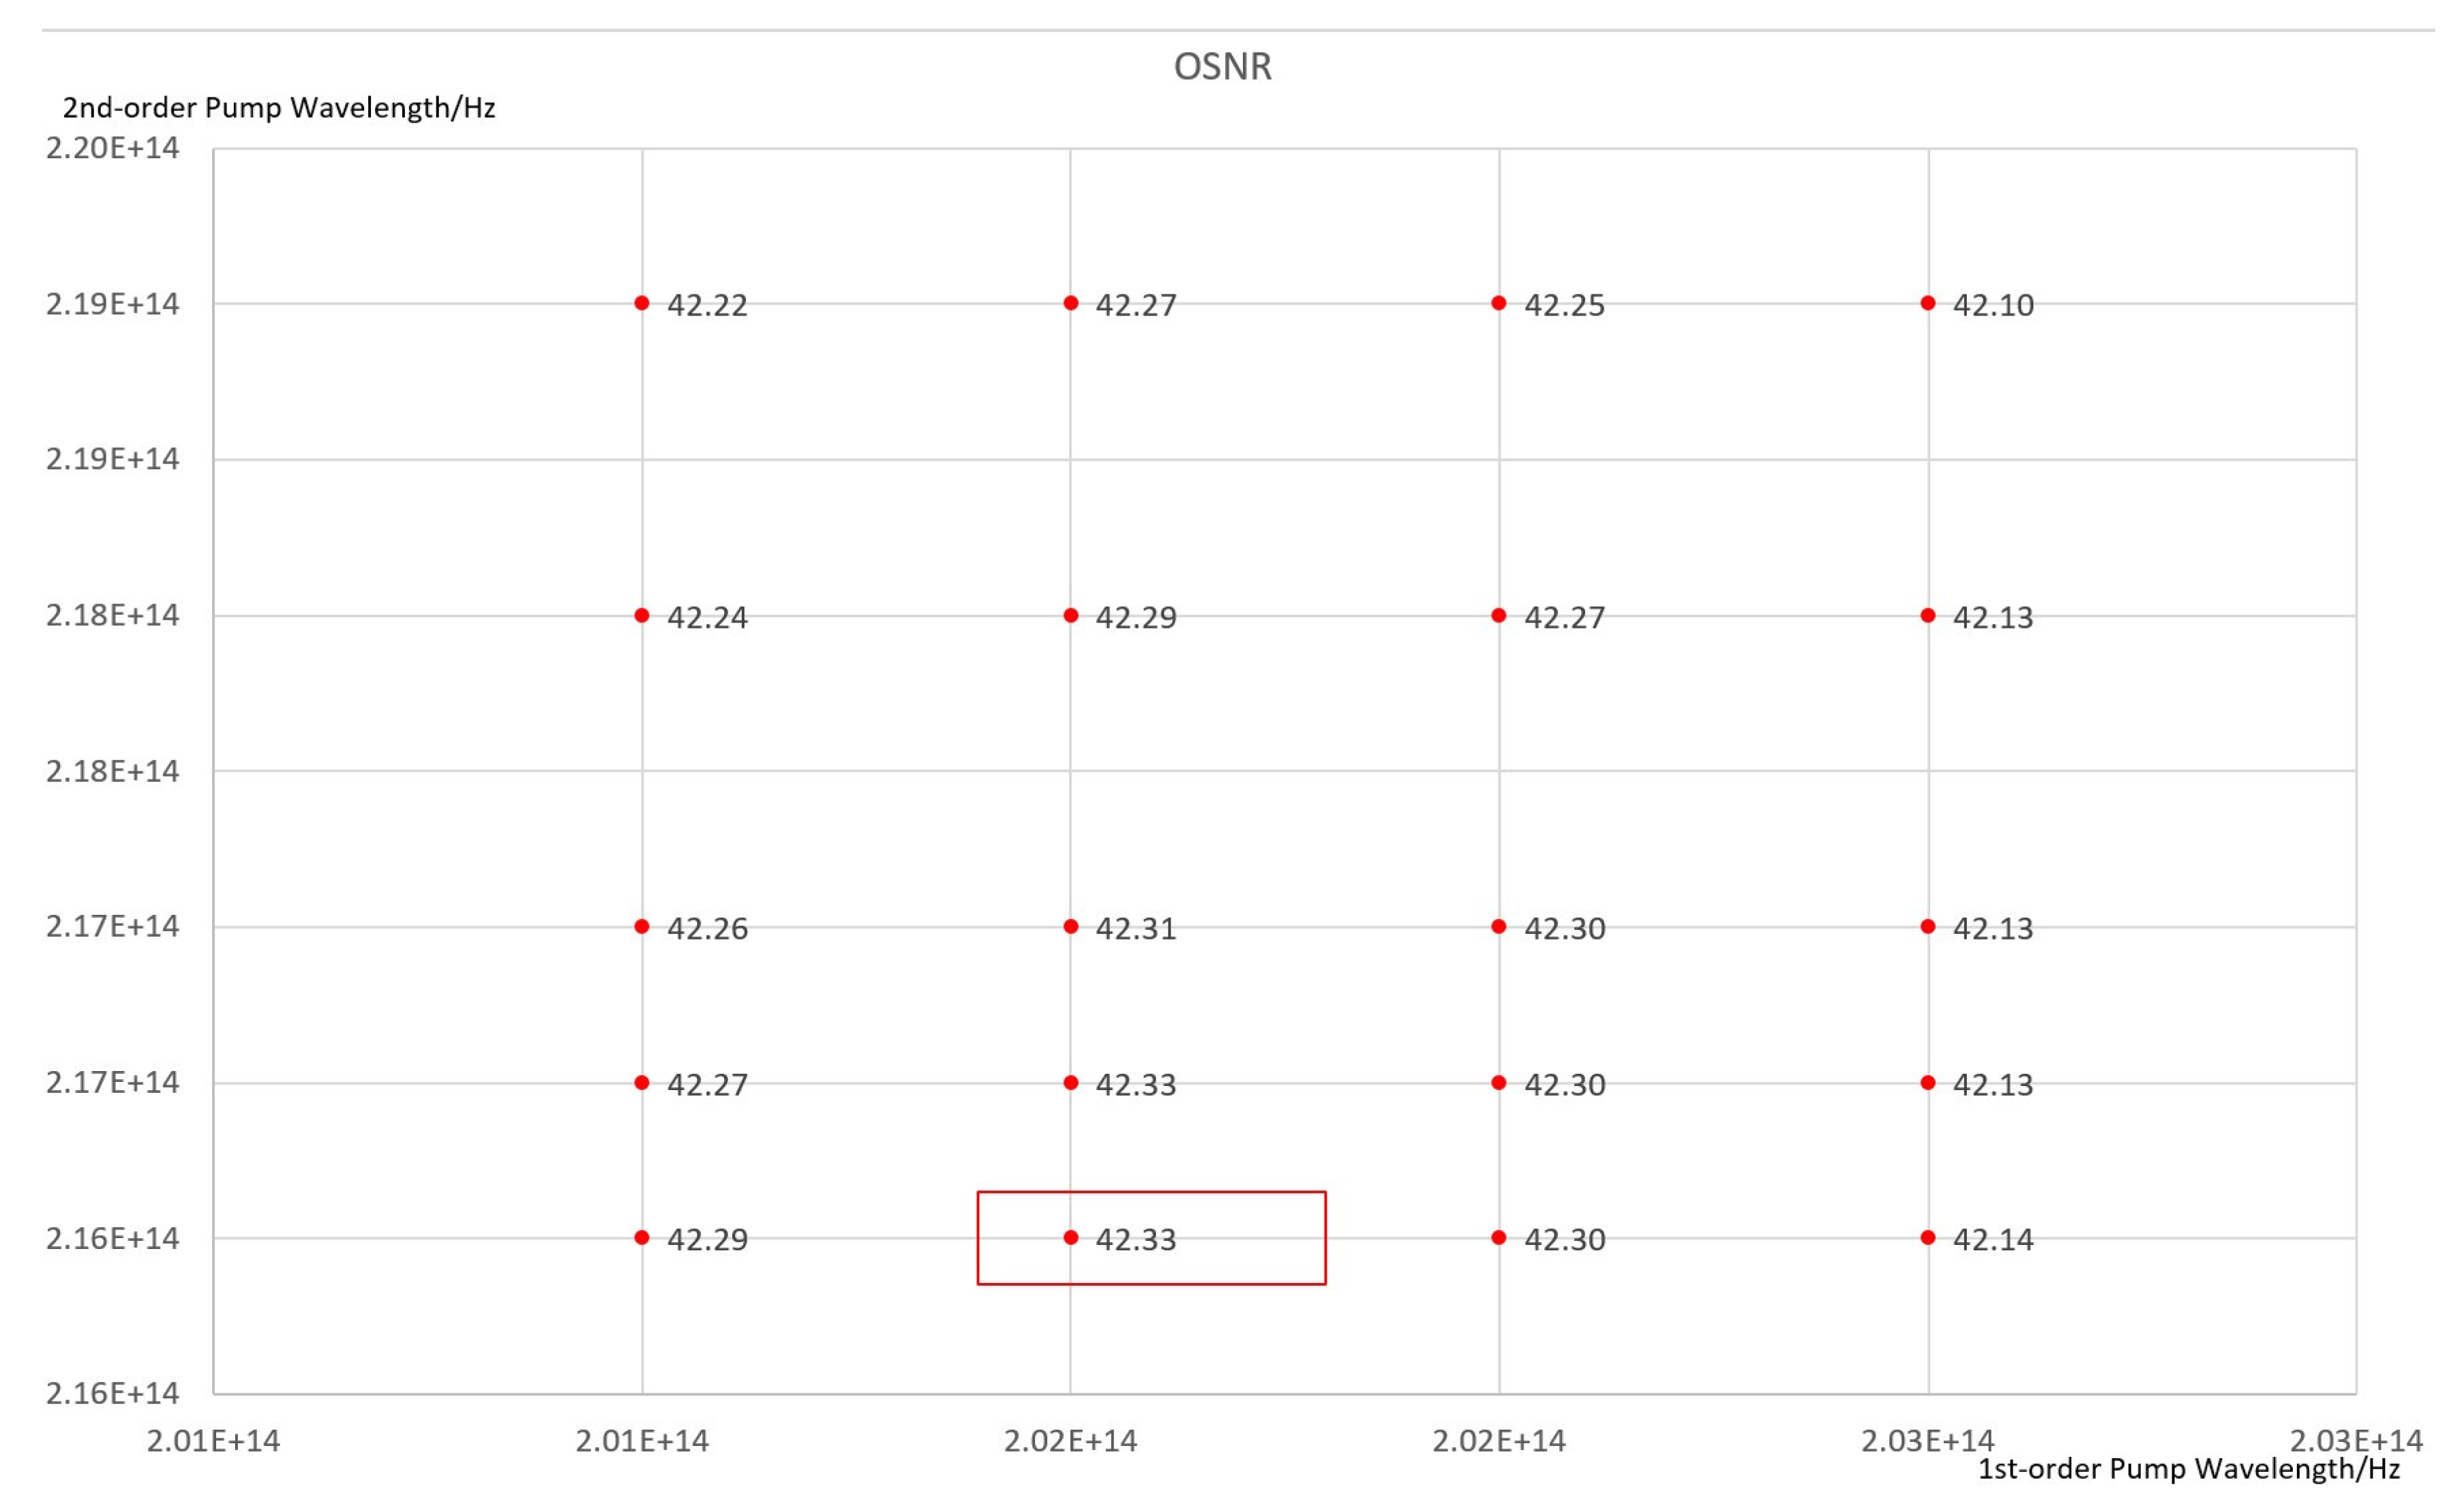
After four iterations, the optimal values for the ROPA position and EDF length have been determined with high precision. These results can be used to further refine the first-order and second-order pump frequency ranges to 201–203 THz and 216–218 THz, respectively, with a step size of 0.5 THz.
This iteration produces 25 sets of results, as shown in Figure A5 (only OSNR values greater than 42 dB are shown). The red box highlights the maximum OSNR obtained in this calculation, corresponding to a ROPA position of 272 km and an EDF length of 10.8 m. The following are the optimal conditions:
First-order pump frequency = 201.5 THz ≈ 1487.8 nm.
Second-order pump frequency = 216.5 THz ≈ 1387.9 nm.
(6)
Pump Power Matching
To further enhance the performance, additional iterations could be performed with smaller step sizes. However, because the associated improvements in system performance are minimal and the current values already fully satisfy the 400 km transmission requirements, this study uses the values obtained above as the optimal parameters for further investigations.
Figure A5. Optimal first- and second-order pump frequencies: 201.5 and 216.5 THz, respectively; max OSNR = 42.33 dB.
Photonics 12 00930 g0a5
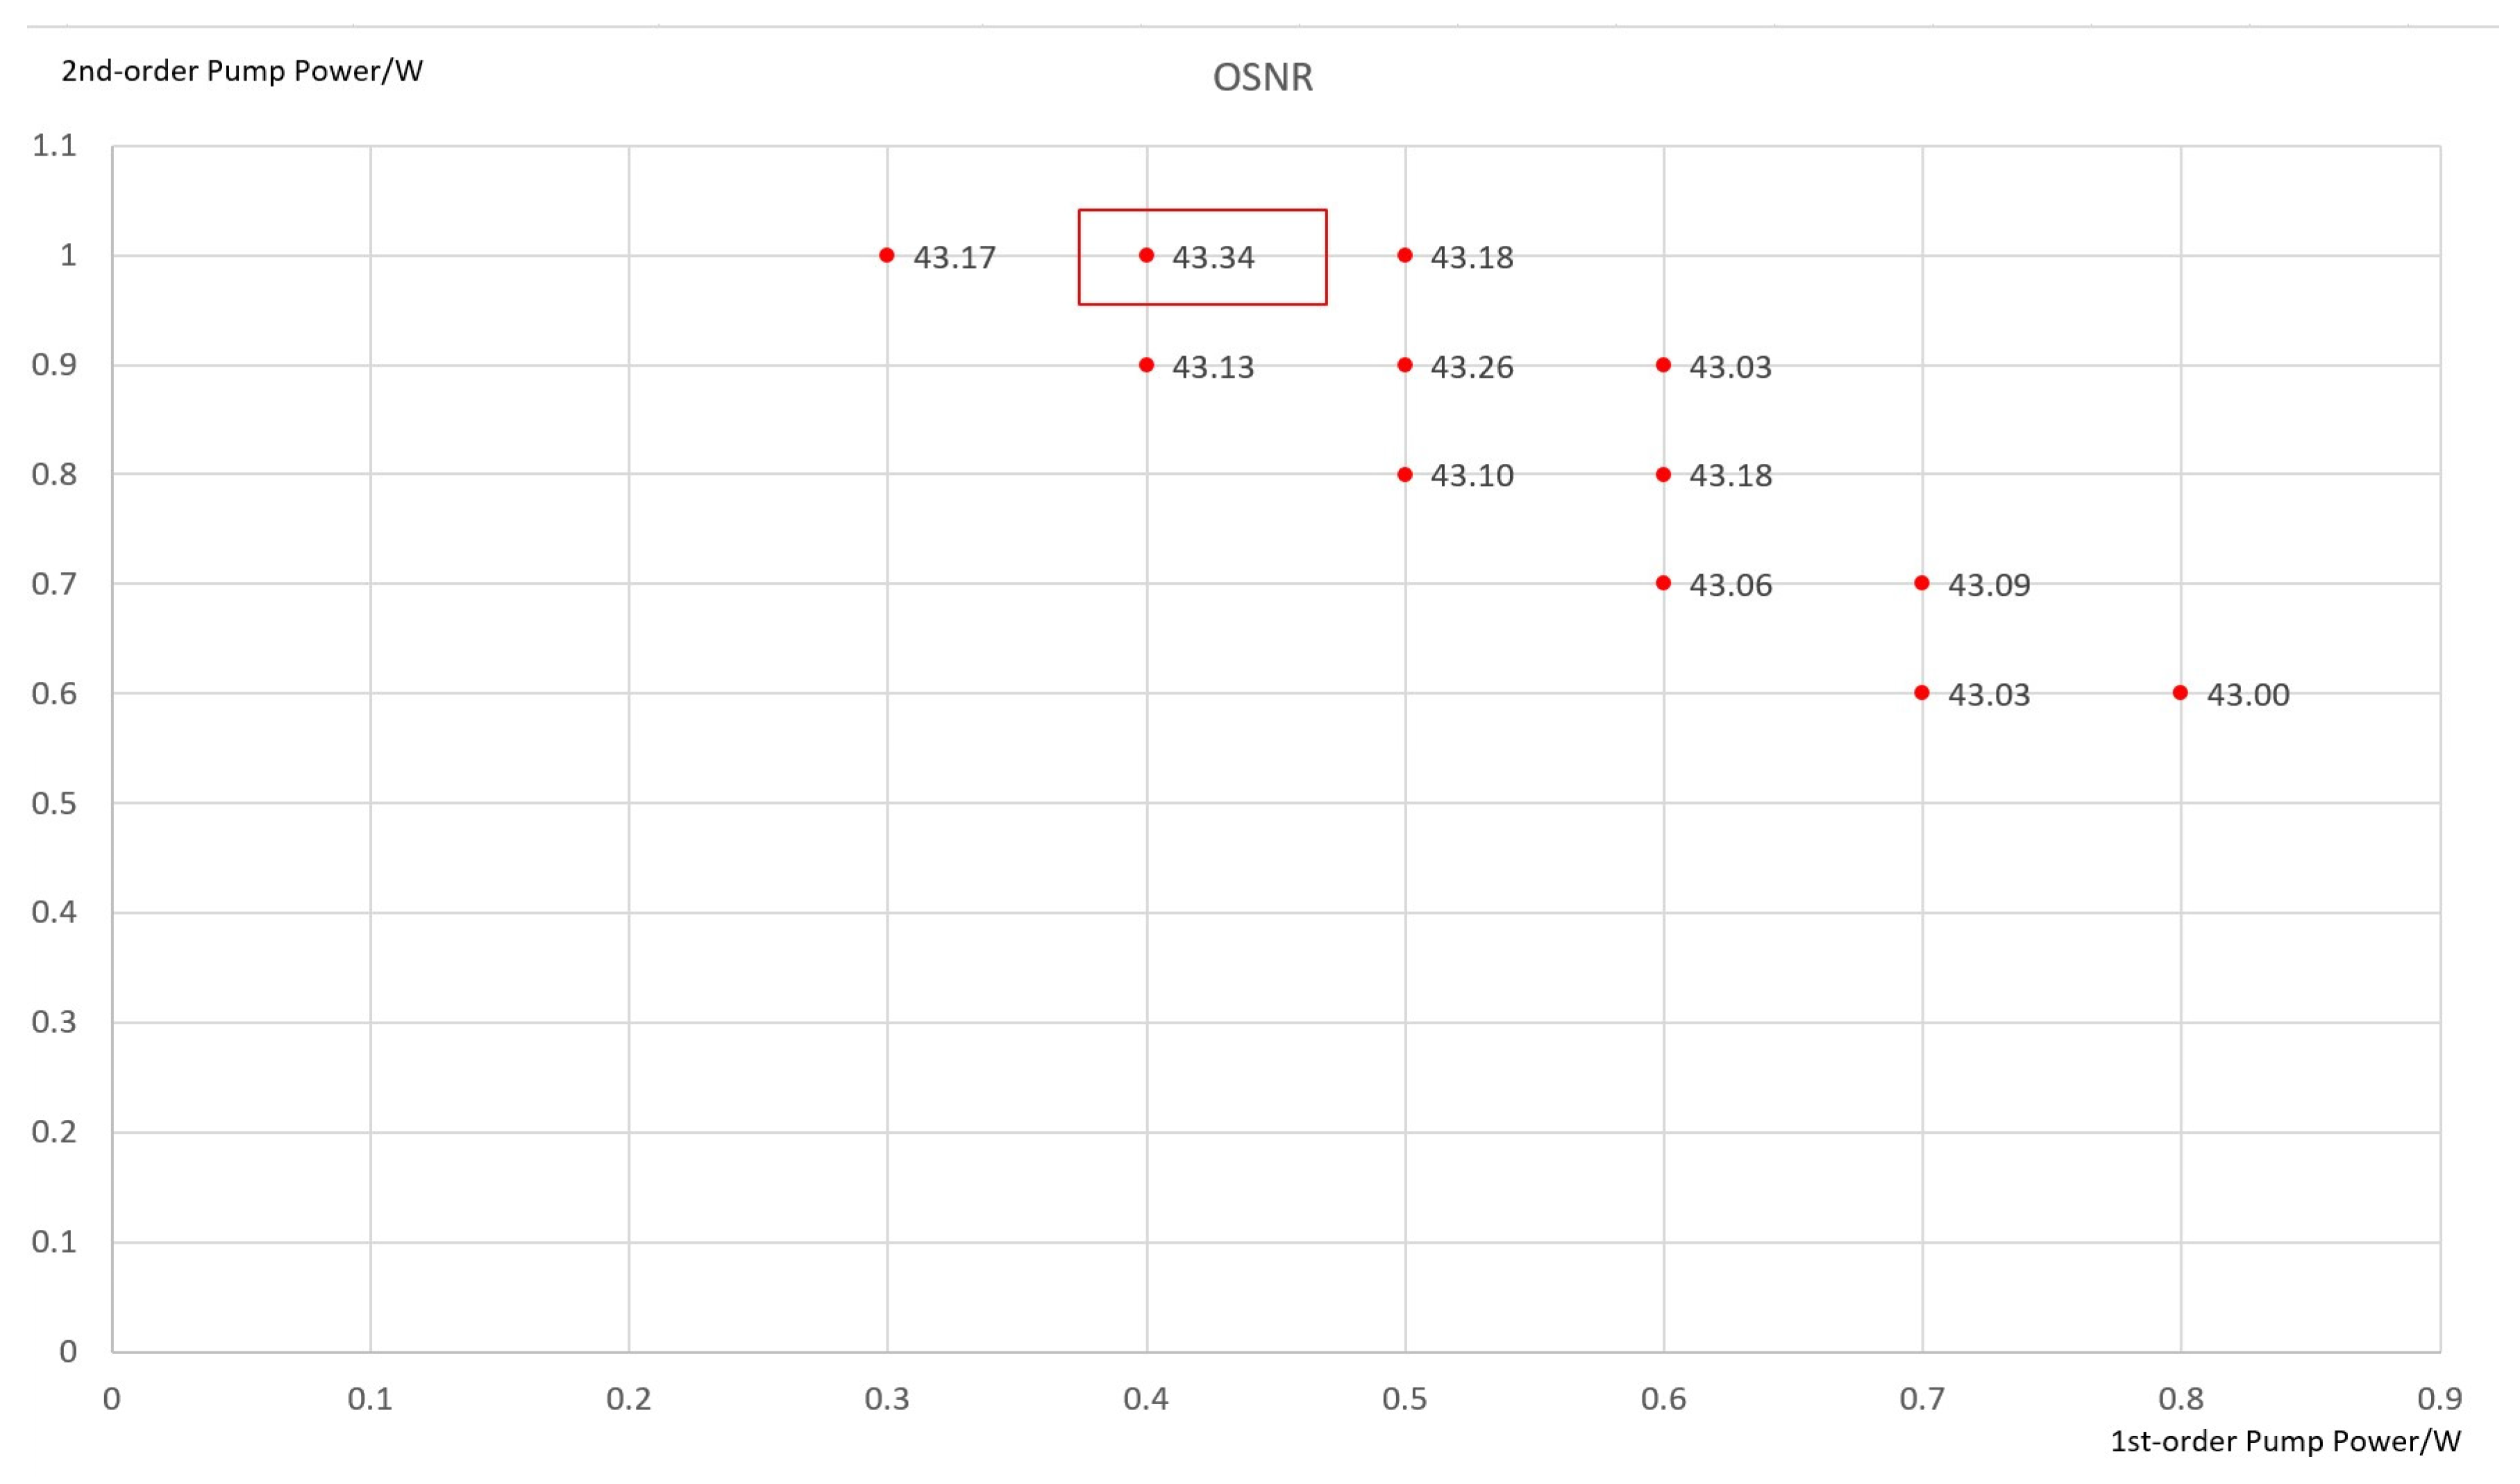
The three key parameters can be used to refine the computations by setting the first- and second-order pump power ranges to 0.1 W and 1 W, respectively, with a step size of 0.1 W. This iteration produces 100 sets of results, as shown in Figure A6 (only OSNR values greater than 43 dB are shown). The red box highlights the maximum OSNR obtained in this calculation.
Figure A6. Optimal pump powers: 0.4 W (first-order) and 1 W (second-order); max OSNR = 43.34 dB.
Photonics 12 00930 g0a6
Based on these findings, the optimal pump power configuration is as follows:
First-order pump power = 0.4 W.
Second-order pump power = 1 W.

References

  1. Barnes, C.R.; Best, M.M.R.; Johnson, F.R.; Pautet, L.; Pirenne, B. Challenges, benefits, and opportunities in installing and operating cabled ocean observatories: Perspectives from NEPTUNE Canada. IEEE J. Ocean. Eng. 2013, 38, 144–157. [Google Scholar] [CrossRef]
  2. Barnes, C.R.; Tunnicliffe, V. Building the World’s First Multi-node Cabled Ocean Observatories (NEPTUNE Canada and VENUS, Canada): Science, Realities, Challenges and Opportunities. In Proceedings of the OCEANS 2008—MTS/IEEE Kobe Techno-Ocean, Kobe, Japan, 8–11 April 2008; pp. 1–8. [Google Scholar] [CrossRef]
  3. Takagi, R.; Uchida, N.; Nakayama, T.; Azuma, R.; Ishigami, A.; Okada, T.; Nakamura, T.; Shiomi, K. Estimation of the Orientations of the S-net Cabled Ocean-Bottom Sensors. Seismol. Res. Lett. 2019, 90, 2175–2187. [Google Scholar] [CrossRef]
  4. Uchida, N.; Nakajima, J.; Wang, K.L.; Takagi, R.; Yoshida, K.; Nakayama, T.; Hino, R.; Okada, T.; Asano, Y. Stagnant forearc mantle wedge inferred from mapping of shear-wave anisotropy using S-net seafloor seismometers. Nat. Commun. 2020, 11, 5676. [Google Scholar] [CrossRef] [PubMed]
  5. Mochizuki, M.; Uehira, K.; Kanazawa, T.; Kunugi, T.; Shiomi, K.; Aoi, S.; Matsumoto, T.; Takahashi, N.; Chikasada, N.; Nakamura, T.; et al. S-Net project: Performance of a Large-Scale Seafloor Observation Network for Preventing and Reducing Seismic and Tsunami Disasters. In Proceedings of the 2018 OCEANS—MTS/IEEE Kobe Techno-Oceans (OTO), Kobe, Japan, 28–31 May 2018; pp. 1–4. [Google Scholar] [CrossRef]
  6. Aoi, S.; Youichi, A.; Takashi, K.; Takeshi, K.; Kenji, U.; Narumi, T.; Hideki, U.; Katsuhiko, S.; Takumi, M.; Hiroyuki, F. MOWLAS: NIED observation network for earthquake, tsunami and volcano. Earth Planets Space 2020, 72, 126. [Google Scholar] [CrossRef]
  7. Gainov, V.; Gurkin, N.; Lukinih, S.; Makovejs, S.; Akopov, S.; Ten, S.; Nanii, O.; Treshchikov, V.; Sleptsov, M. Record 500 km Unrepeatered 1 Tbit/s (10 × 100G) Transmission Over an Ultra-Low Loss Fiber. Opt. Express 2014, 22, 22308–22313. [Google Scholar] [CrossRef] [PubMed]
  8. Zhu, B.; Borel, P.I.; Geisler, T.; Jensen, R.; Leng, L.; Jiang, X.; Peckham, D.W.; Lingle, R.L.; Vaidya, D.; Yan, M.F.; et al. 800Gb/s (8 × 128Gb/s) Unrepeatered Transmission Over 515-km Large-Area Ultra-Low-Loss Fibre Using 2nd-Order Raman Pumping. Opt. Express 2016, 24, 25291–25297. [Google Scholar] [CrossRef]
  9. Etienne, S.; Bissessur, H.; Bastide, C.; Mongardien, D. Ultra-long 610 km unrepeatered transmission of 100 Gb/s using single fibre configuration. In Proceedings of the 2015 European Conference on Optical Communication (ECOC), Valencia, Spain, 27 September–1 October 2015. Paper Th225. [Google Scholar]
  10. Huang, Y.K.; Ip, E.; Zhang, S.; Yaman, F.; Downie, J.D.; Wood, W.A.; Zakharian, A.; Hurley, J.; Mishra, S.; Aono, Y.; et al. 20.7-Tb/s repeater-less transmission over 401.1-km using QSM fiber and XPM compensation via transmitter-side DBP. In Proceedings of the 2016 21st OptoElectronics and Communications Conference (OECC) Held Jointly with 2016 International Conference on Photonics in Switching (PS), Niigata, Japan, 3–7 July 2016. Paper PD14. [Google Scholar]
  11. Januario, J.C.; Rossi, S.M.; José, H.C.; Chiuchiarelli, A.; Souza, A.L.; Felipe, A.; Bordonalli, A.C.; Makovejs, S.; Mornatta, C.; Festa, A.; et al. Single-carrier 400G unrepeatered WDM transmission over 443.1 km. In Proceedings of the 2017 European Conference on Optical Communication (ECOC), Gothenburg, Sweden, 17–21 September 2017. Paper M1F. [Google Scholar]
  12. Xu, J.; Sun, S.; Hu, Q.; Yu, J.; Liu, J.; Luo, Q.; Wang, W.; Huang, L.; Xiang, M.; Wu, J.; et al. Unrepeatered Transmission Over 670.64 km of 50G BPSK, 653.35 km of 100G PS-QPSK, 601.93 km of 200G 8QAM, and 502.13 km of 400G 64QAM. J. Light. Technol. 2019, 38, 522–530. [Google Scholar] [CrossRef]
  13. Xu, J.; Yu, J.; Hu, Q.; Zhou, H.; Li, M.; Huang, L.; Zheng, F.; Li, W.; Deng, L.; Zhang, L.; et al. Longest-Ever Unrepeatered Transmission Over 713.2km of 2.5 Gb/s with a Span Loss in Excess of 111dB. In Proceedings of the 2018 Conference on Lasers and Electro-Optics Pacific Rim (CLEO-PR), Hong Kong, China, 29 July–3 August 2018. Paper Tu2I.5. [Google Scholar]
  14. Huang, Y.K.; Ip, E.; Aono, Y.; Tajima, T.; Zhang, S.; Yaman, F.; Inada, Y.; Downie, J.D.; Wood, W.; Zakharian, A.; et al. Real-time 8 × 200-Gb/s 16-QAM unrepeatered transmission over 458.8 km using concatenated receiver-side ROPAs. In Proceedings of the Optical Fiber Communication Conference 2017, Los Angeles, CA, USA, 19–23 March 2017. Paper Th2A59. [Google Scholar]
  15. Bissessur, H.; Bastide, C.; Etienne, S.; Dupont, S. 24 Tb/s Unrepeatered C-Band Transmission of Real-Time Processed 200 Gb/s PDM 16-QAM Over 349 km. In Proceedings of the 2017 Optical Fiber Communications Conference and Exhibition (OFC), Los Angeles, CA, USA, 19–23 March 2017. Paper Th4D2. [Google Scholar]
  16. Xia, T.J.; Wellbrock, G.A.; Huang, M.F.; Zhang, S.; Huang, Y.K.; Chang, D.I.; Burtsev, S.; Pelouch, W.; Zak, E.; de Pedro, H.; et al. Transmission of 400G PM-16QAM channels over long-haul distance with commercial all-distributed Raman amplification system and aged standard SMF in field. In Proceedings of the OFC 2014, San Francisco, CA, USA, 9–13 March 2014. Paper Tu2B1. [Google Scholar]
  17. DONET. Available online: https://www.seafloor.bosai.go.jp/DONET/ (accessed on 30 November 2024).
  18. Nakano, M.; Nakamura, T.; Kamiya, S.; Ohori, M.; Kaneda, Y. Intensive seismic activity around the Nankai trough revealed by DONET ocean-floor seismic observations. Earth Planet Space 2013, 65, 5–15. [Google Scholar] [CrossRef]
  19. DONET2. Available online: https://ja.dbpedia.org/page/DONET2 (accessed on 30 November 2024).
  20. Kawaguchi, K.; Araki, E.; Kogure, Y.; Takahashi, N.; Katayama, T.; Hishiki, K.; Fujiwara, N.; Iida, N.; Kaneda, Y. Development of DONET2-off Kii channel observatory network. In Proceedings of the 2013 IEEE International Under-water Technology Symposium (UT), Tokyo, Japan, 5–8 March 2013; pp. 1–5. [Google Scholar] [CrossRef]
  21. Yokobiki, T.; Choi, J.-K.; Nishida, S.; Matsumoto, H.; Araki, E.; Kawaguchi, K.; Takahashi, N.; Kodaira, S. Construction of DONET2. In Proceedings of the 2016 Techno-Ocean (Techno-Ocean), Kobe, Japan, 6–8 October 2016; pp. 435–438. [Google Scholar] [CrossRef]
  22. Smith, L.M.; Barth, J.A.; Kelley, D.S.; Plueddemann, A.; Rodero, I.; Ulses, G.A.; Vardaro, M.F.; Weller, R. The Ocean Observatories Initiative. Oceanography 2018, 31, 16–35. [Google Scholar] [CrossRef]
  23. Trowbridge, J.; Weller, R.; Kelley, D.; Dever, E.; Plueddemann, A.; Barth, J.A.; Orest, K. The Ocean Observatories Initiative. Front. Mar. Sci. 2019, 6, 74. [Google Scholar] [CrossRef]
  24. Cowles, T.; Delaney, J.; Orcutt, J.; Weller, R. The Ocean Observatories Initiative: Sustained Ocean Observing Across a Range of Spatial Scales. Mar. Technol. Soc. J. 2010, 44, 54–64. [Google Scholar] [CrossRef]
  25. Hansen, P.B.; Eskildsen, L. Remote Amplification in Repeaterless Transmission Systems. Opt. Fiber Technol. 1997, 3, 221–237. [Google Scholar] [CrossRef]
  26. Li, S.; Long, H.; Huang, L.; Huang, C.; Wu, J.; Liang, Y.; Duan, M.; Chen, F.; Wang, W. Unrepeatered transmission of single-carrier 800 Gb/s over 447.96 km with simplified third-order ROPA system. J. Phys. Conf. Ser. 2024, 2087, 012016. [Google Scholar] [CrossRef]
  27. Bissessur, H.; Bastide, C.; Dubost, S.; Calsat, A.; Hedaraly, F.; Plantady, P. Unrepeatered Transmission of 29.2 Tb/s over 295 km with Probabilistically Shaped 64 QAM. In Proceedings of the 2018 European Conference on Optical Communication (ECOC), Rome, Italy, 23–27 September 2018. [Google Scholar] [CrossRef]
  28. Chang, D.; Perrier, P.; Fevrier, H.; Xia, T.; Peterson, D.L.; Wellbrock, G.A.; Ten, S.; Towery, C.; Mills, G. Unrepeatered 100G Transmission Over 520.6 km of G.652 Fiber and 556.7 km of G.654 Fiber With Commercial Raman DWDM System and Enhanced ROPA. J. Light. Technol. 2015, 33, 631–638. [Google Scholar] [CrossRef]
  29. Zang, K.; Yu, C.X.; Xin, X.J.; Yuan, J.H.; Xie, W.J.; Wang, Y.C. Optimization on bandwidth in the third-order pumped distributed fiber Raman amplifier. Opt. Eng. 2013, 52, 076112. [Google Scholar] [CrossRef]
  30. Chang, D.-I.; Zak, E.; Pelouch, W.; Perrier, P.; Fevrier, H.; Deng, L.; Li, B.; Makovejs, S.; Hao, C.; Xu, J.; et al. 100G unrepeatered transmission over 626.8 km with a span loss in excess of 100 dB. In Proceedings of the Asia Communications and Photonics Conference (ACP) 2015, Hong Kong, China, 19 November–23 November 2015. Paper AM4A.2. [Google Scholar]
  31. Xiong, H.; Shan, Y.Y.; Sun, J.Q. Location optimization of remote gain unit in ultralong span repeaterless optical transmission system. Opt. Eng. 2017, 56, 1–4. [Google Scholar] [CrossRef]
  32. Soriano Sampaio Januario, J.C.; Chiuchiarelli, A.; Rossi, S.M.; Cruz, J.H., Jr.; Dias Reis, J.; Mornatta, C.; Festa, A.; Chrestani Bordonalli, A. System Design for High-capacity Unrepeatered Optical Transmission. J. Light. Technol. 2019, 37, 1246–1253. [Google Scholar] [CrossRef]
  33. Gainov, V.; Gurkin, N.; Lukinykh, S.; Nanii, O.; Treshchikov, V. Ultralong single-span lines with remote pumping of optical amplifiers. Tech. Phys. 2015, 60, 561–567. [Google Scholar] [CrossRef]
  34. Xu, J.; Fu, C.; Bu, Q.; Yu, C.; Jiang, Y.; Huang, L. Research on Remote Gain Unit of Ultra-Long Span Unrepeatered Optical Transmission System. Laser Optoelectron. Prog. 2012, 10, 102–107. [Google Scholar] [CrossRef]
  35. Agrawal, P.G. Optical Amplifers. In Fiber-Optic Communication Systems, 3rd ed.; Wiley: New York, NY, USA, 2002; pp. 226–273. ISBN 0-471-22114-7. [Google Scholar]
  36. Zibar, D.; Rosa Brusin, A.M.; De Moura, U.C.; Da Ros, F.; Curri, V.; Carena, A. Inverse System Design Using Machine Learning: The Raman Amplifier Case. J. Light. Technol. 2020, 38, 736–753. [Google Scholar] [CrossRef]
  37. Pelouch, W.S. Raman amplification: An enabling technology for long-haul coherent transmission systems. J. Light. Technol. 2016, 34, 6–19. [Google Scholar] [CrossRef]
  38. Singh, S.; Kaler, R.S. Performance optimization of EDFA–Raman hybrid optical amplifier using genetic algorithm. Opt. Laser Technol. 2015, 68, 89–95. [Google Scholar] [CrossRef]
  39. Singh, S.; Kaler, R.S. Optimizing the net gain of a raman-EDFA hybrid optical amplifier using a genetic algorithm. J. Opt. Soc. Korea 2014, 18, 442–448. [Google Scholar] [CrossRef]
  40. Mowla, A.; Granpayeh, N. Optimum design of a hybrid erbium-doped fiber amplifier/fiber Raman amplifier using particle swarm optimization. Appl. Opt. 2009, 48, 979–984. [Google Scholar] [CrossRef]
  41. Cai, J.-X.; Sun, Y.; Zhang, H.; Batshon, H.G.; Mazurczyk, M.V.; Sinkin, O.V.; Foursa, D.G.; Pilipetskii, A. 49.3 Tb/s transmission over 9100 km using C+L EDFA and 54 Tb/s transmission over 9150 km using hybrid-Raman EDFA. J. Light. Technol. 2015, 33, 724–2734. [Google Scholar] [CrossRef]
  42. Yuan, J.-G.; Liang, T.-Y.; Wang, W.; Gu, S. Impact analysis on performance optimization of the hybrid amplifier (RA + EDFA). J. Light Electron Opt. 2011, 122, 1565–1568. [Google Scholar] [CrossRef]
  43. HMN Technologies Co., Ltd. High Fiber Count Solution. Available online: https://www.hmntech.com/enjsrdB.jhtml (accessed on 30 April 2025).
Figure 1. Schematic diagram illustrating the temporary treatment of multipoint faults in submarine optical cables. (a) Multiple fault points; (b) temporarily cross-connections.
Photonics 12 00930 g001
Figure 2. Schematic diagram of the working principle of a third-order Raman amplifier system.
Photonics 12 00930 g002
Figure 3. Block diagram of the composition of an ROPA.
Photonics 12 00930 g003
Figure 4. Diagram of the simulation system’s logical connections.
Photonics 12 00930 g004
Figure 5. Flow chart of the GA + PSO + SA hybrid algorithm.
Photonics 12 00930 g005
Figure 6. Diagram of the simulation system’s logical connections with second-stage amplification.
Photonics 12 00930 g006
Figure 7. (a) Diagram of simulation system architecture (400 km total length); (b) Simulation results over 400 km.
Photonics 12 00930 g007
Figure 8. Photographs of the test environment. (a) The tested optical fiber; (b) The WSS, EDFA, first-order Raman amplifier (RPC in green box), and third-order Raman amplifier (RPC in red box); (c) The third-order Raman amplifier unit (including ERPC, ROP, and RPC; (d) The primary and branch line boards.
Photonics 12 00930 g008
Figure 9. Diagram of logical connections in the experimental system.
Photonics 12 00930 g009
Figure 10. Experimental testing results for (a) the forward line (Line1), (b) the middle line (first half of Line2), (c) the middle line (second half of Line2), and (d) the backward line (Line3).
Photonics 12 00930 g010
Figure 11. Optical power of the (a) transmitter and (b) receiver.
Photonics 12 00930 g011
Figure 12. (a) Average power distribution of the signal light over the entire optical fiber length; (b) 24-h Q-value fluctuation of the experimental 100 Gb/s transmission system.
Photonics 12 00930 g012
Figure 13. (a) Schematic diagram of Y-shaped cable routing scheme; (b) Schematic diagram of Y-shaped cable routing scheme with repeaters.
Photonics 12 00930 g013
Figure 14. Schematic diagram of optical links in the Y-shaped cable routing scheme without repeaters.
Photonics 12 00930 g014
Figure 15. Schematic diagrams of the (a) constant voltage power supply mode and (b) constant current power supply mode.
Photonics 12 00930 g015
Figure 16. Schematic diagram of the system using a dual-conductor submarine cable.
Photonics 12 00930 g016
Figure 17. (a) Schematic diagram of V-shaped cable routing scheme; (b) Schematic diagram of optical links in the V-shaped cable routing scheme without repeaters.
Photonics 12 00930 g017
Figure 18. (a) Diagram of simulation system architecture (652 km total length); (b) Simulation results of 652 km (the optical link length of the V-shaped cable routing scheme) with G.654E fiber.
Photonics 12 00930 g018
Figure 19. Schematic diagrams of the (a) constant voltage power supply mode and (b) constant current power supply mode.
Photonics 12 00930 g019
Table 1. Parameters of experimental optical fiber.
Fiber TypeG.654E
Attenuation0.1534 dB/km (including welding loss)
Chromatic Dispersion21.187 ps/(nm·km)
Dispersion Slope0.059 ps/(nm2·km)
Effective Area130 μm2
PMD0.035 ps/km
Effective Group Index of Refraction1.4658
Table 2. Parameters of optical sources and amplifiers.
TN51RPCTN51ROPTN97ERPCTN97RPCTN51HBA
WavelengthPowerWavelengthPowerWavelengthPowerWavelengthPowerWavelengthPower
1427–1457 nm18–28 dBm1476–1487 nm18–26.5 dBm1275 nm30–38.5 dBm1427–1457 nm18–28 dBm980 nm8–27 dBm
Table 3. Comparison of repeatered and unrepeatered schemes.
RepeateredUnrepeatered
CoverageVery large (almost unlimited)Relatively small (<690 km)
Number of fibersLimited (≤16 fiber pairs) [43]No less than 48 fiber pairs
ReliabilityRelatively high (affected by repeaters)Very high
Power supply modeMainly constant currentBoth constant current and constant voltage
CostHighLow
MaintenanceDifficultRelatively easy
Difficulty of constructionHighLow
ScalabilityRelatively difficultRelatively easy
Disclaimer/Publisher’s Note: The statements, opinions and data contained in all publications are solely those of the individual author(s) and contributor(s) and not of MDPI and/or the editor(s). MDPI and/or the editor(s) disclaim responsibility for any injury to people or property resulting from any ideas, methods, instructions or products referred to in the content.