Article

Design and Optimization of an FSO Network Under Practical Considerations

by
Marios Melanitis
1,
Petros S. Bithas
2,
Athanassios Katsis
3 and
Hector E. Nistazakis
1,*
1
Department of Physics, National and Kapodistrian University of Athens, 15784 Athens, Greece
2
Department of Digital Industry Technologies, National and Kapodistrian University of Athens, 34400 Psahna, Greece
3
Department of Social and Educational Policy, University of the Peloponnese, 20100 Korinthos, Greece
*
Author to whom correspondence should be addressed.
Photonics 2025, 12(9), 926; https://doi.org/10.3390/photonics12090926
Submission received: 6 August 2025 / Revised: 27 August 2025 / Accepted: 10 September 2025 / Published: 17 September 2025

Abstract

This study investigates the design and optimization of a free-space optical (FSO) wireless communication network employing high-altitude platforms (HAPs). The objective is to explore the parameters that affect the quality and viability of such a network and to develop a method for minimizing installation costs while maximizing performance. The methodology includes clustering ground nodes using the k-means algorithm and adjusting the emission solid angles for each HAP. Furthermore, to more closely reflect real-world conditions, our analytical investigations also consider the effects of atmospheric turbulence. The network’s performance is evaluated under both daytime and nighttime operational scenarios, taking into account background noise and the layered effects of atmospheric turbulence. These considerations ensure that the results presented in this paper more accurately reflect real-world conditions. The results demonstrate significant performance gains through appropriate parameter selection. Additionally, deploying multiple HAPs enhances network flexibility and resilience. It was shown that in certain scenarios specific combinations of per-HAP configurations offer more than a 70% increase in throughput with a small increase in the cost. The paper’s insights fill an important gap between theoretical FSO network models and the practical design considerations needed for real deployments.

1. Introduction

FSO communication relies on the propagation of light through free space to transmit data. This technology offers numerous advantages, including the potential for very high data transmission rates. However, a key limitation of FSO links is the requirement for a direct line-of-sight (LoS) between the transmitter and receiver. This limitation can be mitigated through the use of HAPs, which are unmanned aerial vehicles that operate at altitudes between 17 and 22 km [1]. Recent research on space–air–ground integrated networks (leveraging both FSO and RF links) highlights their potential and challenges, focusing on channel modeling, performance analysis, and cooperative transmission strategies for improved outcomes [2,3]. In this context, HAPs may serve as intermediate relay nodes, creating new optical paths between transmitters and receivers. The main challenge in designing an FSO network using HAPs lies in satisfying both technical and economic constraints while managing the trade-offs with system performance. A critical performance-related factor is atmospheric turbulence, as FSO links propagate through the atmosphere [4].

1.1. Related Work

This section first reviews the worls related to FSO communications, followed by an introduction to related studies that are relevant to HAPS-assisted FSO communications.

1.1.1. FSO Communications

FSO communications have been evolving rapidly, incorporating emerging technologies to overcome existing challenges and to improve the reliability, availability, and performance of optical wireless systems [5]. Deep learning techniques have been applied in [6], where resource allocation in FSO networks is investigated by formulating it as a constrained stochastic optimization problem, exploring power adaptation, relay selection, and joint allocation. In [7], a deep Q Network-based deep reinforcement learning algorithm is proposed for reliable FSO network routing, demonstrating significant improvements in packet delivery rates over existing methods and suggesting further enhancements for dynamic and quality-aware scenarios. Moreover, ref. [8] introduces an iterative optimization framework designed to mitigate the impact of weather effects in a 10 Gbps FSO network, minimizing the bit error rate (BER). In [9], atmospheric turbulence effects were investigated on FSO communication links, developing a deep neural network (DNN) classifier to predict the link status based on meteorological features and outage probability analysis.
The impact of background noise on FSO systems using on–off keying (OOK) modulation is studied in [10]. The results showed that coherent receivers with sensitivity (−51.42 dBm) outperform non-coherent ones (−54.6 dBm). Reference [11] introduced accurate statistical models for turbulence, spatial jitter, and time jitter in FSO systems, employing the Málaga, non-zero boresight, and generalized Gaussian distributions, respectively. It further presented new analytical expressions for average BER under various modulation and diversity schemes, offering valuable insights through comprehensive numerical analysis. In [12], a hybrid RF/FSO system is proposed, capable of adapting to diverse weather conditions and experimentally supporting data rates up to 50 Gbps. Similarly, ref. [13] proposes a hybrid FSO/terahertz backhaul network designed for mobile users, considering also turbulence and alignment errors to improve both speed and reliability.
A high-throughput FSO–5G system achieving 21 Gbps is demonstrated in [14], incorporating Erbium-Doped Fiber Amplifier (EDFA)s and fiber Bragg grating (FBG) for improved performance. In [15], three dual-hop systems (FSO–FSO, RF–FSO, and FSO–RF) are examined under atmospheric turbulence (gamma–gamma fading for FSO, Nakagami-m fading for RF) and pointing errors. The use of Differential Chaos Shift Keying (DCSK) improves the security, and the performance evaluation shows that the FSO–RF–DCSK system achieves the best BER results.

1.1.2. HAPS-Assisted FSO Communications

In [16], a UAV-to-ground FSO link is analyzed for front-haul communications using subcarrier intensity modulation and avalanche photo-diode (APD) detection. Considering turbulence, pointing errors, and noise, the results show optimal APD gain, and the beam waist settings significantly improve the symbol error rate performance. In [17], an energy-aware FSO system for simultaneously transmitting power and data from a ground station to an aerial UAV via a HAP is proposed. A composite channel model is developed, accounting for atmospheric turbulence, Mie scattering, and pointing errors. The study in [18] investigates hybrid FSO/RF communication between HAPs, satellites, and ground stations under turbulent conditions, forwarding signals based on maximum signal-to-noise ratio (SNR) criteria. In [2], a distributed space–air–ground integrated (SAGI) communication transmission scheme is proposed with FSO/RF links. In this system, outage probability expressions are derived considering the impact of turbulence, fading, and shadowing. The analytical and numerical results show superior performance compared to pure FSO relaying under varying conditions. In [19], a system-level design is presented of multi-layer airborne FSO backhaul networks using HAPSs and UAVs. In this work, a step-by-step methodology is shown that ensures seamless coverage, with the numerical results demonstrating design choices for rural and urban scenarios. In [20], an adaptive clustering algorithm is proposed to assign ground nodes to HAPs using a 1-to-1 protection scheme, resulting in a 95.55% increase in network availability. In [21], the parallel use of FSO and RF frequencies is implemented in a HAP-based network architecture, achieving a spectral efficiency of 4 bps/Hz for remote users in hard-to-reach areas. The same algorithm is extended in [1] to include multiple transceivers per HAP, in order to minimize the total cost of the network. However, despite the important contribution of [1], a notable limitation is observed that is related to the assumption of identical hardware across all HAPs, which may cause feasibility and interoperability issues in practical scenarios. Moreover, in that study, the impact of turbulence was not taken into account, while the performance of the throughput was not investigated. Finally, the strategy proposed in [1] prevents the network design from being constrained to a single “optimal” solution, which may reduce the cost but at the expense of significantly degrading the performance.

1.2. Contributions

This study introduces several novel contributions to the design and optimization of FSO networks employing HAPs under atmospheric turbulence conditions. More specifically, this work presents a holistic approach to the problem, applying clustering algorithms for the assignment of ground nodes, parametric analysis of beam divergence angles, and statistical modeling of atmospheric turbulence using the gamma–gamma distribution. Additionally, separate modeling is performed for daytime and nighttime conditions, to account for variations in background noise and turbulence effects. The detailed contributions of this paper are as follows.
  • An unsupervised learning technique is adopted for clustering, in which k-means is applied to assign ground nodes to HAPs in a way that minimizes the total cost of network deployment. This method also drastically simplifies the clustering process complexity [22,23], offering a scalable and automated solution compared with manual or heuristic-based methods [24].
  • The work builds on [1] by relaxing the assumption of identical hardware across all HAPs. Instead, each HAP is allowed to have a distinct configuration (e.g., transceivers, beam divergence angles), enabling improved overall network performance through adaptive design.
  • A visual configuration tool is introduced in the form of a diagram that allows readers to extract all essential parameters of a single HAP—such as beam divergence angles, service radius, and cost contribution—by using only two vertical lines. This is an original and practical approach that helps network planners quickly interpret how configuration changes (e.g., widening a beam angle) affect the coverage and throughput.
  • A layered atmospheric modeling technique is employed to calculate the stochastic turbulence factor. While this stratification method is commonly found in underwater optical communication studies, to the best of the authors’ knowledge, it is applied here for the first time to HAP-based FSO channels.
  • Extending the techno-economic modeling of [25] to HAP-assisted FSO communication scenarios, the analysis moves beyond strict cost minimization by evaluating and comparing both minimum-cost and slightly higher-cost network configurations. This approach enables the exploration of trade-offs between cost, throughput improvement, and resilience to future structural or environmental changes.
  • Furthermore, in order to compute the network cost, we adopt a cost metric similar to that employed in [1]. For the sake of generality, the cost values are expressed in a dimensionless form, allowing for comparisons and applicability independent of any particular currency.
The remainder of this paper is structured as follows: Section 2 provides a description of the network, includes the calculation of the coverage radius of a HAP, and presents the computation of the network’s total cost. Section 3 outlines the process of constructing and optimizing the service network in terms of cost, followed by a theoretical examination of the impact of atmospheric turbulence on throughput. Section 4 presents the numerical results of this study, while Section 5 discusses the conclusions and the future prospects arising from the present work. Throughout the remainder of this work, the symbols and parameter values listed in Table 1 will be used.

2. Dimensions and Cost of the HAP Network

2.1. Network Description and Calculation of the Service Radius of a HAP

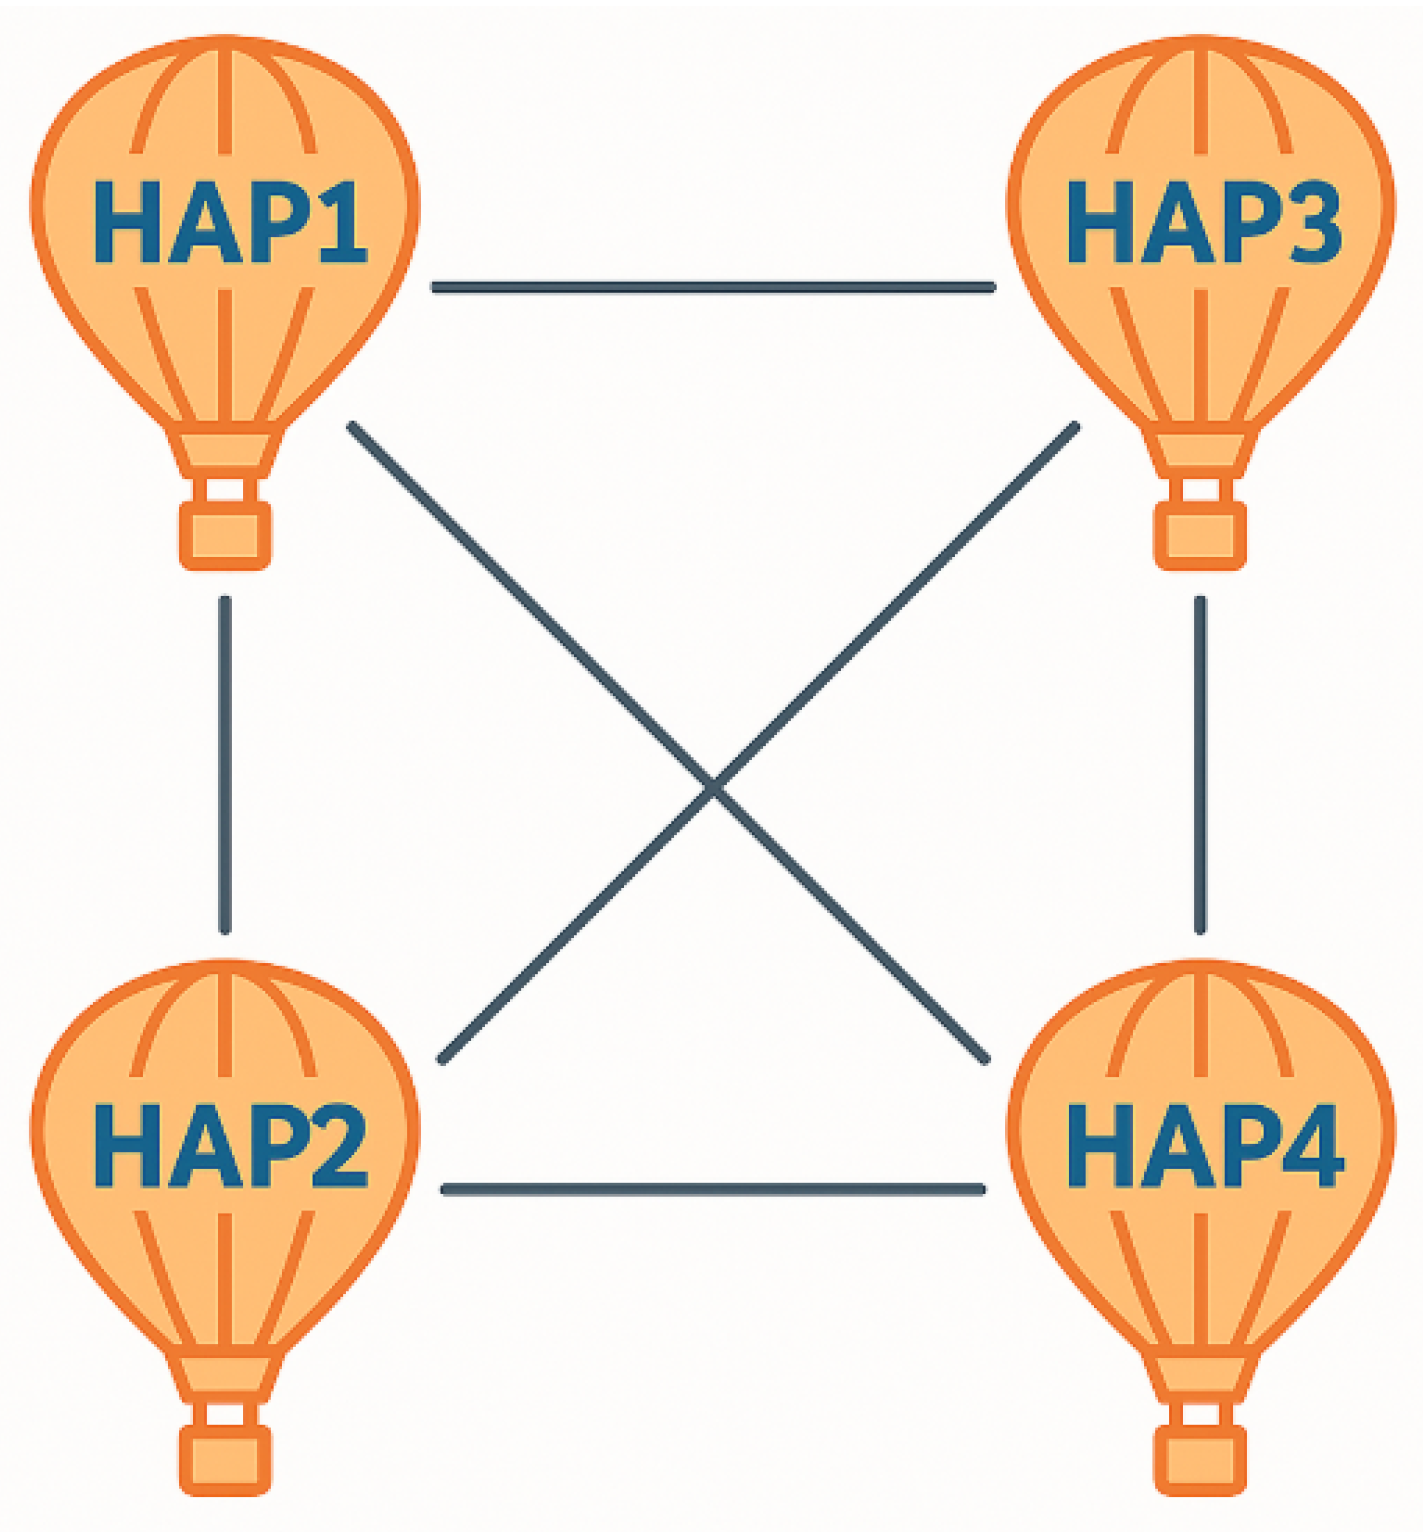
The examined network architecture comprises HAPs that communicate directly with each other (see Figure 1 and Figure 2) and FSO transceivers deployed on the ground, which are hereafter referred to as ground nodes. The number of HAPs varies from 1 to 4, depending on the network needs. Communication between a HAP and the ground nodes follows a point-to-multipoint topology and employs the Wavelength Division Multiplexing (WDM) technique for this purpose [1]. Each ground node is assigned a unique wavelength for receiving and transmitting data to and from the HAP. Consequently, the number of ground nodes that can be served by a single HAP is constrained by the WDM technique itself, as well as by the hardware limitation of the HAP. In this study, we denote the number of available wavelengths provided by the WDM technique as W . Therefore, each HAP serves a specific number of ground nodes.
The optical signal path from the transmitter to the receiver is as follows. Suppose that ground node A, served by HAP i , intends to transmit data to ground node B, which is served by HAP j . First, ground node A sends the data to HAP i . Then, HAP i forwards the data to HAP j , which subsequently delivers the data to ground node B. In this manner, wireless communication between the remote ground nodes A and B is established. This architecture effectively bypasses obstacles that block the direct line-of-sight (LoS) between the two distant ground nodes.
Each ground node is equipped with a telescope of radius R t e l to detect the received power. In this paper, we denote the downward-facing serving transceivers as sFSOs and the inter-HAP transceivers as iFSOs. The sFSOs are downward-facing and communicate with the ground nodes. The iFSOs are oriented towards other HAPs and are used for inter-HAP communication, interacting with the corresponding iFSO units on neighboring platforms. The sFSO transceivers are classified as principal sFSOs and supplementary sFSOs. Each HAP is equipped with one principal sFSO and four or more supplementary sFSOs. The principal sFSO emits radiation vertically towards the ground with a beam divergence angle of α s . Assuming that the radiation flux is uniform at every point equidistant from the HAP [1], the radiation powers received by the ground node from the main and the supplementary sFSO are, respectively, given by
R t e l 2 e σ r ρ t x F S O 2 r 2 1 cos α s 2 U t h r e s ,
and
R t e l 2 e σ r ρ t x F S O 2 r 2 1 cos β s 2 U t h r e s ,
where σ is the atmospheric attenuation coefficient, ρ t x F S O is the transmitted power for each sFSO, and U t h r e s denotes the detector’s sensitivity.
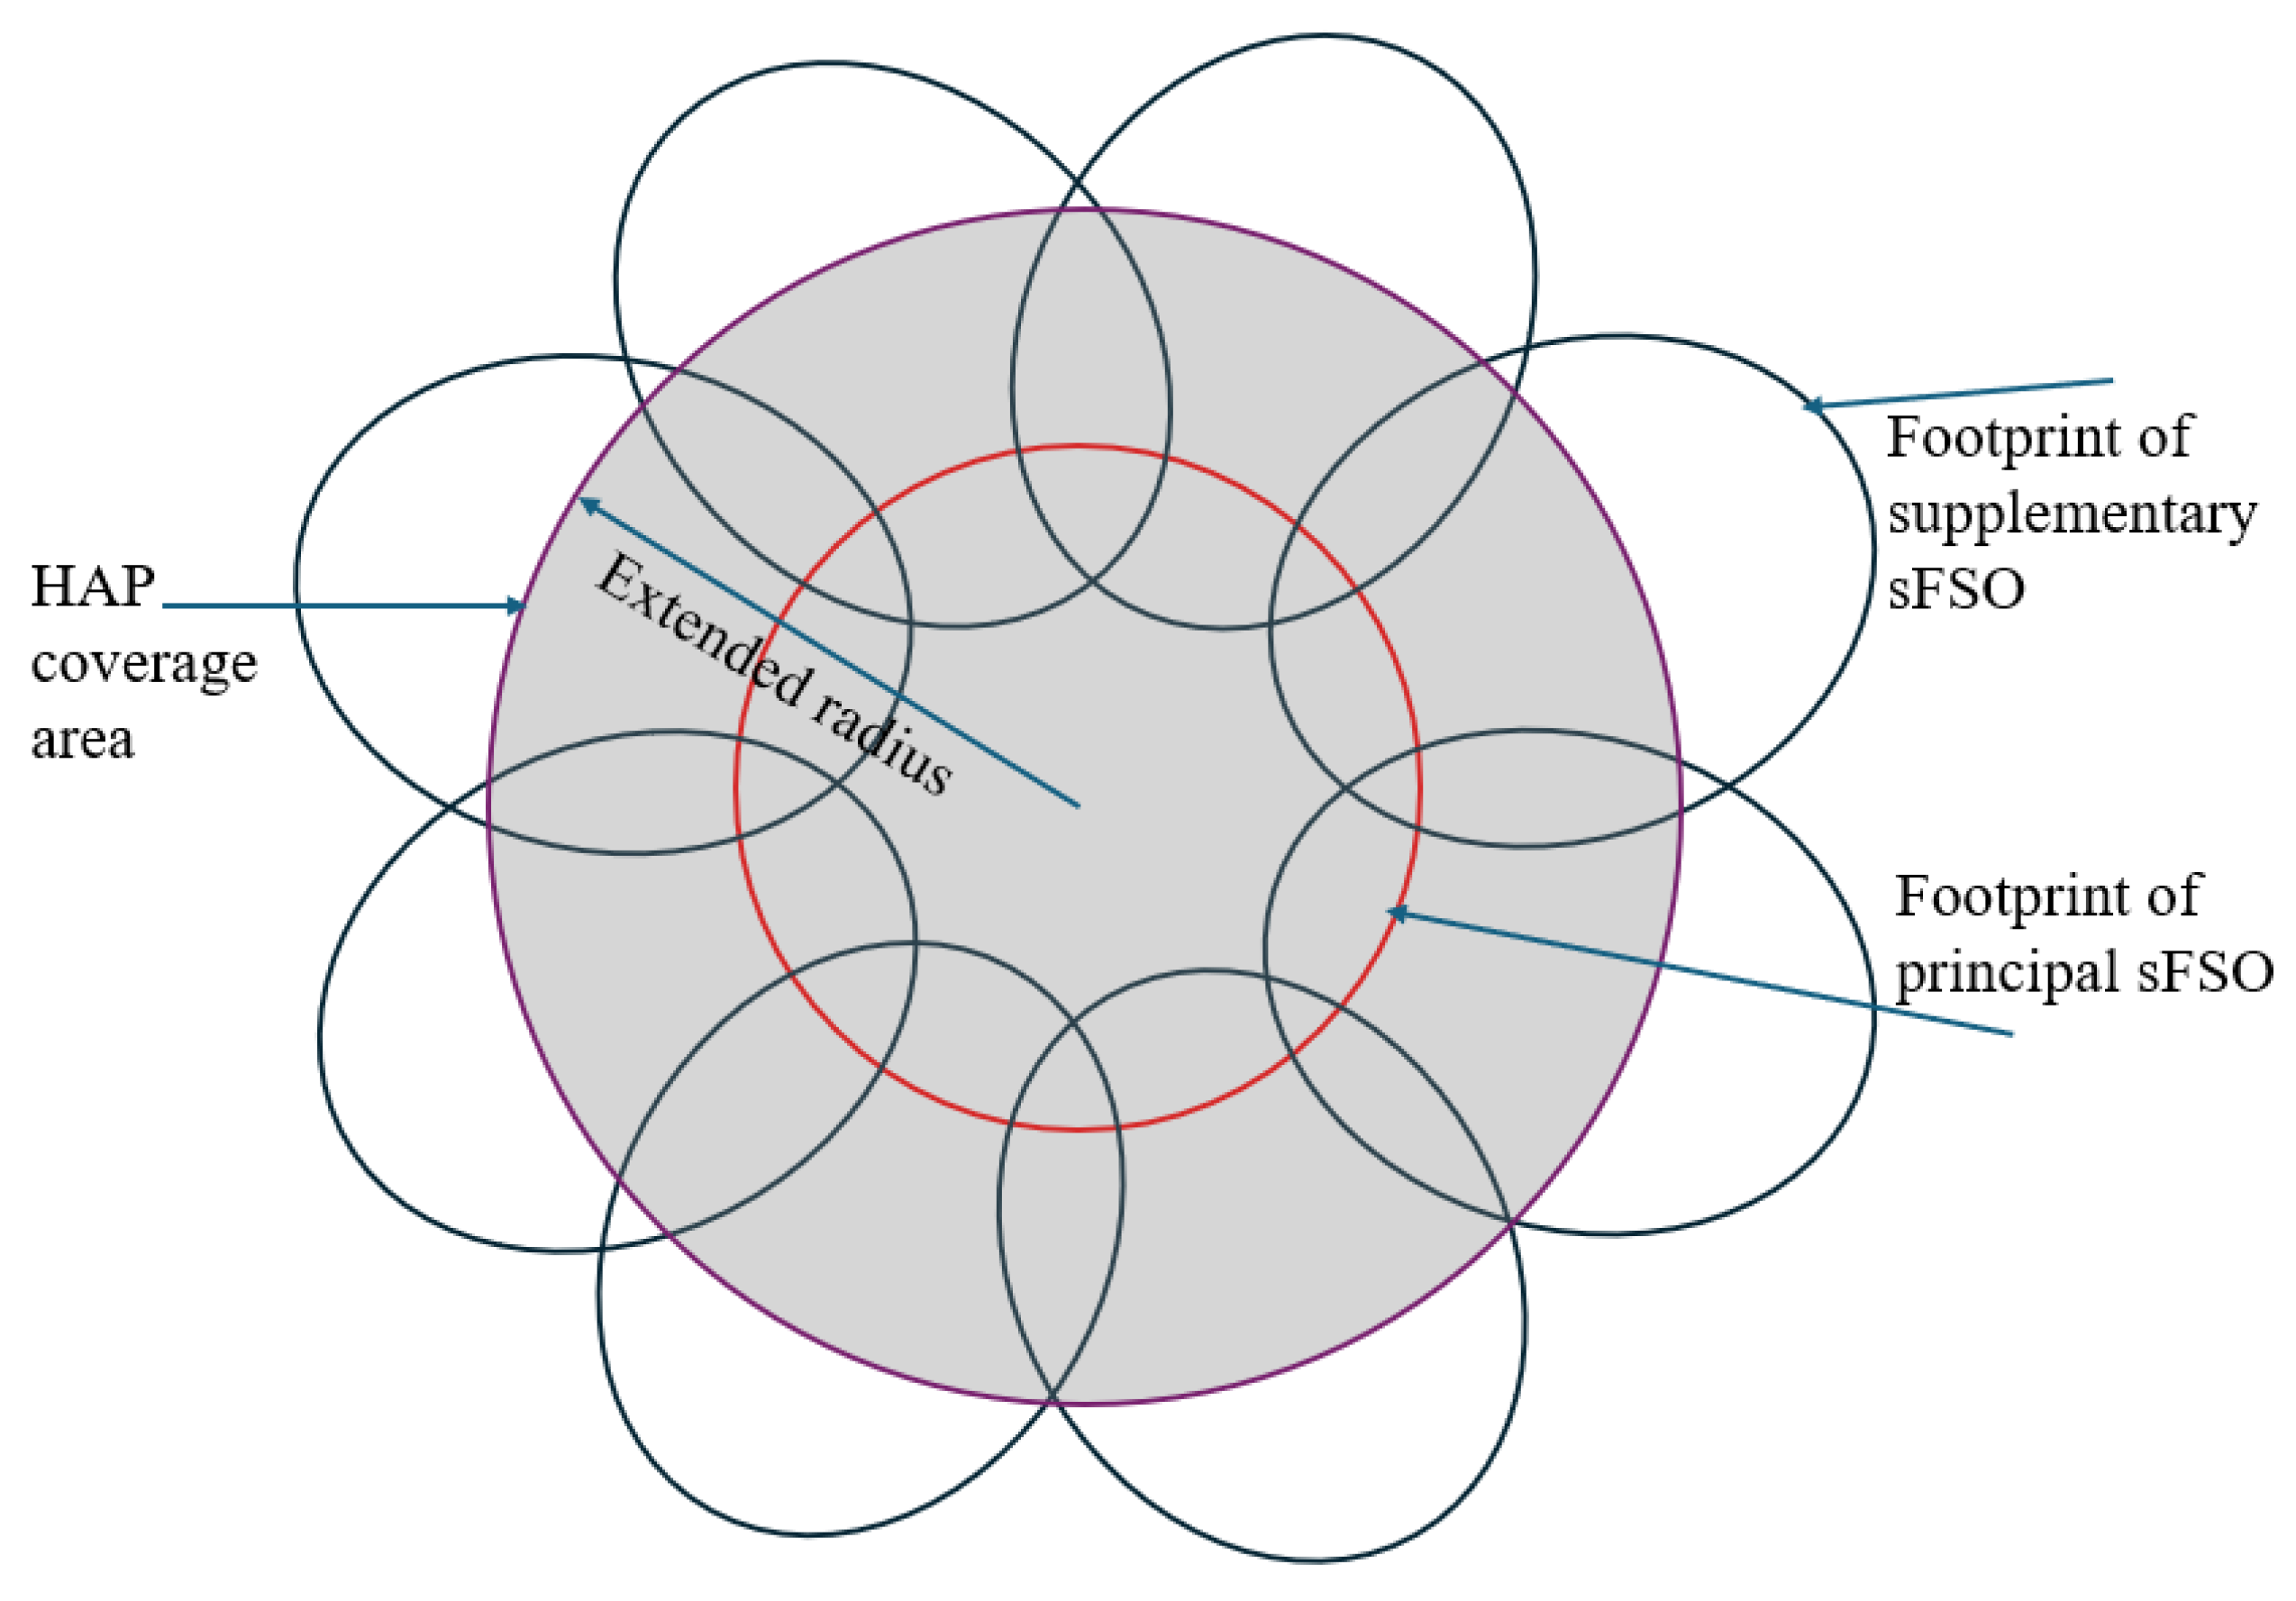
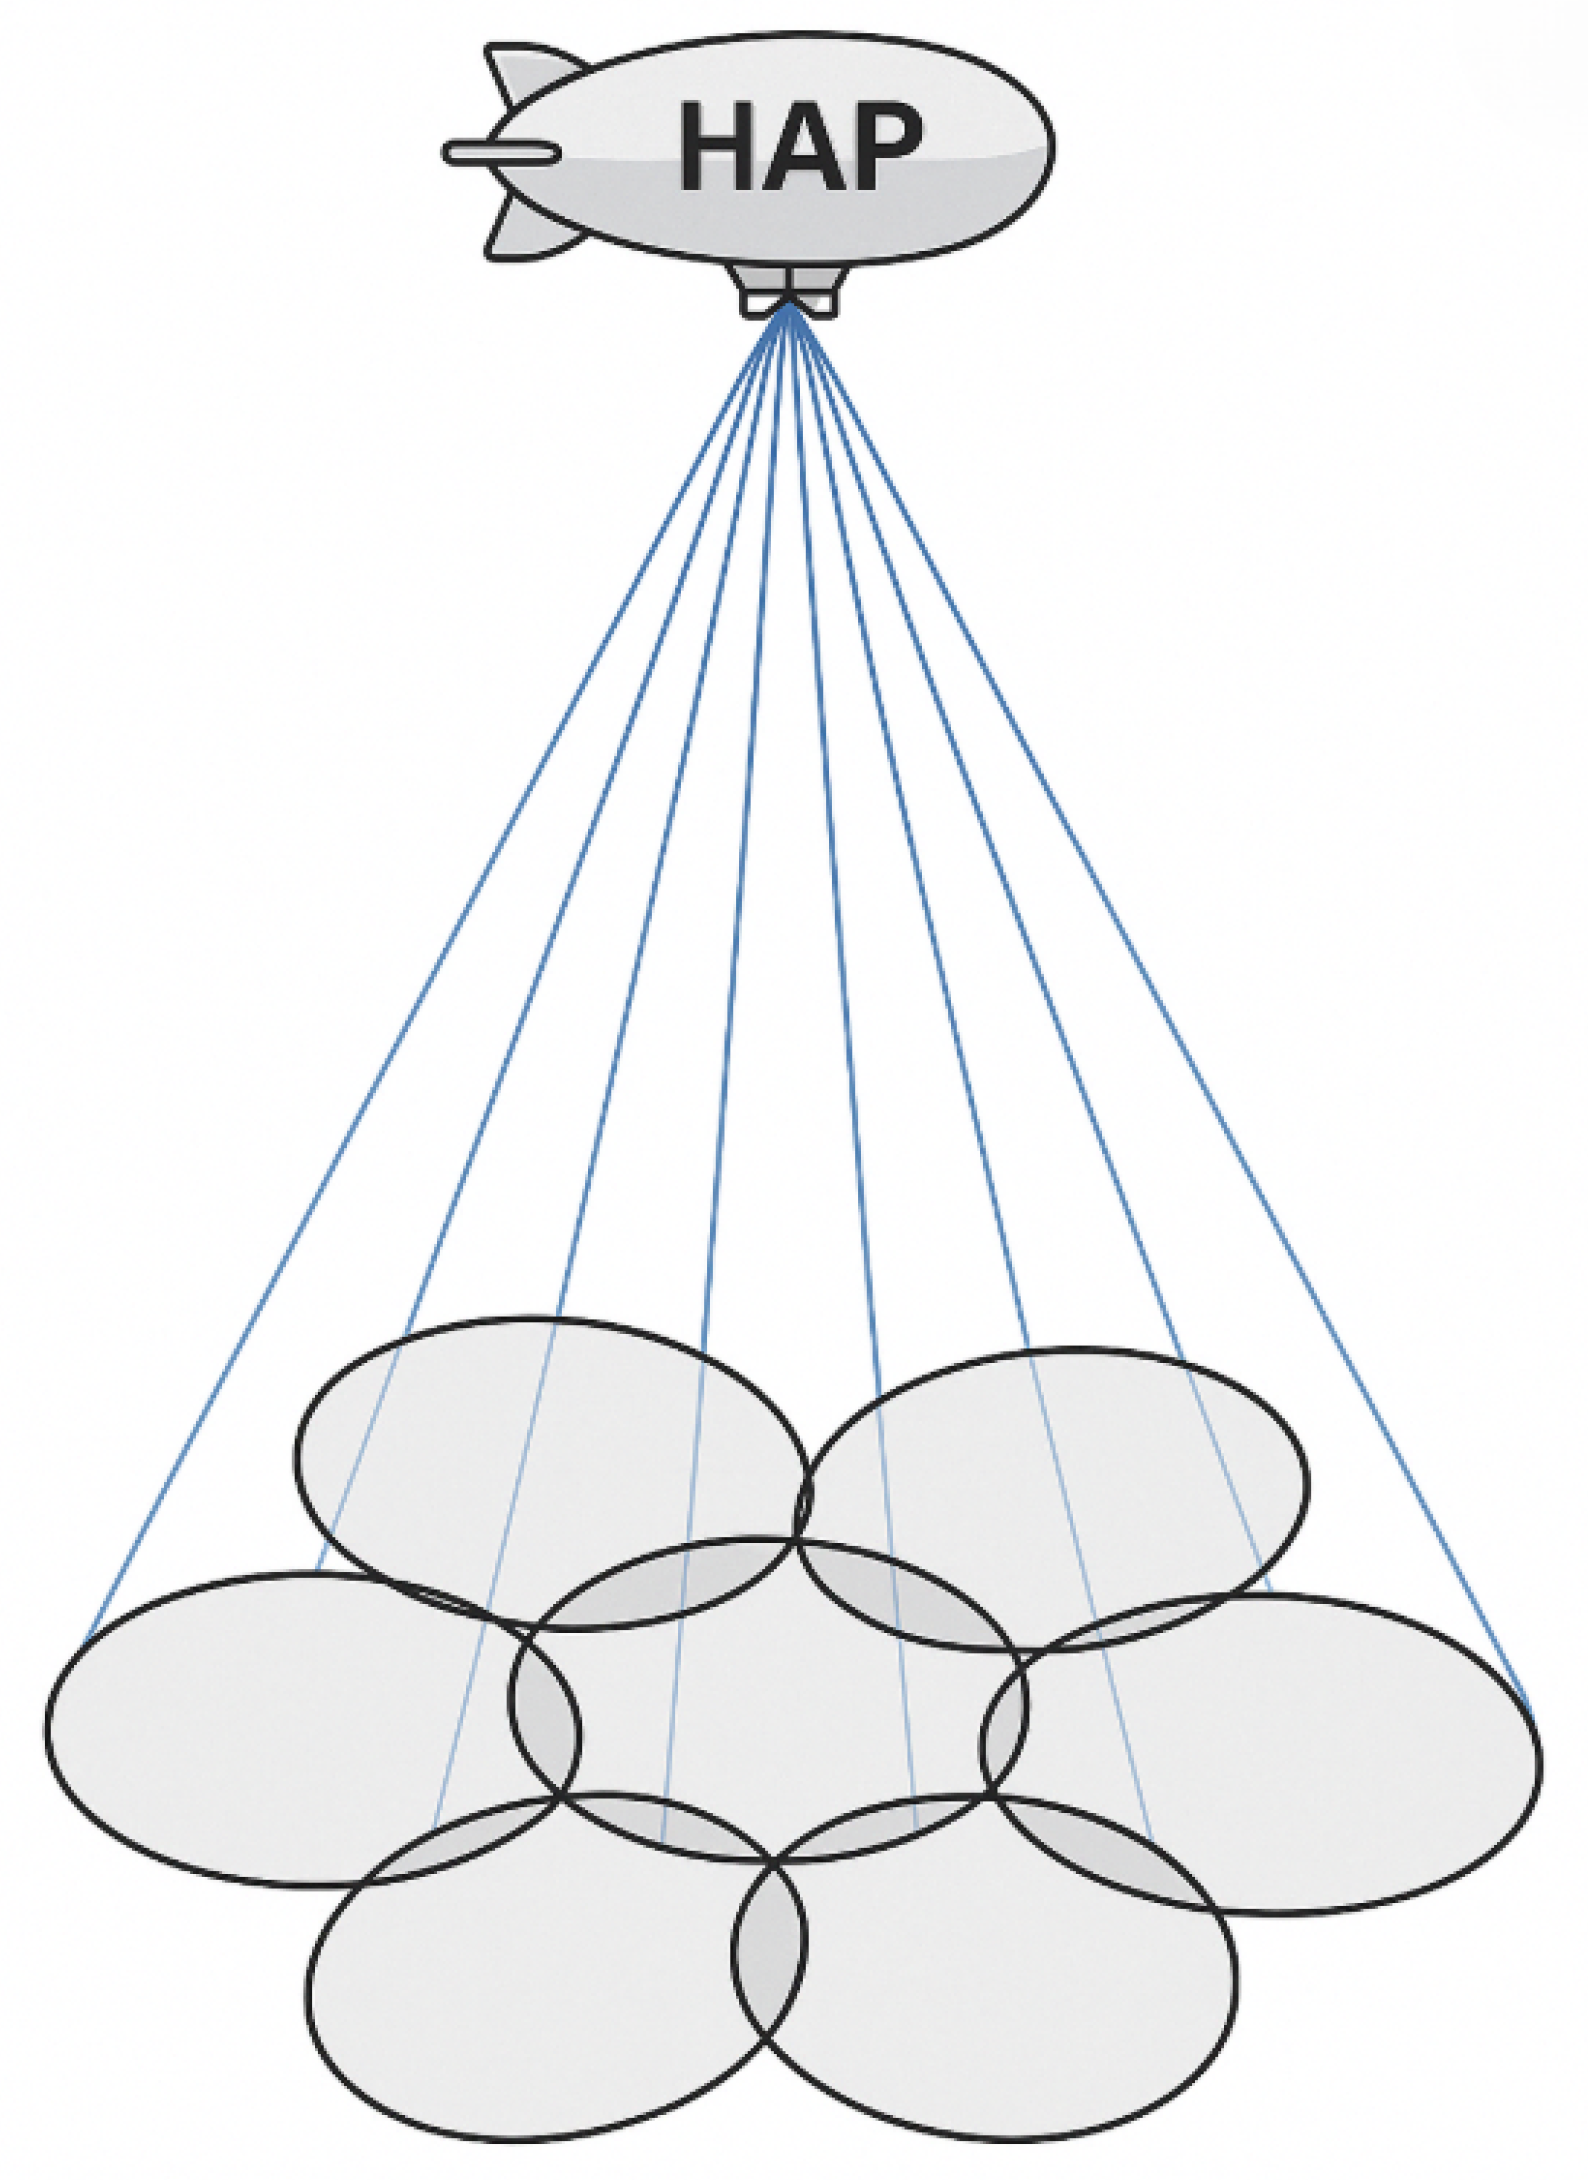
As a result, a circular area is formed on the ground within which the ground nodes are considered to be served. The radius of this area is defined as the coverage radius of the HAP. The supplementary sFSOs emit radiation with a beam divergence angle of β s and are tilted relative to the main beam in order to extend the coverage radius of the HAP. This expanded coverage region is characterized by an extended radius, defined as the distance from the HAP at which the received power falls to the sensitivity threshold. This distance is the extended radius as can be seen in Figure 3 and Figure 4. As shown in these figures, sufficient margins are incorporated to ensure that small movements or rotations do not significantly affect the signal reception.
According to Appendix A and B of [1], the extended radius is calculated using the following expressions:
R s e r v = H 2 tan ξ + α s , i 2 1 tan 2 ξ + α s , i 2 tan α s , i 2 1 tan 2 ξ + α s , i 2 + 2 tan ξ + α s , i 2 tan α s , i 2 ,
tan γ = cos π m i tan α s , i 2 ,
where R s e r v is the extended radius, H is the operating altitude of the HAP, α s , i and β s , i are the beam divergence angles of the principal sFSO and the supplementary sFSOs of HAP i respectively, m i is the number of the supplementary sFSOs of HAP i , and all other parameters are defined in [1]. From Equations (3) and (4), it follows that the extended radius, which defines the coverage area of HAP i , is a function of the parameters α s , i , β s , i and m i . That is,
R s e r v = f ( α s , i , β s , i , m i ) .

2.2. Cost Estimation of the HAP Network

There are three types of costs in the HAP network that can be identified: investment cost, maintenance cost, and energy consumption cost. The energy consumption cost is assumed to be zero due to the use of solar energy harvested by photovoltaic panels installed on the HAP. However, this imposes constraints, which will be discussed in the following sections. The total cost of the HAP network is given by the following expression:
ζ = ζ d a i l y m t n + ζ i n v = K ζ H d a y + i = 1 K n i s F + n i i F ζ F d a y ,
where ζ d a i l y m t n is the daily maintenance cost, ζ i n v is the investment cost, and all other parameters are defined in Table 1.
The number of iFSOs on HAP i is less than or equal to the number M of inter-HAP links. Therefore, setting the number of iFSOs equal to the number of inter-HAP links would lead to an overestimation of the total cost. In contrast to the assumptions made in [1], we further assume that the number of iFSOs is equal to the number of sFSOs. This assumption is justified by the fact that whenever the ground node A intends to transmit data to ground node B, an inter-HAP link must be established. As a result, we set M = m i + 1 . This variation leads to the computation of an upper bound for the cost overestimation, which provides a greater safety margin in cases where the actual cost exceeds the theoretical estimate. By applying the additional assumption to Equation (6), the following equation is derived, which is used for the final cost calculation.
ζ = K ζ H d a y + 2 ζ F d a y i = 1 K m i + 1

3. Optimization of the Serving Network

3.1. Technical Parameters and Daily Energy Consumption

As mentioned above, energy consumption is fully covered by solar energy harvesting. Therefore, a constraint is imposed: the total energy consumed by the HAP and its onboard components must not exceed the solar energy harvested. The daily energy consumption of HAP i is given by the following expression:
E d a y , i c o n s = μ H + n i i F + n i s F μ F ρ a v i o n + n i s F + 1 ρ t x F S O + ρ F H C M + ρ P A T + ρ i n t e r n i i F T ,
where T represents the duration of a single day in seconds.
By incorporating the additional assumption about the number of sFSO and iFSO units, Equation (8) is rewritten as follows:
E d a y , i c o n s = m i + 1 2 ρ a v i o n μ F + μ H + ρ P A T + ρ t F S O x + ρ F H C M .
Thus, using Equation (9), the constraint is formulated by the following expression:
E s o l a r E d a y , i c o n s = m i + 1 2 ρ a v i o n μ F + μ H + ρ P A T + ρ t F S O x + ρ F H C M .
The variable parameter in the inequality presented in (10) is the number of sFSOs and consequently the number of iFSOs’ transceivers as well. Therefore, an upper bound limit is imposed on the total number of FSO transceivers that a HAP can accommodate.

3.2. Optimization Problem

We consider a set of ground nodes, G = { g 1 , g 2 , , g M } , to be served by a number of HAPs Z = { h 1 , h 2 , , h N } , where N = 1 , 2 , 3 , 4 . The optimization procedure consists of the following steps:
1.
For a given distribution of ground nodes, the position of the HAPs are determined (e.g., k-means). Thus, for each N, we obtain a set of candidate HAP positions.
P N = { p h 1 , p h 2 , , p h N } ,
where p h n = ( x n , y n ) are the coordinates of the n-th HAP, n = 1 , 2 , , N .
2.
For each candidate network with N HAPs, we define all possible combinations of configurations in term of the operating triplets for each HAP:
C N = { ( α s , 1 , m 1 , β s , 1 ) , ( α s , 2 , m 2 , β s , 2 ) , , ( α s , N , m N , β s , N ) } .
Each configuration must satisfy the constraints (1), (2), and (10).
3.
Among all feasible combinations of configurations C N , we select those that minimize the total network cost z N :
z m i n , N = min Cos t ( C N ) .
4.
Finally, the configurations with minimized cost are further evaluated in terms of the network throughput. The throughput calculation takes into account the turbulence effect of the optical wireless channel. The exact analytical model is presented in Section 3.4.

3.3. Optimization

In the design of the minimum-cost network topology, we employ two algorithms. Algorithm 1 is called “ f i n d _ t h e _ o p t i m a l _ c o n f i g u r a t i o n _ f o r _ H A P i ”, and Algorithm 2 is called “ f i n d _ b e t a _ m a x ”. Algorithm 2 is used exactly as presented in [1]. However, Algorithm 1 constitutes a modified version of the corresponding algorithm in [1], transforming the original approach by allowing each HAP i to independently adjust its ( α s , i , m i , β s , i ) parameters. The complexity of Algorithm 1 is O( m i ). The complexity of Algorithm 2 is constant because β π . This allows for a more flexible and potentially more cost-efficient network configuration, in contrast to [1], where identical parameter values applied to all HAPs. This assumption allows us to investigate scenarios that are of greater practical interest.
These algorithms are integrated into a broader topological design framework, which is presented step by step as follows: k means’ main idea is to define one centroid for each of the k clusters. Due to the fact that different locations cause different results, the better choice is to place them as far away as possible from each other. The next step is to take each point belonging to a given distribution and associate it with the nearest centroid. The points associated with a specific centroid form a cluster. The next step is to recalculate k new centroids as centers of the clusters resulting from the previous step. After these k new centroids, a new binding has to be performed between the same data points and the nearest new centroid. The process is repeated until the positions of the centroids no longer change. Finally, the algorithm aims to minimize the squared error function. In this case, the centroids’ locations are the HAPs’ coordinates, and the points are the ground nodes’ coordinates. The following expression is the squared error function.
W ( S , K ) = k = 1 K i S k | y i c k | 2 ,
where S is a K-cluster partition of the entity set represented by vectors y i ( i I ) in the M-dimensional feature space, consisting of non-empty non-overlapping clusters S k , each with a centroid c k (k = 1, 2, …, K) [23].)
Step 1:
Create the ground node distribution and define system constants.
Step 2:
Determine HAP positions and clustering of ground nodes per HAP (Clustering), for networks with one, two, three, and four HAPs, using the k-means.
Step 3:
Verification of technical and physical constraints for each network configuration and exclusion of those that do not satisfy them.
Step 4:
For each network and each HAP, computation of the total cost and extended coverage radius for all possible configurations ( α s , i , m i , β s , i ) using Algorithm 1.
Step 5:
Selection, for each network, of the configurations that satisfy the minimum-cost criterion.
Algorithm 1 Find the optimal mFSO configuration for HAPi
  1:
c min                              ▷ Minimum cost
  2:
m a x _ i n t e r _ H A P _ l i n k s m i + 1   ▷  Maximum number of inter-HAP connections
  3:
o p t _ a r r a y [ ]          ▷ Initialize configuration array with empty entries
  4:
Calculate α s , i , max by treating Relation (1) as an equality
  5:
for  α s , i = α s , i , max 0   do
  6:
      Calculate m i , max from (9)
  7:
       m o p t 0
  8:
      for  m = 4 m i , max  do
  9:
             β s , i b e t a _ m a x ( α s , i , m i )                     ▷ Algorithm 2
10:
            Calculate R serv , i ( α s , i , m i , β s , i ) from Equations (3)–(5)
11:
            Calculate c from Equation (7)                      ▷ Cost
12:
            if  c c min  then
13:
                   c min c , α o p t α s , i , m o p t m , β o p t β s , i
14:
                   n e w _ r o w [ α o p t , m o p t , β o p t , R serv , i , c ]
15:
                  Append n e w _ r o w to o p t _ a r r a y
16:
            end if
17:
      end for
18:
end for
19:
return   o p t _ a r r a y
It should be noted that, in an alternative approach, the authors in [20] propose an adaptive algorithm to automatically determine the number of groups, rather than using the k-means method adopted in the present study. The main advantage of this approach is that it eliminates the need to predefine the number of groups. However, this also complicates the comparison of ground node distributions across different numbers of HAPs. As will be demonstrated in a subsequent section, selecting the optimal number of HAPs requires consideration of multiple factors. Therefore, maintaining flexibility in this aspect of the network design is essential for informed decision-making.
Algorithm 2 Find beta_max [1]
  1:
for   β s , i = 0 180  do
  2:
     Compute R serv ( α s , i , m i , β s , i ) from (3) and (4)
  3:
      m a x _ l e n g t h _ l i n k R serv 2 + H 2                    ▷ Link length
  4:
     Compute r e c e i v e d _ p o w e r
  5:
     if  r e c e i v e d _ p o w e r < t h r e s h o l d  then
  6:
           β s , i β s , i 1
  7:
          break
  8:
     end if
  9:
end for
10:
return   β s , i

3.4. The Impact of Turbulence

In this work, the performance of each minimum-cost network configuration, corresponding to a different number of HAPs, is evaluated in terms of throughput. To this end, the effect of atmospheric turbulence must be incorporated into the network model. Therefore, in what follows, the turbulence model that is adopted in this paper is presented.
The scintillation index is defined as the spatial or temporal variance of the received irradiance I at the detector. In the theory of weak scintillation, which provides sufficiently accurate predictions under most atmospheric conditions, the scintillation index is proportional to the Rytov variance, as follows [26,27]:
σ I , r y t o v 2 = 1.23 C n 2 k 7 / 6 L 11 / 6 ,
where C n 2 represents the strength of the turbulence, k is the optical wavenumber, and L is the length of the propagation path. To estimate the turbulence strength, the SLC day and SLC night models are employed for daytime and nighttime conditions, respectively. According to [28], the SLC day and SLC night models are defined as follows:
C n 2 ( d a y ) = 1.7 × 10 14 if 0 < h < 18.5 m 3.13 × 10 13 h 1.05 if 18.5 m < h < 240 m 1.3 × 10 15 if 240 m < h < 880 m 8.87 × 10 7 h 3 if 880 m < h < 7200 m 2 × 10 16 h 0.5 if 7200 m < h < 20000 m ,
C n 2 ( n i g h t ) = 8.4 × 10 15 if 0 < h < 18.5 m 2.87 × 10 12 h 2 if 18.5 m < h < 110 m 2.5 × 10 16 if 110 m < h < 1500 m 8.87 × 10 7 h 3 if 1500 m < h < 7200 m 2 × 10 16 h 0.5 if 7200 m < h < 20000 m .
Let n i be the index characterizing the link between HAP i and the ground node with index n. The n i th signal received by the photodetector can be expressed as follows [18]:
y n i = a n i h n i x n i + w n i ,
where y i is the signal received at the receiver, x i is the signal transmitted by the transmitter, a n i is the deterministic attenuation factor, h i is the stochastic fading component, and w i is the AWGN. Under this assumption, according to [18], the instantaneous SNR for the link between HAP i and ground node n is given by the following expression:
γ n i = a n i 2 g n i P n i N 0 ,
where g n i | h n i | 2 , P n i is the power received at the receiver from HAPi and N 0 is the power of the AWGN (Additive White Gaussian Noise). Thus, the rate of the link n i is given by the following expression:
R n i ( g n i ) = B log 2 ( 1 + γ n i ) ,
where B is the bandwidth. The sumrate is the total of the rates of all links and is given by the following expression:
s u m r a t e = i = 1 K n i W R n i ( g n i ) ,
where K is the number of HAPs, and W is the number of FSO links. The throughput is the average sumrate of the system with respect to the time samples obtained for the SNR. Due to the fact that the turbulent channel exhibits weak to strong turbulence, it will be modeled using the gamma–gamma distribution, which provides sufficiently accurate results over a wide range of C n 2 values. The probability density function of the gamma–gamma distribution is given by the following expression [29]:
f g n i x = 2 ( a b ) a + b 2 Γ ( a ) Γ ( b ) x a + b 2 1 K a b 2 a b x ,
where Γ ( . ) is the gamma function, and K q ( . ) is the modified Bessel function of the second kind and order q. According to [30], the parameters a and b depend on the atmospheric conditions and, in the case of spherical waves, are given by the following expressions:
a = exp 0.49 δ s 2 1 + 0.18 d 2 + 0.56 δ s 12 / 5 7 / 6 1 1 b = exp 0.51 δ s 2 1 + δ s 12 / 5 5 / 6 1 + 0.9 d 2 + 0.62 d 2 δ s 12 / 5 1 1 ,
where d = k D 2 4 L , δ s 2 = σ I , r y t o v 2 2.5 , D is the aperture diameter of the receiver, and L is the length link.

3.5. Background Noise

To quantify the power of background noise in the FSO links, the values N 0 , d a y = 10 8 W and N 0 , n i g h t = 10 11 W for day and night background noise, respectively. These values are supported by the study by [10], which includes experimental measurements and theoretical analyses of the impact of ambient light on the FSO system. Specifically, the article states that when the sun directly illuminates the receiver, the power of the light entering the receiver is in the order of 16.96  nW, with a corresponding power spectral density (PSD) of 6.84 × 10 20  W/Hz. In general, the measured PSD values of ambient light noise range between 10 20 and 10 17 W/Hz (see Table 2 in [10]). By multiplying these values by the receiver bandwidth of 10 9  Hz, the resulting background power ranges from 10 11 to 10 8  W—an interval that includes the values used in the present study.

3.6. Method for Calculating Turbulence Gain Based on SLC Models

In this section, we develop a method for calculating the stochastic turbulence factor that determines the gain of the signal at the detector.
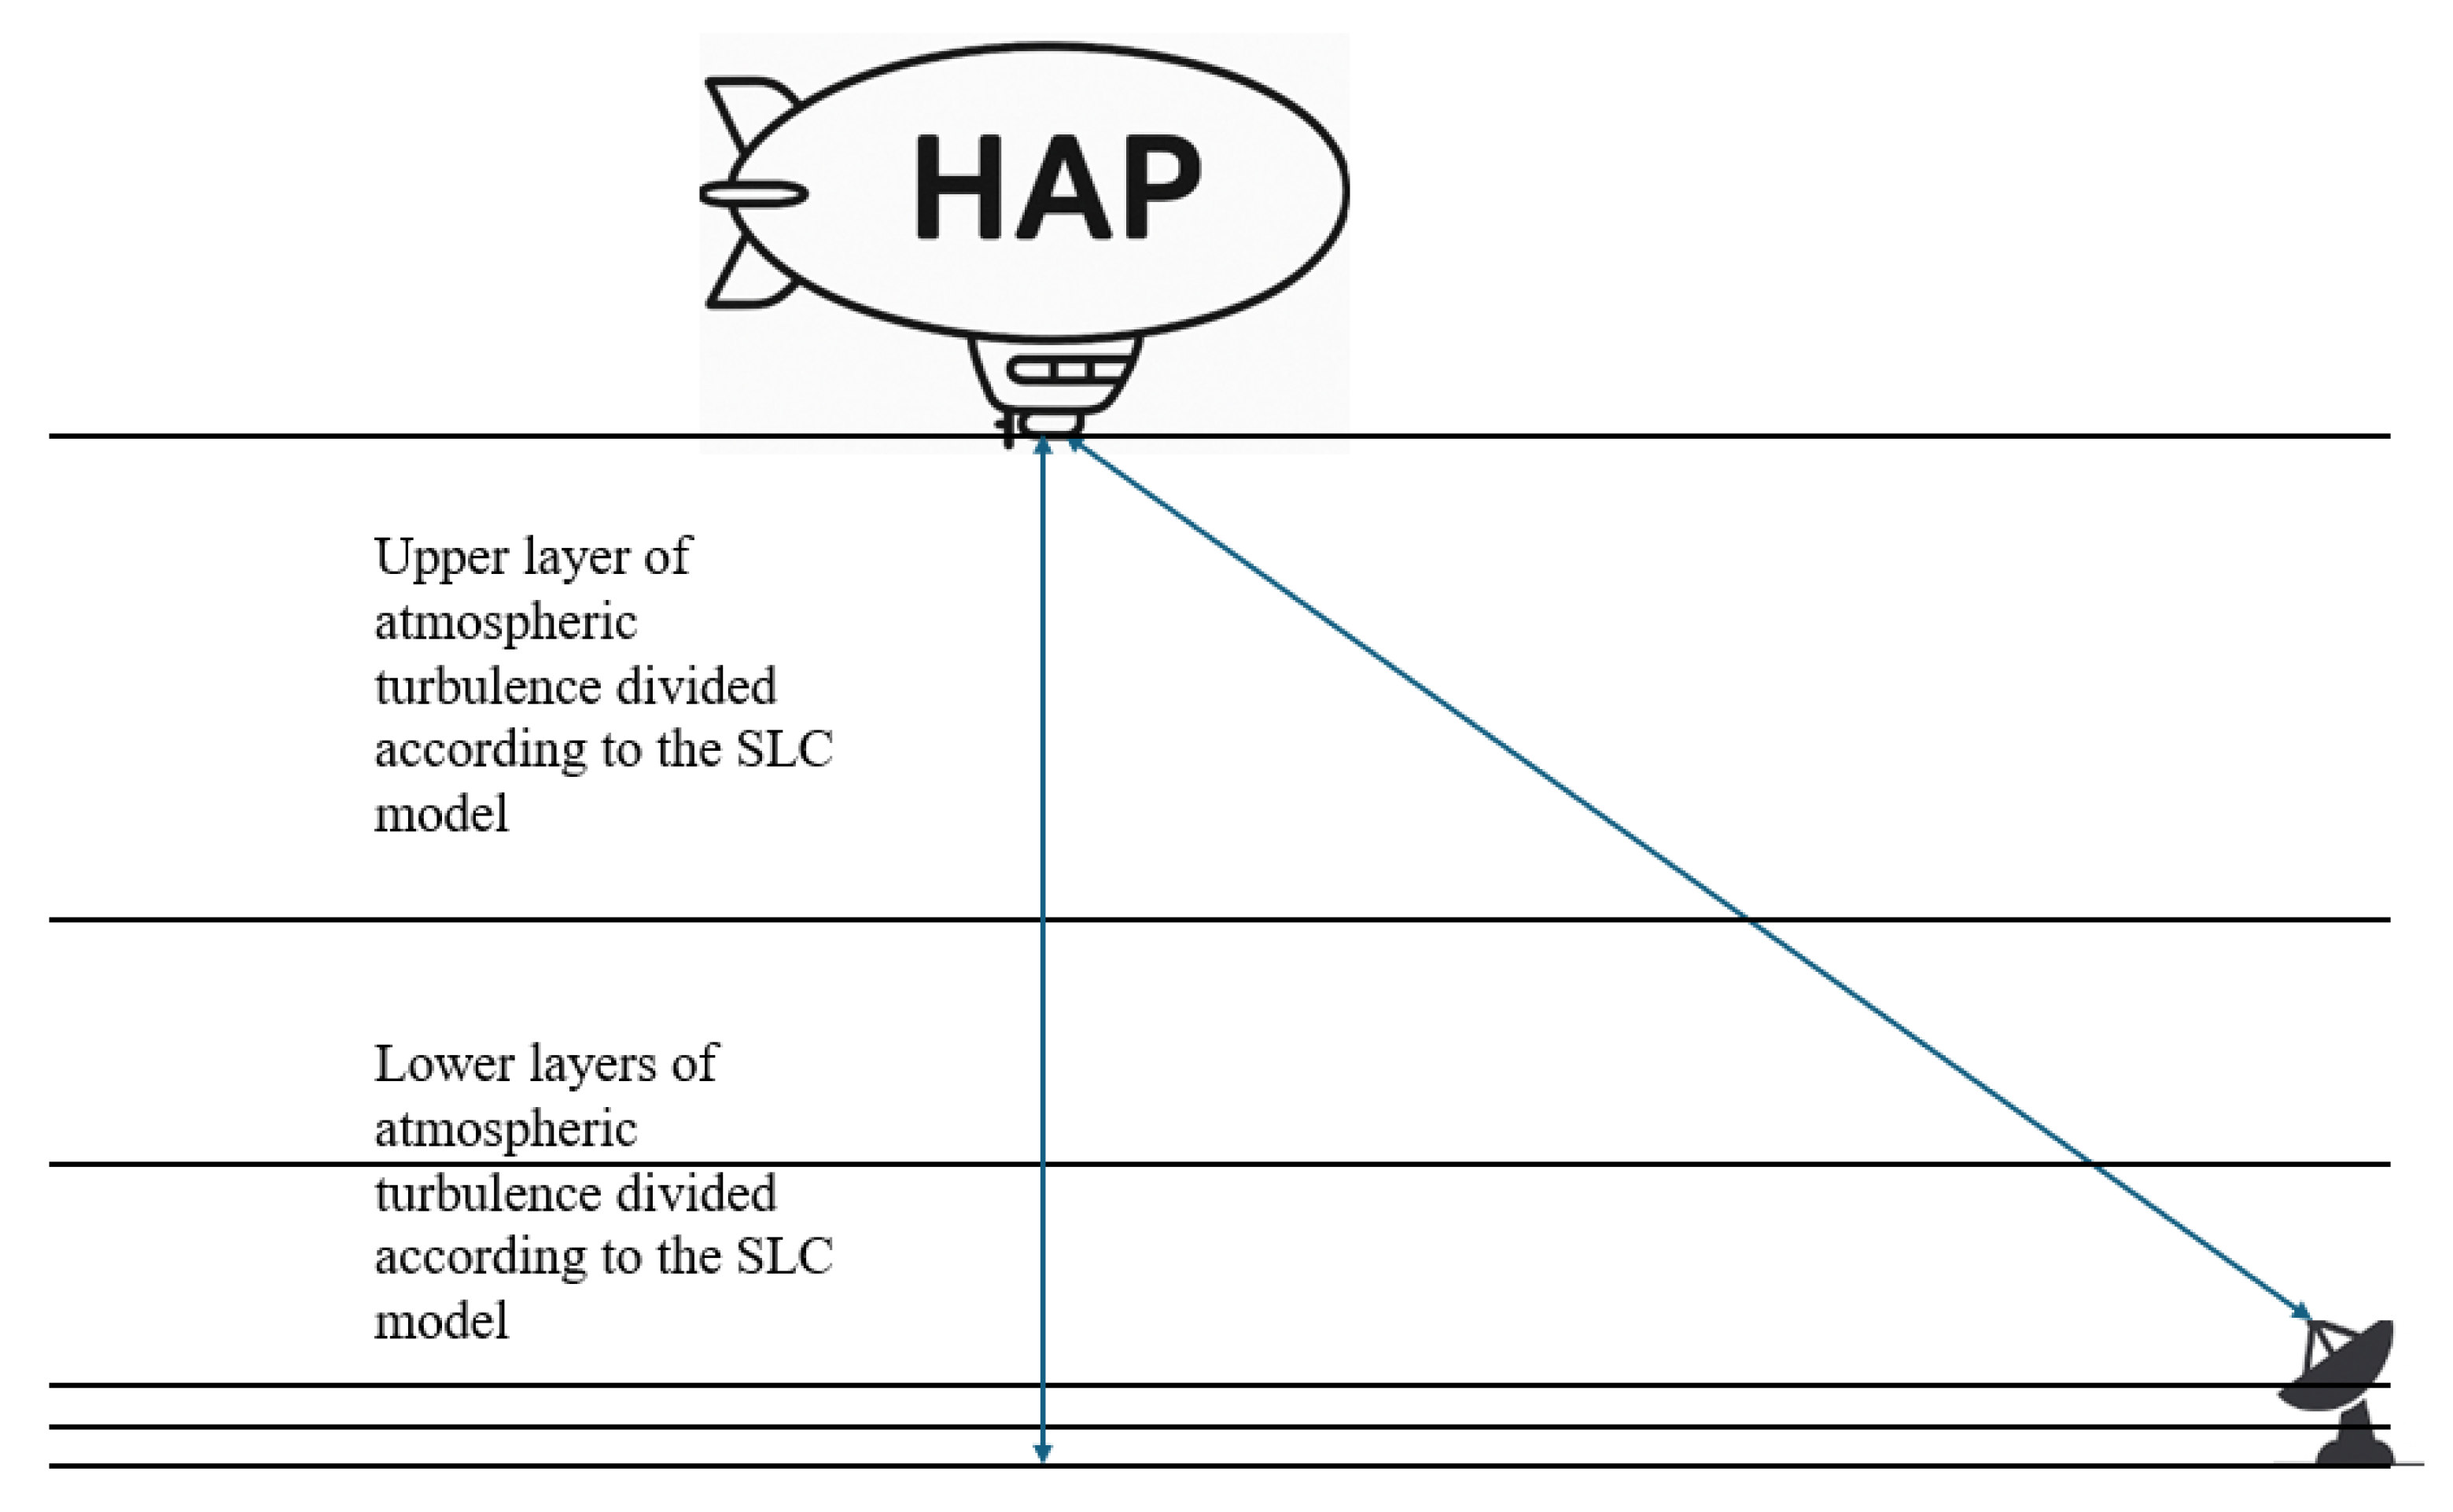
Consider the derivation of the stochastic factor h n i which characterizes the impact of atmospheric turbulence on the optical link between HAP i and ground node n. The atmosphere is divided into five layers (see Figure 5), each assigned a specific value of the turbulence strength C n 2 , calculated from Equations (12) and (13) using the appropriate mean height, depending on day and night conditions. Since the turbulence strength continuously varies with altitude, this discretization is necessary for practical computation, particularly under limited resources. The SLC models are used to define this stratification and to estimate C n 2 for each layer. The effect of each layer is modeled by drawing a random sample from the gamma–gamma distribution in a partial stochastic factor h n i . The total stochastic factor of optical link between HAP i and ground node n is obtained by multiplying these partial values:
h t o t a l = i = 1 5 h n i .
The five-layer approach adopted is considered adequate under normal atmospheric conditions.

4. Numerical Results

In this section, we present and analyze the numerical results derived from multiple simulation scenarios. Each simulation scenario corresponds to a distinct geographical distribution of ground nodes that are to be served by a network of HAPs. For each distribution of ground nodes, all feasible HAP networks are generated, minimum-cost topologies are identified, and their performance is evaluated in terms of the achieved throughput. Among the numerous simulation outcomes produced, we present only the most representative and insightful results. Unless otherwise specified, the values of the simulation parameters used in our numerical results are listed in Table 1.
Given a specific geographical distribution of ground nodes, the evaluation process follows these steps:
Step 1:
Four HAP network configurations are constructed, each with a different number of HAPs: the first network consists of four HAPs, the second of three, the third of two, and the last of a single HAP. In each case, the ground nodes are assigned to the HAPs that will serve them. The assignment is performed using the k-means clustering algorithm, an unsupervised learning method.
Step 2:
Networks that violate any of the constraints defined in this study (e.g., maximum link distance, number of sFSOs per HAP, etc.) are discarded.
Step 3:
For each remaining network, all feasible configurations, defined by the parameter sets α s , i , m i , β s , i , are examined, and only those with minimum cost are retained.
Step 4:
The minimum-cost configurations are then evaluated in terms of throughput under both day and night conditions.
Step 5:
Finally, the different networks are compared based on both cost and achieved throughput, for day and night scenarios.
In the figures depicting the geographical distribution (top view of the area), the following notation is used:
×:
The location of the HAP;
⃝ 
: The center of the distribution;
●:
The location of the ground node. Different colors indicate which HAP serves each node.
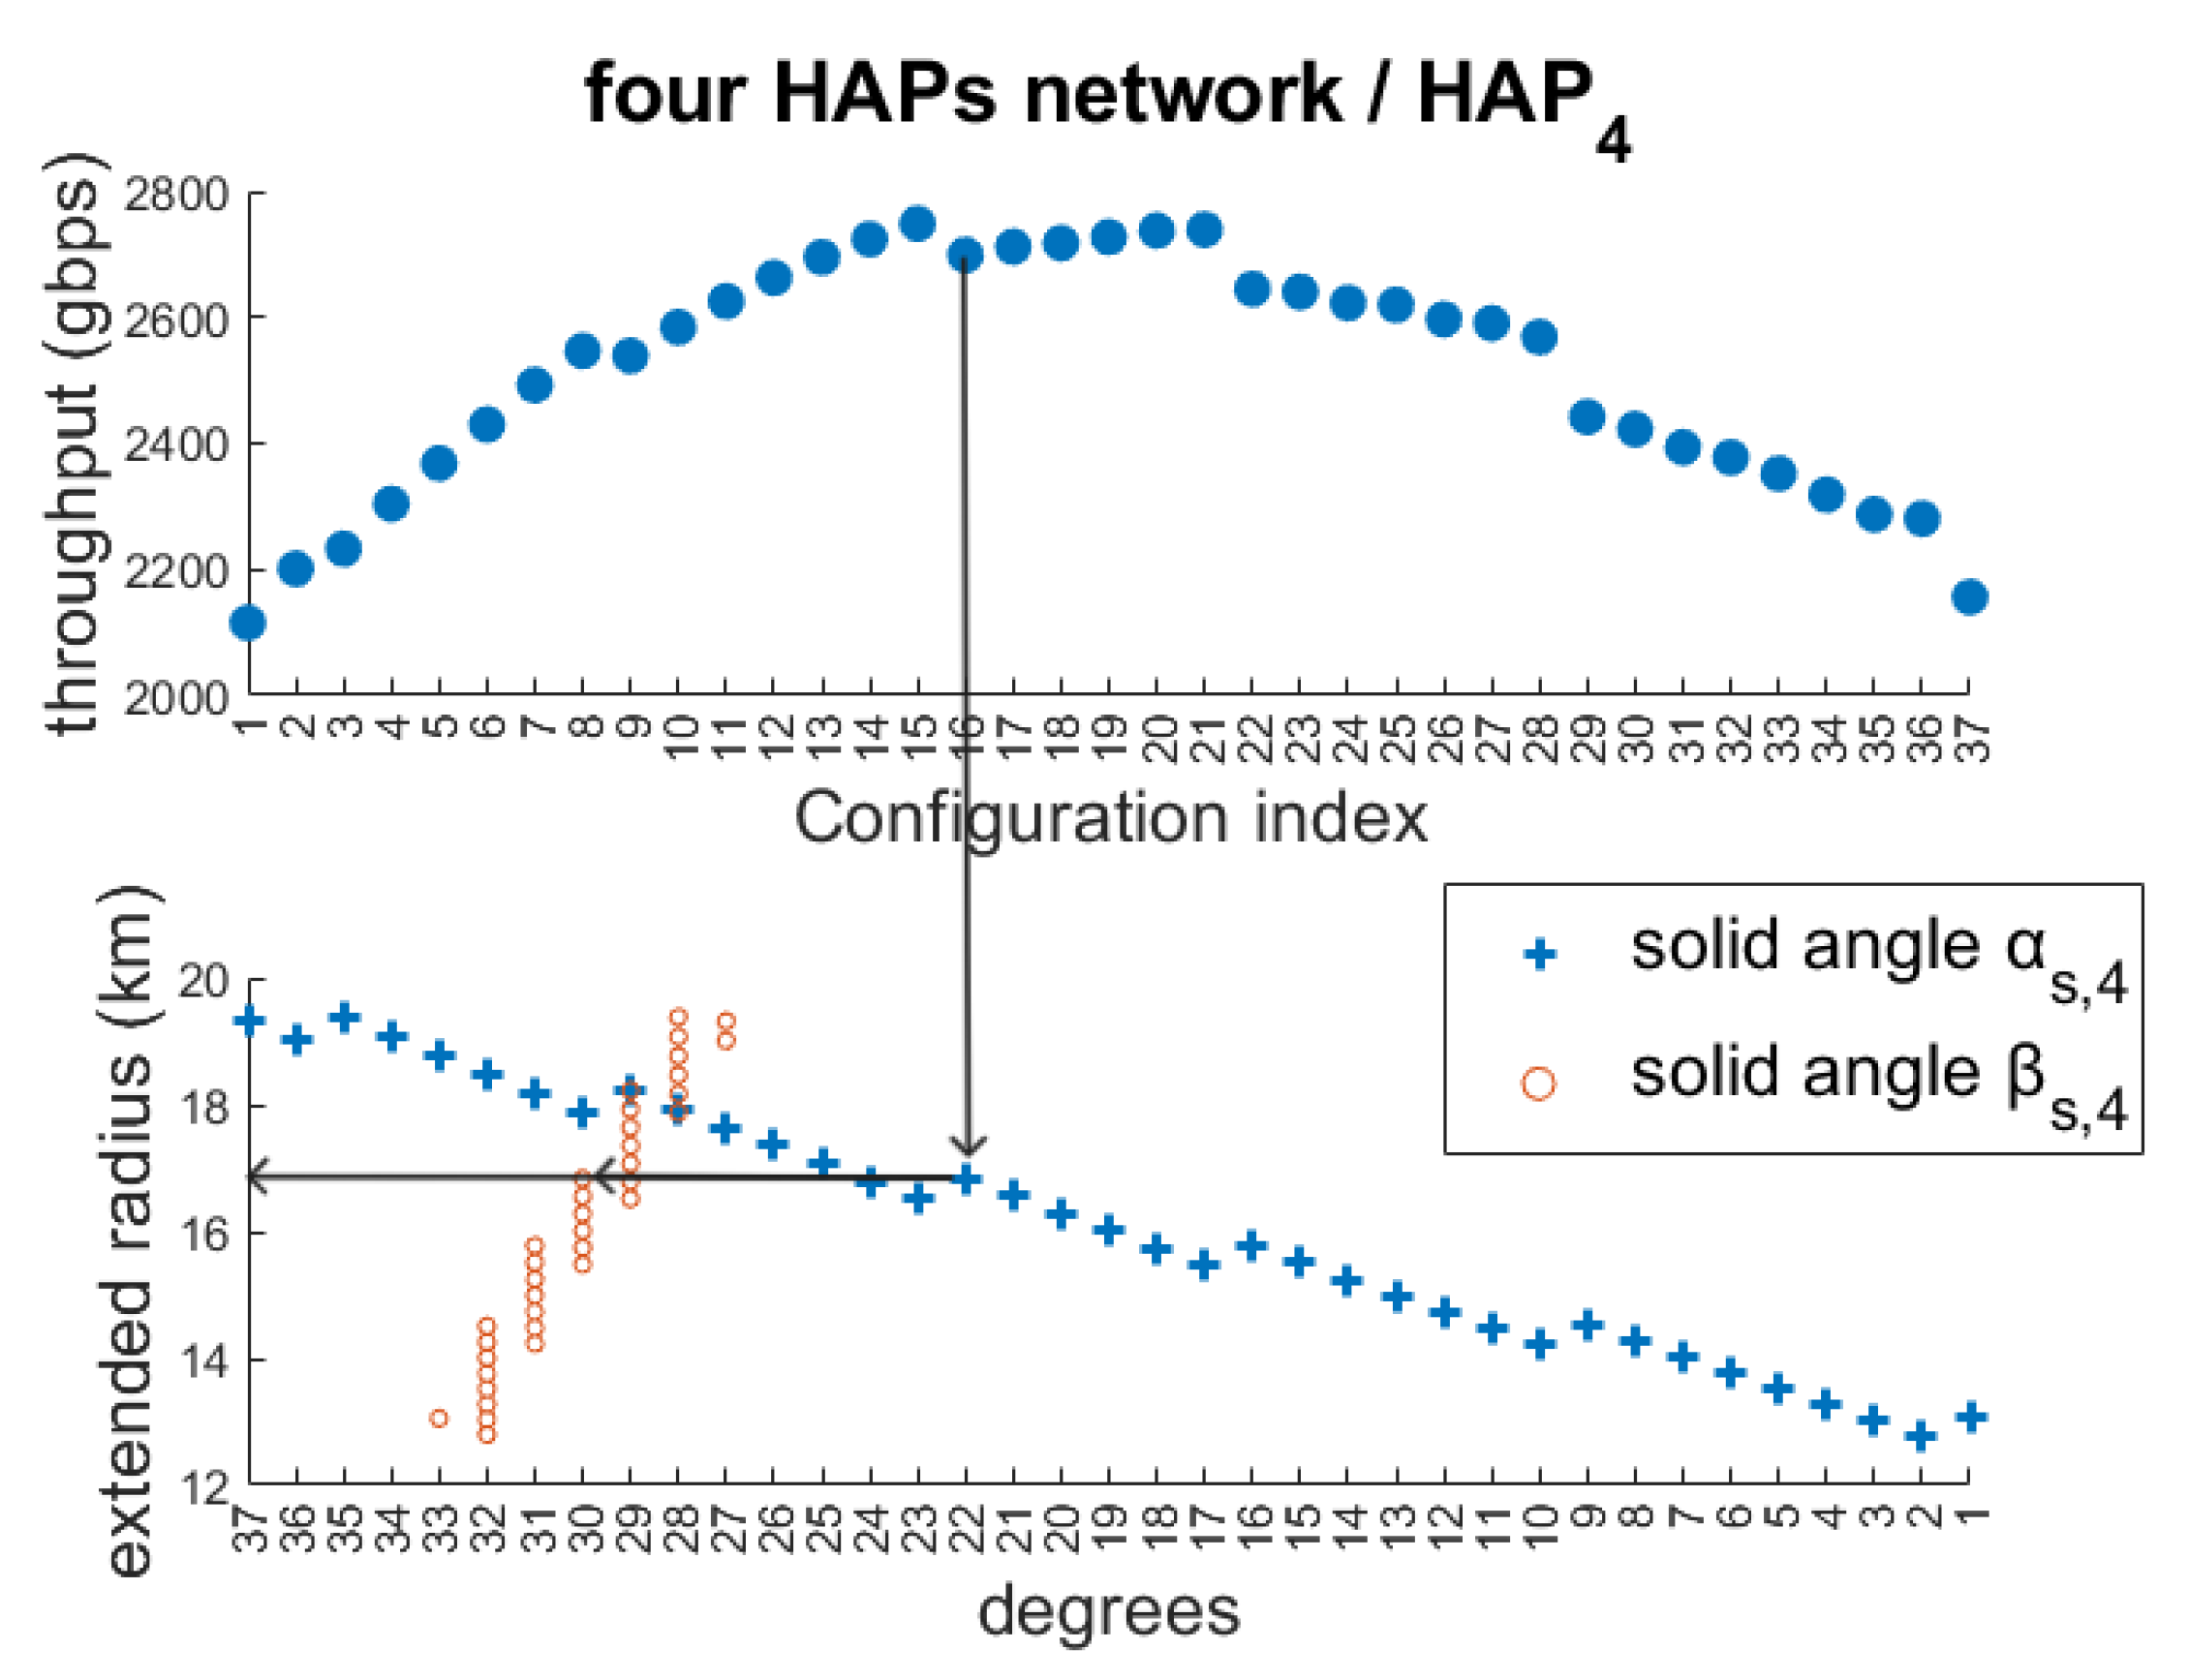
The lines within the distribution represent the boundaries of the coverage areas of the HAPs. Figure 6 presents a combined diagram consisting of two subplots. The upper graph shows the throughput in relation to the configuration index, while the lower graph correlates the extended service radius with the solid angles α s , i and β s , i . For example for configuration index 29, the throughput reaches approximately 2500 Gbps. By drawing a vertical line from this index downward, we observe that it intersects solid angle α s , 4 at 23°. Then, extending a horizontal (iso-radius) line from this point, it intersects solid angle β s , 4 at 30°, indicating an extended service radius of about 17  km. The number of sFSO links m 4 for all minimum-cost configurations of a single HAP remains constant and is specified in the corresponding tables that follow. Therefore, this diagram provides, for any given configuration index, the values of ( α s , i m i β s , i ), the service radius, and the throughput, enabling direct assessment of the optimal transmission configurations. This provides a practical method for visual oversight and rapid estimation of the variations in throughput and extended service radius resulting from changes in the solid angle configuration.

4.1. Urban-Centered Distribution

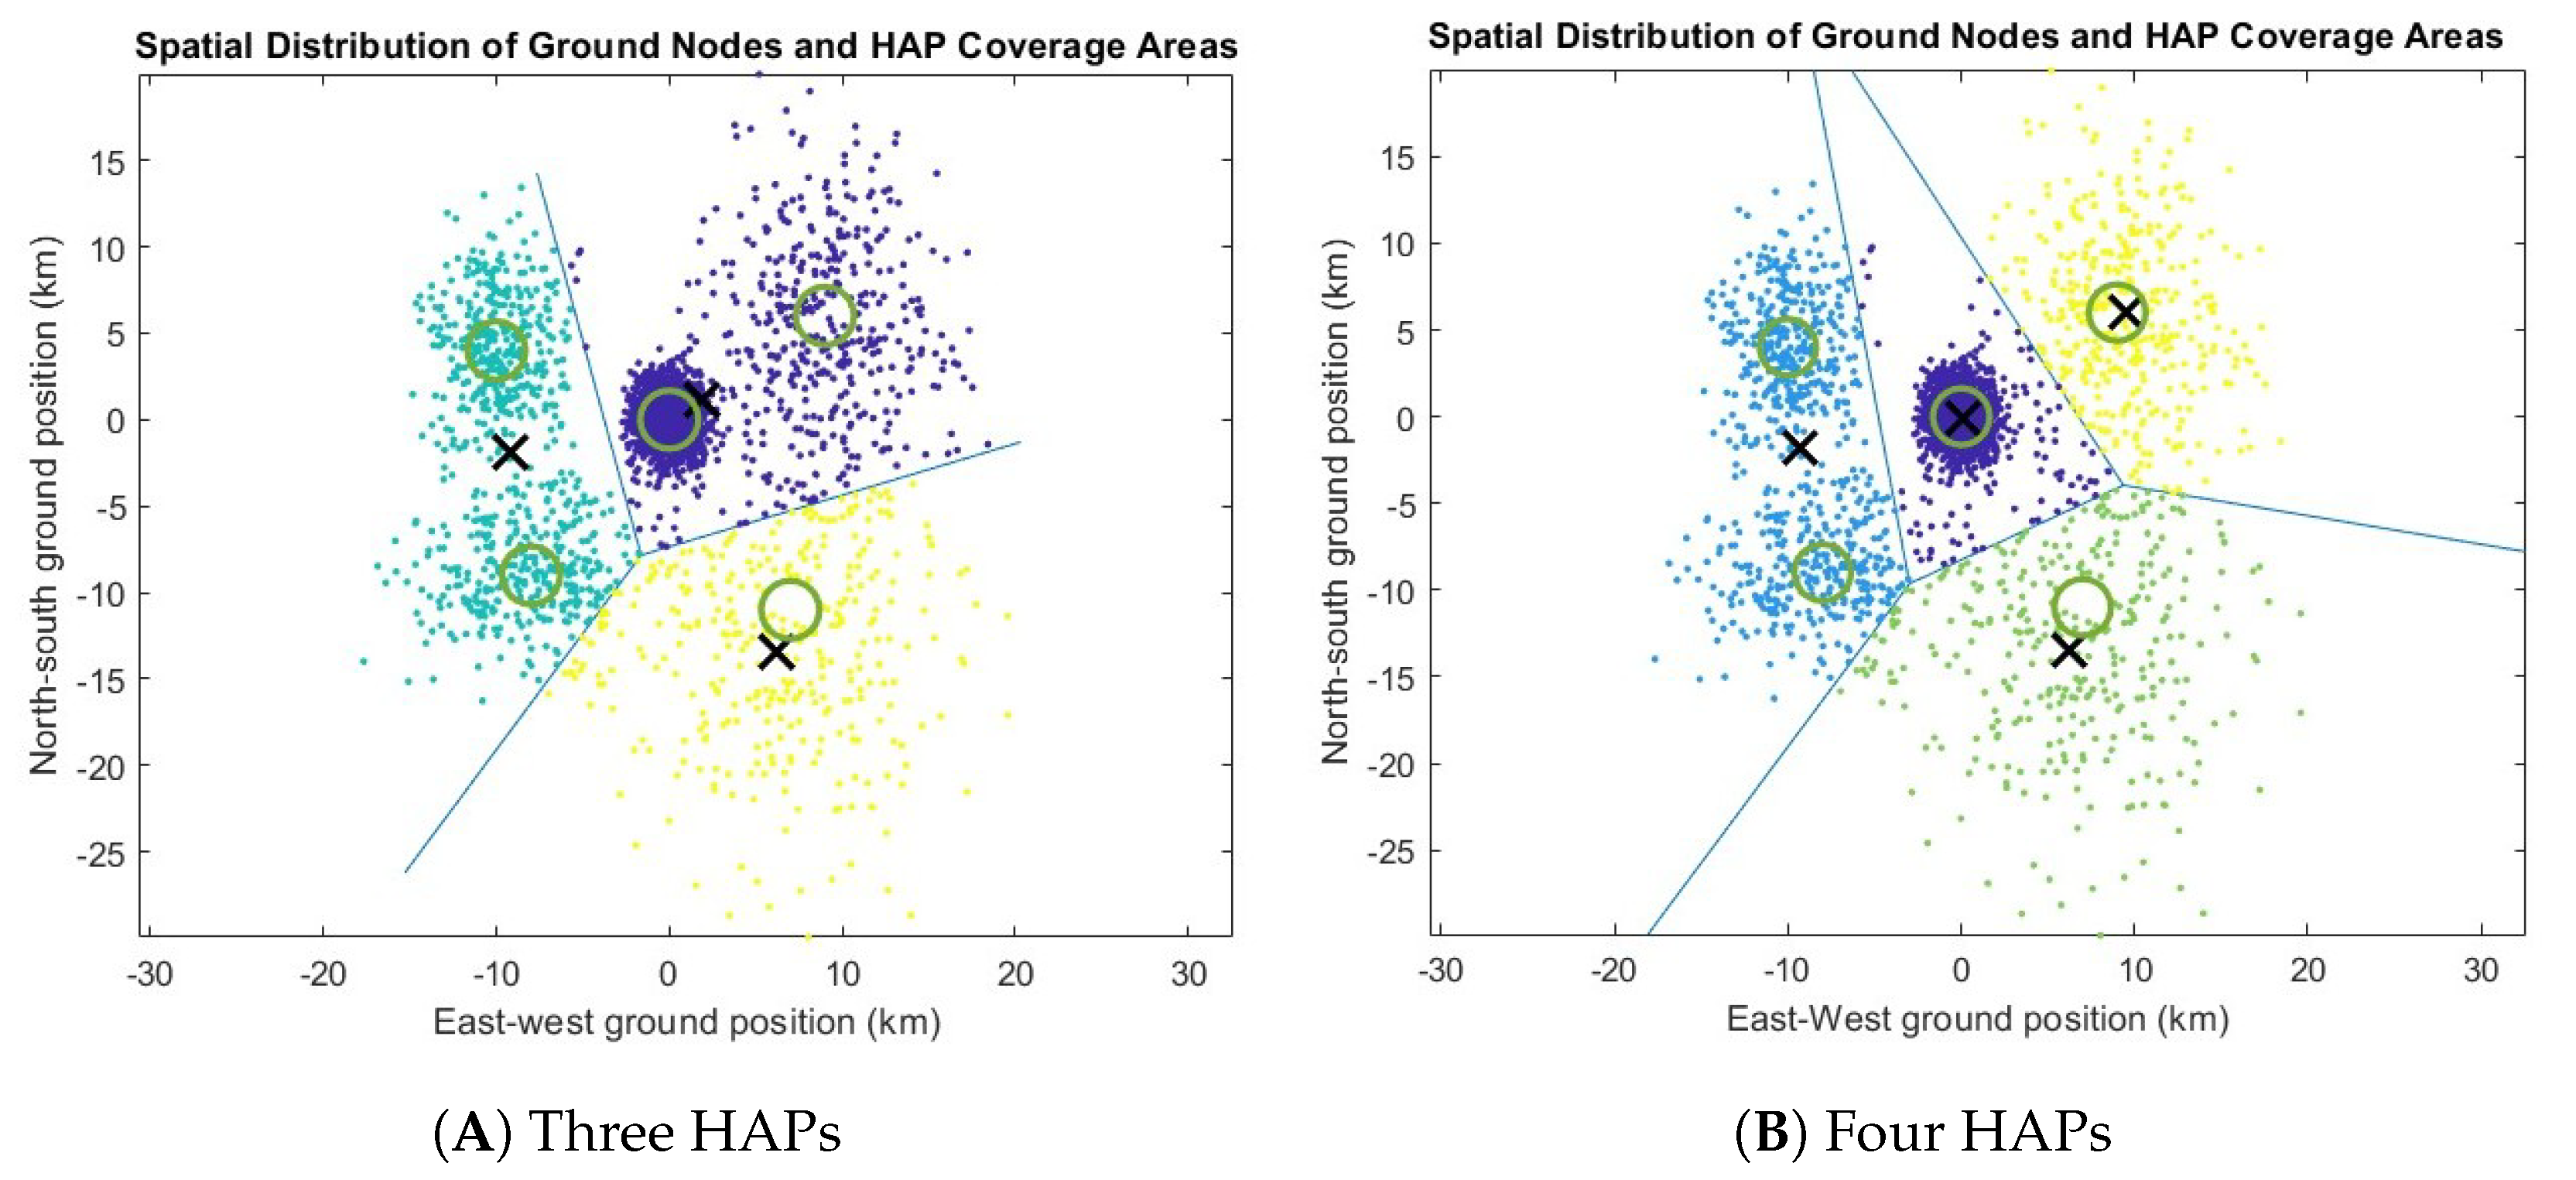
One of the evaluated cases, hereafter referred to as the “Urban-centered distribution”, employs a Gaussian random number generator to create a spatial distribution of ground nodes that consists of the superposition of five normal distributions. These distributions are centered and spread in such a way as to represent a dense urban core surrounded by four suburban regions. The urban core is located at the origin of the Cartesian coordinate system and is characterized by a higher density and smaller standard deviation compared to the suburban clusters. The exact values of the means and standard deviation used to generate the clusters are listed in Table 2. This spatial model was selected to reflect a realistic urban deployment, where population density is highest in the city center and gradually decreases toward the suburbs. This simulation is conducted for both day and night conditions, and the total number of ground nodes is set to N G , N = 2898 . Figure 7 illustrates how the ground nodes are assigned to their corresponding HAP, (clustering), and how the respective areas are divided using the k-means algorithm. It is noted that, under the current procedure, no feasible networks with one or two HAPs were found that satisfy the technical and physical constraints.
Table 3 and Table 4 provide data that apply to all values of α s , i and β s , i of the minimum-cost configurations. The parameters that remain unchanged, as long as the network consists of the same number of HAPs, are the operating cost per HAP and the number of supplementary sFSOs carried by each HAP, regardless of the minimum cost configuration.
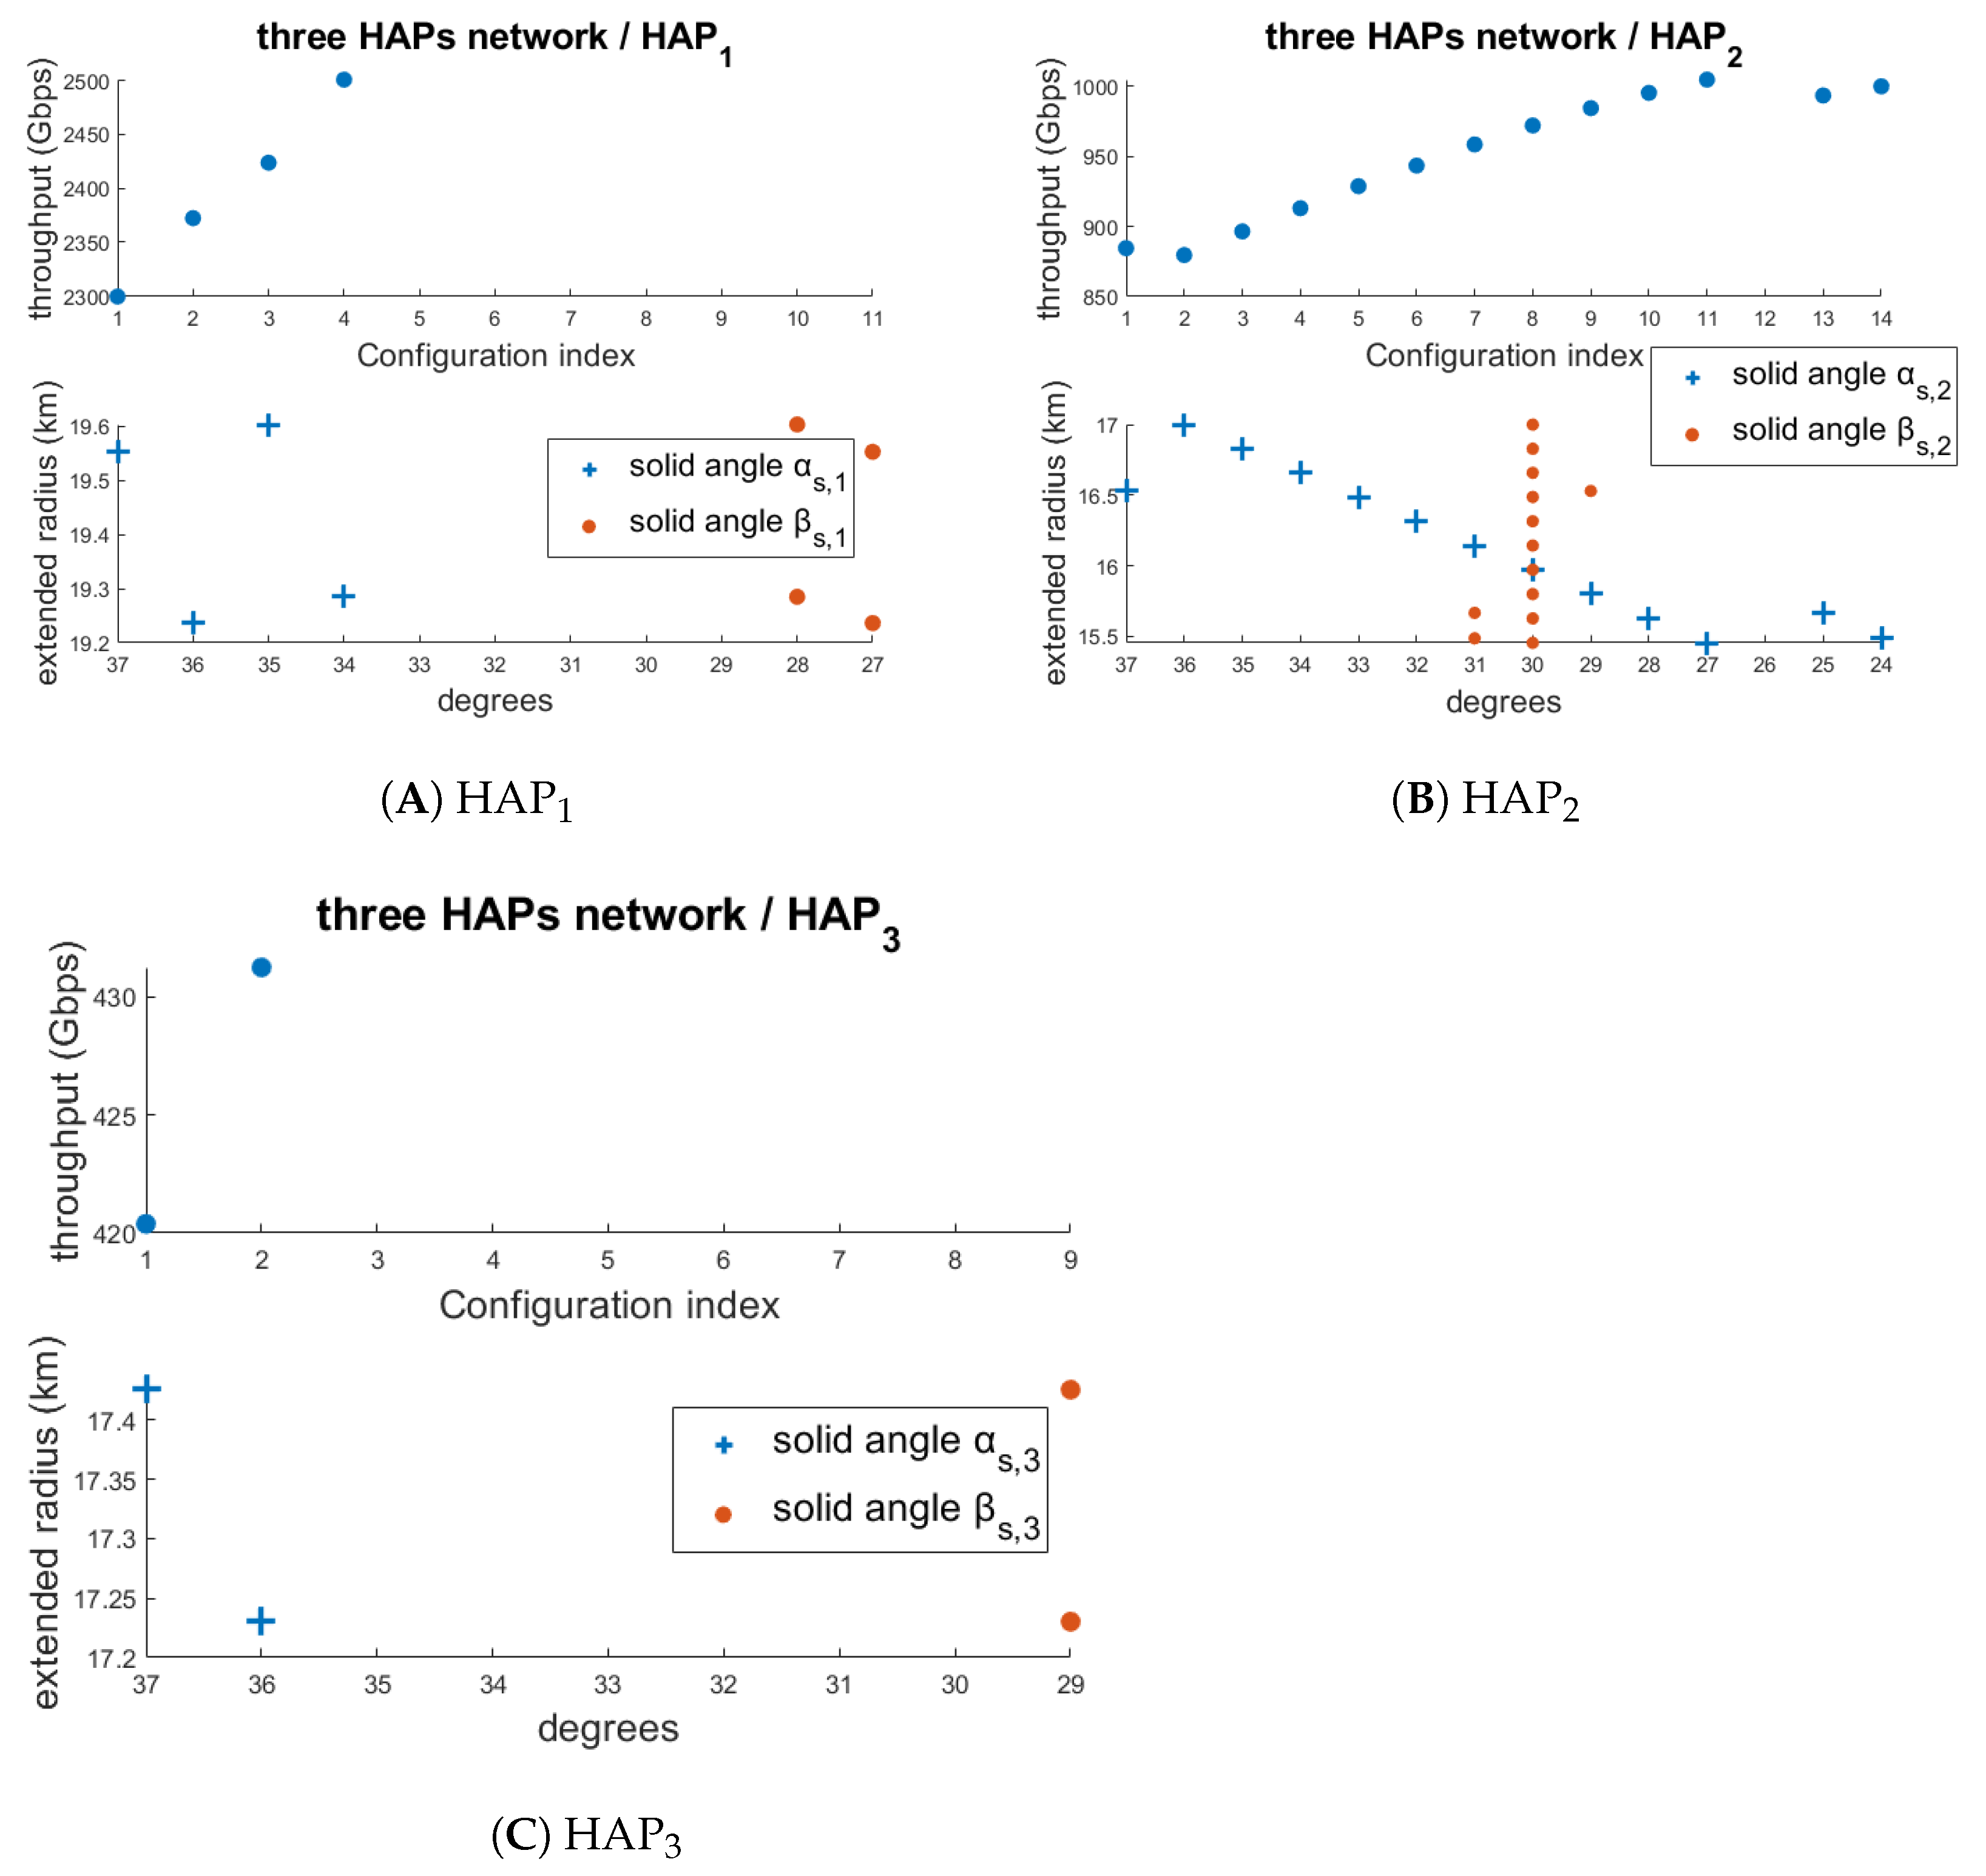
Figure 8 shows that, theoretically, the network consisting of three HAPs can operate under 104 different combinations of configurations, assuming independent operation of each HAP. The choice of configuration for each HAP affects key performance parameters, namely the extended radius R s e r v and the throughput.
Table 5 presents the parameters of the optimal configuration for each HAP in terms of throughput for the network consisting of three HAPs.
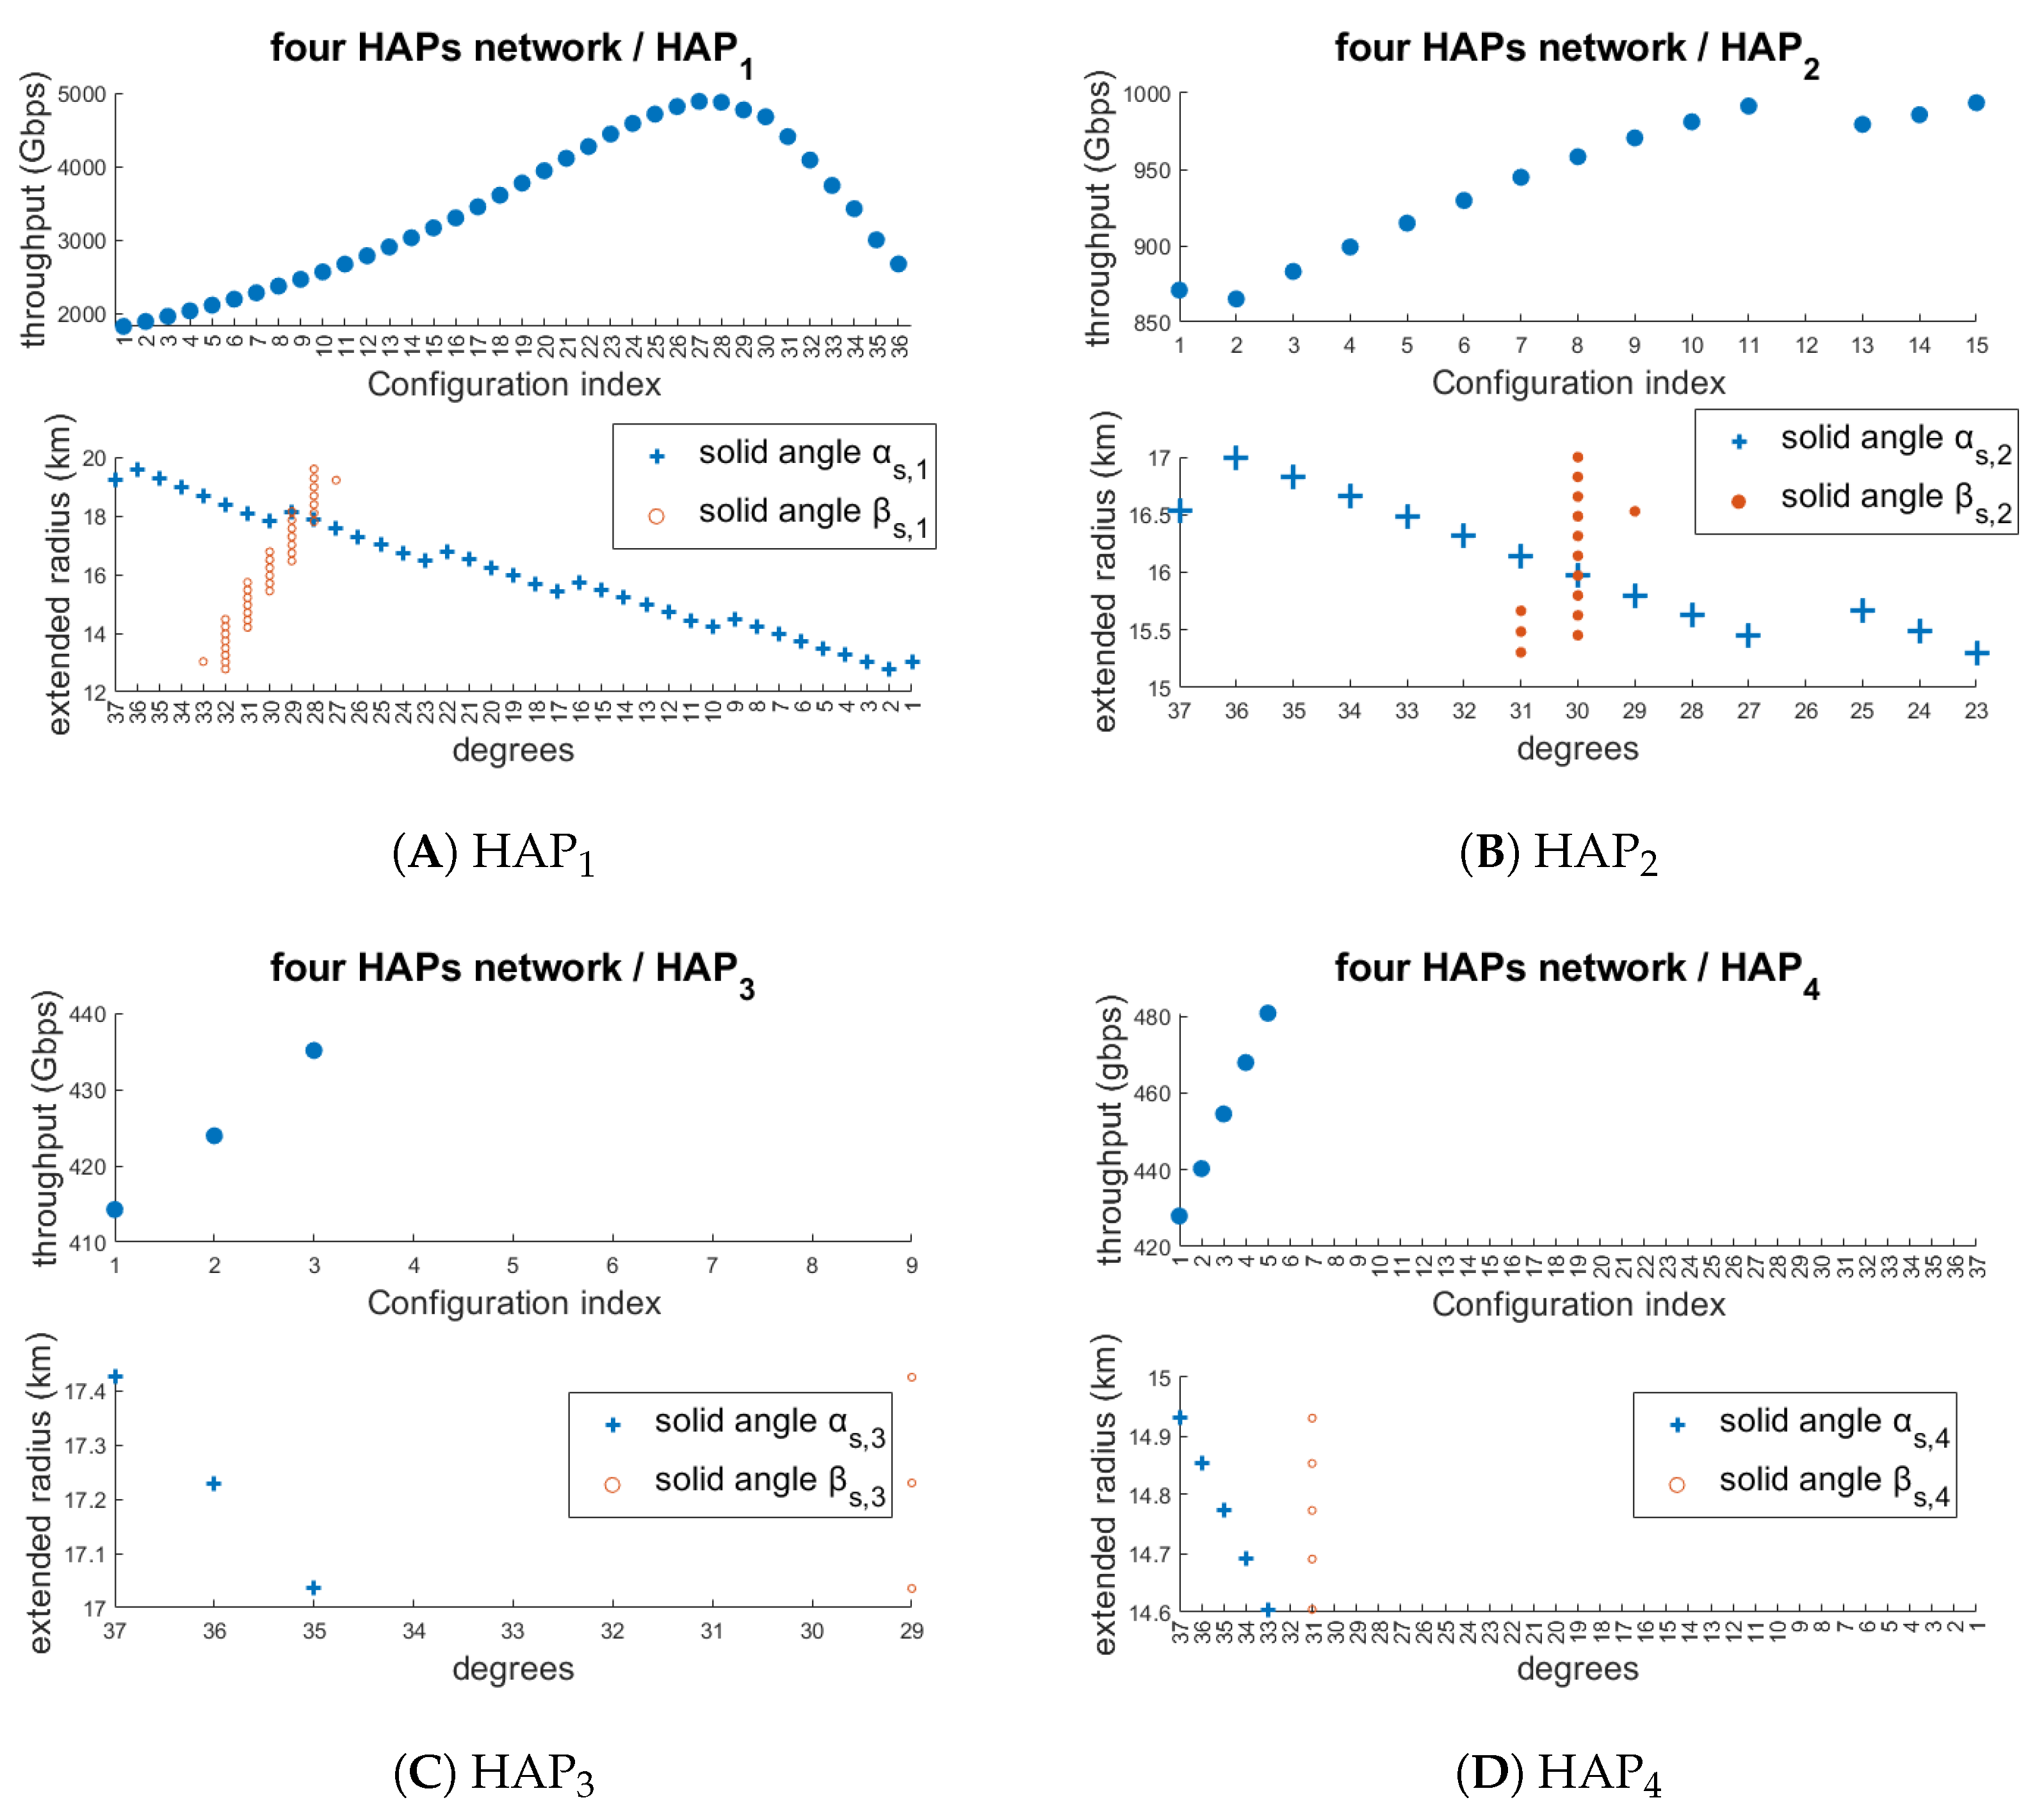
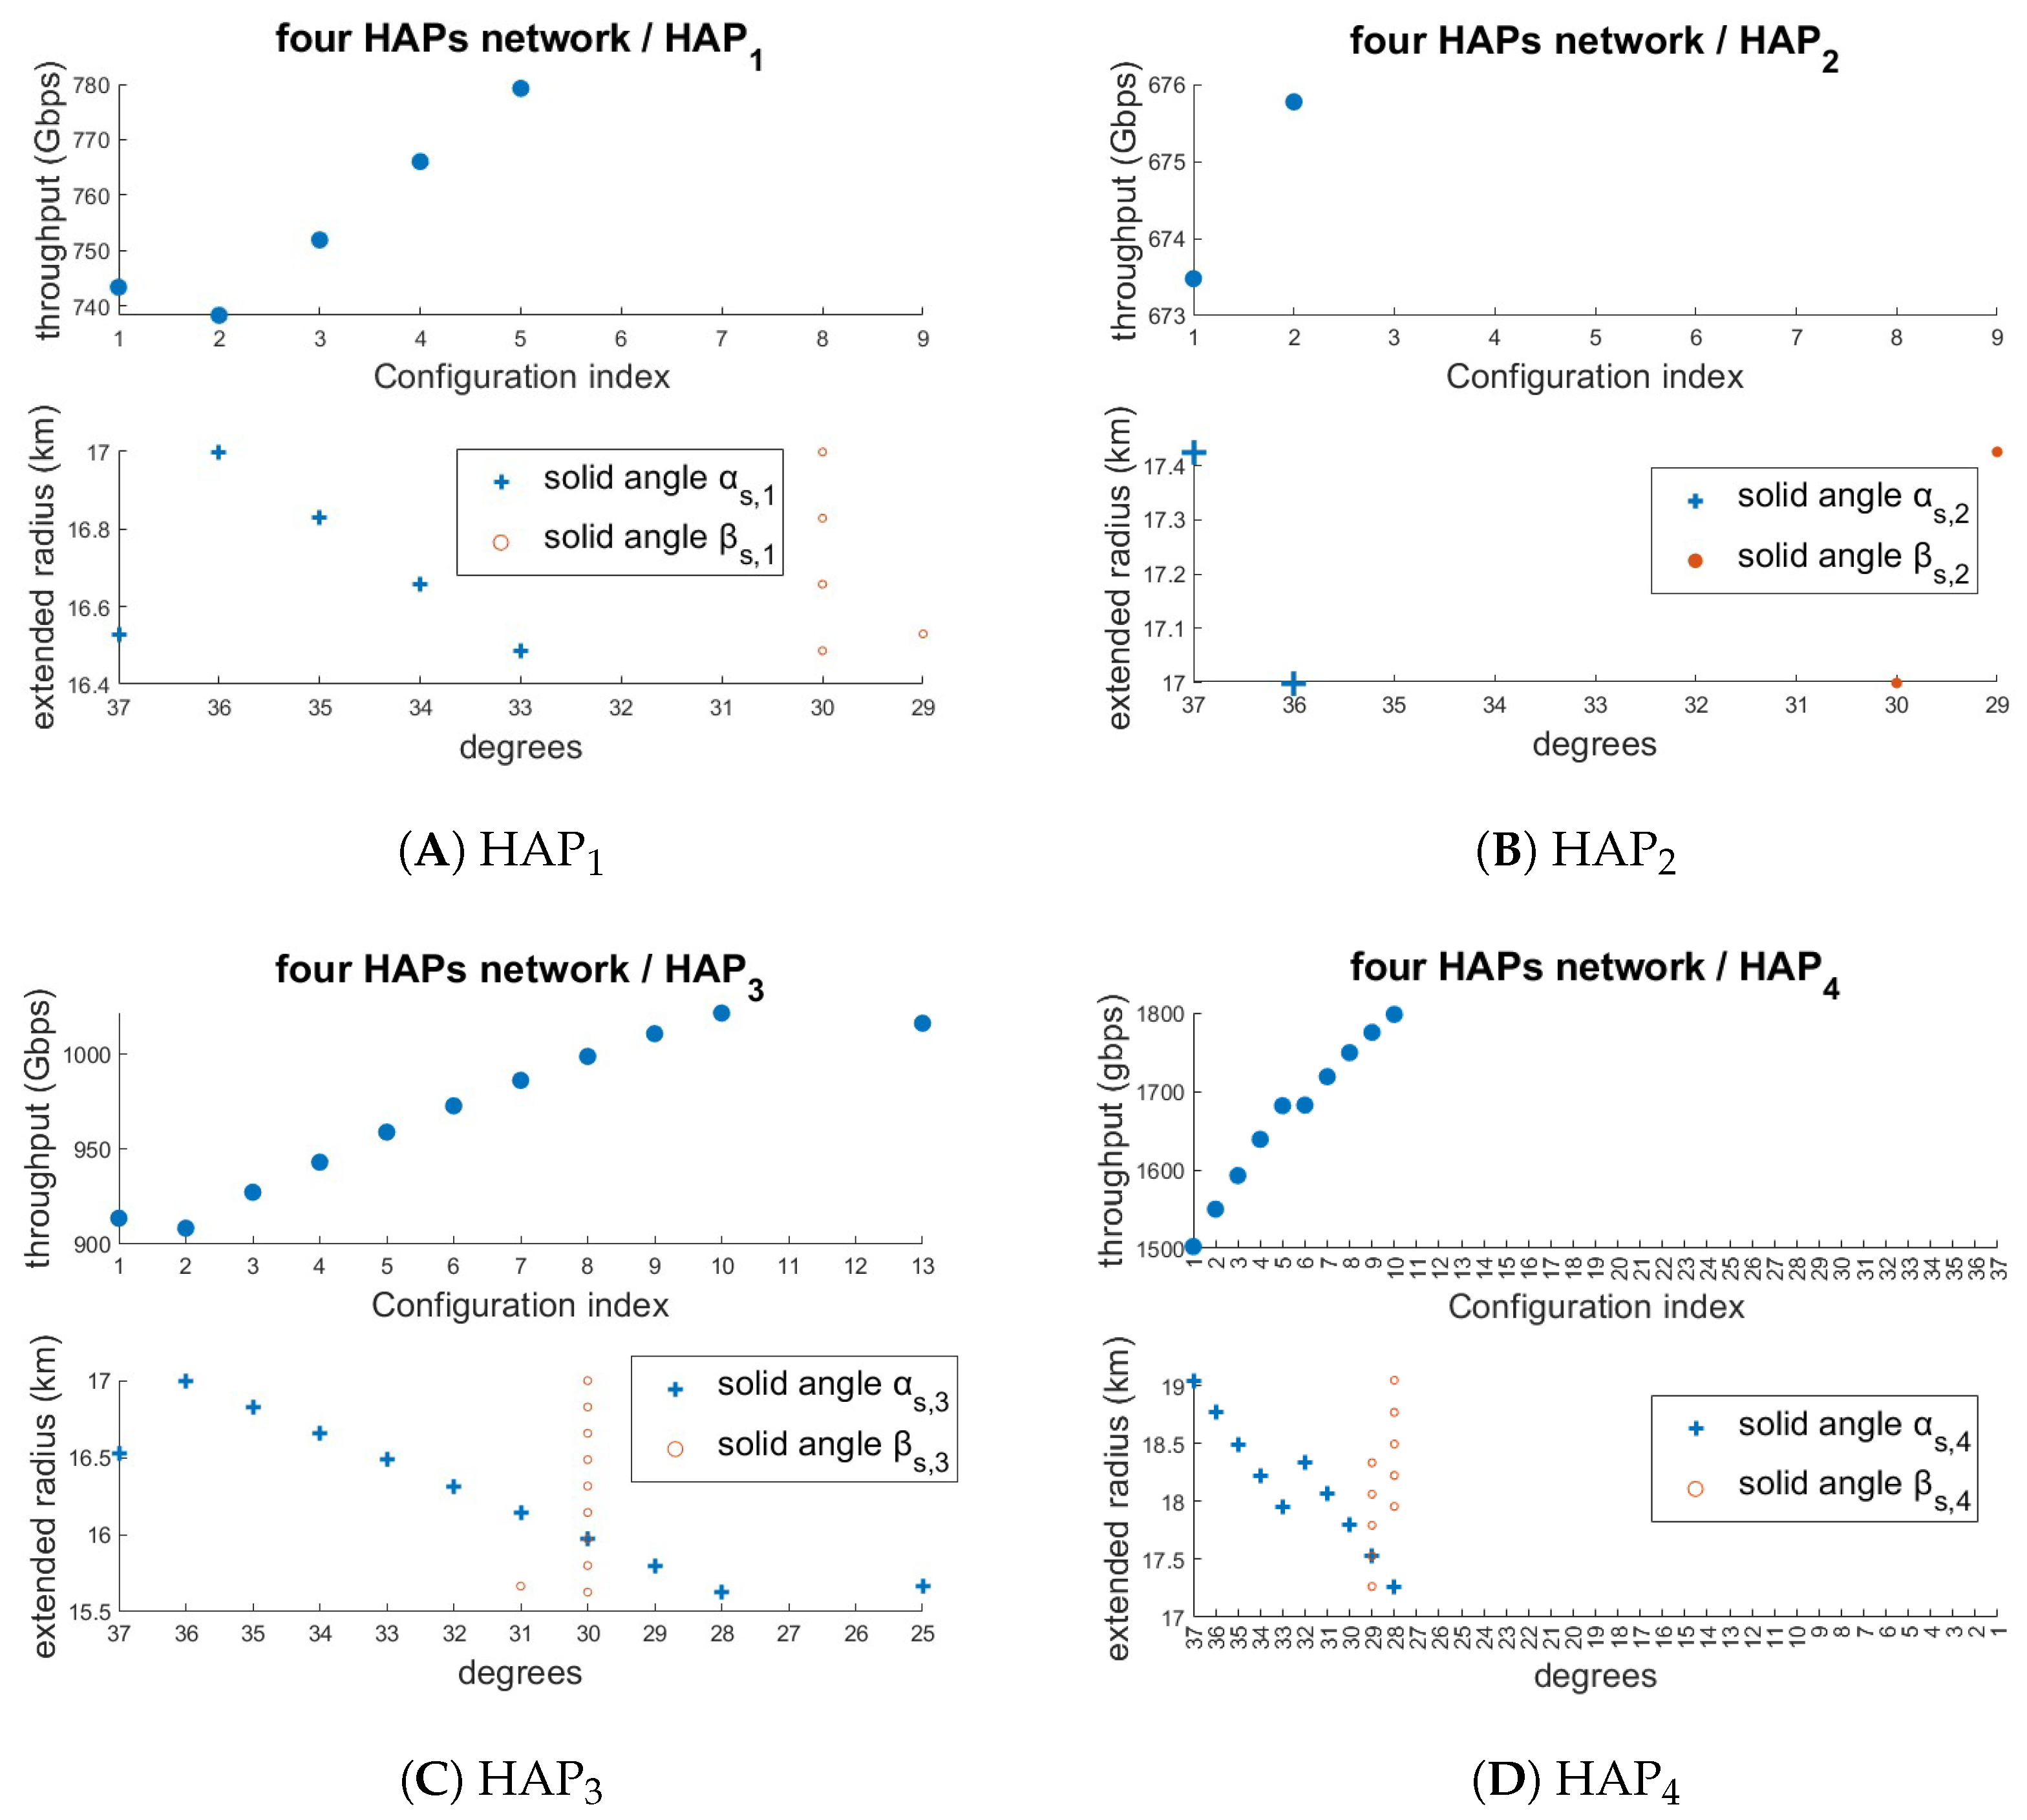
In Figure 9, we observe that each HAP has a different number of functional configurations with minimum cost. The network consisting of four HAPs can theoretically operate with 7770 combinations of different configurations, assuming that each HAP functions independently of the others. The parameters affected by the configuration selected for each HAP are the extended radius R s e r v and the throughput. The same figure also shows that the configuration choice significantly impacts these parameters, as the variation in service radius can reach up to 80%, while the variation in throughput ranges from 5% to 250% per HAP.
Table 6 lists the configurations corresponding to the maximum achievable throughput. As such, it reveals the specific combination of per-HAP configurations that optimizes the network’s overall throughput performance. The four-HAP network incurs a 14.9% higher cost compared to the three-HAP network, while offering a 72.6% increase in throughput during the morning hours. Moreover, the total number of configuration combinations decreases significantly when reducing the number of HAPs from four to three.
During nighttime conditions, the overall shape and structure of the previously presented plots remain unchanged. However, a significant increase in throughput is observed across all cases. This improvement is almost exclusively due to the substantial reduction in background noise power during night compared to daytime conditions. The reduction in turbulence strength observed during nighttime contributes only marginally to the increase in throughput compared to the morning hours.

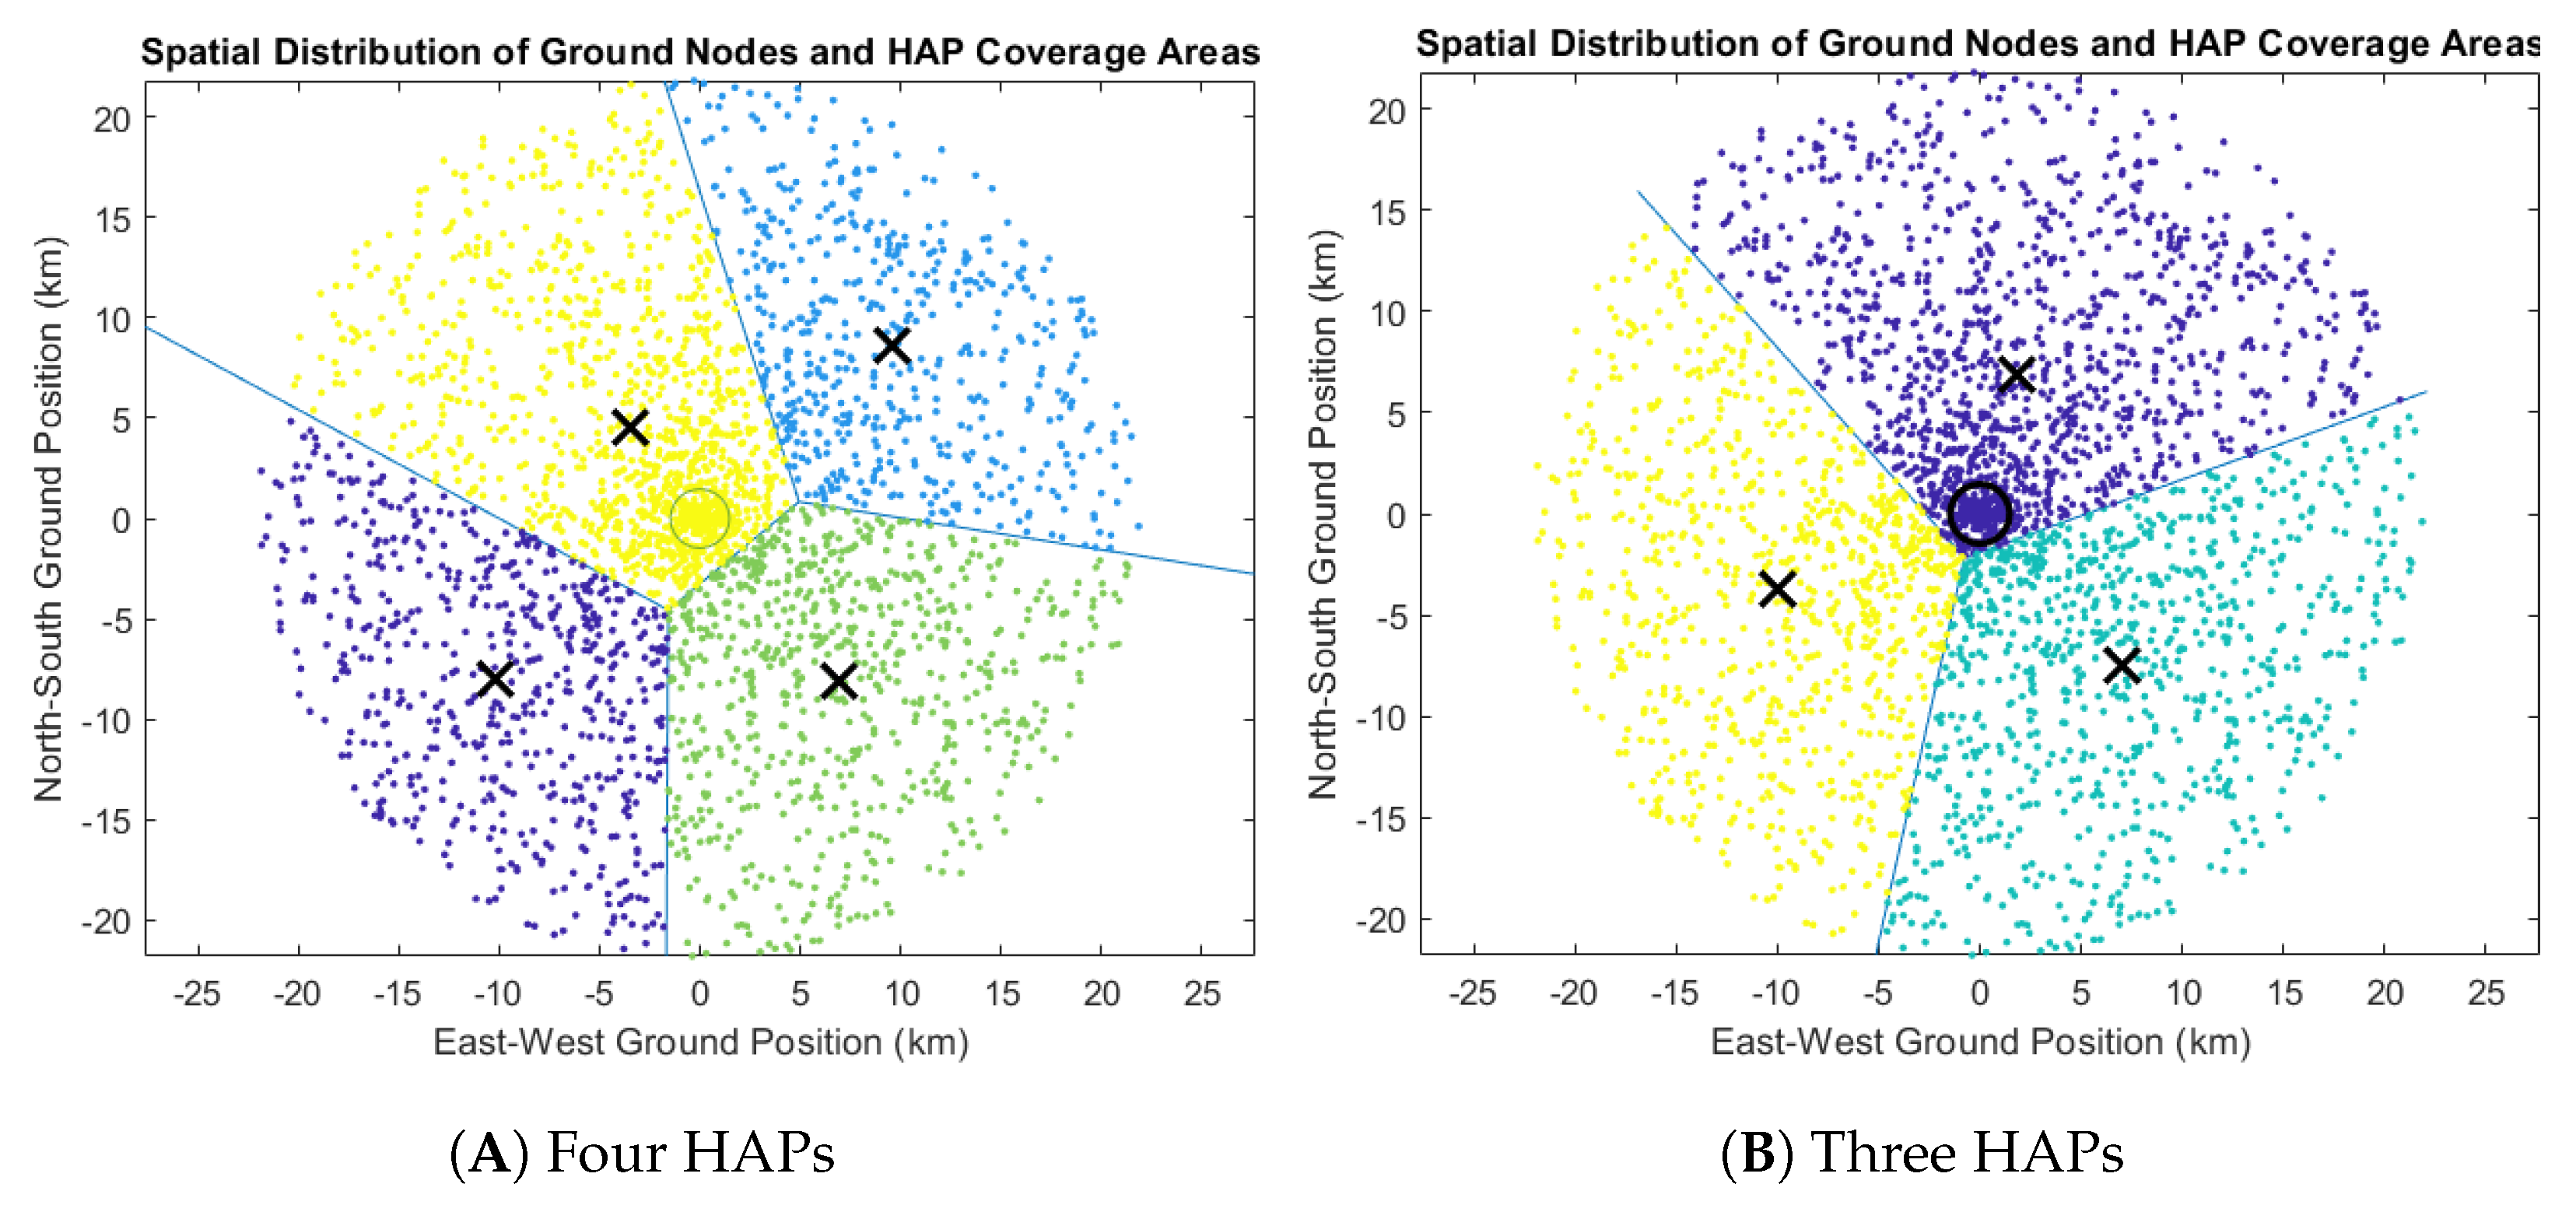
4.2. Uniform Distribution of Ground Nodes in a Circular Area

In this scenario, the ground nodes are uniformly distributed within a circular area of radius R = 22  km, resulting in a total coverage area of 1520.5  km2. The total number of ground nodes is set to N G , N = 3000 , and the center of the circular region is placed at the origin of the Cartesian coordinate system, i.e., at coordinates (0, 0). Using the proposed HAP network generation procedure, feasible configurations that satisfy the imposed technical and physical constraints were identified for cases involving three and four HAPs. The simulation was conducted under both day and night conditions. This scenario serves as a baseline case, representing a spatially homogeneous deployment with neither preferential clustering nor population hotspots. As such, it allows for benchmarking the performance of the HAP network under uniform traffic distribution and provides a useful comparison point against more complex non-uniform scenarios such as the urban-centered distribution. Evaluating the network behavior under uniform conditions offers valuable insight into the scalability and robustness of the proposed methodology. Figure 10 illustrates the assignment of the ground nodes to the corresponding HAP (clustering) and the partitioning of the respective service areas using the k-means algorithm. It should be noted that, under the current procedure, no feasible networks with one or two HAPs were found that satisfied the technical and physical constraints.
Table 7 and Table 8 provide data that apply to all values of α s , i and β s , i of the minimum-cost configurations. The parameters that remain unchanged, as long as the network consists of the same number of HAPs, are the operating cost per HAP and the number of supplementary sFSOs carried by each HAP, regardless of the minimum cost configuration.
From Figure 11, we observe that the network consisting of three HAPs can theoretically operate with only two different configuration combinations, assuming that each HAP functions independently of the others. The parameters affected by the configuration selected for each HAP are the service radius R s e r v and the throughput. This indicates that, for the given ground node distribution, the three-HAP network operates very close to the limits imposed by the technical and physical constraints. Therefore, based solely on this information, one could predict that deploying a network with fewer than three HAPs would be highly unlikely.
Table 9 presents the parameters of the optimal configuration for each HAP in terms of throughput for the network consisting of three HAPs. It is noted that the constraint of 37 degrees arises from the minimum radiation flux required at a ground node in order to reliably detect the signal.
Figure 12 shows that the network consisting of four HAPs can theoretically operate with 1100 different configuration combinations, assuming that each HAP functions independently of the others. The parameters affected by the configuration selected for each HAP are the service radius and the throughput. Table 10 presents the parameters of the optimal configuration for each HAP in terms of throughput for the network consisting of four HAPs.
During daytime hours, the four-HAP network shows a 4.9% higher cost and a 6.2% higher throughput compared to the three-HAP network.

4.3. Uniform Distribution of Ground Nodes in a Square Area

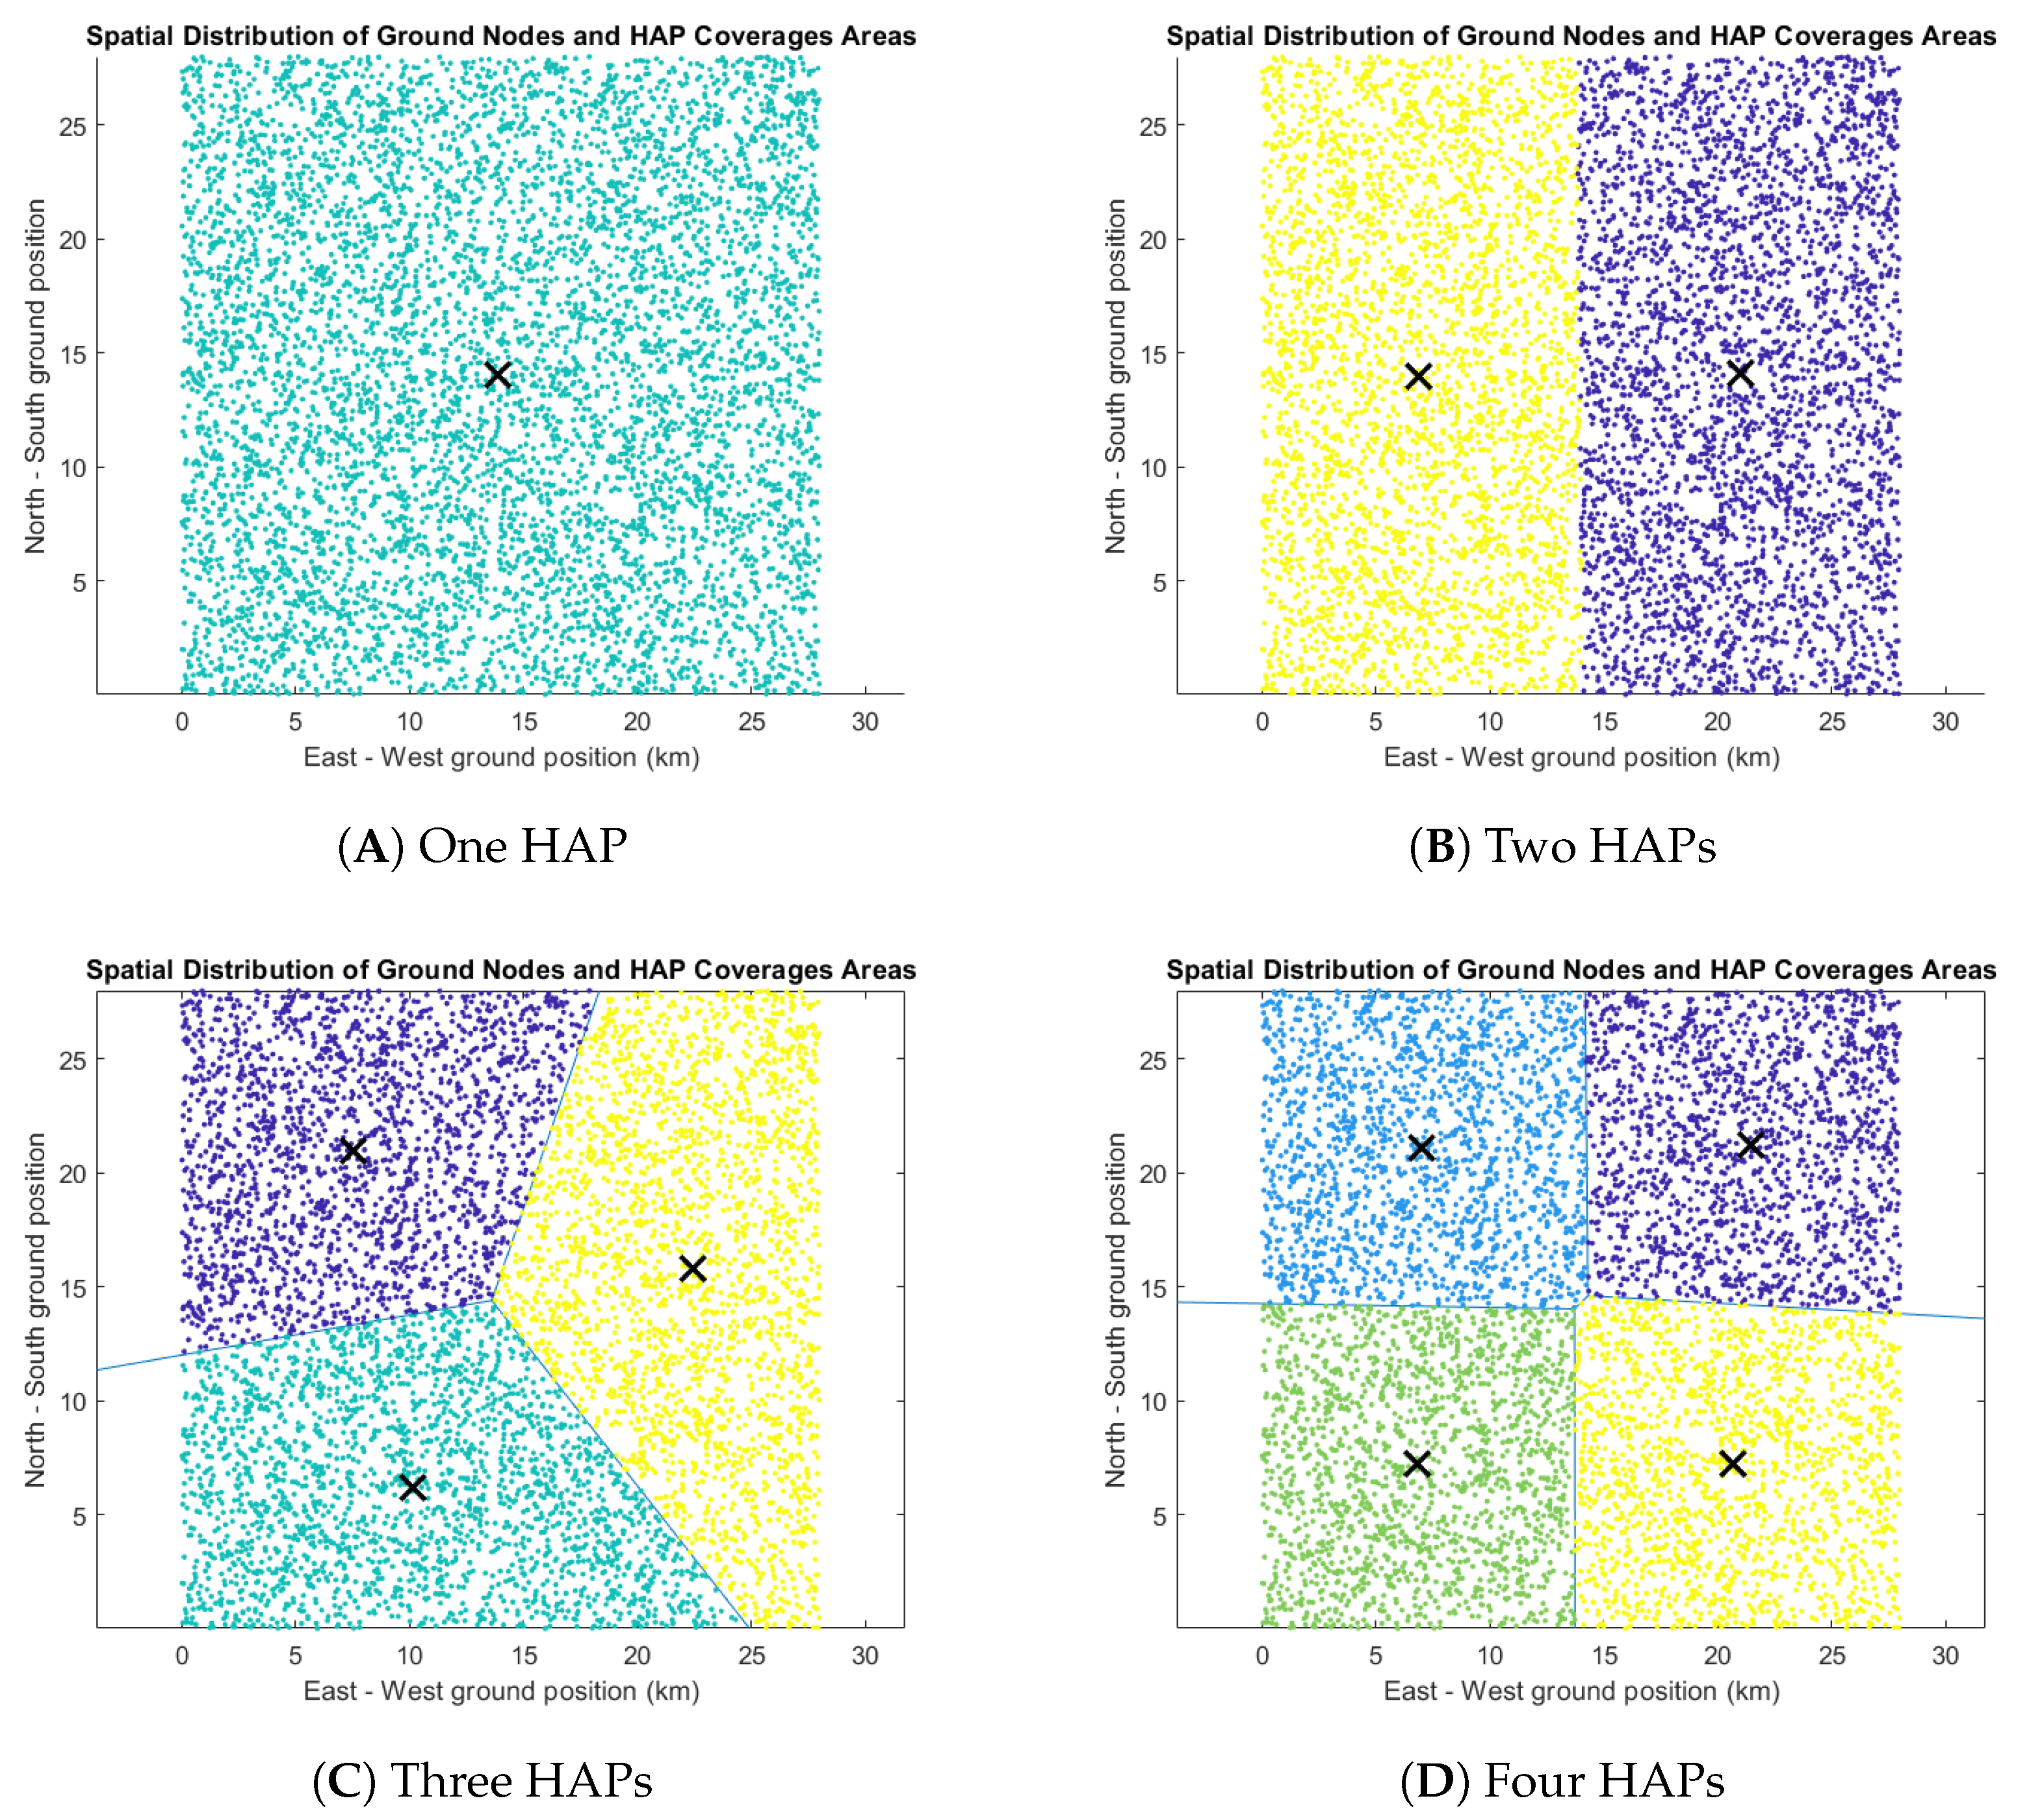
In this scenario, 6500 ground nodes are uniformly distributed within a square region of side length 28 km. Figure 13 illustrates the clustering and the positions of the HAPs for each network. Table 11, Table 12 and Table 13 provide data that hold for all values of α s , i and β s , i in the minimum cost configurations.
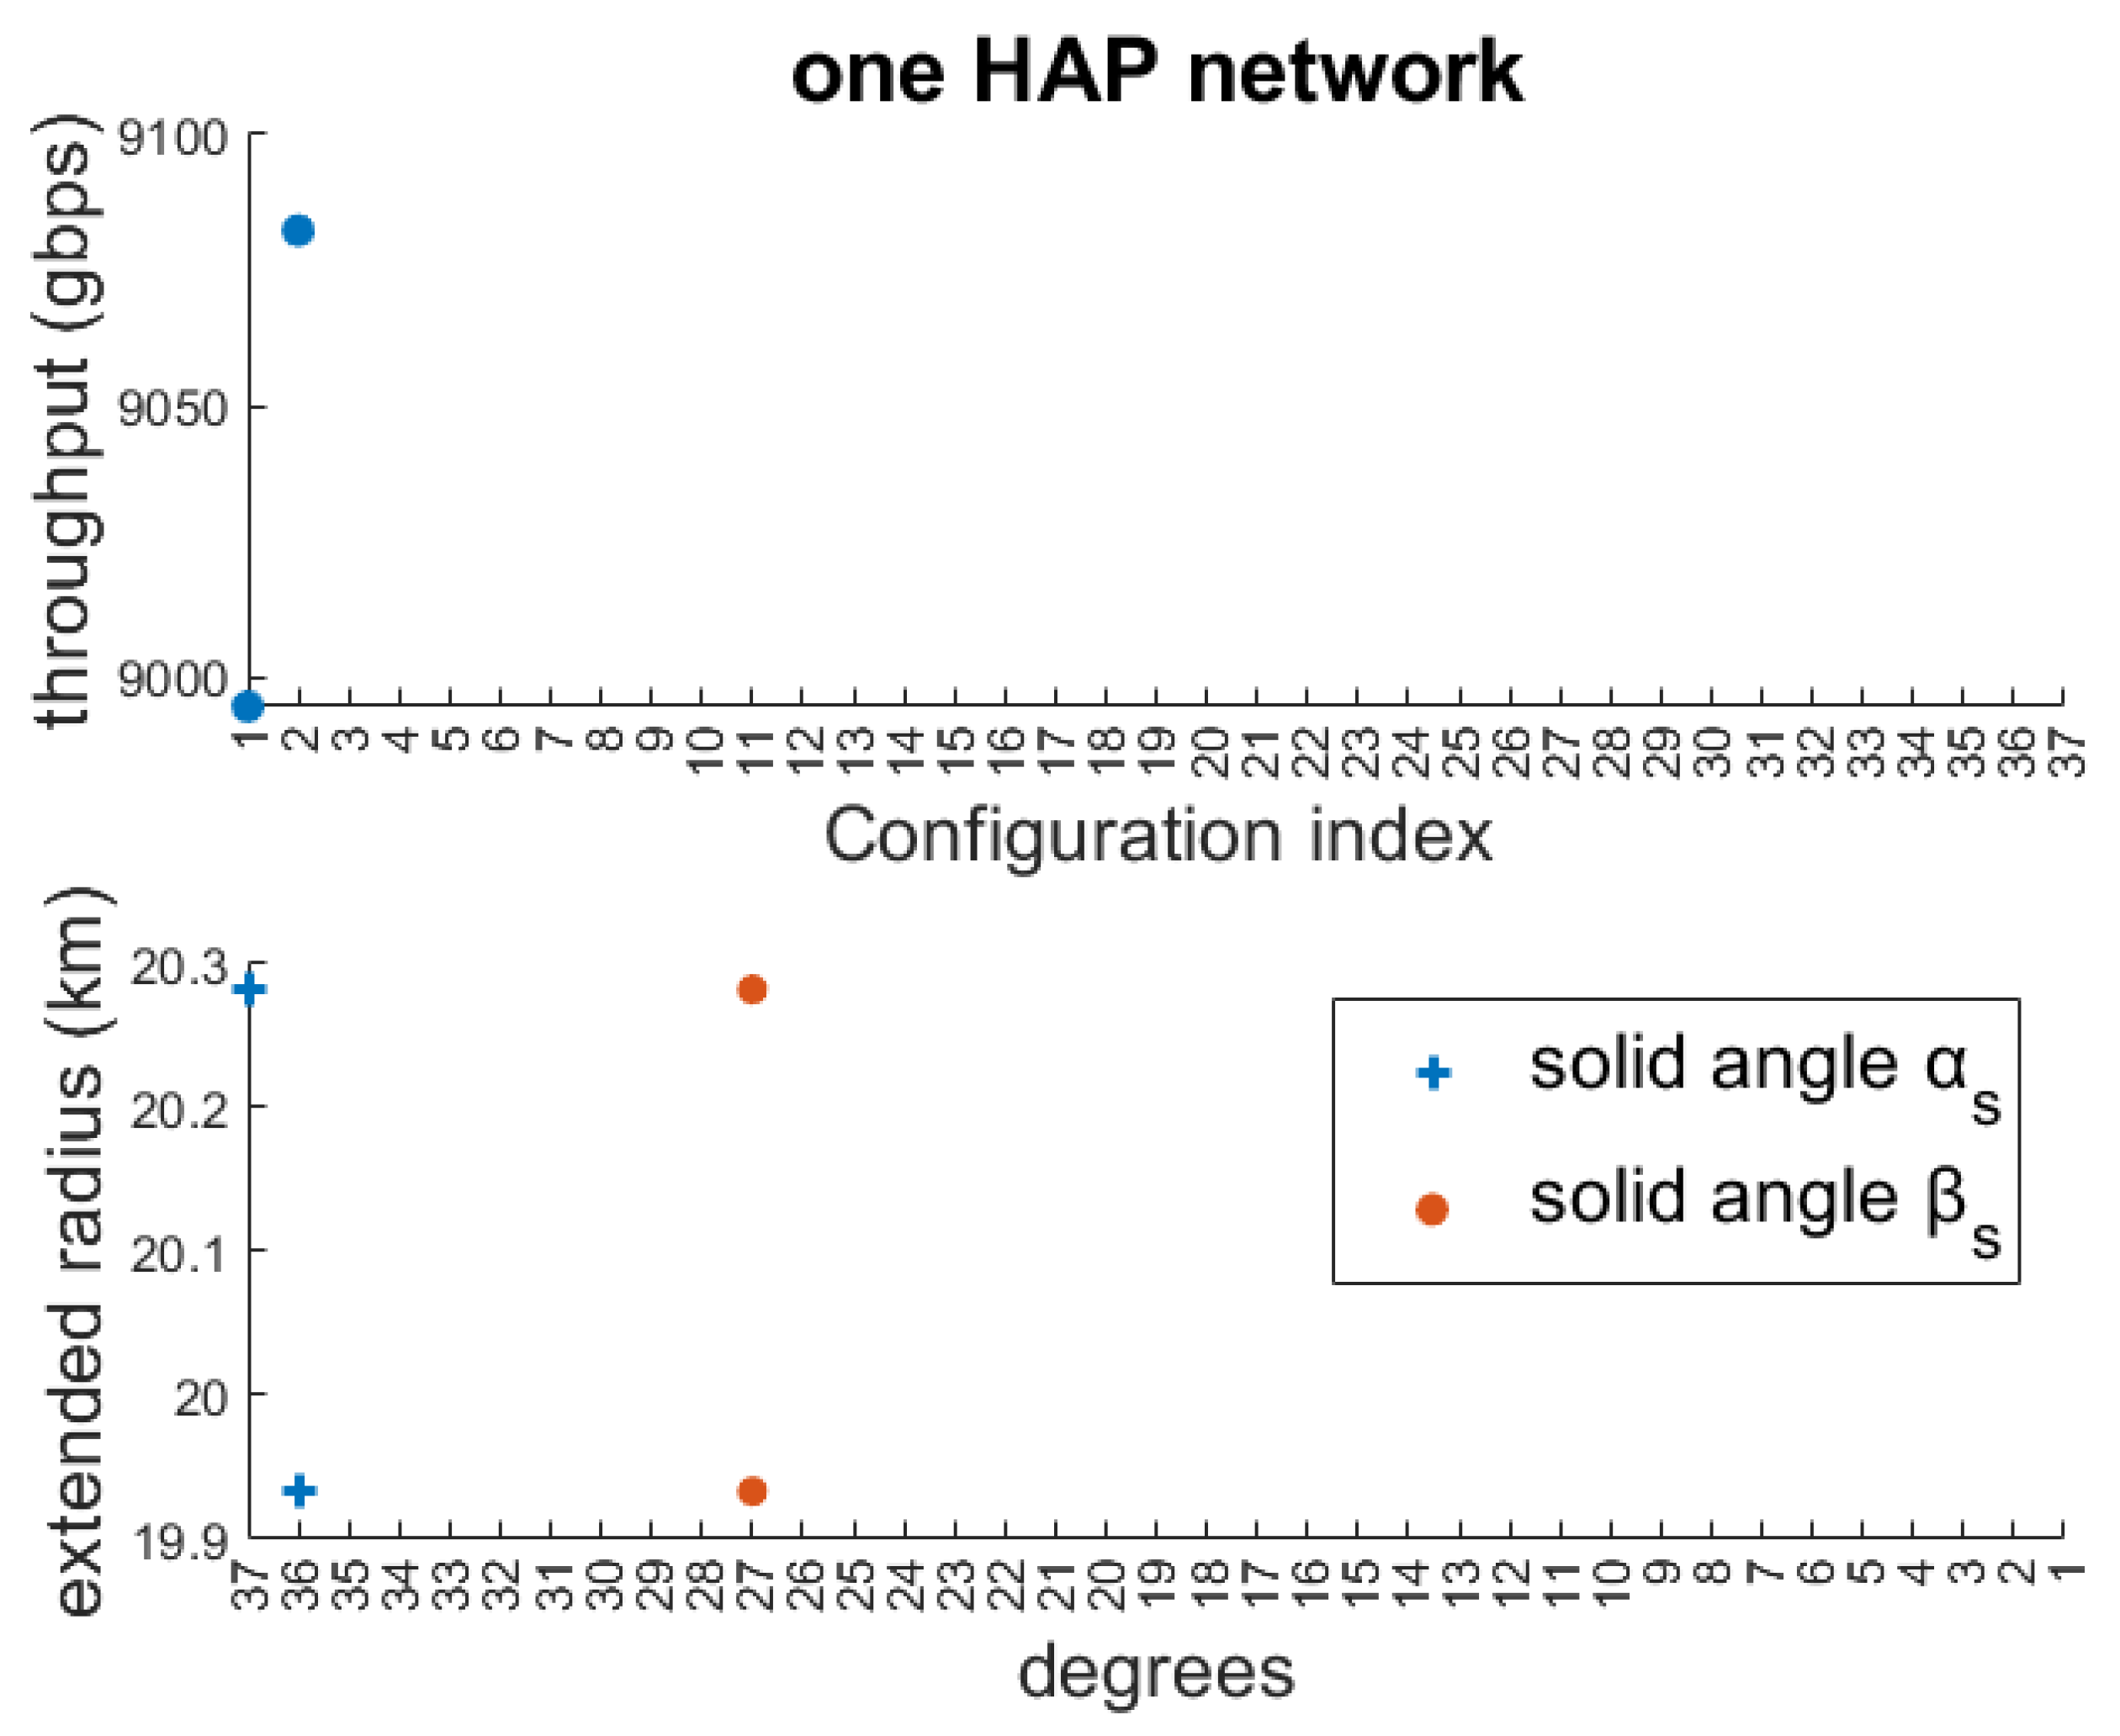
Table 14, Table 15 and Table 16 present the parameters of the optimal configuration for each HAP in terms of throughput for the networks consisting of one, two, and four HAPs, respectively. The network that consists of three HAPs is omitted for brevity. Indicative Figure 14 and Figure 15 are also provided.
The single-HAP network in the uniform distribution of ground nodes in a square area is adopted as a benchmark reference. It represents the most constrained case, offering a clear baseline for both throughput and cost. Furthermore, clustering is not required.
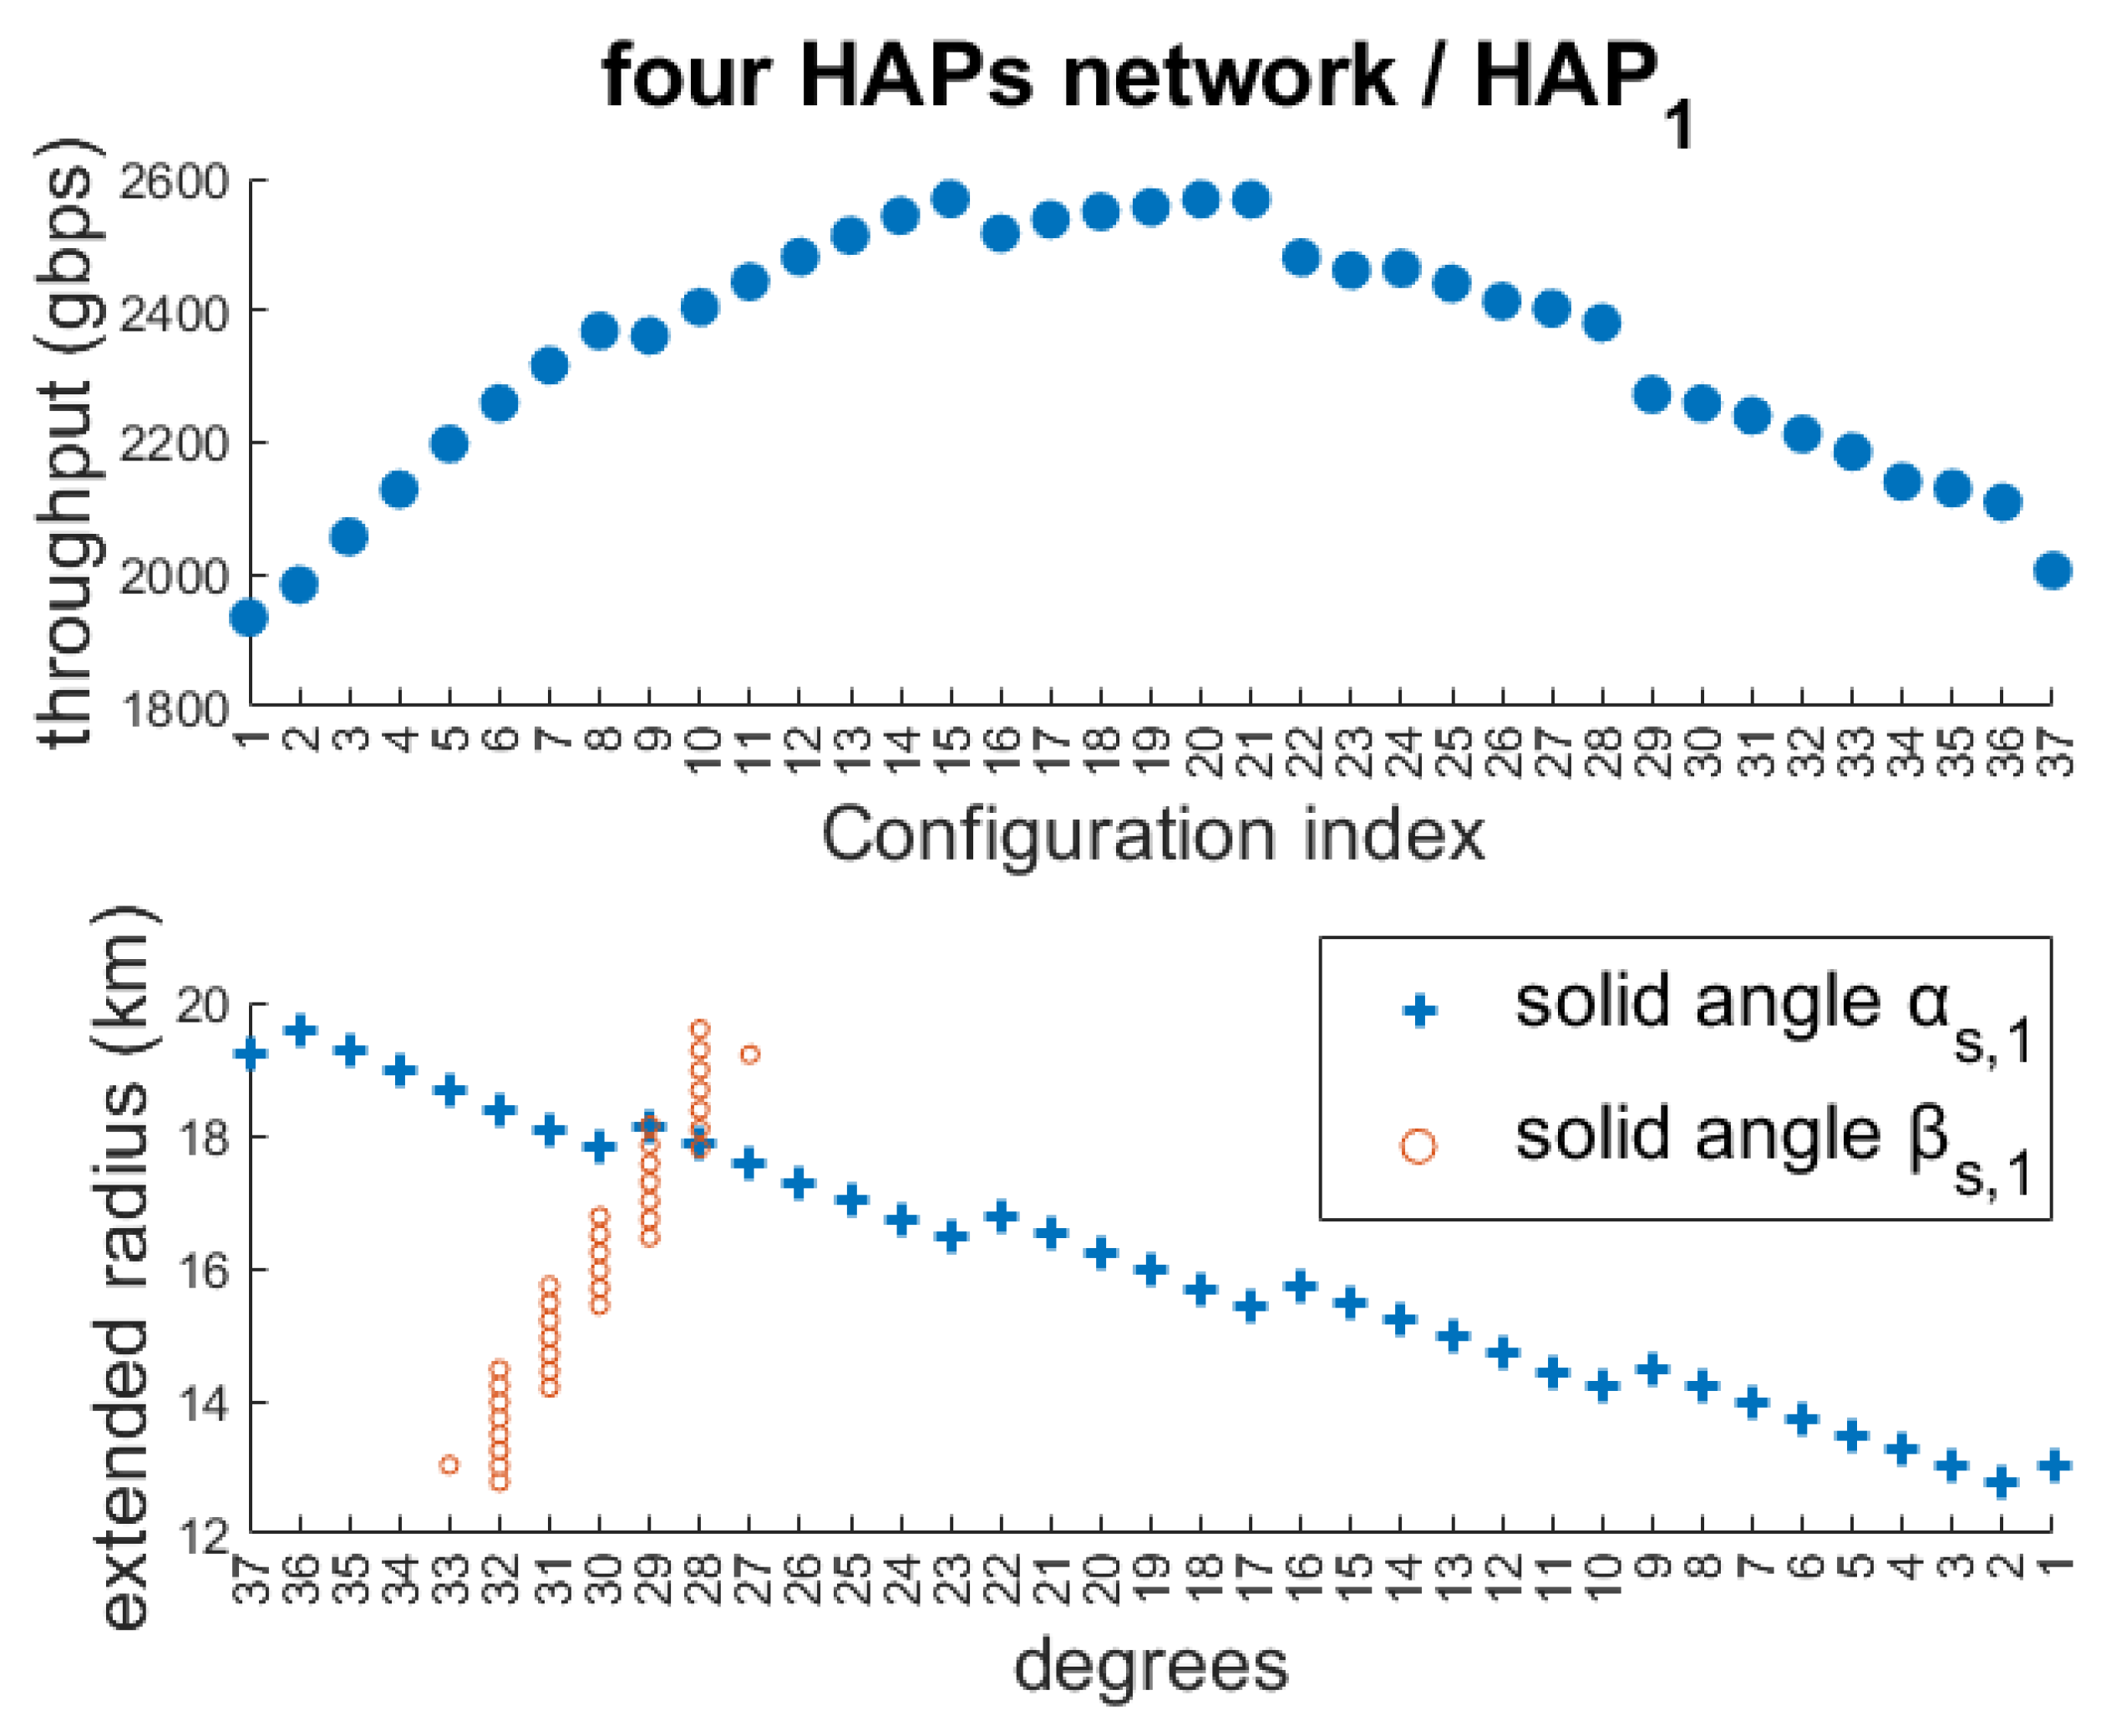
While in non-uniform distributions (e.g., Gaussian), deploying one additional HAP beyond the minimum-cost solution leads to a disproportionately large increase in throughput compared to the cost, in the uniform square distribution the placement of one more HAP results in approximately the same percentage increase in both the cost and throughput. Nevertheless, deploying more HAPs than the minimum required (i.e., the single-HAP benchmark) makes the network significantly more resilient to potentially increased real-world demands (e.g., small HAP displacements and reduced data rates due to atmospheric turbulence), as well as to possible future changes in the distribution of ground nodes and network requirements. This is because, as the number of HAPs increases, there is an exponential growth in the number of feasible minimum-cost configurations, as illustrated in Figure 14 and Figure 15.
When a HAP is added to the network, the percentage increase in cost is approximately equal to the percentage increase in throughput, namely 4%–8%, during the morning hours. Since this specific distribution can be served even with a single HAP, it is reasonable that no significant changes occur in cost and throughput when adding one more HAP to the network, as the minimum-cost configurations will lead to a reduction in m i i.e., the number of supplementary sFSOs per HAP. However, a substantial change is observed in the number of configuration combination options from which the optimal one is identified. For reference, based on the results, the single-HAP network can operate with two different configurations, whereas the four-HAP network can operate with 37 4 = 1,874,161 configurations.

4.4. Comparison Between Scenarios and the Resulting Networks

In the “Urban-centered distribution” scenario, it is observed that a network with one additional HAP can increase the throughput disproportionately compared with the corresponding cost during morning hours. Moreover, the four-HAP network significantly expands the number of possible operational configuration combinations, making the network more resilient to potential future changes. Therefore, the deployment of a four-HAP network is considered quite efficient compared to the three-HAP alternative. Despite the higher cost, the benefits are substantial and may ultimately lead to cost reduction in the long term.
In the “Uniform distribution of ground nodes in a circular area” scenario, the three-HAP network operates near its performance limits. For this reason, although it has a lower cost, selecting the three-HAP network entails a considerable risk. However, the throughput gain offered by the four-HAP network is proportional to the increase in cost.
These observations lead to the conclusion that a uniform distribution of ground nodes imposes higher hardware demands compared to Gaussian-based distributions. This is due to the higher concentration of ground nodes at longer distances, which results in the need for more long-distance links. Such long-distance links require more focused transmission beams, making it harder to identify feasible configuration combinations and ultimately rendering the network less resilient compared to networks based on Gaussian distributions.
It is noteworthy that in the “Uniform distribution of ground nodes in a circular area” scenario and in the “Urban-centered distribution” scenario, no networks consisting of fewer than three HAPs satisfy the constraints defined in the optimization problem. In contrast, in the “Ground nodes in a square area” scenario, a functional network can be established even with a single HAP, despite the fact that this scenario involves approximately 80% more ground nodes compared to the first two. However, upon examining the data, it becomes evident that the “Ground nodes in a square area” scenario covers a considerably smaller geographical area. This implies that the maximum distance observed between a ground node and its serving HAP is significantly larger in the first two scenarios. Consequently, we conclude that the most critical constraint in an FSO network consisting of HAPs is the distance.

5. Conclusions

In this paper, the design and simulation of a Free Space Optical (FSO) communication network supported by High Altitude Platforms (HAPs) is presented. By employing clustering techniques for ground node association, parametric adjustment of beam divergence angles, and stochastic modeling of atmospheric turbulence, the performance of the network was evaluated under a variety of scenarios. The study aimed at both minimizing the deployment cost and optimizing the network performance, with a focus on identifying the critical parameters that affect Quality of Service (QoS) in realistic operational environments.
The existence of multiple efficient configurations for each HAP introduces a significant degree of flexibility and resilience into the network. This attribute enables future adaptability to dynamic conditions—such as the emergence of new ground nodes—without requiring physical reconfiguration. Although the reconfiguration of a HAP may locally reduce throughput, it contributes to network flexibility that can potentially lower future economic or energy-related costs. Moreover, increasing the number of HAPs enhances the system’s capacity for solar energy harvesting and reduces the mechanical load per unit, thereby improving the overall system reliability. Although mechanical limitations of individual HAPs were not considered in the present work, they represent a critical aspect warranting further investigation.
Additionally, the potential variation in stochastic attenuation due to the assignment of different wavelengths to each link was not incorporated into the current analysis. Integrating this dimension—particularly in conjunction with Wavelength Division Multiplexing (WDM) techniques—could improve the spectrum utilization and enable more accurate modeling of turbulence-induced effects. A promising direction for future work involves the intelligent reconfiguration of each HAP’s coverage area through real-time optimization of individual beam divergence angles. Such an approach may distort the conventional circular footprint of the HAP’s laser beams, leading to improved spatial coverage, increased aggregate throughput, and reduced equipment requirements. These improvements could translate into lower capital and operational expenditures for the network. Moreover, in this study, HAP positions were assumed to remain fixed throughout the simulation. Scenarios that involve dynamic repositioning of the platforms—such as adaptations to spatiotemporal traffic demand or other variations in orientation and placement—represent a promising direction for future research. Furthermore, the proposed model can be extended to larger-scale networks, either at the continental level or across archipelagos. Such extensions would require the integration of additional HAPs as well as the terrain morphology, thereby transforming the network topology and demanding more sophisticated turbulence modeling strategies. Finally, the investigation of independent numbers of inter-HAP iFSOs and sFSOs constitutes an important topic with significant practical relevance.

Author Contributions

Conceptualization, P.S.B., A.K., and H.E.N.; methodology, P.S.B.; software, M.M.; validation, P.S.B.; investigation, M.M.; writing—original draft preparation, M.M.; writing—review and editing, P.S.B., A.K., and H.E.N. All authors have read and agreed to the published version of the manuscript.

Funding

This research received no external funding.

Conflicts of Interest

The authors declare no conflicts of interest.

Abbreviations

The following abbreviations are used in this manuscript:
APDAvalanche Photo-Diode
AWGNAdditive White Gaussian Noise
BERBit Error Rate
DCSKDifferential Chaos Shift Keying
DNNDeep Neural Network
EDFAErbium-Doped Fiber Amplifier
FBGFiber Bragg Grating
FSOFree Space Optics
HAPHigh Altitude Platform
iFSOInter-HAP FSO transceiver
LoSLine-of-Sight
OOKOn–off Keying
PSDPower Spectral Density
QoSQuality of Service
RFRadio Frequency
SAGISpace–Air–Ground Integrated
SLCStructure Layered Channel
SNRSignal-to-Noise Ratio
sFSOServing FSO Transceiver
UAVUnmanned Aerial Vehicle
WDMWavelength Division Multiplexing

References

  1. Truong, D.L.; Dang, T.N. Optimal multiple FSO transceiver configuration for using on high-altitude platforms. IEEE Access 2023, 11, 47053–47069. [Google Scholar] [CrossRef]
  2. Bithas, P.S. Distributed HAPS-assisted communications in FSO/RF space-air-ground integrated networks. Opt. Quantum Electron. 2024, 56, 1020. [Google Scholar] [CrossRef]
  3. Mashiko, K.; Kawamoto, Y.; Kato, N.; Yoshida, K.; Ariyoshi, M. Combined control of coverage area and HAPS deployment in hybrid FSO/RF SAGIN. IEEE Trans. Veh. Technol. 2025, 74, 10819–10828. [Google Scholar] [CrossRef]
  4. Kashif, H.; Khan, M.N.; Altalbe, A. Hybrid optical-radio transmission system link quality: Link budget analysis. IEEE Access 2020, 8, 65983–65992. [Google Scholar] [CrossRef]
  5. Alimi, I.A.; Monteiro, P.P. Revolutionizing free-space optics: A survey of enabling technologies, challenges, trends, and prospects of beyond 5G free-space optical (FSO) communication systems. Sensors 2024, 24, 8036. [Google Scholar] [CrossRef]
  6. Gao, Z.; Eisen, M.; Ribeiro, A. Resource allocation via model-free deep learning in free space optical communications. IEEE Trans. Commun. 2021, 70, 920–934. [Google Scholar] [CrossRef]
  7. Zheng, G.; Han, Y. Free Space Optical Reliable Routing Algorithm based on Deep Reinforcement Learning. In Proceedings of the 5th International Academic Exchange Conference on Science and Technology Innovation (IAECST), Guangzhou, China, 8–10 December 2023; pp. 11–14. [Google Scholar]
  8. Lema, G.G. Free space optics communication system design using iterative optimization. J. Opt. Commun. 2024, 44, s1205–s1216. [Google Scholar] [CrossRef]
  9. Lionis, A.; Sklavounos, A.; Stassinakis, A.; Cohn, K.; Tsigopoulos, A.; Peppas, K.; Aidinis, K.; Nistazakis, H. Experimental machine learning approach for optical turbulence and FSO outage performance modeling. Electronics 2023, 12, 506. [Google Scholar] [CrossRef]
  10. Ren, W.; Sun, J.; Cong, H.; Jiang, Y. Sensitivity deterioration of free-space optical coherent/non-coherent OOK modulation receiver by ambient light noise. Sensors 2023, 23, 2140. [Google Scholar] [CrossRef]
  11. Gripeos, P.J.; Nistazakis, H.E.; Tsigopoulos, A.D.; Christofilakis, V.; Roditi, E. Time and spatial jitter influence on the performance of FSO links with DF relays and OC diversity over turbulence channels. Photonics 2021, 8, 318. [Google Scholar] [CrossRef]
  12. Zhang, Q.; Yu, J.; Long, J.; Wang, C.; Chen, J.; Lu, X. A Hybrid RF/FSO Transmission System Based on a Shared Transmitter. Sensors 2025, 25, 2021. [Google Scholar] [CrossRef]
  13. Singya, P.K.; Makki, B.; D’Errico, A.; Alouini, M.S. Hybrid FSO/THz-based backhaul network for mmWave terrestrial communication. IEEE Trans. Wirel. Commun. 2022, 22, 4342–4359. [Google Scholar] [CrossRef]
  14. Hayle, S.T.; Hsu, H.Y.; Wang, C.P.; Lu, H.H.; Lu, J.M.; Hsu, W.W.; Chung, Y.C.; Bai, Y.Y.; Okram, K. High-speed FSO-5G wireless communication system with enhanced loss compensation using high-power EDFA. Sci. Rep. 2025, 15, 379. [Google Scholar] [CrossRef] [PubMed]
  15. Narang, G.; Aggarwal, M.; Kaushal, H.; Kumar, A.; Ahuja, S.; Shukla, N.K. Performance evaluation of dual hop mixed FSO RF system using differential chaos shift keying with secrecy analysis. IEEE Trans. Veh. Technol. 2024, 73, 17347–17358. [Google Scholar] [CrossRef]
  16. Trung, H.D. Performance of UAV-to-Ground FSO Communications with APD and Pointing Errors. Appl. Syst. Innov. 2021, 4, 65. [Google Scholar] [CrossRef]
  17. Le, H.T.; Nguyen, T.V.; Pham, H.T.; Dang, N.T. Harvested Energy Evaluation of Free-Space Optics RIS-Assisted Ground-HAP-UAV System Over Composite Channels. In Proceedings of the IEEE 99th Vehicular Technology Conference (VTC2024-Spring), Singapore, 24–27 June 2024; pp. 1–5. [Google Scholar]
  18. Yahia, O.B.; Erdogan, E.; Kurt, G.K.; Altunbas, I.; Yanikomeroglu, H. HAPS selection for hybrid RF/FSO satellite networks. IEEE Trans. Aerosp. Electron. Syst. 2022, 58, 2855–2867. [Google Scholar] [CrossRef]
  19. Elamassie, M.; Uysal, M. FSO-Based Multi-Layer Airborne Backhaul Networks. IEEE Trans. Veh. Technol. 2024, 73, 15004–15019. [Google Scholar] [CrossRef]
  20. Truong, D.L.; Dang, X.V.; Dang, T.N. Survivable free space optical mesh network using high-altitude platforms. Opt. Switch. Netw. 2023, 47, 100716. [Google Scholar] [CrossRef]
  21. Samy, R.; Yang, H.C.; Mahran, A.; Gebali, F.; Alouini, M.S. Enabling broadband internet access in remote and rural communities using HAP-based multi-hop FSO/RF transmissions. IEEE Commun. Mag. 2024, 63, 182–188. [Google Scholar] [CrossRef]
  22. McQueen, J.B. Some methods of classification and analysis of multivariate observations. In Proceedings of the 5th Berkeley Symposium on Mathematical Statistics and Probability; University of California Press: Berkeley, CA, USA, 1967; pp. 281–297. [Google Scholar]
  23. Kodinariya, T.M.; Makwana, P.R. Review on determining number of Cluster in K-Means Clustering. Int. J. Adv. Res. Comput. Sci. Manag. Stud. 2013, 1, 90–95. [Google Scholar]
  24. Jain, A.K. Data clustering: 50 years beyond K-means. Pattern Recognit. Lett. 2010, 31, 651–666. [Google Scholar] [CrossRef]
  25. Kokkinis, D.; Ioannou, N.; Katsianis, D.; Varoutas, D. A Techno-Economic Modeling Approach to 6G Network Deployment: Exploring Costs and Use Case Feasibility. IEEE Access 2025, 13, 35597–35608. [Google Scholar] [CrossRef]
  26. Mahmood, A.S. An approach to investigating the feasibility of free-space optical communication technology deployment under scintillation effects. Opto-Electron. Rev. 2023, e147037. [Google Scholar] [CrossRef]
  27. Weichel, H. Laser Beam Propagation in the Atmosphere; SPIE Press: Bellingham, WA, USA, 1990; Volume 3. [Google Scholar]
  28. Elamassie, M.; Uysal, M. Free space optical communication: An enabling backhaul technology for 6G non-terrestrial networks. Photonics 2023, 10, 1210. [Google Scholar] [CrossRef]
  29. Bithas, P.S.; Nistazakis, H.E.; Katsis, A.; Yang, L. Hybrid FSO/RF communications in space–air–ground integrated networks: A reduced overhead link selection policy. Electronics 2024, 13, 806. [Google Scholar] [CrossRef]
  30. Miao, M.; Cai, W.; Li, X. Parameter Estimation of Gamma-Gamma Fading with Generalized Pointing Errors in FSO Systems. Wirel. Commun. Mob. Comput. 2021, 2021, 1301878. [Google Scholar] [CrossRef]
Figure 1. Network consisting of three HAPs.
Photonics 12 00926 g001
Figure 2. Network consisting of four HAPs.
Photonics 12 00926 g002
Figure 3. HAP coverage area—plan view.
Photonics 12 00926 g003
Figure 4. Footprint of a HAP.
Photonics 12 00926 g004
Figure 5. Five-layer atmospheric turbulence model between HAP and ground node.
Photonics 12 00926 g005
Figure 6. Example: throughput and extended service radius versus configuration index and solid angles for HAP 4 in a four-HAPs network.
Photonics 12 00926 g006
Figure 7. Ground node allocation and service areas for three-HAPs network (A) and four-HAPs network (B).
Photonics 12 00926 g007
Figure 8. Throughput performance and variation in the solid angles for the HAPs during the morning hours (three-HAPs network).
Photonics 12 00926 g008
Figure 9. Throughput performance and variation in the solid angles for the HAPs during the morning hours (four-HAPs network).
Photonics 12 00926 g009
Figure 10. Ground node allocation and service areas for four-HAPs network (A) and three-HAPs network (B).
Photonics 12 00926 g010
Figure 11. Throughput performance and variation in the solid angles for the HAPs during the morning hours (three-HAPs network).
Photonics 12 00926 g011
Figure 12. Throughput performance and variation in the solid angles for the HAPs during the morning hours (four-HAP network).
Photonics 12 00926 g012
Figure 13. Ground node allocation and service areas for networks with one, two, three, and four HAPs.
Photonics 12 00926 g013
Figure 14. Throughput performance and variation in the solid angles for the HAP1 of the four-HAP network during the morning hours.
Photonics 12 00926 g014
Figure 15. Throughput performance and variation in the solid angles for the HAP during the morning hours (one-HAP network).
Photonics 12 00926 g015
Table 1. Parameters used throughout the paper and simulation values.
SymbolDescription and Physical MeaningNumerical Value
M The number of inter-HAP links12 [1]
ζ H d a y Daily amortization cost of a HAP100 [1]
ζ F d a y Daily amortization cost of an FSO transceiver on HAP10 [1]
ρ a v i o n Power consumption of the aeronautical section to support one unit of mass2 W/kg [1]
ρ t x F S O Transmitted power from each sFSO 1 W [1]
ρ F H C M Power for thermal stabilization and management 20 W [1]
ρ P A T Power consumption by Pointing Acquisition and Tracking System 15 W [1]
ρ F i n t e r Total power consumption by an iFSO 35.1 W [1]
μ F FSO transceiver mass 6.3 kg [1]
μ H Platform mass excluding FSO transceivers 28.5 kg [1]
W The number of wavelengths per FSO link according to used WDM technique80 [1]
H Elevation of HAPs 20 km [1]
K The number of HAPs per network1, 2, 3, 4
BThe bandwidth of the optical channel 10 9 Hz [10]
N 0 d a y The power of background noise during daytime 10 8 W [10]
N 0 n i g h t The power of background noise during nighttime 10 11 W [10]
σ Atmospheric attenuation coefficient 3.5 × 10 6 m−1 [1]
R t e l Receiver telescope aperture radius of a ground node transceiver 0.75 m [1]
E s o l a r d a y The daily harvested solar energy 290 kWh [1]
U t h r e s Detector’s sensitivity 49.62 dBm [1]
kThe optical wavenumber 4.054 rad m
Table 2. Spatial distribution data of ground nodes.
Urban CenterSuburb 1Suburb 2Suburb 3Suburb 4
Number of ground nodes1450362362362362
Distribution center(0, 0)(9, 6)(−10, 4)(7, −11)(−8, −9)
Dispersion on the x-axis1.0003.4822.0755.2043.482
Dispersion on the y-axis1.3885.2043.4827.2252.881
Table 3. Positions of HAPs, number of served nodes, and operating cost per HAP for a three-HAP network.
Three-HAPs
Networks
Location (x, y), (km)Number of
Ground Nodes
Number of
sFSOs
Operational
Cost
HAP 1 (1.90, 1.12)188424602.74
HAP 2 (−9.22, −1.91)6829302.74
HAP 3 (6.23, −13.40)33210322.74
Total network cost: 1228
Table 4. Positions of HAPs, number of served ground nodes, and operating cost per HAP for a four-HAP network.
Four-HAPs
Networks
Location (x, y), (km)Number of
Ground Nodes
Number of
sFSOs
Operational
Cost
HAP 1 (0.11, −0.10)154120522.74
HAP 2 (−9.31, −1.85)6729302.74
HAP 3 (6.27, −13.48)32710322.74
HAP 4 (9.51, 6.06)3587262.74
Total network cost: 1411
Table 5. Solid angle and coverage radius for the maximum throughput per HAP during the morning hours (three-HAP network).
Three-HAPs
Network
α s β s R serv (km) Throughput
(Gbps)
HAP 1 34 28 19.292501
HAP 2 27 30 15.451005
HAP 3 36 29 17.23431
Network throughput: 3937 Gbps
Mean throughput per ground node: 431
Table 6. Solid angle, coverage radius, and throughput per HAP during morning hours (four-HAP network).
Four-HAPs
Network
α s β s R serv (km) Throughput
(Gbps)
HAP 1 11 31 14.454886
HAP 2 23 31 16.52994
HAP 3 35 29 15.31435
HAP 4 33 31 14.61480
Network throughput: 6795 Gbps
Mean throughput per ground node: 2.27 Gbps
Table 7. Positions of HAPs, number of served ground nodes, and operating cost per HAP for a four-HAP network.
Four-HAPs
Network
Location (x, y), (km)Number of
Ground Nodes
Number of
sFSOs
Operational
Cost
HAP 1 (−10.17, −7.97)5769302.74
HAP 2 (9.62, 8.67)52810322.74
HAP 3 (6.97, −8.06)7049302.74
HAP 4 (−3.42, 4.49)119215422.74
Total network cost: 1351
Table 8. Positions of HAPs, number of served ground nodes, and operating cost per HAP for a three-HAP network.
Three-HAPs
Network
Location (x, y), (km)Number of
Ground Nodes
Number of
sFSOs
Operational
Cost
HAP 1 (1.82, 6.88)132317462.74
HAP 2 (6.99, −7.49)85015422.74
HAP 3 (−10.02, −3.69)82714402.74
Total network cost: 1288
Table 9. Solid angle, coverage radius, and throughput per HAP during the morning hours (three-HAP network).
Three-HAPs
Network
a s b s R serv (km) Throughput
(Gbps)
HAP 1 36 28 19.181794
HAP 2 37 28 19.051134
HAP 3 37 28 18.761099
Network throughput: 4027 Gbps
Mean throughput per ground node: 1.94 Gbps
Table 10. Solid angle, coverage radius, and throughput per HAP during the morning hours (four-HAP network).
Four-HAPs
Network
a s b s R serv (km) Throughput
(Gbps)
HAP 1 33 30 16.49779
HAP 2 36 30 17.00676
HAP 3 28 30 15.631022
HAP 4 28 29 17.271798
Network throughput: 4275 Gbps
Mean throughput per ground node: 1.43 Gbps
Table 11. Positions of HAPs, number of served ground nodes, and operating cost per HAP for a one-HAP network.
One HAP
Network
Location (x, y)
(km)
Number of
Ground Nodes
Number
of sFSOs
Operational
Cost
HAP1 (13.84, 14.04) 6500 82 1763
Total Network Cost: 1763
Table 12. Positions of HAPs, number of served ground nodes, and operating cost per HAP for a two-HAP network.
Two HAPs
Network
Location (x, y)
(km)
Number of
Ground Nodes
Number
of sFSOs
Operational
Cost
HAP1 (20.98, 14.12) 3211 41 942.74
HAP2 (6.86, 13.97) 3289 42 962.74
Total Network Cost: 1906
Table 13. Positions of HAPs, number of served ground nodes, and operating cost per HAP for a four-HAP network.
Four HAPs
Network
Location (x, y)
(km)
Number of
Ground Nodes
Number
of sFSOs
Operational
Cost
HAP1 (21.44, 21.22) 1536 20 522.74
HAP2 (7.03, 21.09) 1647 21 542.74
HAP3 (6.79, 7.21) 1662 21 542.74
HAP4 (20.64, 7.23) 1655 21 542.74
Total Network Cost: 2154
Table 14. Solid angle, coverage radius, and throughput per HAP during morning hours (one-HAP network).
One HAP
Network
α s β s R serv (km) Throughput
(Gbps)
HAP1 36 27 19.939083
Network throughput: 9083
Mean throughput per ground node: 1.40 Gbps
Table 15. Solid angle, coverage radius, and throughput per HAP during morning hours (two-HAP network).
Two HAPs
Network
α s β s R serv (km) Throughput
(Gbps)
HAP1 22 29 16.644860
HAP2 22 29 16.654977
Network throughput: 9837
Mean throughput per ground node: 1.51 Gbps
Table 16. Solid angle, coverage radius, and throughput per HAP during morning hours (four-HAP network).
Four HAPs
Network
α s β s R serv (km) Throughput per
HAP (Gbps)
HAP1 23 29 16.462596
HAP2 23 29 16.522742
HAP3 23 29 16.522767
HAP4 23 29 16.522749
Network throughput: 10,827
Mean throughput per ground node: 1.67 Gbps
Disclaimer/Publisher’s Note: The statements, opinions and data contained in all publications are solely those of the individual author(s) and contributor(s) and not of MDPI and/or the editor(s). MDPI and/or the editor(s) disclaim responsibility for any injury to people or property resulting from any ideas, methods, instructions or products referred to in the content.