1. Introduction
In the Electricity and Radiation Department of the Central Office of Measures, the color measurements include, among other things, calibrations in the field of reflectance colorimetry. In order to disseminate units of measurement to customers’ instruments, a specially designed set of chromatic and achromatic standards is used [
1,
2,
3,
4]. During the calibration, the readings of the instruments are compared with the reference values L*, a*, and b*, assigned to the set of “Glossy Ceramic Color Standards” DM05 (see
Figure 1). The set consists of ceramic, colored plates, which are sufficiently flat and uniform with regard to the color of their surfaces [
1,
3,
4].
The measurements are carried out in appropriate measurement geometries, i.e., in precisely defined angles of incidence and reflections of light [
2,
5]. Such a limited area related to a given measurement geometry does not provide us with sufficient information about the reflection characteristics of the measured objects. The reflection may be more specular or more diffused depending on the type of surface which the light falls into [
2,
5,
6].
Using the additional possibilities provided by the spectrophotometer with a multi-angle attachment, the authors of this publication conducted research aimed at extending the knowledge on changes in the angular characteristics of the reflectance of the standards from the DM05 set [
7].
The aim of the study was to distinguish the angular range for which the color characteristics of the standards will be close to the representative characteristics of a given color, which could be used in the calibration of spectrophotometers, and examine the area for which such characteristics can no longer be observed due to the increasing gloss effect [
2]. The analytical methodology is described, and the final results of the research are presented along with the conclusions.
2. Materials and Methods
The angular characteristics in reflected light were measured on a CARY 5000 spectrophotometer using a Cary Universal Measurement Accessory (UMA) [
6].
The measurements were taken using reference standards from the Glossy Ceramic Color Standards DM05 set, containing 10 ceramic tiles of different colors, 102 mm by 102 mm and 9 mm thick [
3,
4]. For the purposes of this article, the results of the tests carried out for 3 standards from this set, i.e., Deep Blue, Green, and Orange, have been taken into account (see
Figure 2).
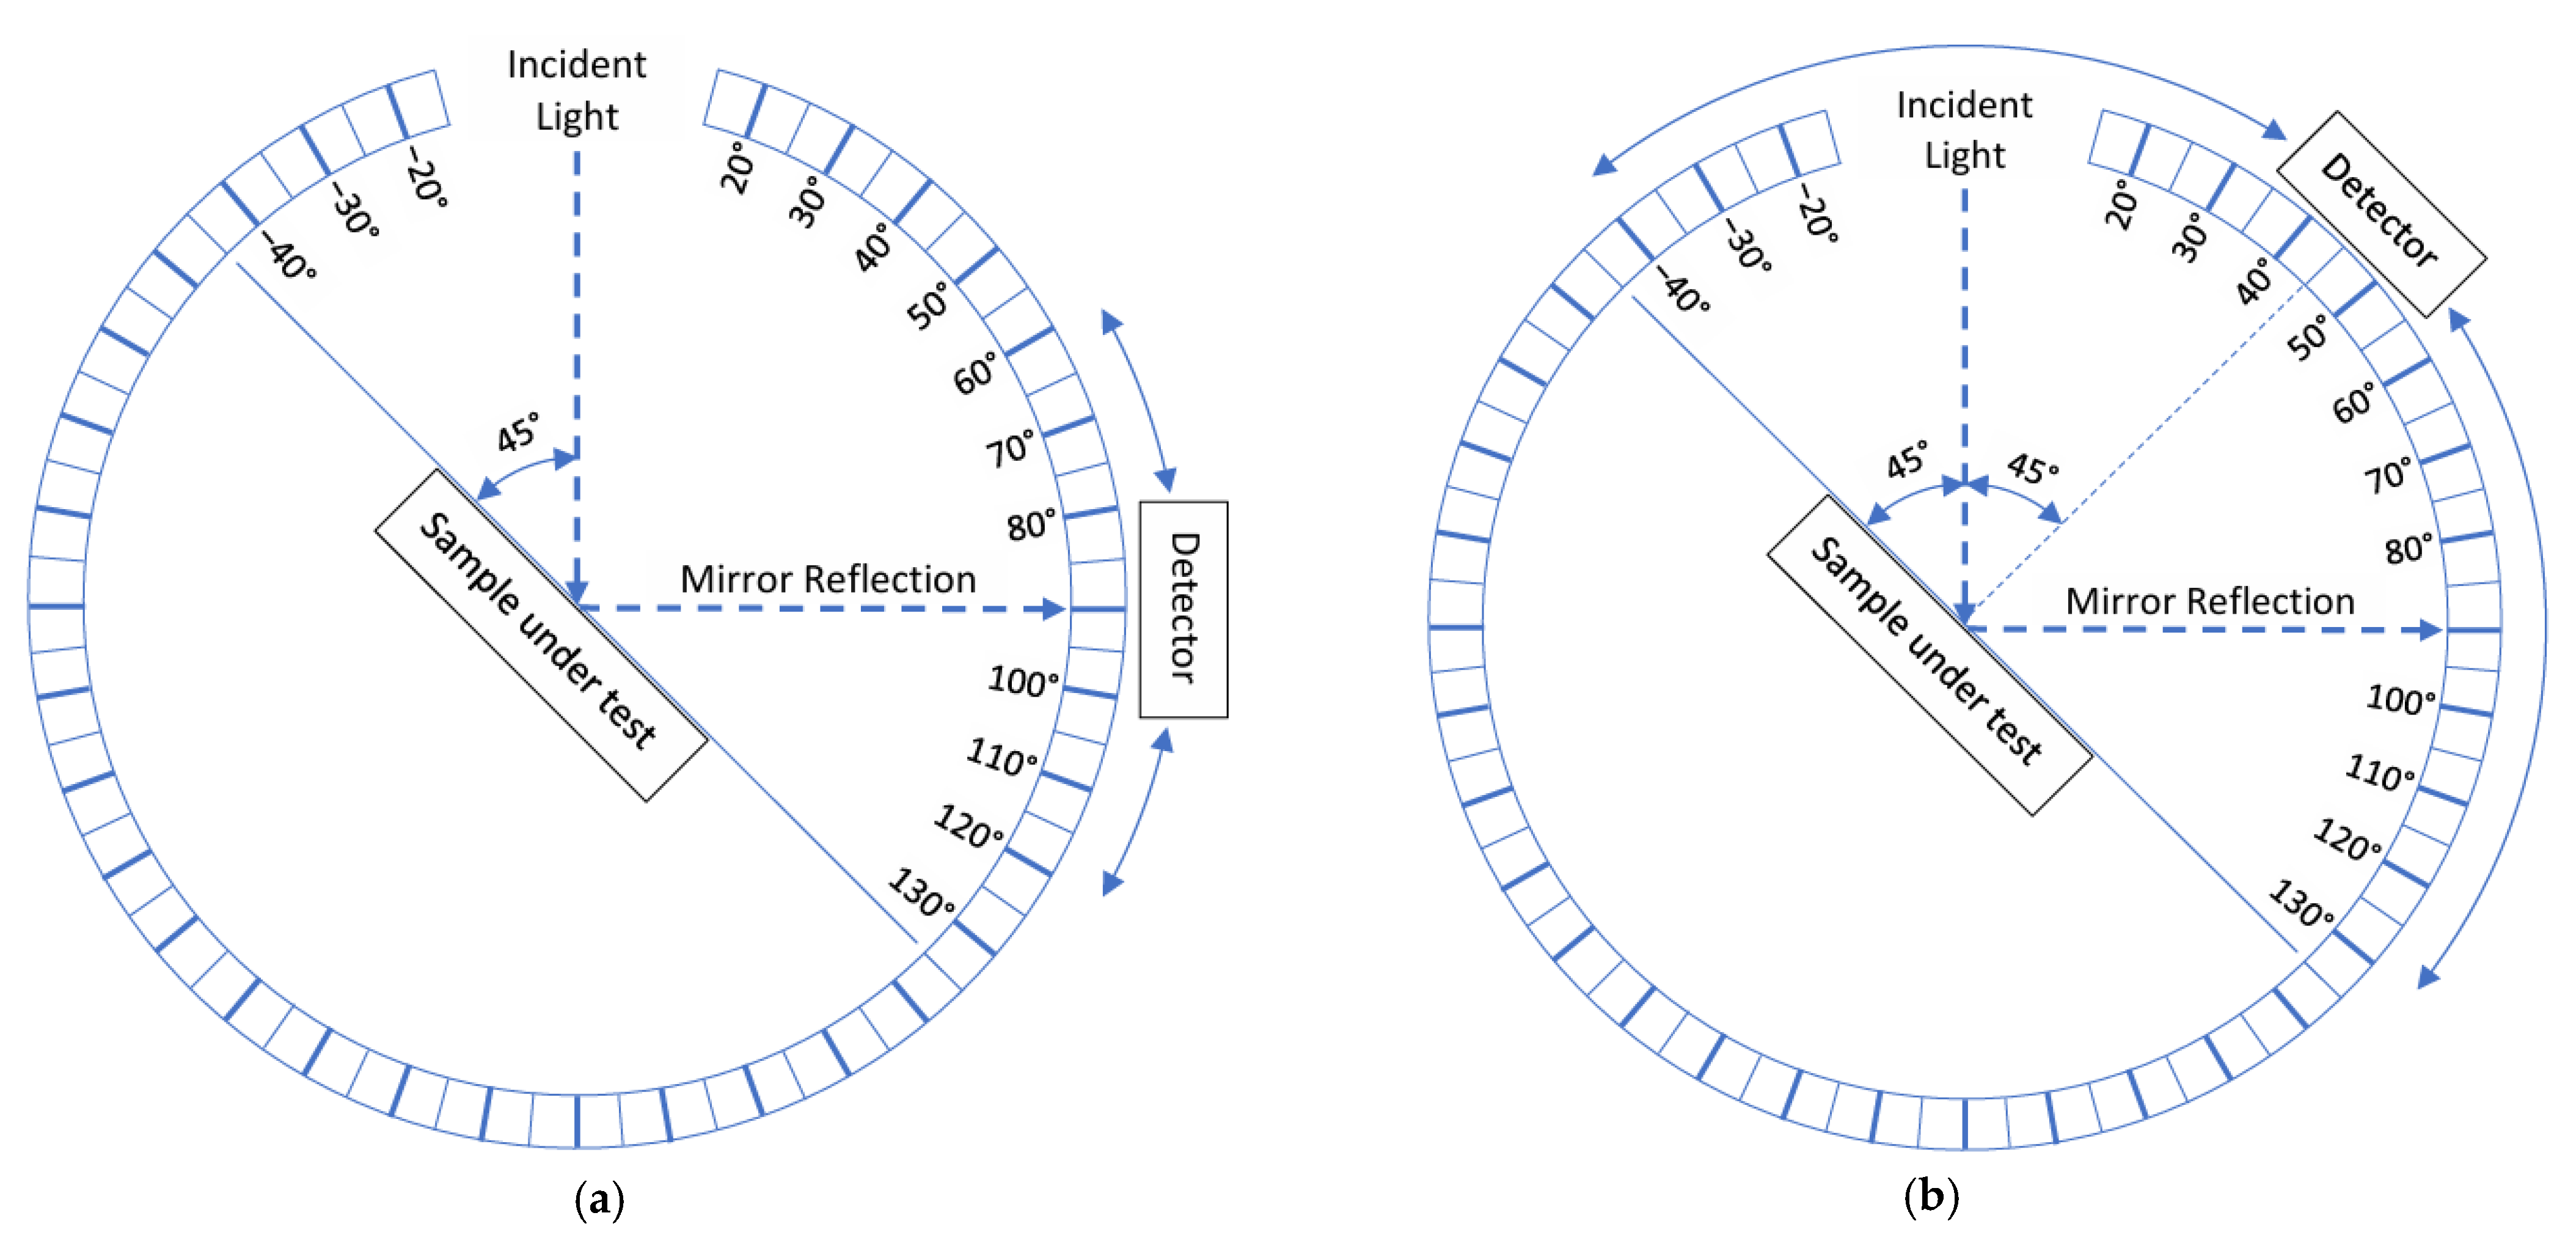
In the course of the experiments, the following measurement conditions were applied: the sample was set at an angle of 45° to the incident beam, the detector for the reflected radiation from the sample was set within almost an entire range of possible angles of observation of the reflected beam, i.e., −40° to 130° (for the first phase of the study, this range was set within 60° to 120°). The individual angular settings were selected in such a way as to examine in particular the area of the maximum mirror reflection signal, which, according to theory, should occur at an angle of 90° for such a sample setting (see
Figure 3a) [
2,
3,
8]. Setting the sample at an angle of 45° refers to one of the basic measurement geometries used in reflectance spectrophotometers (45°:0°—the light beam falls on the sample at 45°, and the reflection is recorded at 0° from the normal to the tile surface, i.e., 45° on the protractor scale of the UMA) (see
Figure 3b).
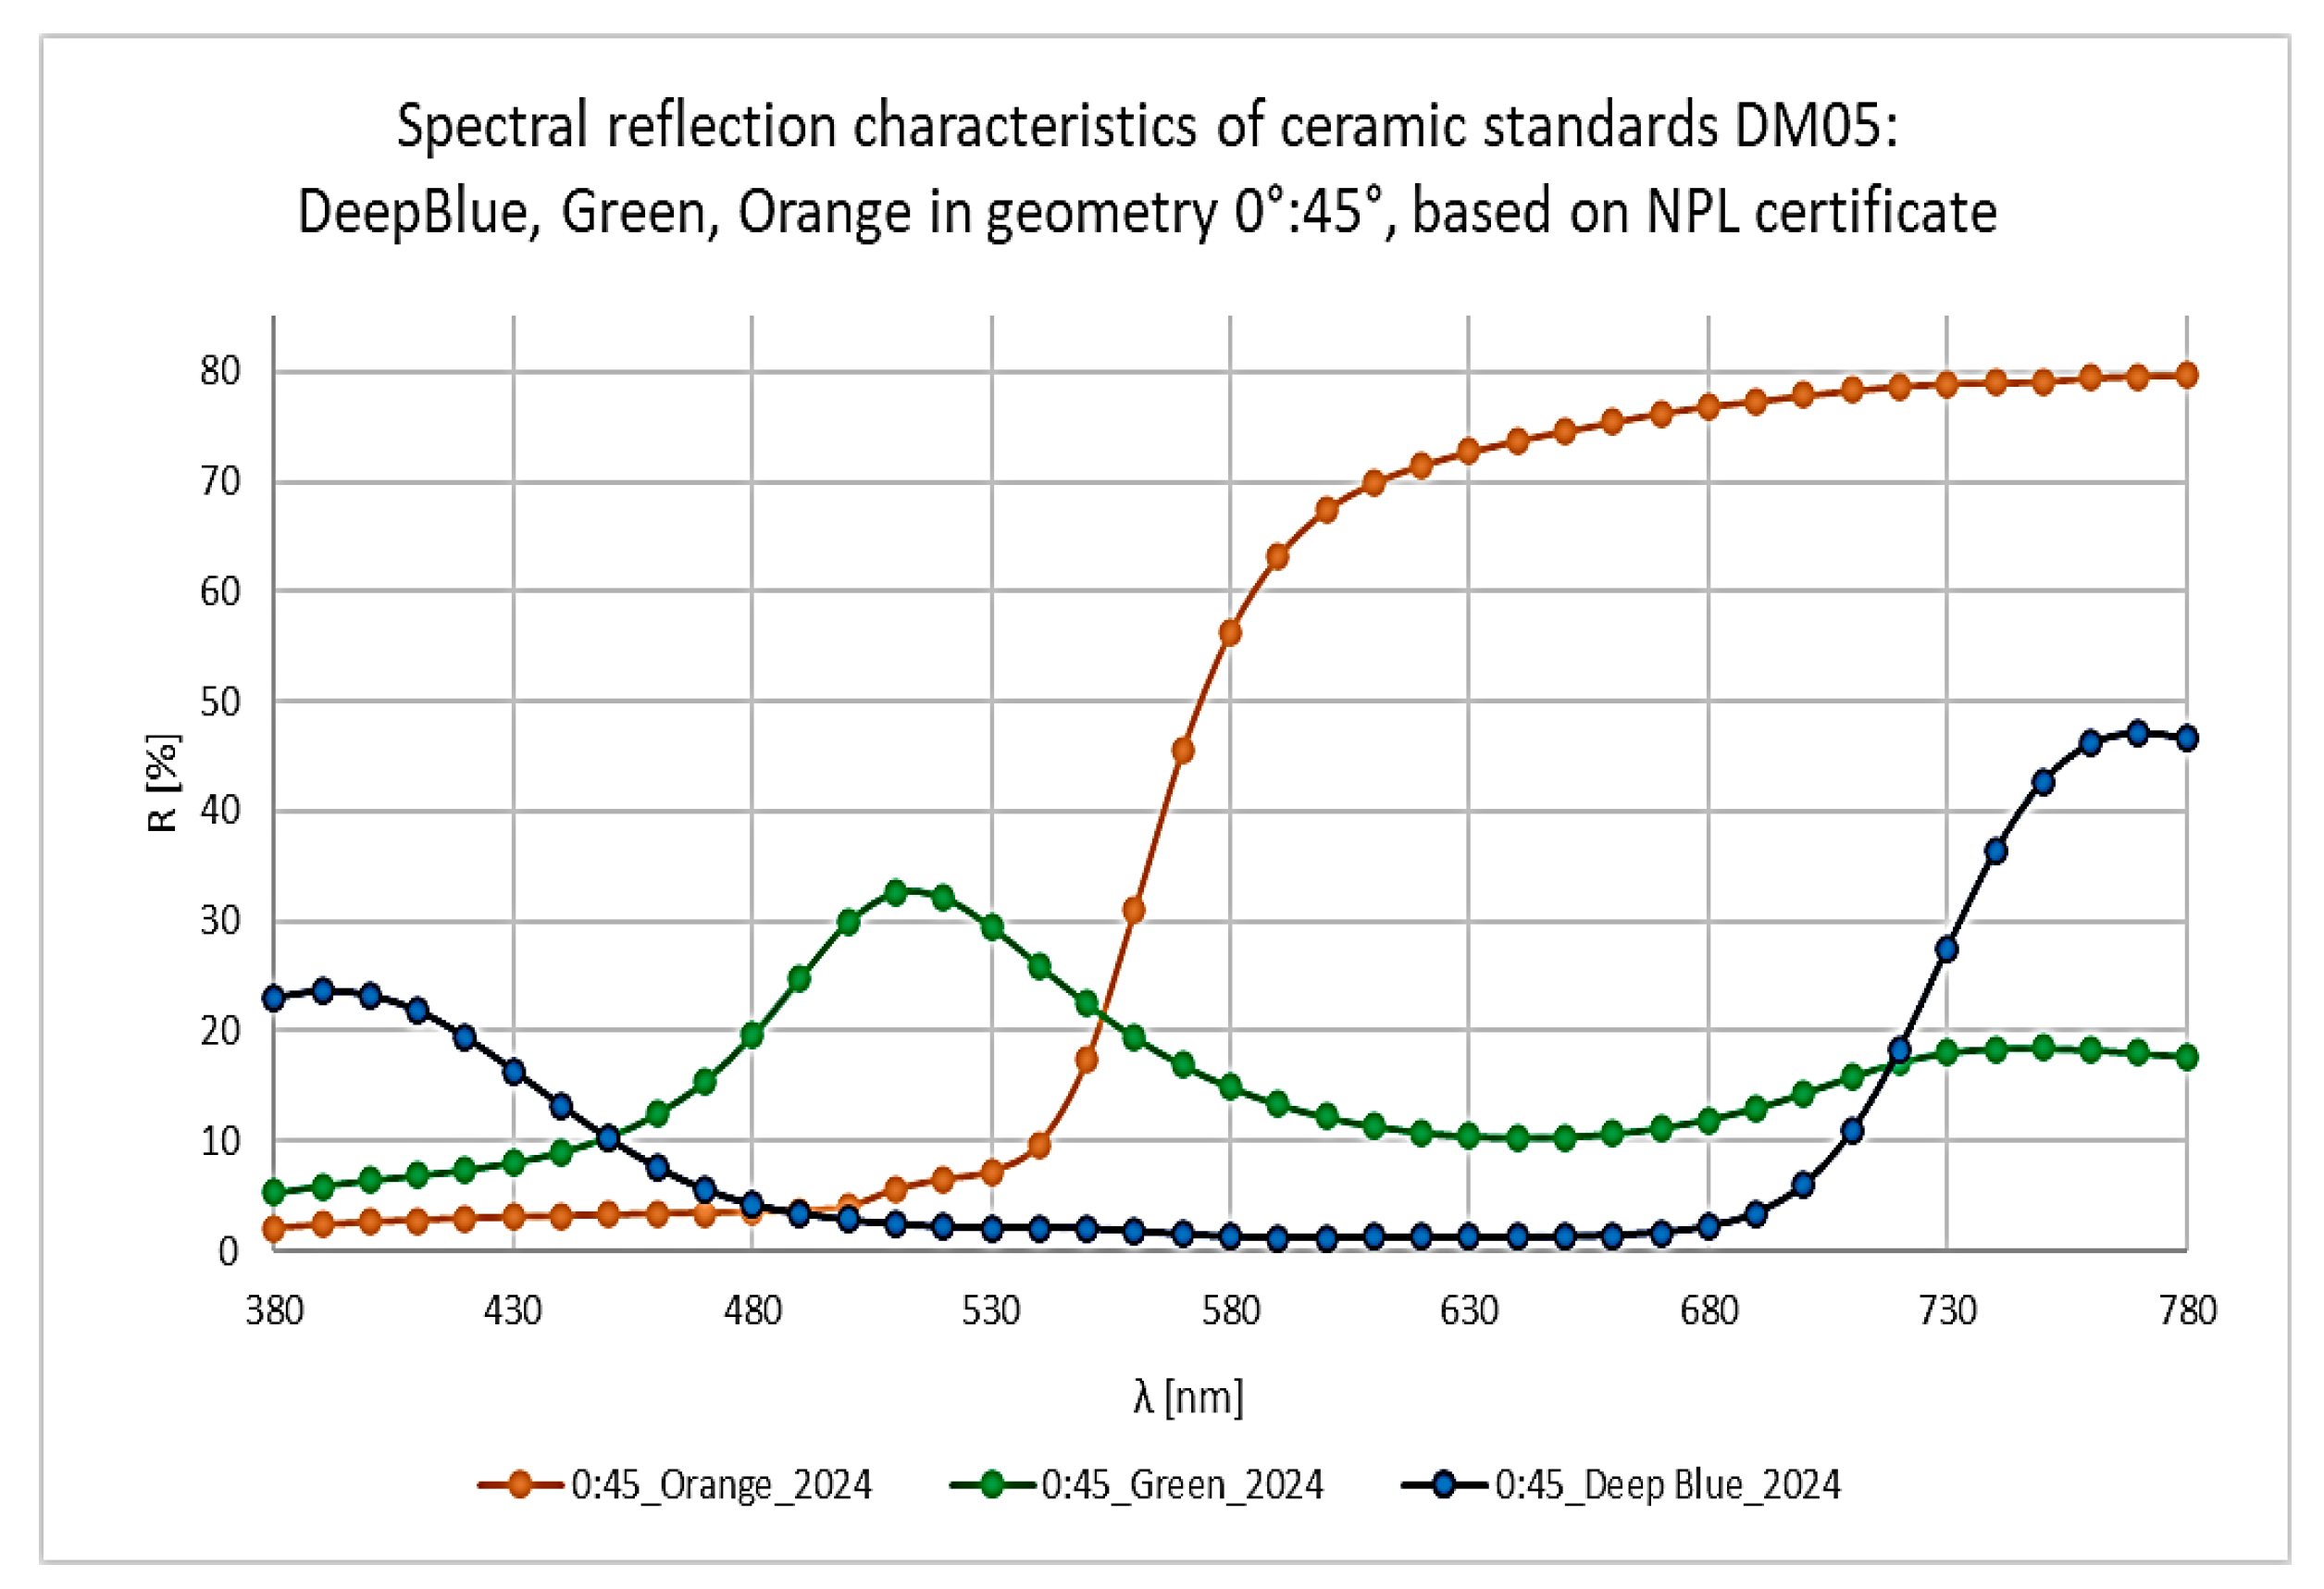
For the three selected ceramic standards of the DM05 set, the spectral reflectance graphs have been prepared on the basis of data taken from the calibration certificates made at the British national metrology institute NPL (National Physical Laboratory) in September 2024 and shown below (see
Figure 4).
The shapes of these characteristics were taken as a reference while compared with the spectral characteristics obtained in the experiments carried out here. In further considerations, the possibility of using the Helmholtz reciprocity principle for the applied measurement geometry was assumed [
9]. In this case, the results obtained in the 0°:45° geometry (from the NPL certificates) will be a good reference for the results in the inverted 45°:0° geometry applied here. The angle of 0° is one of the tested detector settings in the experiments described here (it corresponds to the angle of 45° set in the accessory), and the results obtained for other angles are compared with this setting (the beam is falling at an angle of 45° and is received at an angle of 0° to the sample).
To eliminate the effect of signal weakening recorded at increasingly distant angles on the detection of color changes using the color difference formula in the Lab system, normalization of spectral characteristic values was introduced. Normalization meant rescaling the characteristics for a given angle so that the highest value was assigned a value of 100%, and the values obtained for the remaining wavelengths were multiplied proportionally to the first multiplication. This procedure allowed for the detection and illustration of a significant color change seen for the angles close to the angle of specular reflection. The reference color was the one calculated for the specular angle (in the next approach, the one for an angle of 0 degrees, due to the geometry recommended by CIE). Graphs of color change, expressed by color difference in the Lab system, show that beyond the specular reflection zone, stabilization occurs—the color (after normalization) practically stops changing (the difference remains constant).
3. Results and Discussion
The measurements of the spectral reflectance characteristics of selected ceramic standards from the DM05 set using a Cary 5000 spectrophotometer and UMA multi-angle accessory have been made [
1,
6,
7]. In the first phase of the study, the sample angle was set to 45° and the angular range for the detector varied from 60° up to 120°.
Figure 5,
Figure 6 and
Figure 7 show the results of spectral reflectance measurements for the selected detector angles for standard samples from the Glossy Ceramic Color Standards DM05 set: Deep Blue, Green, and Orange.
Measurements carried out with ceramic reference standards from the DM05 set (see
Figure 5,
Figure 6 and
Figure 7) allowed us to notice that for a sample set at an angle of 45° and detector angular settings close to 90° (angle of incidence similar in value to the angle of reflection) the reflection is the strongest, but also the consequences of such a strong specular reflection signal cause disruptions of the expected characteristics for the considered color standards. The spectral distribution of such a gloss curve is clearly visible in
Figure 5a,
Figure 6a and
Figure 7a. At larger angular deviations of the detector, the tested reflection shows increasing similarity to the expected characteristics of the spectral reflectance, which is consistent with theoretical predictions regarding the nature of color standards (see
Figure 5b,
Figure 6b and
Figure 7b). Additionally, using the auxiliary axis, in graphs
Figure 5b and
Figure 6b, and
Figure 7b—for comparison of the shape of characteristics—spectral distributions prepared on the basis of data from the NPL certificate are shown. Spectral distributions obtained on the multi-angle accessory for angles distant from the angle of specular reflection become similar to the corresponding spectral distribution from the NPL certificate (in the measurement geometry 0°:45°). The highest obtained signal (for a detector setting angle of 90°) associated with gloss always creates almost the same spectral characteristic, regardless of the color of the standard under test.
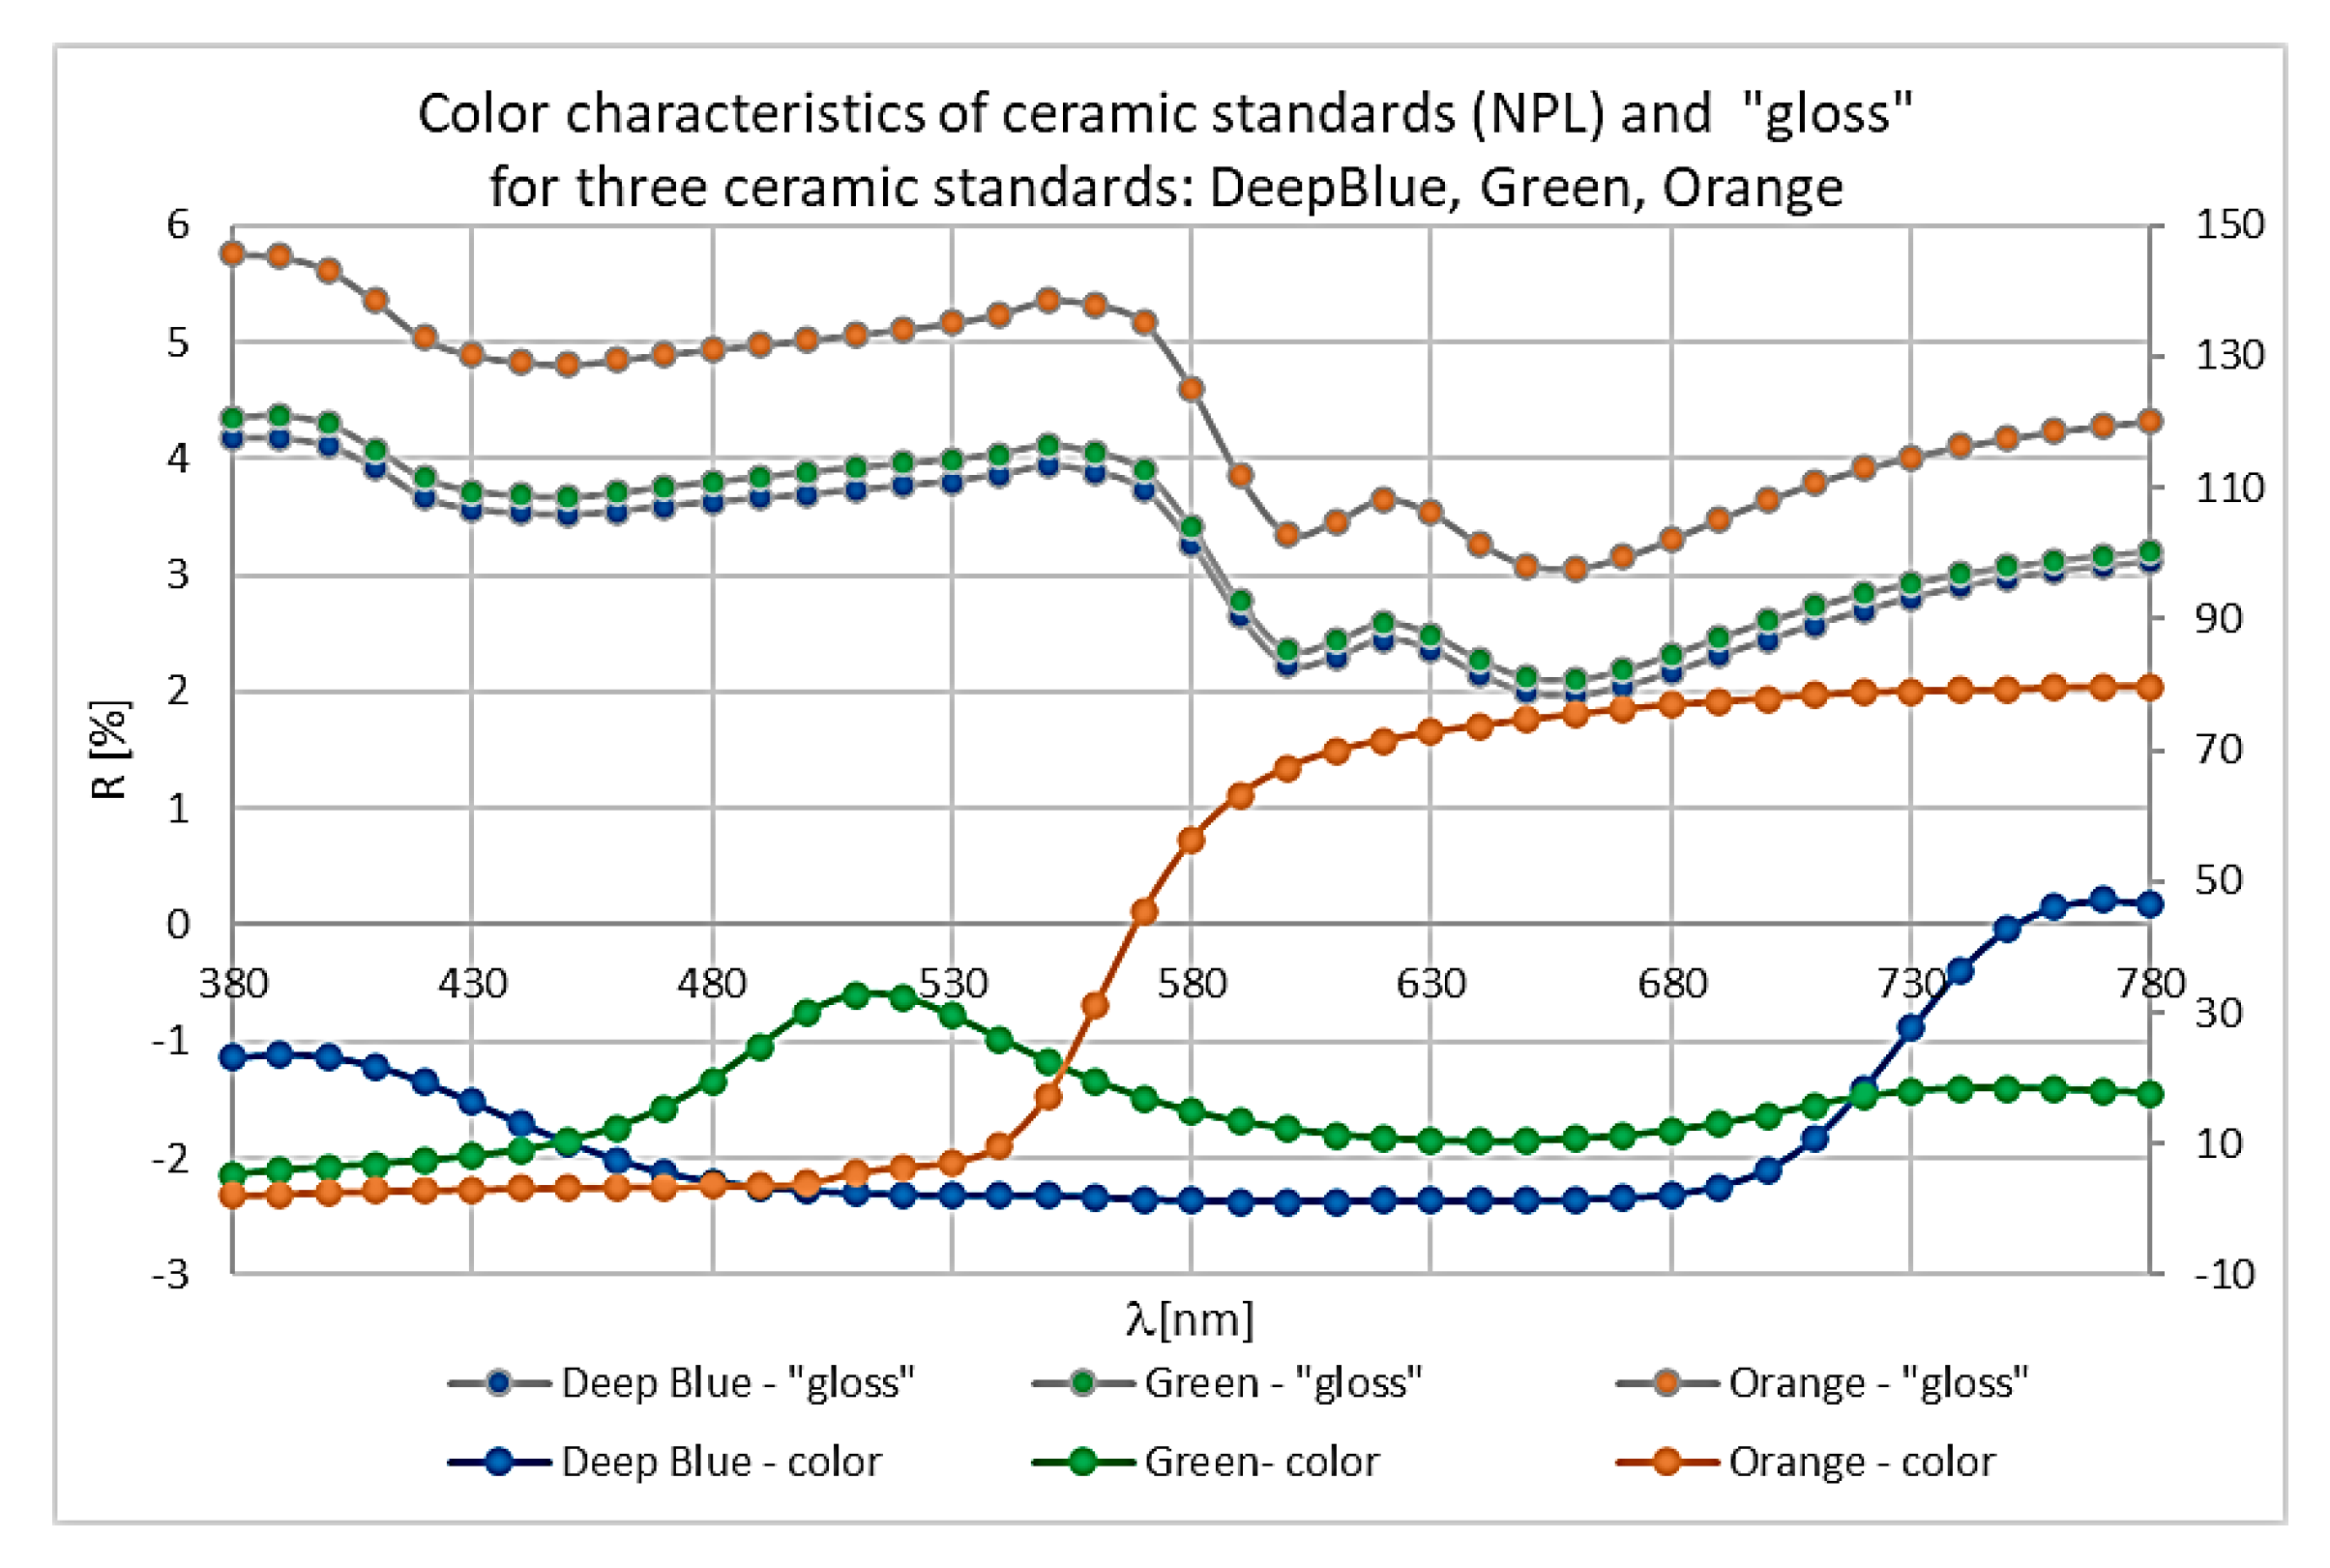
Figure 8 graphically presents a comparison of the spectral reflection characteristics prepared on the basis of the NPL certificate and the “gloss” characteristics obtained in the conducted tests. The “gloss” characteristics correspond to the spectral reflection characteristics for a detector setting angle of 90°.
Figure 8, one can see a strong similarity in the shape of the three spectral reflection characteristics for the case of specular reflection—“gloss” (curves located in the upper part of the graph). All “gloss” characteristics differ significantly from the shape of the “color” characteristics of the respective standards (located in the lower part of the graph, with values plotted on the auxiliary axis). The next step was to try to determine more precisely the angular region in which the standards lose their color properties due to the increase in the specular reflection effect. D65 illuminant and CIE 10° Standard Observer were applied. For this purpose, the variability of the color parameters used in the L*a*b* space was analyzed, and they were calculated for gradually changing reflection angles (detector setting angles) [
10,
11,
12,
13,
14,
15]. The variability was expressed as the delta E color difference value calculated based on the parameters L*, a*, and b*, occurring between the “mirror” setting, i.e., 90° (or an angle of 45° referring to the geometry from the NPL certificates) and subsequent angular settings of the detector (from −40° to 130°) [
3,
9,
13,
15].
The computational analysis was performed for measurements in the wavelength range of 400 nm to 700 nm. An aperture of 3° was applied at the detector opening. On this basis, the relative constancy of the color of a given sample was verified for the light reflected at different angles in the entire available hemisphere.
The computational procedure was as follows:
The measurements were used to obtain spectral values of the reflection recorded at the currently selected angle. In order to eliminate the effect of weakening of the signal (with a distance from the mirror reflection position) on the value of the determined parameters L*, a*, and b*, these signals were normalized, i.e., each characteristic was recalculated in relation to the highest signal value obtained for a given detector angle;
The L*, a*, and b* (also known as CIELAB) color space coordinates, defined by CIE in 1976, are calculated using the following equations [
1,
10,
11,
12,
13,
14,
15]:
where
X, Y, and Z—tristimulus values for CIE 10° Standard Observer,
Xn, Yn, and Zn—tristimulus values for CIE 10° Standard Observer for a white reference standard, that is, for R(λ) = 1.
Tristimulus values X, Y, and Z are defined by the following CIE formulas [
1,
10,
11,
12,
13,
14,
15]:
where
R(λ)—spectral reflectance of the sample under test (the signal reflected from the sample at a given angle measured by the detector);
S(λ)—relative spectral power distribution of the illuminant D65;
(λ) (λ), and (λ)—color-matching function for the CIE 10° Standard Observer.
From the above relations, a value expressing the distance ΔE between points in the uniform L*a*b* color space was determined, where the first point was determined by the calculated colorimetric parameters for the reference angle of 90° (or 45°), and the second point was determined by the parameters obtained for successively changed detector angles (−40° to 130°) [
1,
10,
11,
12,
13,
14,
15]:
where
Lref *, aref *, and bref *—reference values of the parameters L*, a*, and b*, characterizing the color of the standard, for a detector angle of 90° (or 45°);
Ln *, an *, and bn *—values of the L*, a*, and b* parameters characterizing the color of the standards, calculated on the basis of the measured signal for different detector angles set in the range from −40° to 130°.
Table 1 shows an example of calculation results obtained for the Deep Blue standard at a reference angle of 90°.
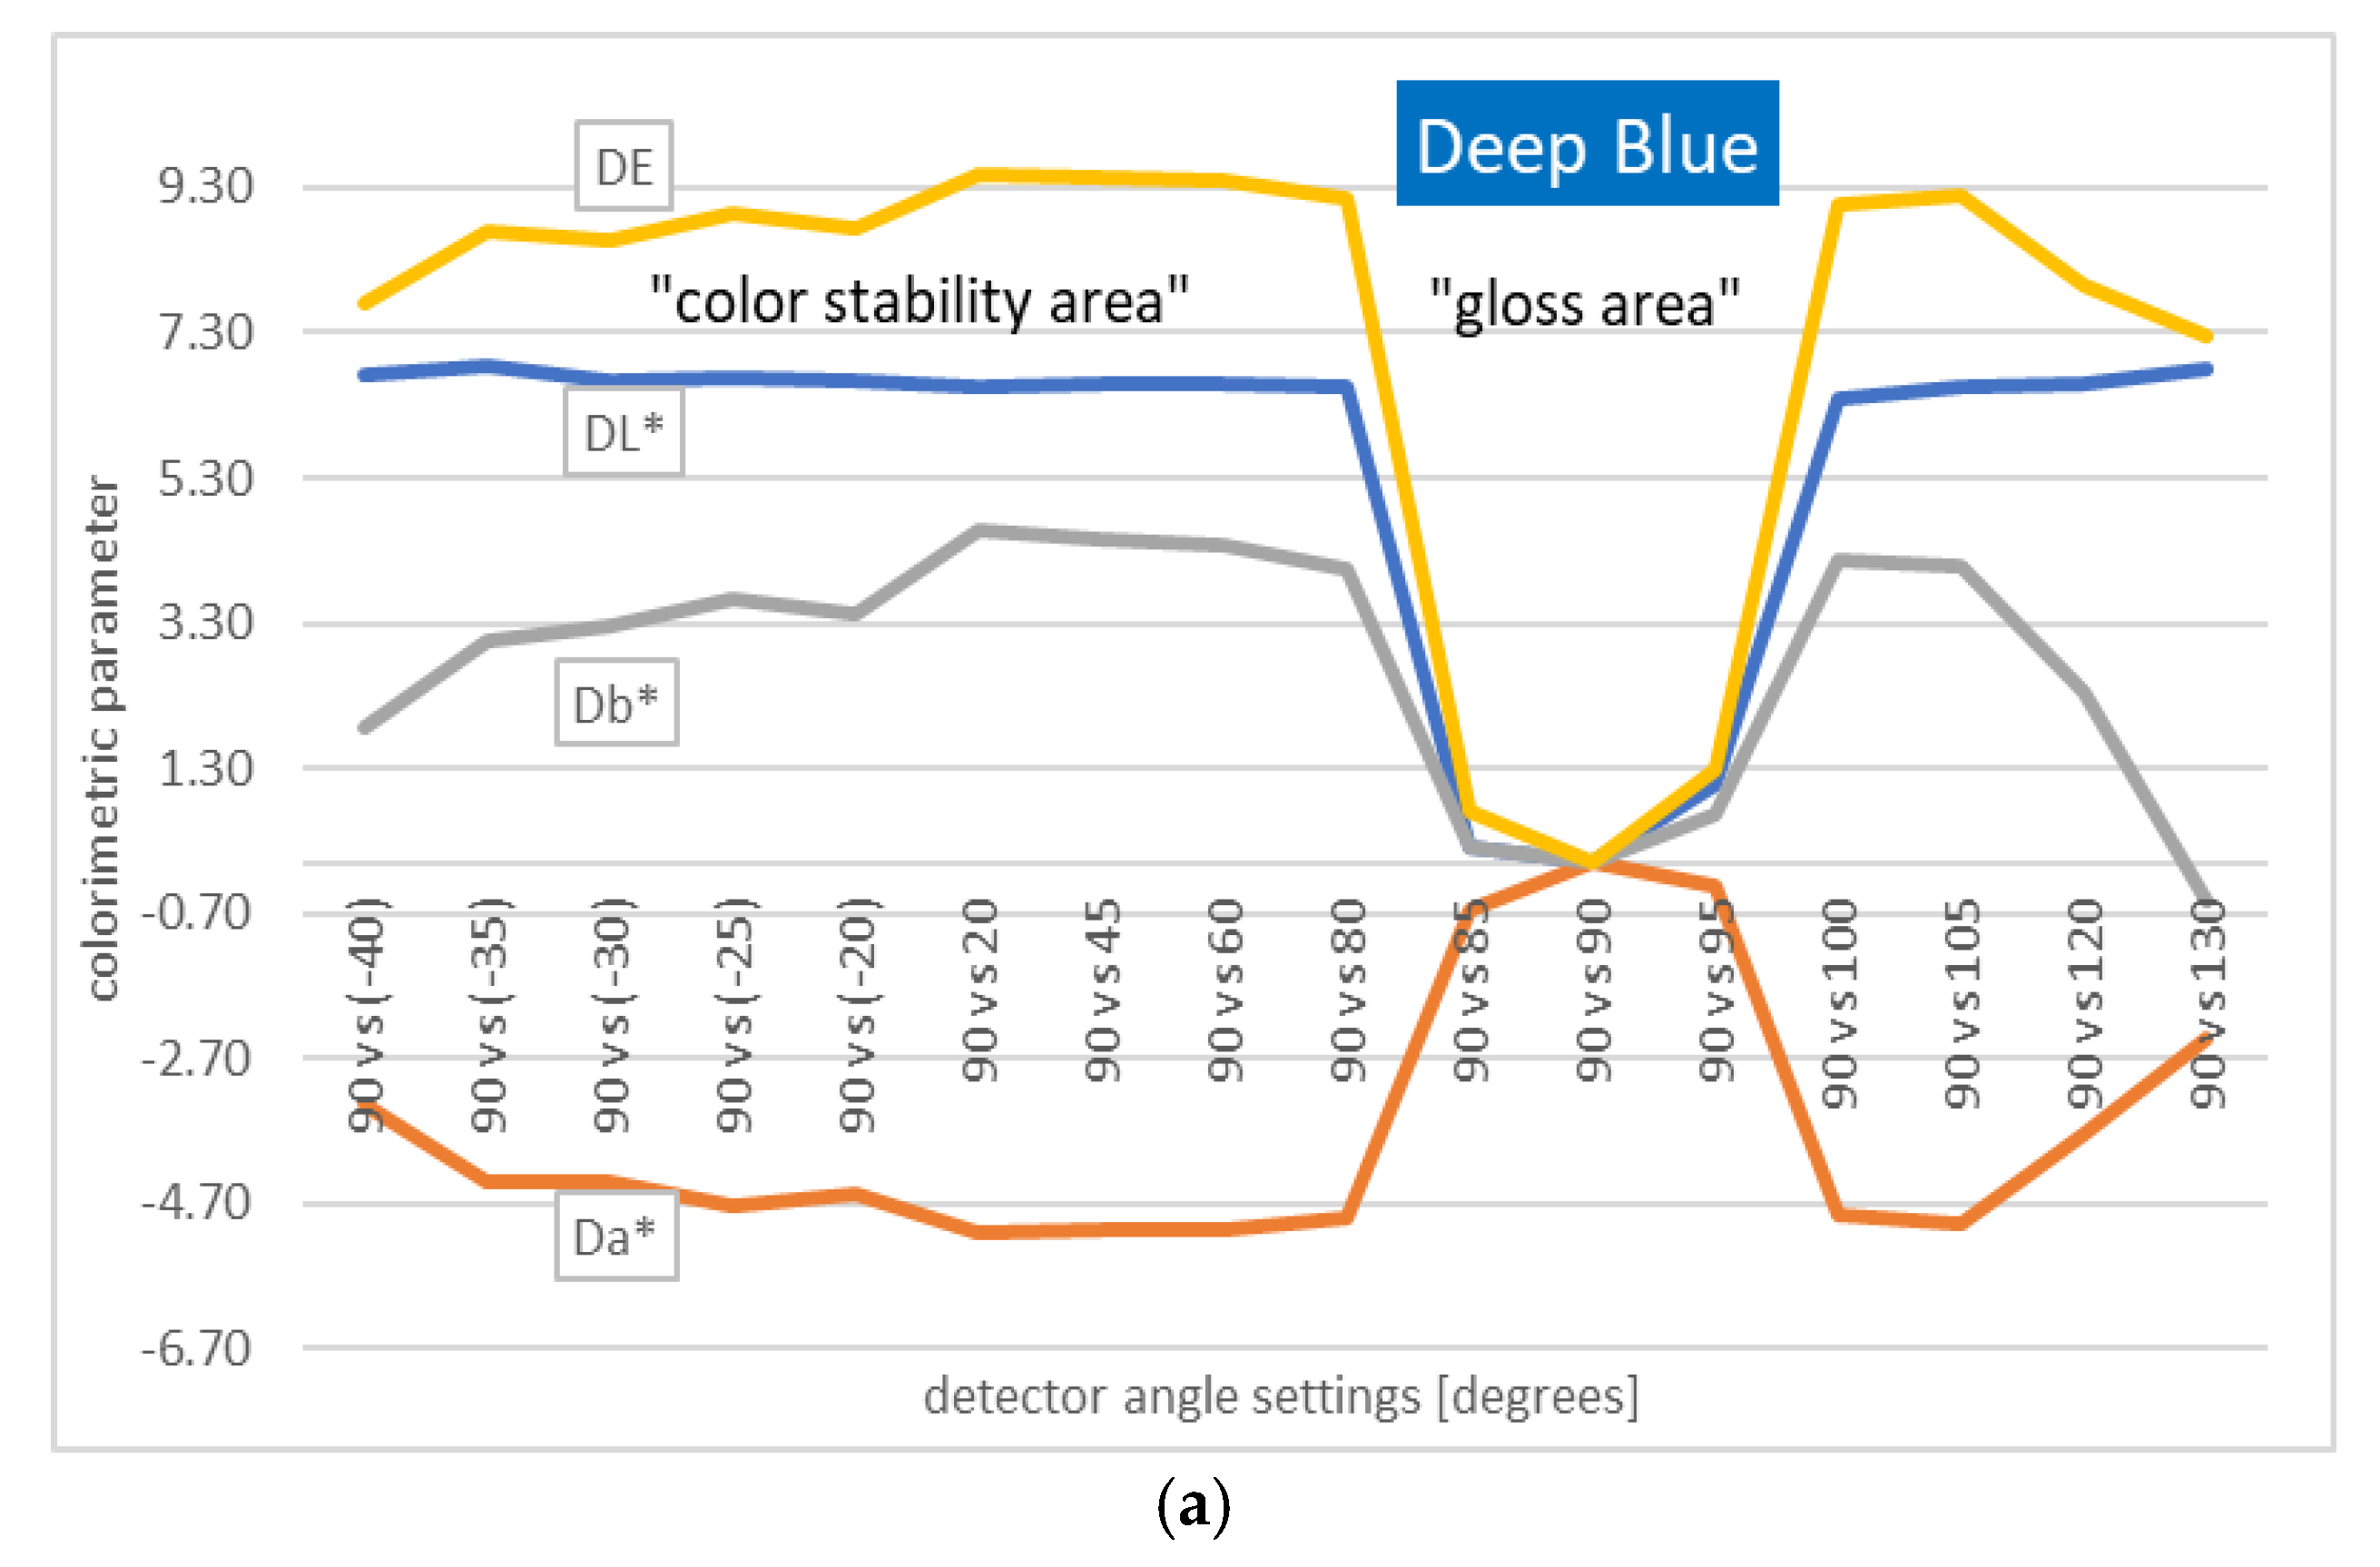
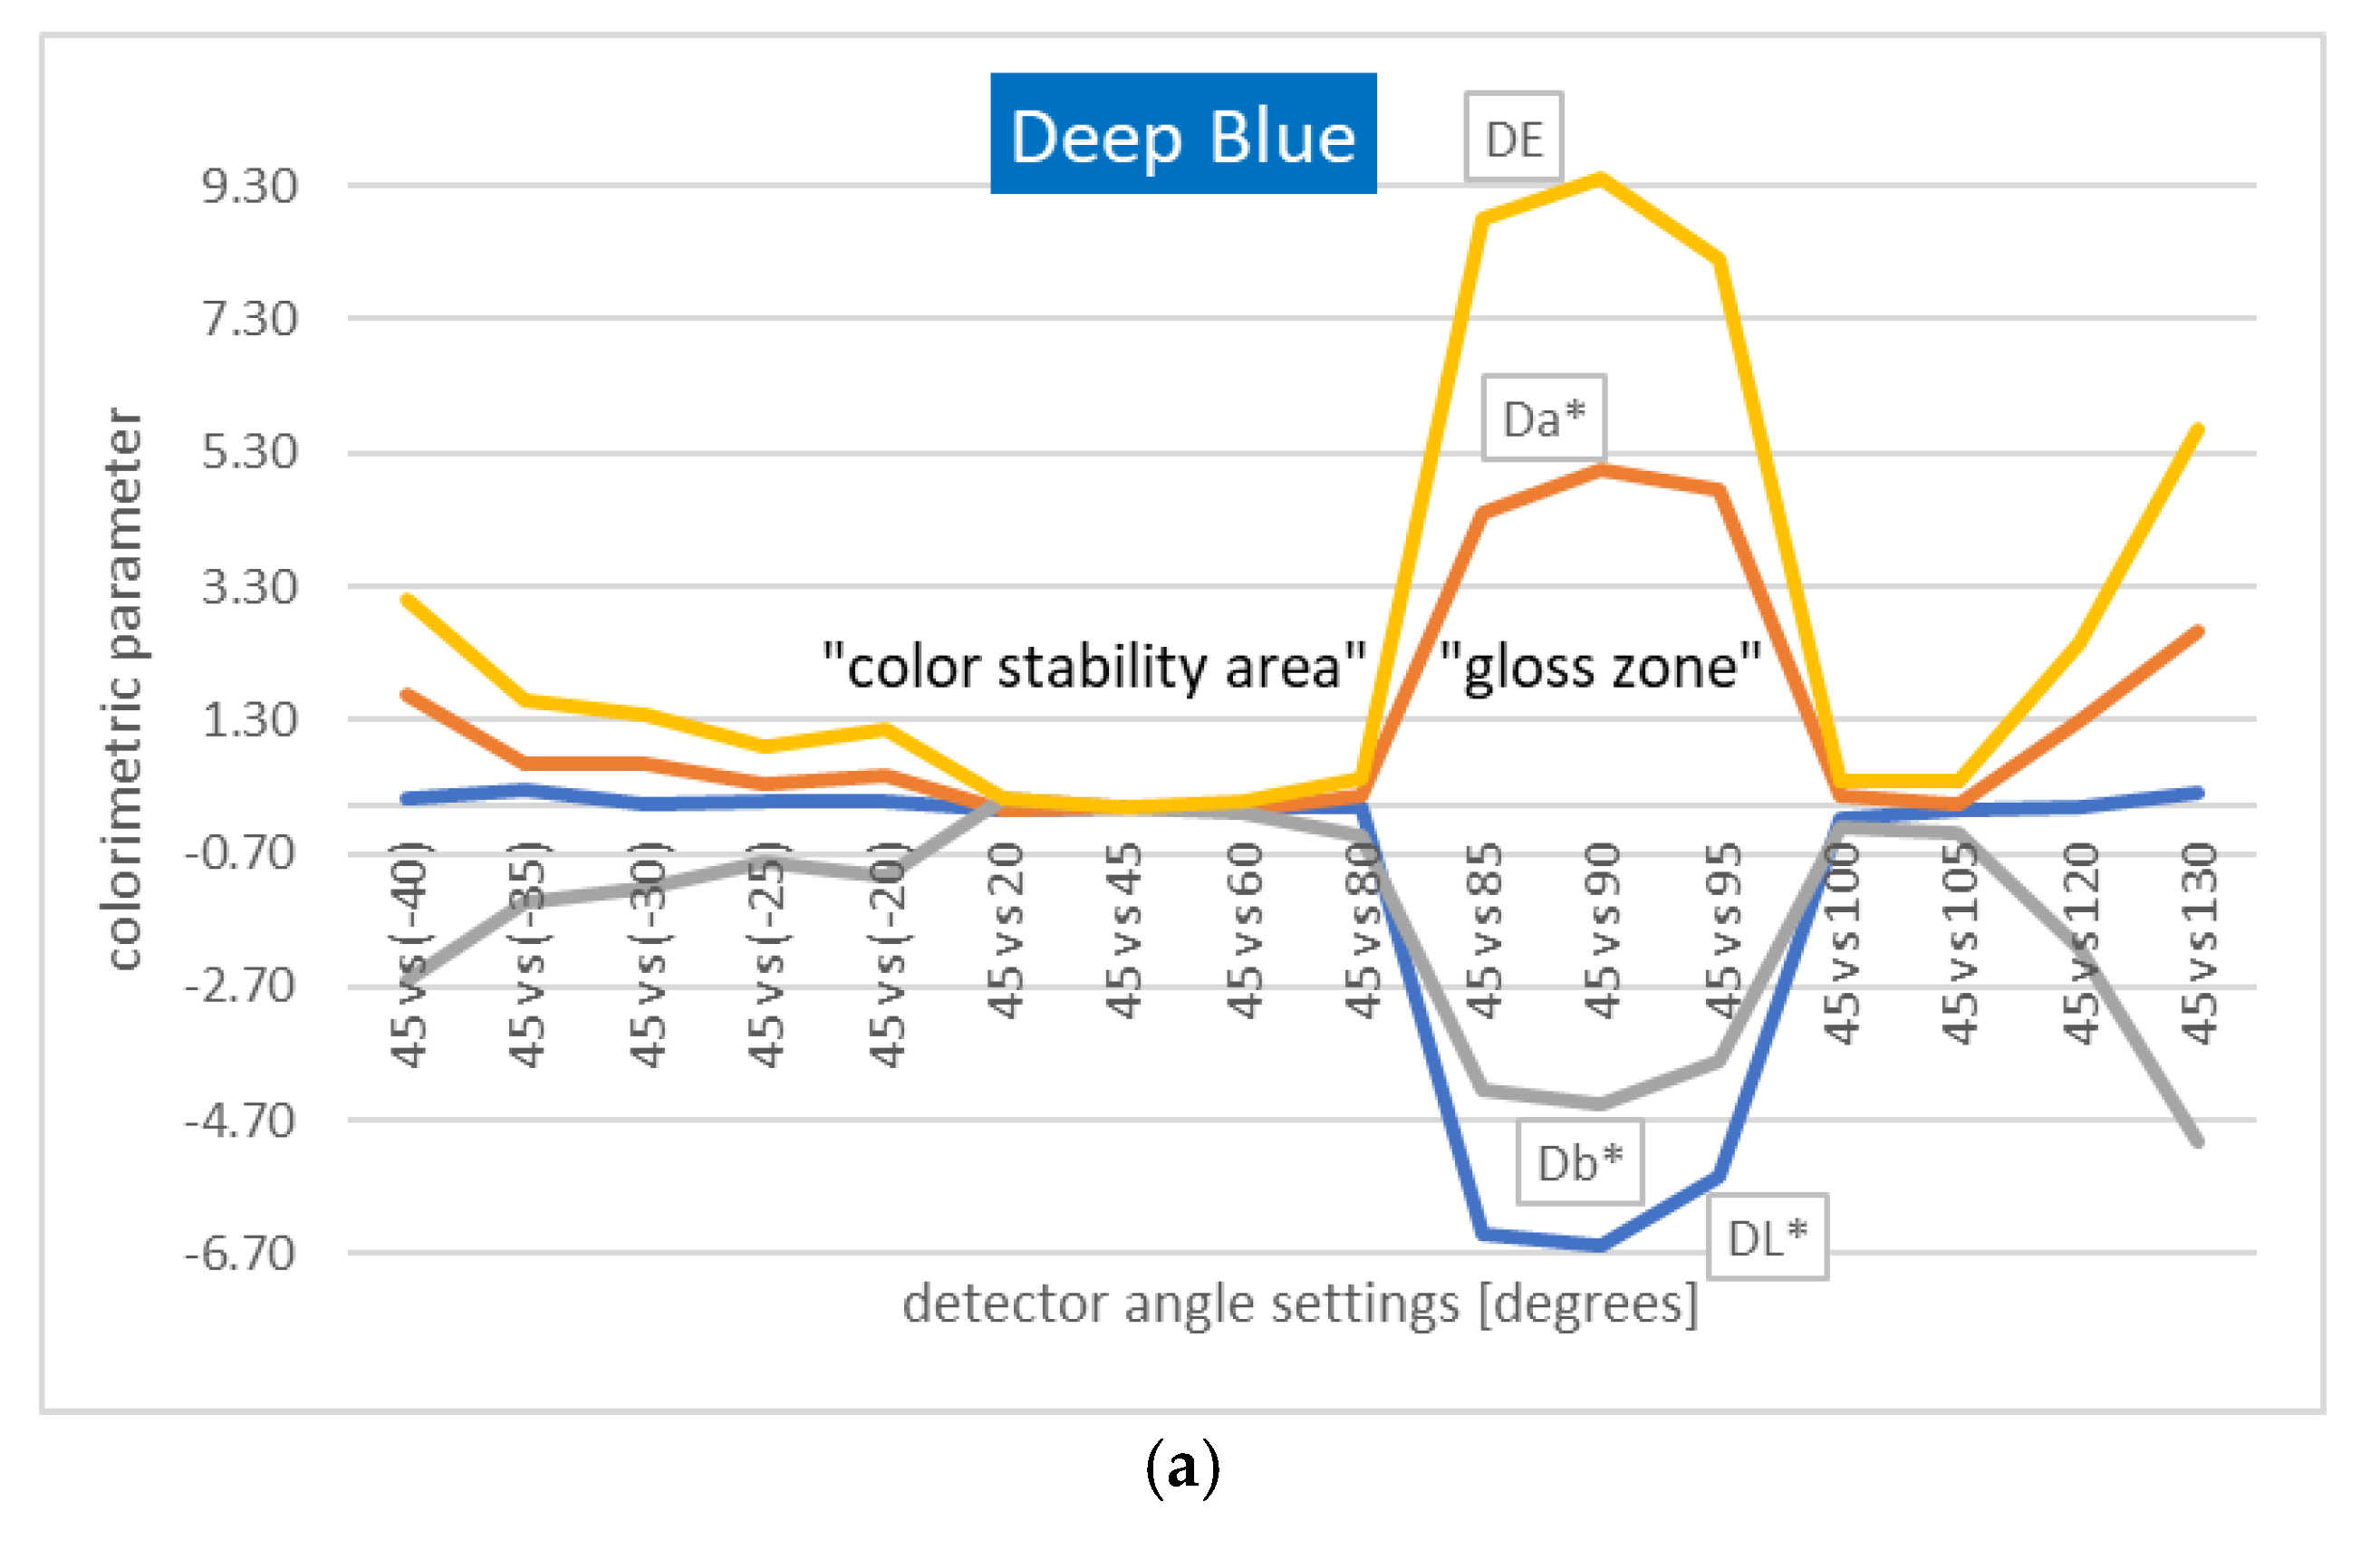
Figure 9a–c presents a graphical illustration of the obtained changes in color parameters with respect to the reference parameters obtained for a detector angle setting of 90° (see
Figure 9a–c).
In
Figure 9a–c, the ordinate axis shows the differences between the corresponding parameters obtained at the reference angle of 90° and the values of these parameters obtained for all other angles (range from −40° to 130°). The axis of abscissas shows the angular settings of the detector. For all the discussed standards, a similar behavior related to the color decay can be observed: a disturbance in the constancy of the parameters L*, a*, and b* and Δ
E (DE) is visible starting from the measurements for the reflection angle of 80°, through the maximum signal of 90°, to the angle of 100°. The color difference between the measurement in the mirror reflection and positions at least ±10° away from the mirror reflection angle reaches values in the range of 6.5 ÷ 12, which means that we are talking about a completely different color than that recorded at the other observation angles. It is assumed that an average observer notices the difference between two colors only at ΔE (DE) values (in the L*a*b* system) greater than 2.
In the edge zones, there are visible decreases in the constancy of the color characteristic for the colorimetric parameters and the color difference Δ
E, which may be related to the greater influence of noise on the reading when a low signal of reflected light is measured for such distant angles. In order to link the research results to the measurement geometry of 45°:0°, which is widespread in colorimetry, a similar analysis was carried out for the reference angle of 45° (corresponding to the angle of 0° calculated with respect to the sample, not the detector as everywhere else).
Table 2 presents an example of calculation results obtained for the Deep Blue standard and
Figure 10a–c shows a graphical illustration of the changes in color parameters with respect to the reference parameters obtained for a detector angle of 45°.
In
Figure 10a–c, the ordinate axis shows the differences between the corresponding parameters obtained at a reference angle of 45° and the values of these parameters obtained for all other angles (range from −40° to 130°). For all the discussed standards, a similar change (increase) of the color difference ΔE (DE) can be observed in the zone of the appearance and subsequent disappearance of gloss, occurring from the detector setting angle of 80°, through the maximum at 90°, up to the angle of 100° (see
Figure 10a–c).
All the colorimetric parameters L*, a*, and b* as well as the color difference ΔE (DE) in this zone differ significantly from the reference value (for a detector angle of 45°), which is caused by the dominant share of the “gloss” effect in the tested reflection signal.
Similarly to the case of the 90° reference detector angle, the disturbances in the color stability characteristic for extreme values of the observation angle (below −35°, above 105°) are visible, which is related to the reception of an increasingly weaker signal in these extreme zones.
4. Conclusions
Based on the results of preliminary spectral characteristics studies and calculations of color parameters in the L*a*b* system, it was found that the DM05 set standards illuminated at an angle of 45° significantly changed their color properties when reading the detector located in the zone from 80° to 100° due to the increase in the specular reflection (gloss) effect. These studies contribute to a better understanding of the properties of the standards used in the Central Office of Measures, especially in the context of the potential extension of the laboratory’s competences to the calibration of multi-angle reflectance spectrophotometers. They also allow for expanding knowledge about the measurement capabilities of the spectrophotometer with a multi-angle attachment used for these experiments. Based on the obtained research results and conclusions drawn from them, further attempts will be made to obtain a more complete characterization of the spectral reflectance standards from the DM05 set. Special attention will be paid to the “gloss” area, as well as to supplementing the characteristics with a more detailed analysis of the extreme angles of observation of reflected light. In the further part of the research, it is also planned to examine standards made of other types of materials than ceramics (e.g., Teflon standards).
Additionally, the research can be extended to include analysis attempts for other angles of sample setting (and corresponding angles of detector setting), in order to obtain further information on the color stability of the characteristics of standards in a different angular information on the standards used, which in consequence will help to achieve an increased accuracy of transferring units of measurement during the calibration of standards and measuring instruments carried out at the Central Office of Measures in Warsaw, Poland.


