1. Introduction
With the development of optical communication technology and the growing demand for marine applications, underwater wireless optical communication (UWOC) has gradually come into sight. Compared with the traditional acoustic communication, UWOC has advantages of wide bandwidth, high data rate and high security [
1]. To improve the transmission performance of UWOC systems, vortex beams carrying orbital angular momentum (OAM) have attracted much attention [
2]. Since OAM modes with different topological charges are orthogonal to each other, they can serve as a new degree of freedom for coding and multiplexing [
3]. So in addition to conventional time-division and wavelength-division multiplexing, mode-division multiplexing of multiple OAM states can also be applied to vortex beams for higher capacity.
However, the presence of temperature and salinity gradients in oceans induces oceanic turbulence and then causes fluctuations in the seawater refractive index [
4]. These random fluctuations lead to beam spreading, wander and wavefront distortion during propagation. Since OAM is closely related to the spatial structure of the beam wavefront, wavefront distortion will cause crosstalk among OAM eigenmodes inevitably and degrade the transmission performance of the vortex beam [
5]. Thus, mitigating the impact of oceanic turbulence on beam propagation has become an important issue for the construction of a UWOC link.
The optical effects of oceanic turbulence are determined by the spatial power spectrum of refractive index fluctuations, whose main contribution factors are the variations of seawater temperature and salinity [
6]. Many researchers have conducted in-depth studies on this matter in recent years and developed theoretical models accordingly. By using equal eddy diffusivities of temperature and salinity, Nikishov et al. combined the scalar spectra of temperature, salinity and their co-spectrum together to obtain the total power spectrum of stably stratified oceanic turbulence [
7]. Elamassie et al. considered the case where the eddy diffusivities of temperature and salinity were not equal, and developed the turbulence spectrum for unstably stratified condition. But the expressions of scalar spectra combined in this model were relatively complex and limited the analytical efficiency in practical applications [
8]. Further, Yao et al. proposed the oceanic turbulence optical power spectrum (OTOPS) model for unstable stratification but with more concise theoretical expressions. Moreover, the effects of temperature and salinity can be quantitatively analyzed over a wide range rather than at some fixed values, which means the spectrum has good applicability to various natural waters [
9].
In addition to the properties of oceanic turbulence, the field characteristics of different vortex beams have also been explored for communication system optimization. Doster et al. analyzed the channel efficiency and bit error rate of a Bessel–Gaussian beam whose non-diffraction exhibited resistance to turbulence interference [
10]. Further, Wang et al. studied a non-diffracting circular Airy beam and found that its self-focusing property could not only enhance beam intensity but also extend propagation distance in a turbulent channel [
11]. Yang et al. investigated the self-focusing of an OAM-entangled Airy beam and demonstrated its effectiveness in mitigating wavefront distortion induced by turbulence [
12]. However, the spot sizes of above beams increase with topological charge rapidly, which is disadvantageous to multiplexing of different OAM modes in a fixed receiving aperture. Instead, Ostrovsky et al. proposed a circular perfect optical vortex (CPOV) beam with initial ring width and radius independent of topological charge [
13]. Zhu et al. demonstrated the generation of a CPOV using a spatial light modulator experimentally and its propagation characteristics in free space [
14]. The self-focusing property of a CPOV was revealed by Wang et al., which could be tailored by field adjustment to enhance the transmission performance for different scenarios [
15].
Based on the investigations on vortex beams with circular transverse intensity profile, elliptical vortex beams with more generalized forms of light field have been paid attention. The introduction of the elliptical factor brings more adjustable and diverse field distributions. Xie et al. generated an elliptical Airy beam experimentally, which had asymmetric intensity profiles and self-focusing behavior with significant intensity enhancement at the focal point [
16]. Kotlyar et al. proposed an efficient method to generate an elliptical perfect optical vortex (EPOV) beam using a pure phase diffractive element. Similar to a CPOV beam, the initial horizontal and vertical radii of the EPOV beam were independent of topological charge [
17]. Das et al. investigated the evolution of field intensity distribution in free space and demonstrated that an EPOV beam also exhibited self-focusing characteristics [
18]. However, the OAM mode propagation of EPOV beams in turbulent oceanic channels has not been reported. The effects of beam self-focusing in combination with elliptical field profile on mode propagation performance remain to be explored.
In this paper, the mode detection probability and average capacity of an EPOV beam are investigated in oceanic turbulence. By using the turbulence power spectrum described by the OTOPS model, the turbulent conditions are constructed under various oceanic temperatures and salinities. Theoretical expressions are derived for mode propagation analysis, based on which the self-focusing effect for turbulence resistance is discussed. The influences of elliptical field distribution and other beam parameters on self-focusing effect are investigated in order to improve propagation performances. Some instructive conclusions are obtained for EPOV beam optimization in underwater communication.
2. Theoretical Analysis
Generally, a CPOV beam can be generated at the focal plane by conducting a Fourier transform of a Bessel–Gaussian beam with a lens. If the Bessel–Gaussian beam is stretched horizontally or vertically before being transformed, an EPOV beam is obtained. Similar to the field expression of a CPOV beam, the complex amplitude
of an EPOV beam at the source plane is expressed as [
18]
where
is the constant amplitude at the focus in source plane,
and
are the radial and angular coordinates, respectively,
are Cartesian coordinates and
is the elliptical scaling factor. If considering the horizontal stretching of the Bessel–Gaussian beam, the EPOV beam is compressed horizontally after Fourier transform with parameter
.
and
are the initial half-ring width and ring radius in the horizontal direction, respectively, while
and
are the corresponding values in the vertical direction.
is the topological charge and
denotes the modified Bessel function of the first kind.
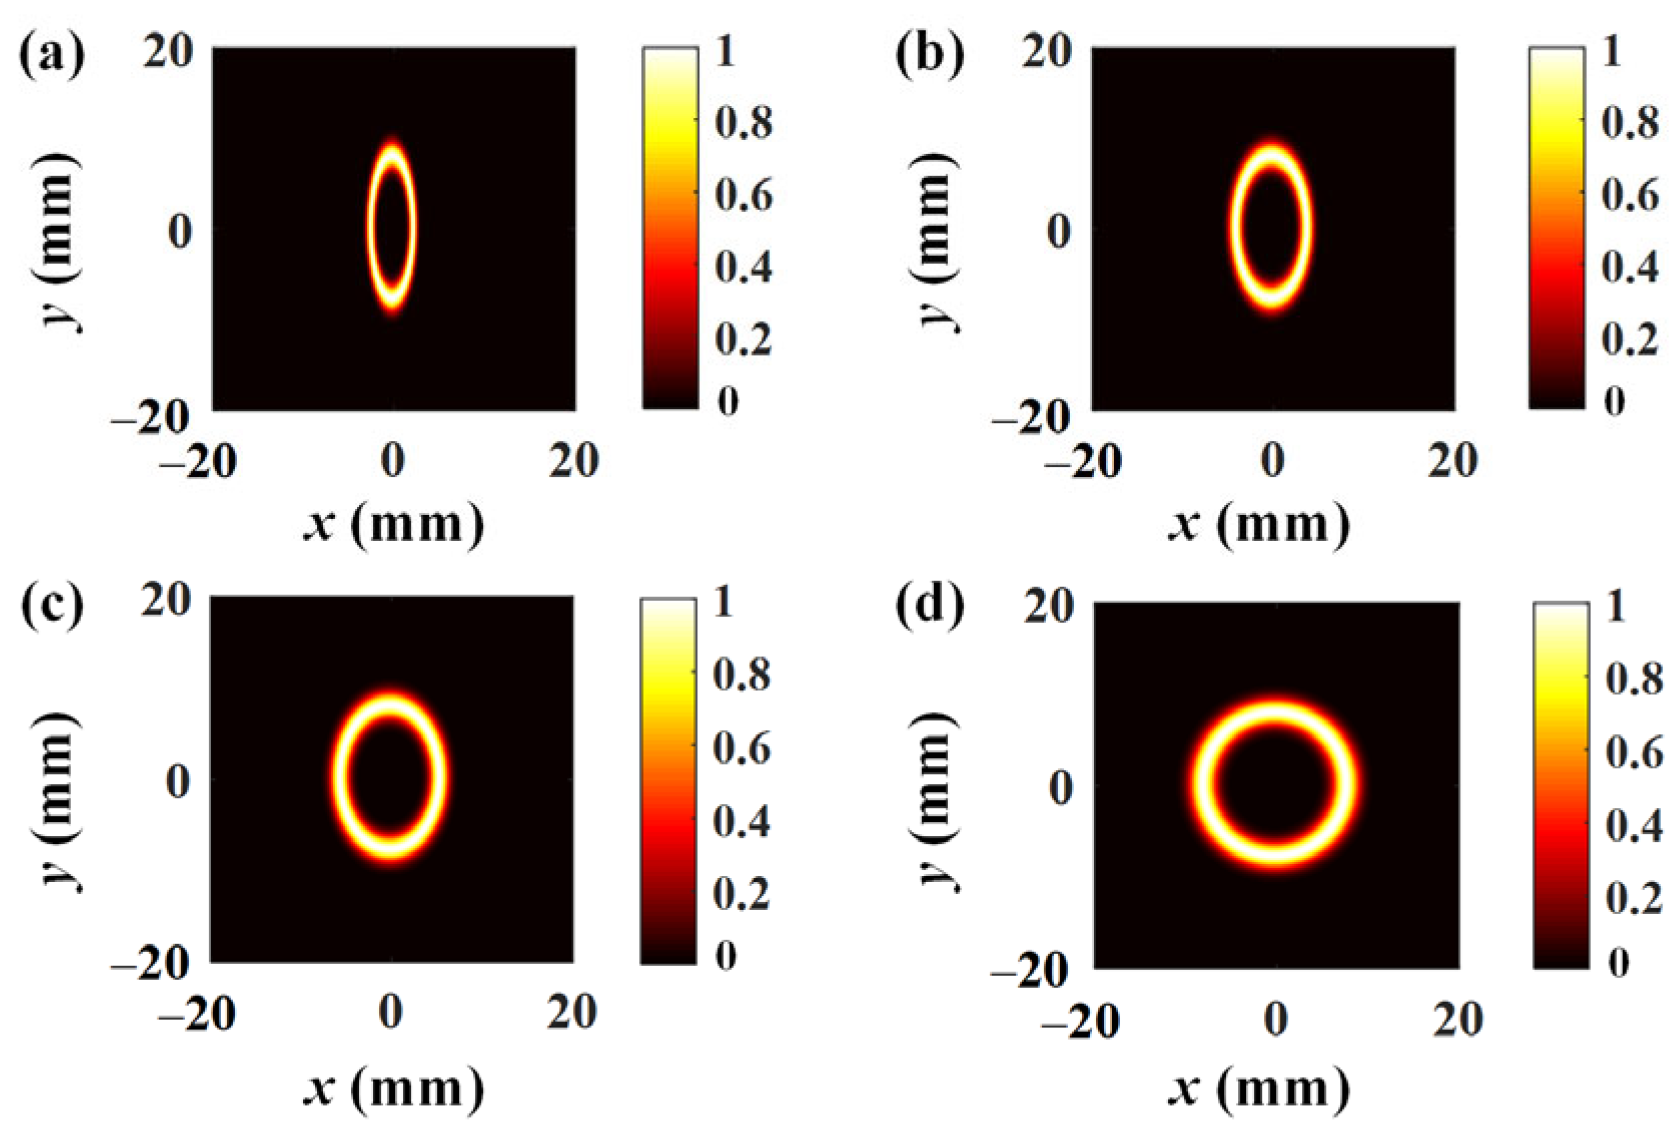
Figure 1 illustrates the normalized transverse intensity distribution of an EPOV beam with the elliptical scaling factor
at the source plane. The horizontal half-ring width
and ring radius
of the EPOV beam are not equal to the vertical ones due to the definitions of
and
, which are quite different from the conventional CPOV beam with the same half-ring width and ring radius in all directions. With the increment of
, the elliptical profile of the beam field becomes less pronounced. When
, the field degenerates into a circular symmetric distribution, which means that the EPOV beam converts into a CPOV beam. Compared to a CPOV beam mainly regulated by half-ring width and ring radius, the introduction of elliptical scaling factor offers an EPOV beam more diverse field patterns and more flexibility for adjustment in applications.
Then by using the extended Huygens–Fresnel principle, the complex amplitude expression
of the EPOV beam at arbitrary propagation distance
in free space is obtained in the form of [
18]
where
and
are the radial and angular coordinates, respectively,
is the wavenumber and
is the wavelength.
,
and
are three defined variables with corresponding expressions of
,
and
.
is the Bessel function of the first kind.
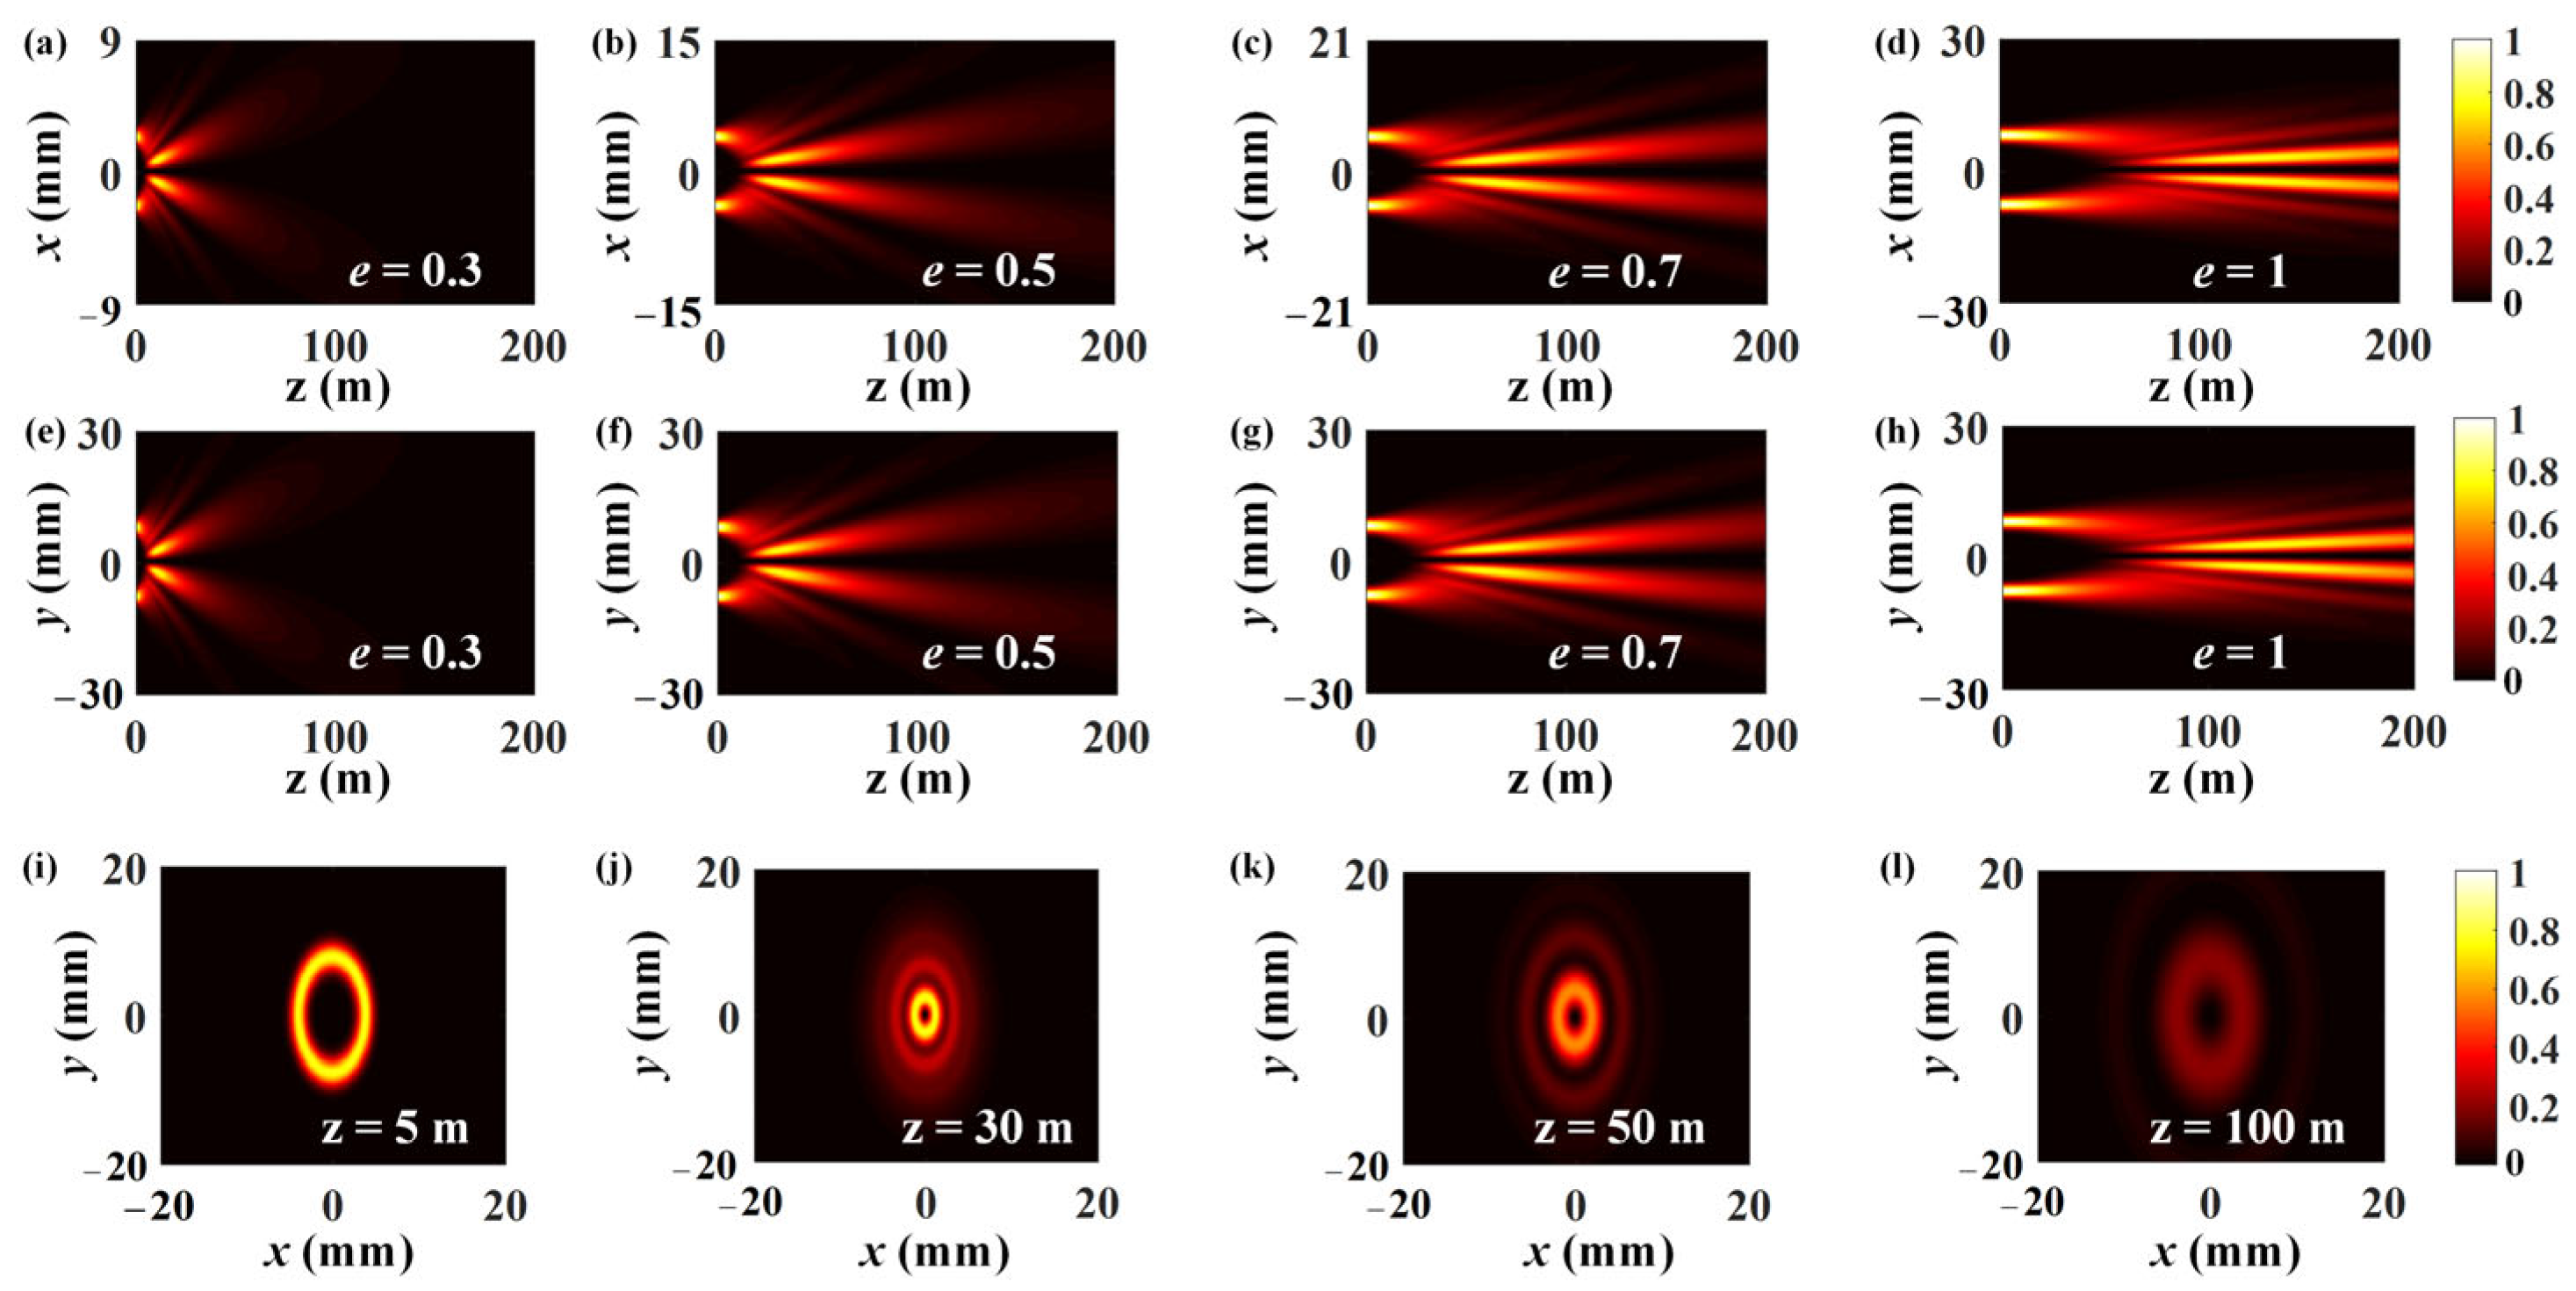
According to Equation (2), the intensity profiles of the EPOV beam (
) and the CPOV beam (
) under different propagation distances
are shown in
Figure 2, which reveals that both beams have self-focusing characteristics during propagation. The field evolutions of the EPOV beam in the
plane and the
plane present similar trends and can be divided into two stages, i.e., a non-diffraction stage and a self-focusing stage. In the first stage, the EPOV beam presents an inherent anti-diffraction property as the Fourier pair of the Bessel–Gaussian beam. But the single-ring structure of the transverse field as shown in
Figure 2i can only maintain within a limited propagation distance. Meanwhile, in the second stage, the transverse field changes to a multi-ring structure with more energy concentrated in the main lobe, as shown in
Figure 2j–l. After the beam spot shrinks and the self-focusing intensity reaches its peak, the beam size and energy gradually become divergent if the propagation distance further increases.
Figure 2 also demonstrates that the variation of elliptical scaling factor
has a significant effect on the self-focusing behavior of the beam field. When
increases, the self-focusing position locates farther from the source and the self-focusing region lasts longer. In this way, the propagation performance of the EPOV beam can be regulated.
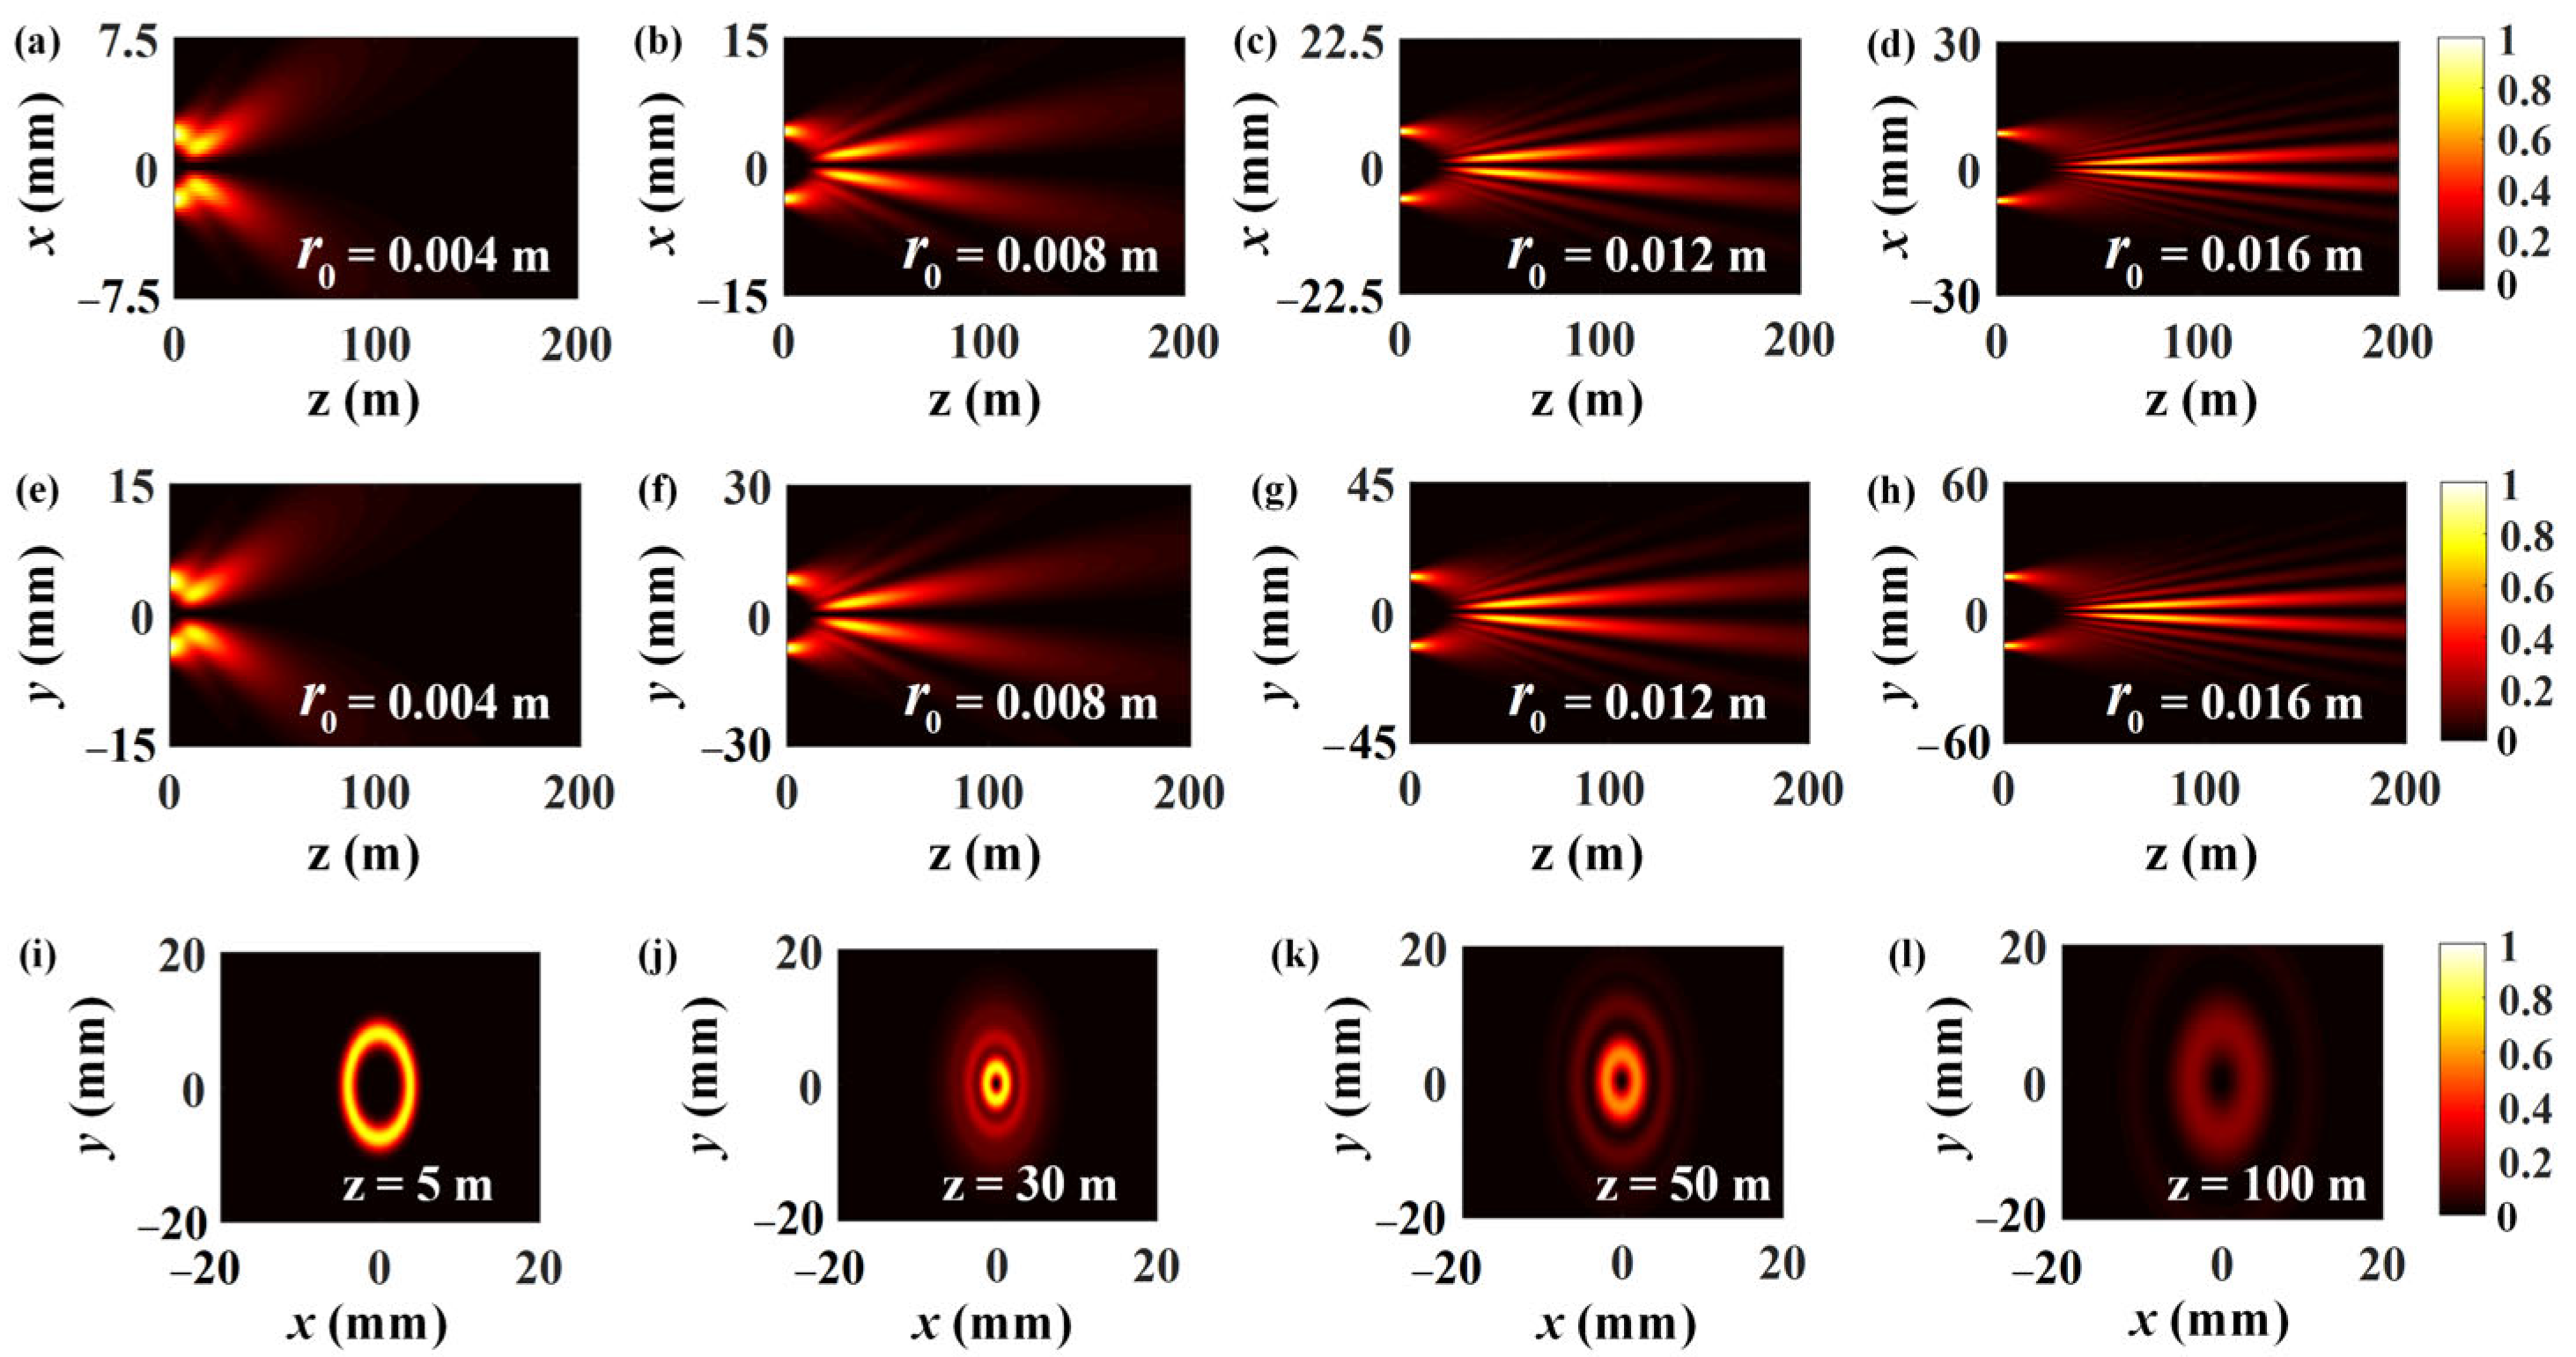
The longitudinal intensity profiles of the EPOV beam in the
plane and the
plane under different ring radii
are shown in
Figure 3. Since
determines the initial beam size at the source plane, the ordinates in
Figure 3 change accordingly to obtain the consistent scaling. The variation of
affects the beam self-focusing behavior via the ring radius to width ratio
. As an important field parameter, the ring radius to width ratio determines the proportion of the central dark area. With the increment of the ratio, the self-focusing effect occurs at a farther position and covers a larger region. So the selection of
can help the EPOV beam adapt to different transmission distances.
When the EPOV beam propagates in an oceanic channel, the beam field will be disturbed by oceanic turbulence. According to Rytov’s approximation theory, the disturbance can be regarded as the complex phase perturbation to the field. So the mutual coherence function
of the EPOV beam is written as [
19]
where the symbol
denotes the ensemble average. The exponential term is the additional complex phase factor due to turbulence and is given by
Here
denotes wave structure function and quantifies the turbulence effect on wave propagation. The bold variables
and
represent position vectors which contain both the radial and angular coordinates. The expression of
is closely related to the turbulence power spectrum
and has the form of
where
represents spatial frequency and
is the normalized propagation distance.
As for
given by the OTOPS model, the corresponding expression is [
9,
20]
where
and
are derivatives of the seawater refractive index
with respect to average temperature
and salinity concentration
, respectively. According to the empirical equation of
, which is obtained from polynomial fitting of the measurement data and written as [
21]
the variables
and
can be calculated by
where the corresponding coefficients are
,
,
,
,
,
,
,
,
and
. The temperature spectrum
, salinity spectrum
and their co-spectrum
in
have similar forms of
where
,
is the Obuknov–Corrsin constant with a value of 0.72,
denotes the Kolmogorov microscale factor and
denotes the oceanic kinetic energy dissipation rate.
,
and
are the dissipation rates of temperature, salinity and their co-spectrum, respectively, with mutual relationships given by
and
.
is the temperature–salinity gradient ratio, and
is the temperature–salinity eddy diffusivity ratio expressed as
The density ratio
in the piecewise function is defined as
.
and
are the coefficients of thermal expansion and saline contraction, respectively, whose values in different temperature and salinity conditions are available via the TEOS-10 toolbox [
22].
represents non-dimensional coefficients in
with the forms of
where
is the Prandtl number and
is the Schmidt number.
Then by substituting Equations (6) and (10) into Equation (5) and conducting the integral calculations after some lengthy derivations, the analytic expression of the wave structure function is obtained as [
20]
Since oceanic turbulence induces phase perturbation to the EPOV beam during propagation, the spiral wavefront becomes distorted. Some energy of the transmitted mode transfers to other modes with adjacent topological charges. As a result, the initial OAM eigenstate cannot be kept and crosstalk happens. The beam field at the receiver is in fact the superposition of different OAM states. To obtain the received mode distributions, the mutual coherence function of the field is decomposed by a series of spiral harmonics as follows [
23]:
where
is the radial energy density corresponding to each harmonic component with topological charge
. By substituting Equations (2)–(4) and (13) into Equation (14),
can be calculated by
Then, according to the following integral formula [
24]
the simplified form of Equation (15) is written as
If considering the finite receiving aperture with radius
, the normalized intensity of each harmonic is given by
Given that the received topological charge
is the same as the transmitted topological charge
,
represents the signal detection probability
. Otherwise,
represents the crosstalk probability. By defining
as the transmitted power of the EPOV beam, the terms
and
denote the received power of signal and crosstalk, respectively. The total system noise contains both crosstalk noise and background noise power
, so the signal-to-noise ratio (SNR) of the OAM communication system has the following form of
When multiple OAM modes are transmitted for multiplexing, the average capacity indicates the maximum bits of symbol that can be reliably conveyed for binary encoding. The degradation of the SNR will cause a rise in the bit error rate and further reduce the average capacity. As for a multi-level symmetric channel with OAM mode topological charges in the range
, the bit error rate under a conventional on–off keying modulation format is determined by
. So based on the expression of the bit error rate, the average capacity
can be evaluated as follows [
5,
25]:
where
denotes the number of multiplexed modes and
denotes the complementary error function.
3. Numerical Simulations and Discussions
In this section, numerical simulations are conducted to analyze the mode detection probability and average capacity of an EPOV beam in oceanic turbulence. The impacts of beam structure and turbulent conditions on propagation performance are investigated, based on which the self-focusing effect of the EPOV beam is discussed. The method of control variable is used in the following simulations. Except for the variable in each figure below, other parameters of beam and turbulence are set as typical values, which are
,
,
,
,
,
,
,
,
,
,
,
and
[
15,
18,
20]. Since the intensity scattering and absorption in the ocean restrict the range of beam propagation, the typical value of propagation distance is set as
in the simulations according to some available link lengths in oceanic communication experiments [
26,
27,
28].
Figure 4a illustrates the variation of signal detection probability
with propagation distance
for an EPOV beam. The variation is related to the evolution of longitudinal intensity profile as shown in
Figure 2. In the non-diffraction stage,
decreases with the increment of
. The influence of topological charge
on
can be neglected due to the independence of single-ring field distribution on
. In the self-focusing stage, the decline trends have different levels of retardation. The beam spot starts to shrink and the intensity distribution becomes more concentrated due to self-focusing, which mitigates the adverse effect of oceanic turbulence by reducing the effective interaction area. Furthermore, the increment of
makes a difference to mode detection and causes the decline of
. This is because the profile of an EPOV beam gradually changes from single ring to multi rings like other ordinary vortex beams. The beam size spreads with the increment of
, which weakens the self-focusing effect to resist turbulence perturbation.
Figure 4b gives the average capacity
of an EPOV beam under different propagation distances
. As for comparison, the average capacity of a Bessel–Gaussian (BG) beam is also calculated with the same initial spot size and wavelength as the EPOV beam. The multiplexed OAM mode numbers of the EPOV beam and the BG beam are both set as
with topological charges in the range
for multi-level symmetric channels. The results show that when the propagation distance increases, the average capacities of both beams become smaller due to the degraded signal-to-noise ratios. But the EPOV beam has a higher average capacity than the BG beam after certain distances of propagation. In other words, the occurrence of self-focusing effect helps to improve the OAM mode propagation performance in oceanic turbulence. To adapt to communication links with different lengths, the regulation of self-focusing behavior should be considered in application.
The influences of elliptical scaling factor
on the signal detection probability
and average capacity
of an EPOV beam (
) are demonstrated in
Figure 5. As for short-range transmission, a smaller value of
can make the EPOV beam have higher
and
because of the rapid self-focusing process and nearer focusing position from the transmitter as shown in
Figure 2. When
increases, the focusing region gradually shifts farther and lasts longer, which is beneficial to resisting turbulence perturbation in long-range transmission. So a larger
is preferred to improve
and
for a farther receiver. Since
corresponds to the special case of a conventional CPOV beam, the figure also gives a comparison between the EPOV beam and a CPOV beam. From the view of signal detection probability and average capacity, the EPOV beam is superior in underwater short-range communication than the CPOV beam. So the introduction of an elliptical scaling factor not only makes the EPOV beam field diverse but also improves its adaptability to different transmission distances.
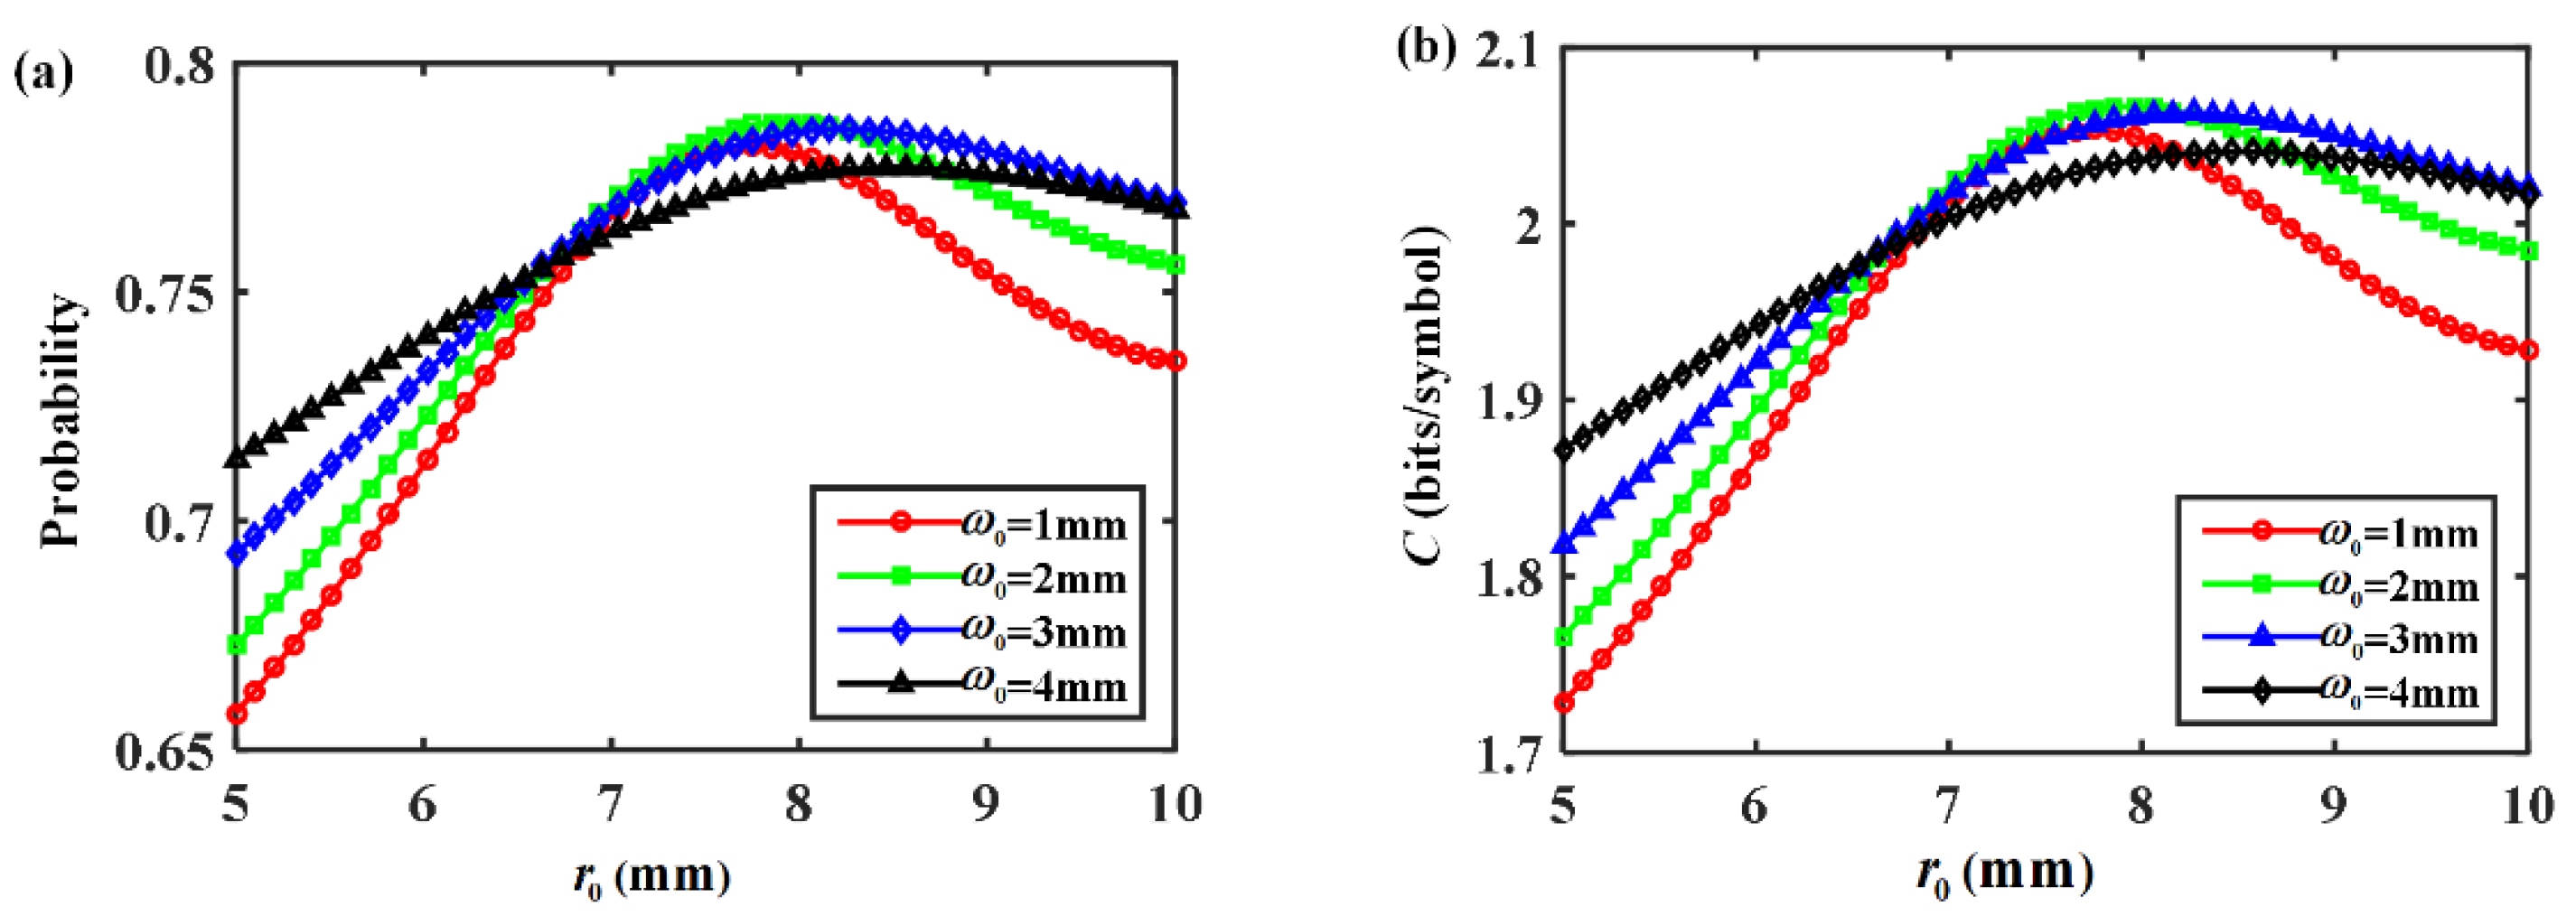
As important structure parameters of an EPOV beam field, the initial half-ring width
and ring radius
also affect the signal detection probability
and average capacity
, as shown in
Figure 6. As for a specific
, there always exists an optimal
to maximize
and
, although the optimal value may vary with
. In this case, the underwater propagation distance is set as
. If
is small, the self-focusing region is relatively limited according to
Figure 3, which weakens the ability to mitigate the turbulence effect. On the other hand, if
is large, the beam has a large initial size and suffers more turbulence perturbation. So a balance should be made between the enhancement of the self-focusing effect and reduction of the initial beam size. The selection of
and
with appropriate ring radius to width ratio can help to get better performances at the receiver.
Figure 7 demonstrates the signal detection probability
and average capacity
of an EPOV beam under different initial ring radius to width ratios
. A smaller
is suitable for a receiver at a shorter propagation distance
while a larger
is suitable for longer distances. The reason is related to the evolution characteristics of the beam field in
Figure 3. When
is small, the self-focusing phenomenon occurs earlier. Most of the beam energy concentrates on a relatively small region and suffers less turbulence perturbation, which is beneficial for short-range transmission. When
is large, both the non-diffraction stage and the self-focusing stage remain longer. The self-focusing region moves farther and covers more, which enhances the anti-interference ability of the EPOV beam for long-range transmission. So the change of
is also an effective method of beam field regulation in different scenarios.
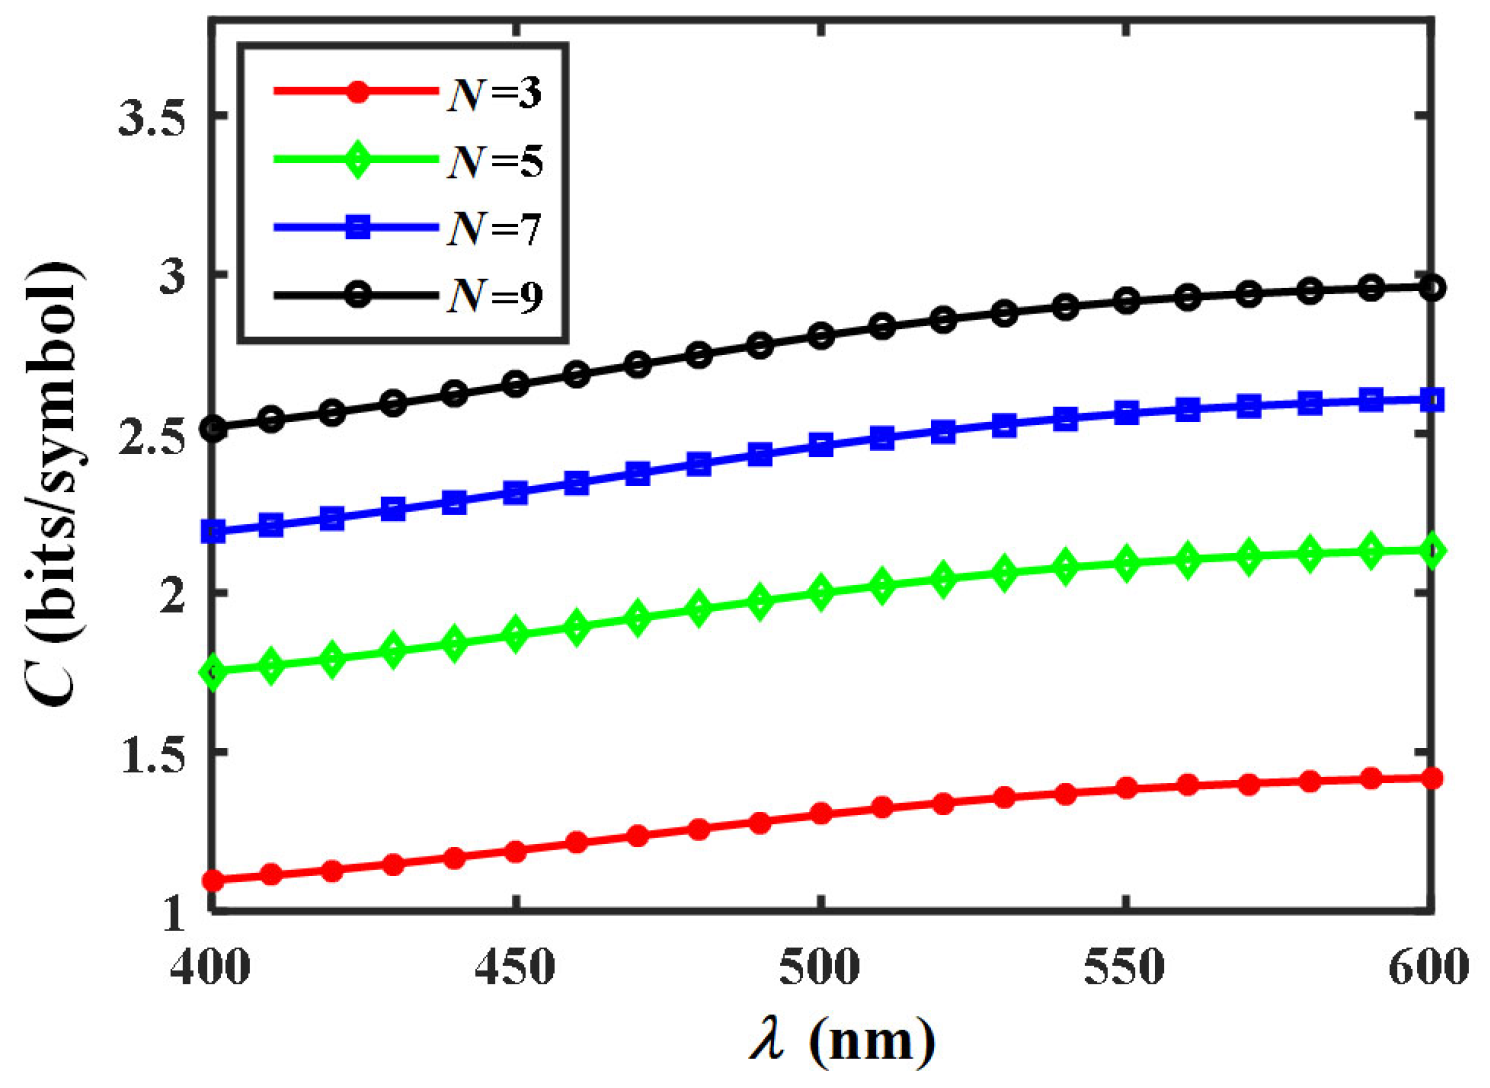
The impacts of wavelength
and mode number
on the average capacity
of an EPOV beam are analyzed in
Figure 8. The beam wavelengths locate in the oceanic low-loss band to reduce the absorption of seawater [
4]. When
increases, a higher
is obtained. The result is related to the wave structure function in oceanic turbulence. The increment of
causes the reduction of wave structure function, which means that the beam suffers less turbulence perturbation and has smaller wavefront distortion. So OAM modal crosstalk decreases and the average capacity is improved. If
is fixed, the average capacity increases with the mode number
of the multi-level symmetric channel multiplexed for coding. But in terms of practical communication systems, the increased system complexity brought by a larger
should also be considered.
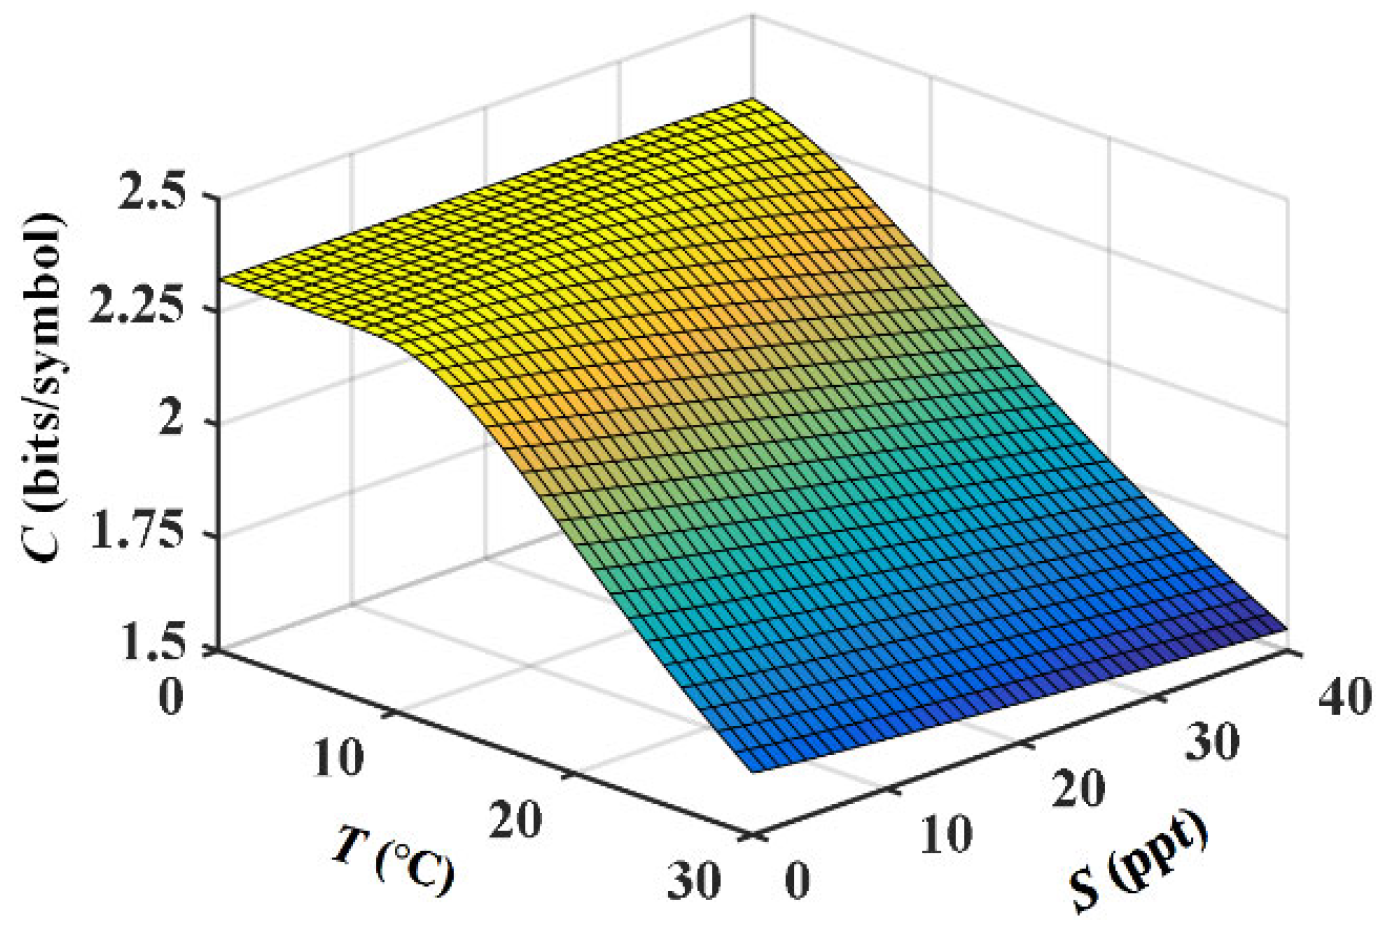
To evaluate the propagation performance of an EPOV beam in different oceanic turbulent conditions,
Figure 9 illustrates the variations of average capacity
with oceanic temperature
and salinity concentration
. With the rise of
and
, the curves of
all present a downward tendency due to the degraded SNR. When
increases, the thermal motion of seawater molecules is more vigorous. So the random fluctuations in the seawater refractive index become stronger along the beam propagation path, which induces more field distortion and crosstalk noise. On the other hand, when
increases, the refraction effect due to seawater density fluctuation is weaker, but the scattering effect due to seawater concentration fluctuation is stronger and dominant [
29]. The scattering effect brings the attenuation of signal mode reaching to the receiver. Since the ranges of
and
in the figure cover all the natural waters, the curves reveal that temperature variation affects the beam propagation more than salinity variation. So cold-water regions of oceans are preferred to achieve better communication performance.
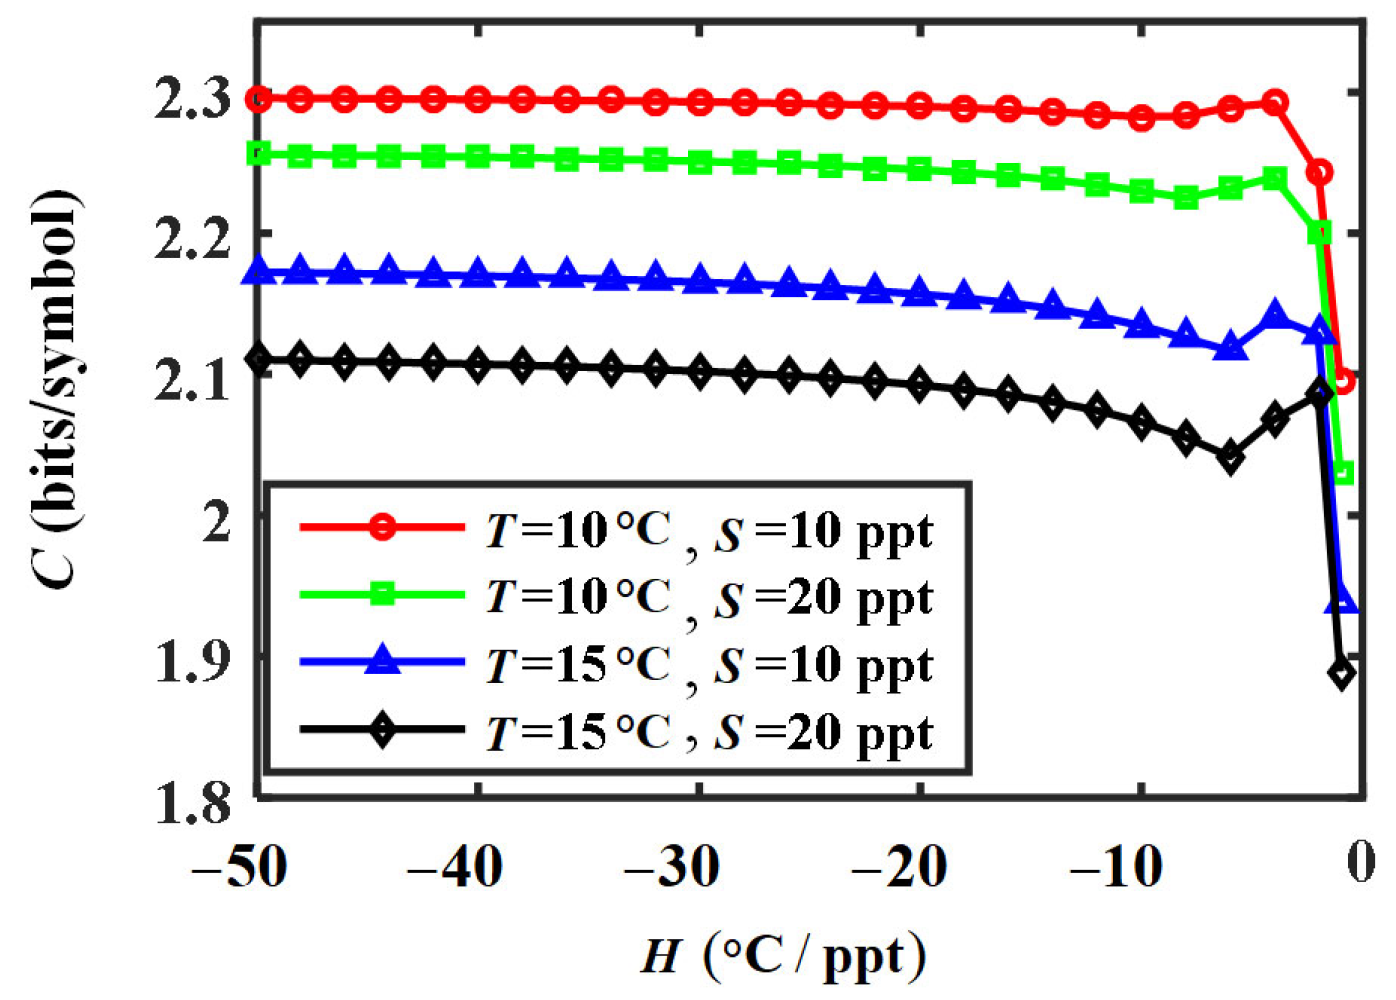
The influences of the temperature–salinity gradient ratio
on the average capacity
of an EPOV beam are shown in
Figure 10. The curves have similar variation trends under different combinations of oceanic temperature and salinity. With the increment of
,
decreases slowly and maintains a relatively stable value at first. When
gradually approaches to zero, the variation becomes sharp, which starts to rise instead until the peak and later a rapid decline appears. By constructing the relationships among the dissipation rates of temperature, salinity and their co-spectrum, the value of
actually affects the wave structure function of the beam in oceanic turbulence. A larger wave structure function implies a stronger turbulence effect on the beam field. Correspondingly, the SNR of mode propagation and average capacity are smaller. When
increases, the wave structure function first increases then decreases. After reaching to the valley value, a rapid increment continues [
20]. As a result, the variation of average capacity
has an opposite trend to that of the wave structure function.
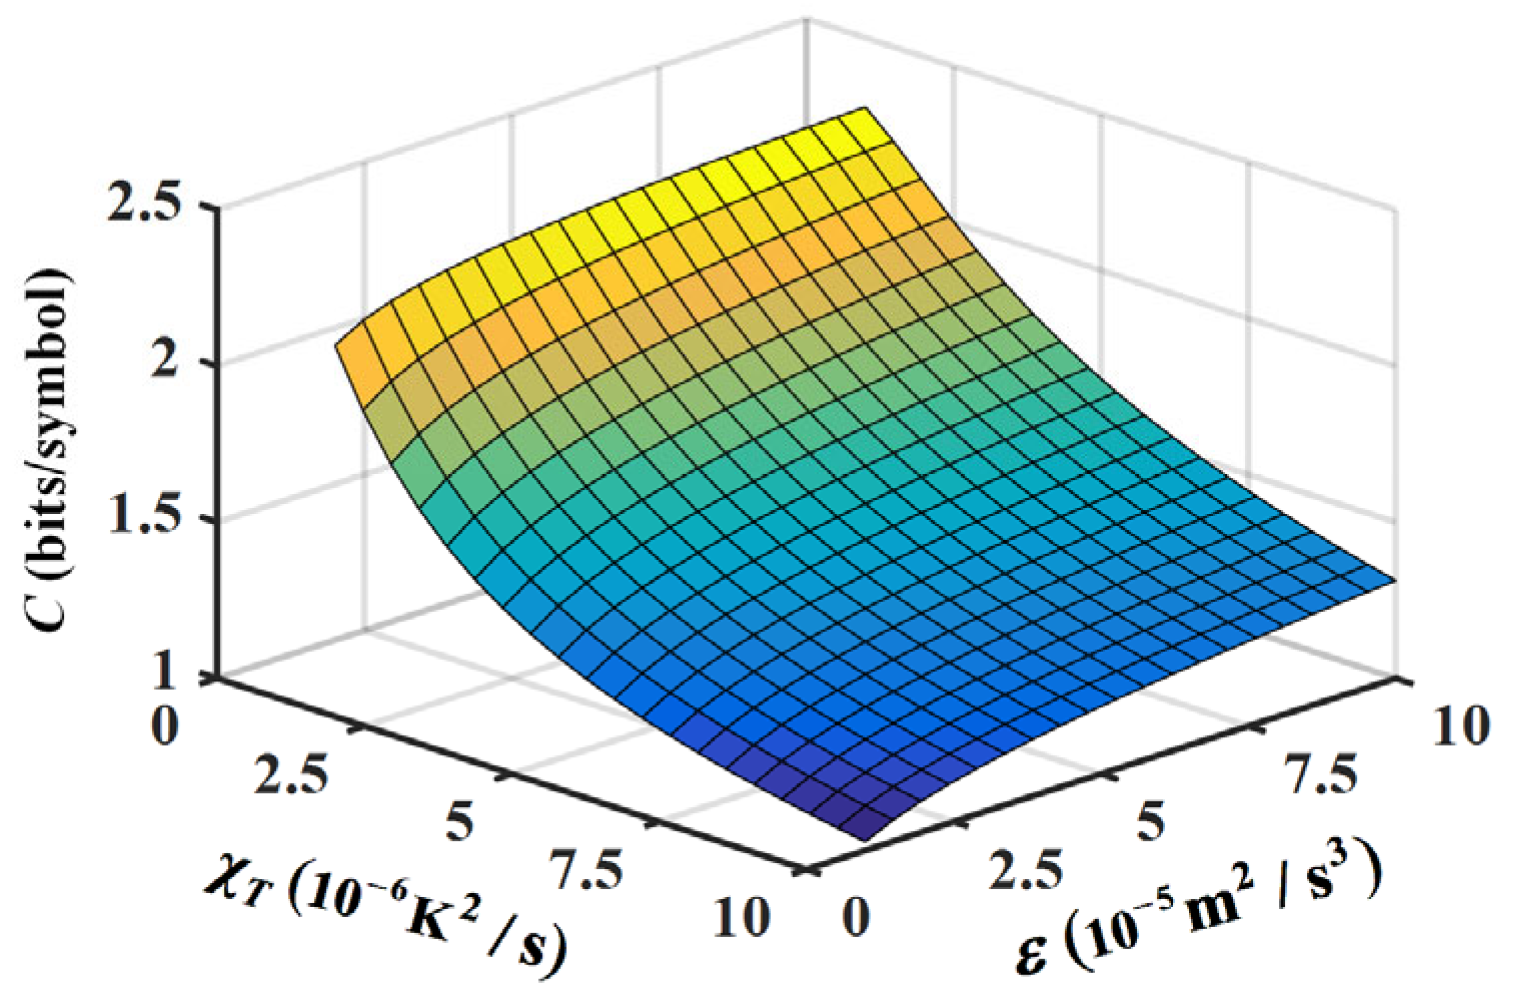
The relationships between the average capacity
of an EPOV beam and other important oceanic turbulence parameters such as the kinetic energy dissipation rate
and temperature dissipation rate
are shown in
Figure 11. When
decreases or
increases, a smaller
is obtained. Since the turbulence power spectrum is negatively correlated with
but positively correlated with
, the decrement of
or the increment of
both enhance the turbulence strength and degrade the beam propagation performance. The variation magnitude of
with
is much larger than that with
, indicating a more significant influence of
than
. Considering that
is generally smaller in deeper seawater [
4], it is advantageous to construct communication links at relatively deeper locations in the ocean.
In summary, by analyzing the average capacity of an EPOV beam in turbulent ocean with variable temperature and salinity, this investigation reveals that both beam structure and turbulent conditions affect propagation performance. Compared with a CPOV beam [
30], the elliptical scaling factor of the EPOV beam brings more diverse transverse patterns. Although the CPOV beam and the EPOV beam both have self-focusing properties, the elliptical scaling factor can regulate the self-focusing behavior of the EPOV beam to adapt to different transmission distances. Apart from turbulence perturbation, the absorption and scattering effects also exist in practical oceanic environment [
26]. Future research may focus on the impacts of absorption and scattering on beam propagation, and search for a theoretical model to consider multiple factors synthetically. The modulation strategy can also extend from the on–off keying modulation in this paper to other modulation formats such as quadrature amplitude modulation for various application requirements [
30].
