Article

Quantifying Influence of Beam Drift on Linear Retardance Measurement in Dual-Rotating Retarder Mueller Matrix Polarimetry

1
Guangdong Research Center of Polarization Imaging and Measurement Engineering Technology, Shenzhen Key Laboratory for Minimal Invasive Medical Technologies, Institute of Biopharmaceutical and Health Engineering, Tsinghua Shenzhen International Graduate School, Tsinghua University, Shenzhen 518055, China
2
Shenzhen Sixth People’s Hospital (Nanshan Hospital), Huazhong University of Science and Technology Union Shenzhen Hospital, Shenzhen 518052, China
3
Department of Engineering Science, University of Oxford, Parks Road, Oxford OX1 3PJ, UK
*
Authors to whom correspondence should be addressed.
Photonics 2025, 12(9), 868; https://doi.org/10.3390/photonics12090868
Submission received: 4 August 2025 / Revised: 25 August 2025 / Accepted: 27 August 2025 / Published: 28 August 2025

Abstract

Mueller matrix polarimetry is recently attracting more and more attention for its diagnostic potentials. However, for prevalently used division of time Mueller matrix polarimeter based on dual-rotating retarder scheme, beam drift induced by rotating polarizers and waveplates introduces spatial misalignment and pseudo-edge artifacts in imaging results, hindering following accurate microstructural features characterization. In this paper, we quantitatively analyze the beam drift phenomenon in dual-rotating retarder Mueller matrix microscopy and its impact on linear retardance measurement, which is frequently used to reflect tissue fiber arrangement. It is demonstrated that polarizer rotation induces larger beam drift than waveplate rotation due to surface non-uniformity and stress deformation. Furthermore, for waveplates rotated constantly in dual-rotating retarder scheme, their tilt within polarization state analyzer can result in more drift and throughput loss than those within polarization state generator. Finally, phantom and tissue experiments confirm that beam drift, rather than inherent optical path changes, dominates the systematic overestimation of linear retardance in boundary image regions. The findings highlight beam drift as a dominant error source for quantifying linear retardance, necessitating careful optical design alignment and a reliable registration algorithm to obtain highly accurate polarization data for training machine learning models of pathological diagnosis using Mueller matrix microscopy.

1. Introduction

Polarization microscopy can non-invasively obtain microstructural information of samples by analyzing the changes in polarization states after the interaction between light and the medium [1,2,3,4]. Specifically, Mueller matrix (MM) microscopy is becoming an important tool for label-free pathological diagnosis due to its high sensitivity in detecting tissue characteristics [5,6,7,8,9].
The dual-rotating retarder (DRR) MM polarimetry, first established by Goldstein and Chipman [10], has become the gold standard for complete MM measurements due to its optimal conditioning and full matrix recovery capabilities. Subsequent optimization studies have focused on retardance selection, sampling strategies, and minimization of systematic errors in the presence of noise and calibration uncertainties [11,12]. While alternative approaches such as snapshot polarimetry using division-of-focal-plane cameras and liquid crystal variable retarders offer advantages in measurement speed and elimination of mechanical rotation, DRR systems remain predominant in biomedical applications where measurement precision and reliability are paramount [13].
In the prevalently used division of time MM measurement system based on dual-rotating retarder scheme, the MM of the sample can be reconstructed pixel by pixel by synchronously rotating the quarter waveplates in both polarization state generator (PSG) and analyzer (PSA) [14]. However, when the polarization elements including waveplates and polarizers are tilted due to mechanical adjustment errors, their rotation process introduces asymmetric optical path changes, resulting in lateral displacement of the incident light beam on the sample surface. This beam drift can induce spatial misalignment of the measurement area in multilayer heterogeneous samples, resulting in a pixel-level mismatch of adjacent polarization images, and eventually appearing as a pseudo-edge artifact in the calculated MM images [15,16].
Linear retardance, a parameter that characterizes the optical anisotropy of birefringent medium, is defined as the phase difference generated after two orthogonal linear polarized lights pass through the sample. The Mueller matrix polar decomposition (MMPD) method is often adopted to extract the linear retardance parameter for quantitative analysis [17]. It decomposes a MM into three submatrices to describe the process of interaction between light and medium: diattenuation matrix M D , retardance matrix M R , and depolarization matrix M Δ , as shown in Equation (1):
M = M Δ M R M D
Then, the retardance matrix M R is further decomposed to obtain the linear retardance value δ , as shown in the following equation:
δ = cos 1 M R ( 2 , 2 ) + M R ( 3 , 3 ) 2 + M R ( 3 , 2 ) + M R ( 2 , 3 ) 2 1 2 1 .
For pathological tissue sections, accurate measurement of linear retardance can reflect the internal fiber arrangement, providing a key basis for label-free diagnosis [18,19]. However, the pseudo-edge artifacts induced by beam drift will cause the measured linear retardance value to systematically deviate from the accurate value, thereby masking the true pathological characteristics of birefringent fibrous structures. Although existing studies have modeled the waveplate azimuth deviation and delay error, the characteristics of the beam drift introduced by each polarization element during the rotation modulation process and the impact of beam drift on the linear retardance measurement results have not been fully quantified [20,21,22].
In this paper, we quantitatively examine the magnitude of beam drift induced by rotating polarizer versus quarter waveplate and assess the resulting pseudo-edge artifacts in linear retardance images. Using phantom sample and biological tissue section, we further evaluate the systematic error introduced by waveplate tilt. Our findings indicate that beam drift is the main source of error in the measurement of linear retardance in heterogeneous samples. Therefore, careful optical design calibration and robust registration algorithms are required to obtain highly accurate polarization data, which is crucial for training machine learning models for subsequent histopathology studies [23,24].

2. Materials and Methods

2.1. Experimental Setup

Here, we developed a transmission MM imaging system using the dual-rotating retarder method. As illustrated in Figure 1a, illuminating light from a 528 nm LED (HI-0803, Δ λ = 10   nm , Heng Yang Guang Xue, Guangzhou, China) sequentially passes through PSG, sample, objective lens (4×/0.1NA, UPlanSApo, Olympus, Tokyo, Japan), PSA, and is finally detected by a CMOS camera (MV-CA016-10UM, 12-bit, Hikvision, Hangzhou, China). The illuminating light with the polarization information of the sample is stored as a 1080 × 1440 pixels intensity image (3.45 μm × 3.45 μm pixel size), providing a spatial resolution of approximately 0.86 μm per pixel at 4× magnification. Each polarization module contains a polarizer (P1, P2, GCL-050003, extinction ration 500:1, Daheng Optics, Beijing, China) and a quarter waveplate (R1, R2, QWP25-532A-M, LBTEK, Changsha, China).
During each measurement, P1 and P2 remain stationary while R1 and R2 rotate synchronously at a 1:5 angular ratio to obtain 30 grayscale polarization images for MM calculation. The system is pre-calibrated using standard samples to ensure a 1% maximum error for single MM elements [25]. Figure 1(b1) displays 30 intensity images under different polarization modulations, with corresponding MM image shown in Figure 1(b2). For the MM imaging result shown in Figure 1(b2), if the values of several MM elements are inconsistent, we will determine this set of data as an abnormal result and exclude it. Meanwhile, in the subsequent experiments, we selected regions of interest (ROI) of size 30 × 30 pixels located at the same positions to conduct comparative analysis on multiple sets of similar data.

2.2. Linear Retardance Measurement Method

When propagating through a linear birefringent medium, polarized light undergoes a linear retardance δ , which is quantified as Equation (3):
δ = 2 π Δ n d λ ,
where Δ n is the refractive index difference, d is the optical path length, and λ is the wavelength of light. Therefore, when tilting the optical element at a certain angle, the measured δ value increases due to the increase in the optical path shown in Figure 1c. According to Snell’s law, the relationship between incident angle φ and exit angle φ can be established as shown in Equation (4) [26]:
sin φ = n sin φ ,
where n is the average refractive index of the optics. Based on the Taylor series expansion, when the incident angle φ is minimal, the light path after tilting can be expressed as Equation (5):
d cos φ d ( 1 + φ 2 2 n 2 ) .
Therefore, the linear retardance increment is shown in Equation (6):
Δ δ = π Δ n d λ n 2 φ 2 .
It can be concluded from Equation (6) that when the optical properties of the element remain unchanged, the linear retardance increment is proportional to the square of the tilt angle.
When a tilted optical element rotates, the refracted beam traces a conical path rather than remaining stationary. This occurs because the surface normal vector rotates with the element, continuously changing the incident angle at each rotation position. For a tilted optical element at incident angle φ , the lateral deviation distance l can be approximated as Equation (7):
l = d sin ( φ φ ) cos φ .
It is evident that as φ increases, l also increases. In the dual-rotating retarder MM polarimetry, this lateral displacement accumulates across multiple polarization measurements, causing spatial misalignment in the reconstructed MM images.

3. Results

3.1. Beam Drift Magnitude Comparison

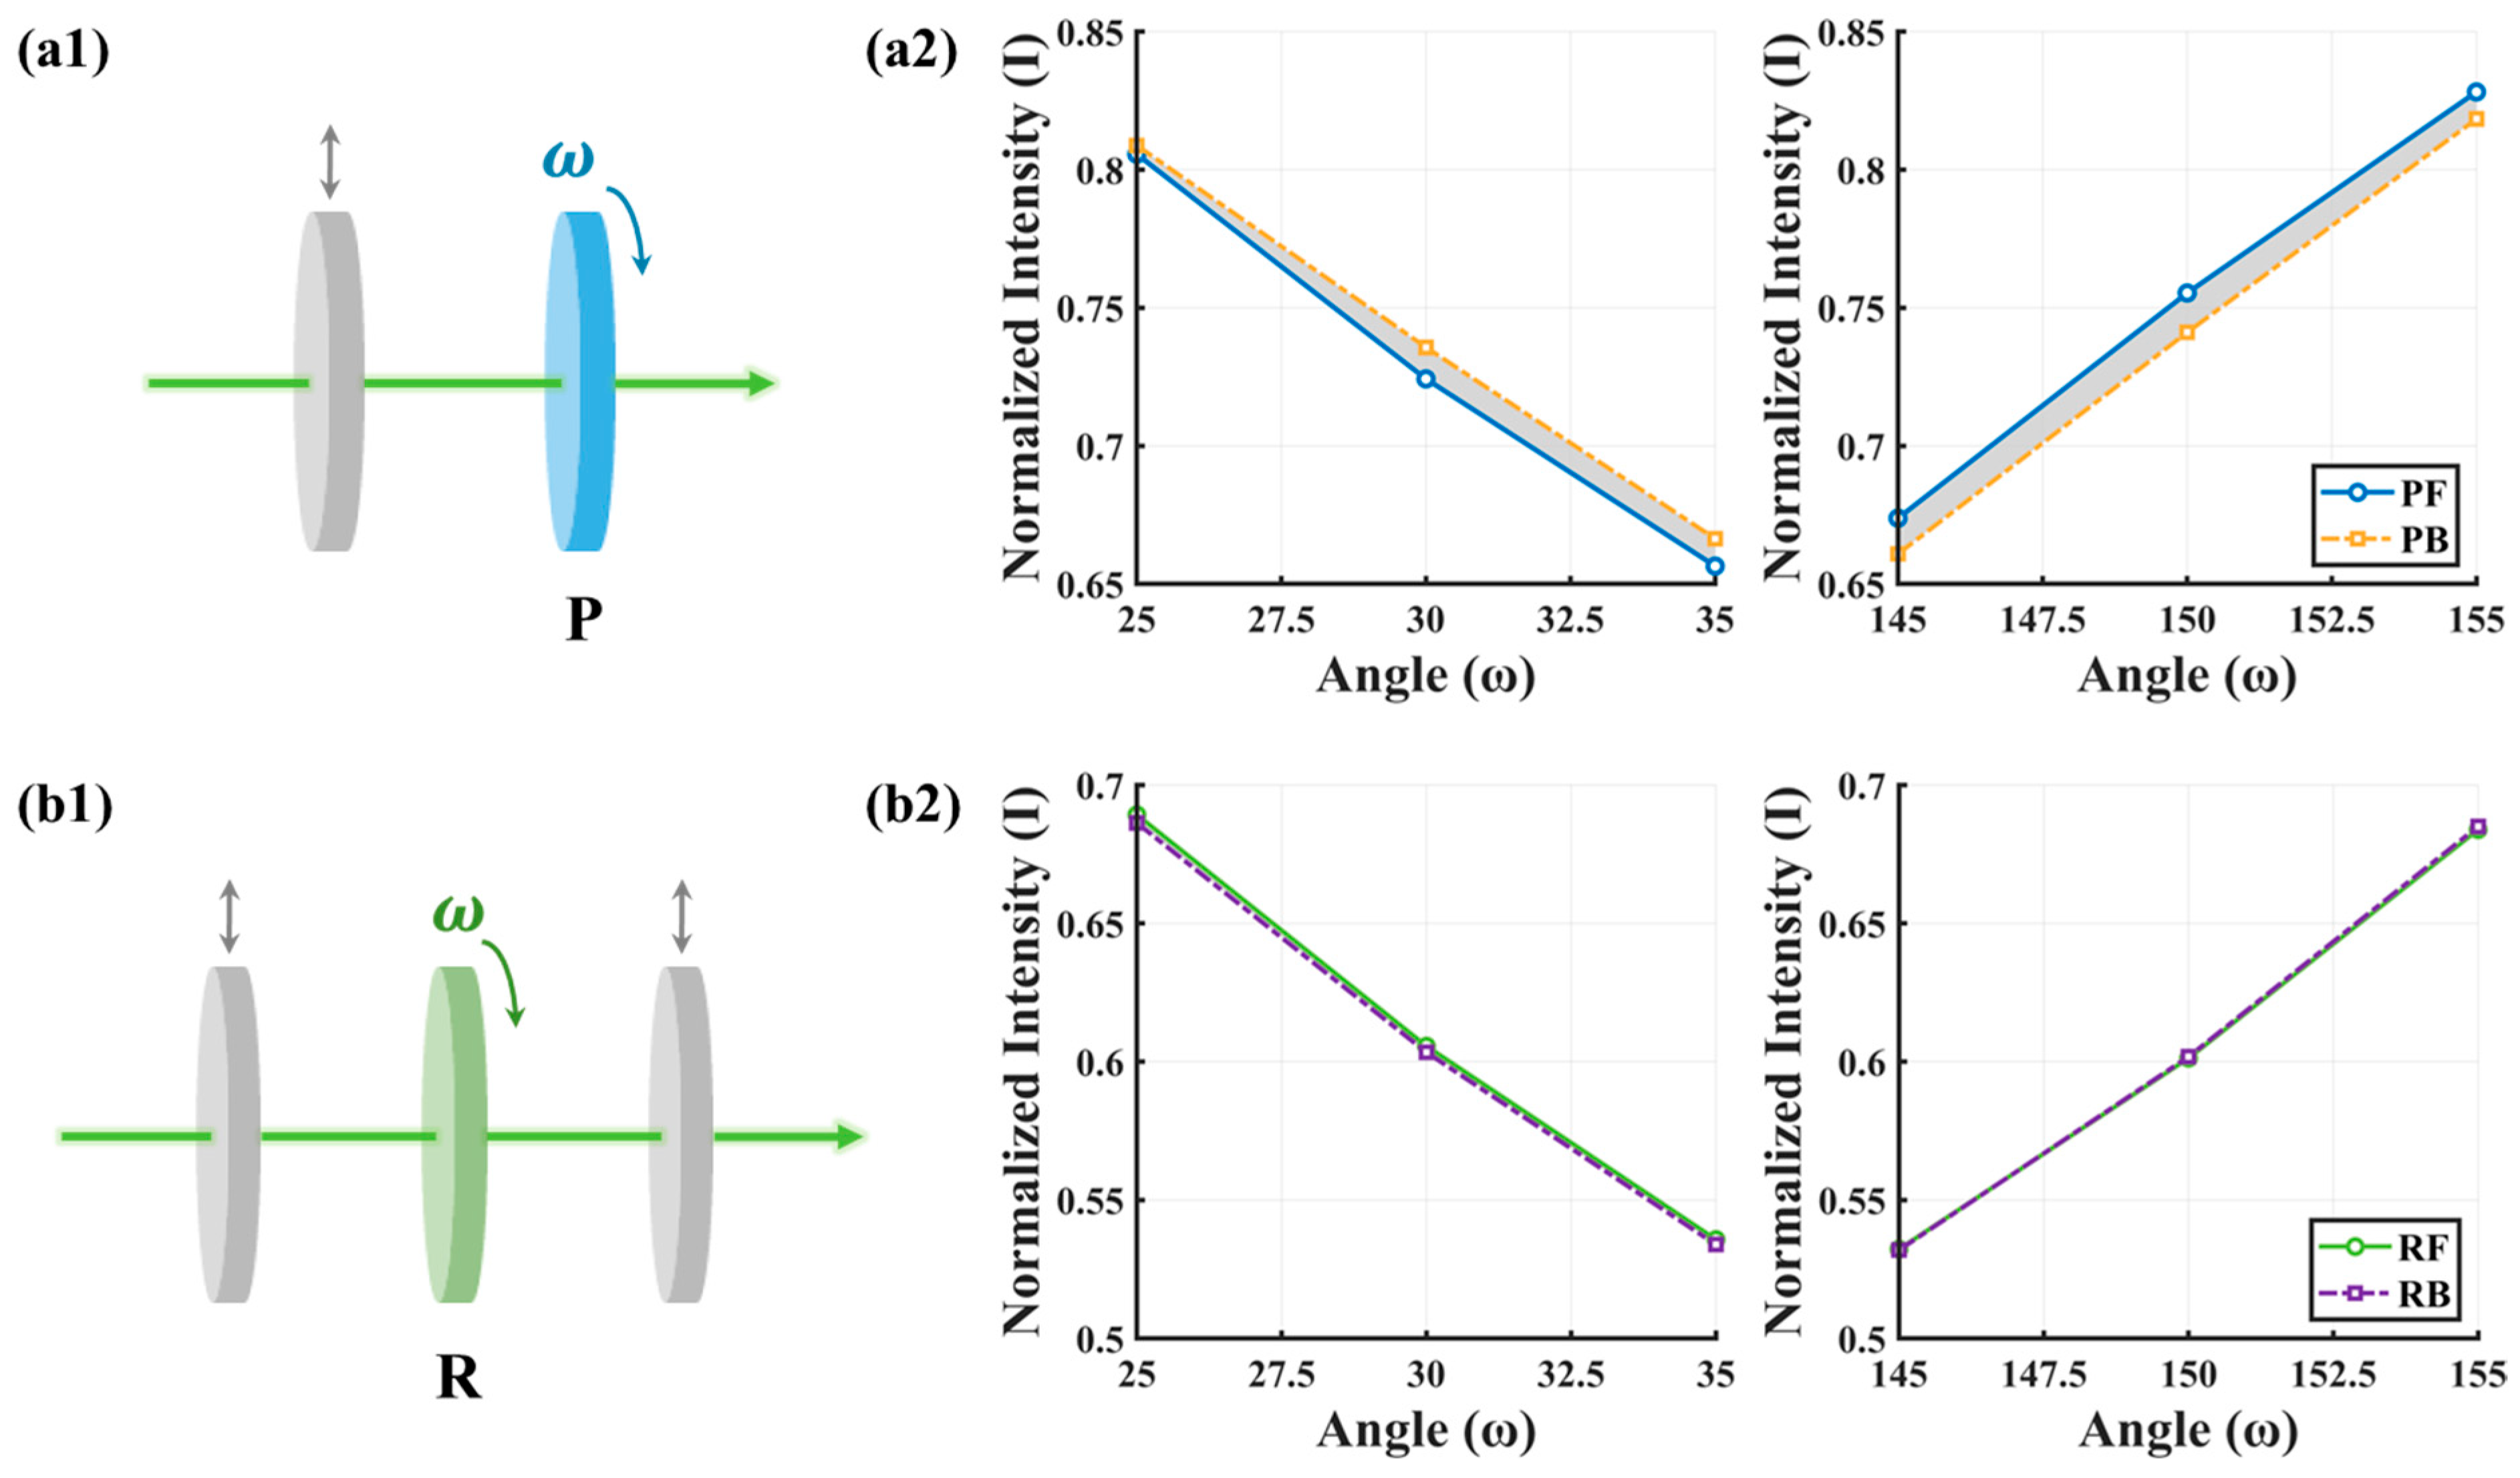
Before analyzing the impact of beam drift on MM imaging results, it is essential to clarify the magnitude of beam drift introduced by the rotation of polarization elements. We first compared the beam drift induced by rotating the polarizer versus the quarter waveplate. As illustrated in Figure 2(a1,b1), the polarizer or quarter waveplate was rotated in 5° steps over a full circle (360°), and the average light intensity values corresponding to each angle were recorded. Each experiment was conducted three times, and the average values of the normalized light intensity at different rotating angles were calculated respectively. It should be noted that the light source and CMOS are omitted in the schematic diagrams, as well as in the subsequent schematic diagrams. In the absence of beam drift, the light intensity measurements for the forward 180° (0° to 180°) and backward 180° (180° to 360°) rotations would be identical. However, for a real situation, the mechanical rotation of polarization elements inevitably introduces beam drift, resulting in discrepancies between the two sets of measurements. Figure 2(a2,b2) display the normalized average intensity curves for rotation angles of 25–35° and 145–155° respectively. Here, PF and RF denote the forward 180° results, while PB and RB represent the backward 180° results. The gray regions highlight the differences between the two curves. It can be seen that RF and RB are almost wholly overlapped in the two angle ranges, whereas PF and PB show discernible deviations. This suggests that rotating the polarizer may produce a larger beam drift than rotating the waveplate.
Furthermore, we calculated the Root Mean Square Error (RMSE) and Mean Absolute Error (MAE) between the two datasets over the full 180° rotation range. These metrics are widely used to quantify discrepancies between measured values, with smaller values indicating lower deviations [27,28,29]. RMSE, derived from the square root of the mean squared errors, is more sensitive to outliers. In contrast, MAE, computed as the mean of absolute errors, provides a robust measure of overall deviation. The results show that the RMSE and MAE of the rotating polarizer are 0.8253 and 0.6645, while rotating the waveplate results in values of 0.6456 and 0.5322. This corroborates the curve analysis, the RMSE and MAE for the rotating polarizer are 27.8% and 24.8% higher than those for the rotating waveplate, respectively. Potential reasons for this phenomenon can be attributed to three aspects: the polarizer’s polymer film structure being more susceptible to stress-induced deformation than the crystalline waveplate during mechanical mounting; surface non-uniformity effects being more pronounced in absorption-based polarizers than in birefringent waveplates; and the polarizer’s stronger modulation of beam polarization state leading to more noticeable intensity variations [30].
Given that waveplate rotation induces smaller but still significant beam drift, and considering the critical role of waveplate in the optical path, particularly in dual-rotating waveplate MM polarimetry. We proceeded to compare the beam drift results at different tilted angles when the quarter waveplate is placed before and after the objective lens, as shown in Figure 3(a1,b1). Each experiment was conducted three times, and the average values of the normalized light intensity at different rotating angles were calculated respectively. Figure 3(a2,b2) display the normalized average intensity results for tilted angles of 0°, 10°, and 20° within the rotation ranges of 15–35° and 60–75°. It can be seen that the intensity variation induced by tilting the waveplate before the objective remains nearly consistent across different tilted angles. In contrast, tilting the waveplate after the objective significantly alters the intensity, with larger tilted angles resulting in a smaller intensity. Similarly, we calculated the RMSE and MAE values for the two cases when the tilted angles were 0° and 10°. The values are 0.6080 and 0.4996 in the case shown in Figure 3(a1), and 1.6257 and 1.6016 in the case of Figure 3(b1).
Since smaller error values indicate higher data consistency, these results demonstrate that the waveplate placed after the objective (i.e., within the PSA) introduces a significantly larger beam drift. This phenomenon arises because the waveplate before the objective resides in the collimated beam region. Tilting it causes only a minor path offset, which can be compensated by the focusing adjustment of the objective lens. However, for the waveplate placed after the objective, its tilt introduces off-axis astigmatism and coma. These higher-order aberrations broaden the focused spot and shift it away from the ideal position, resulting in reduced light collection efficiency by the CMOS sensor and leading to throughput loss [31,32,33].

3.2. Influence on Linear Retardance Measurement

3.2.1. Phantom Experiment Results

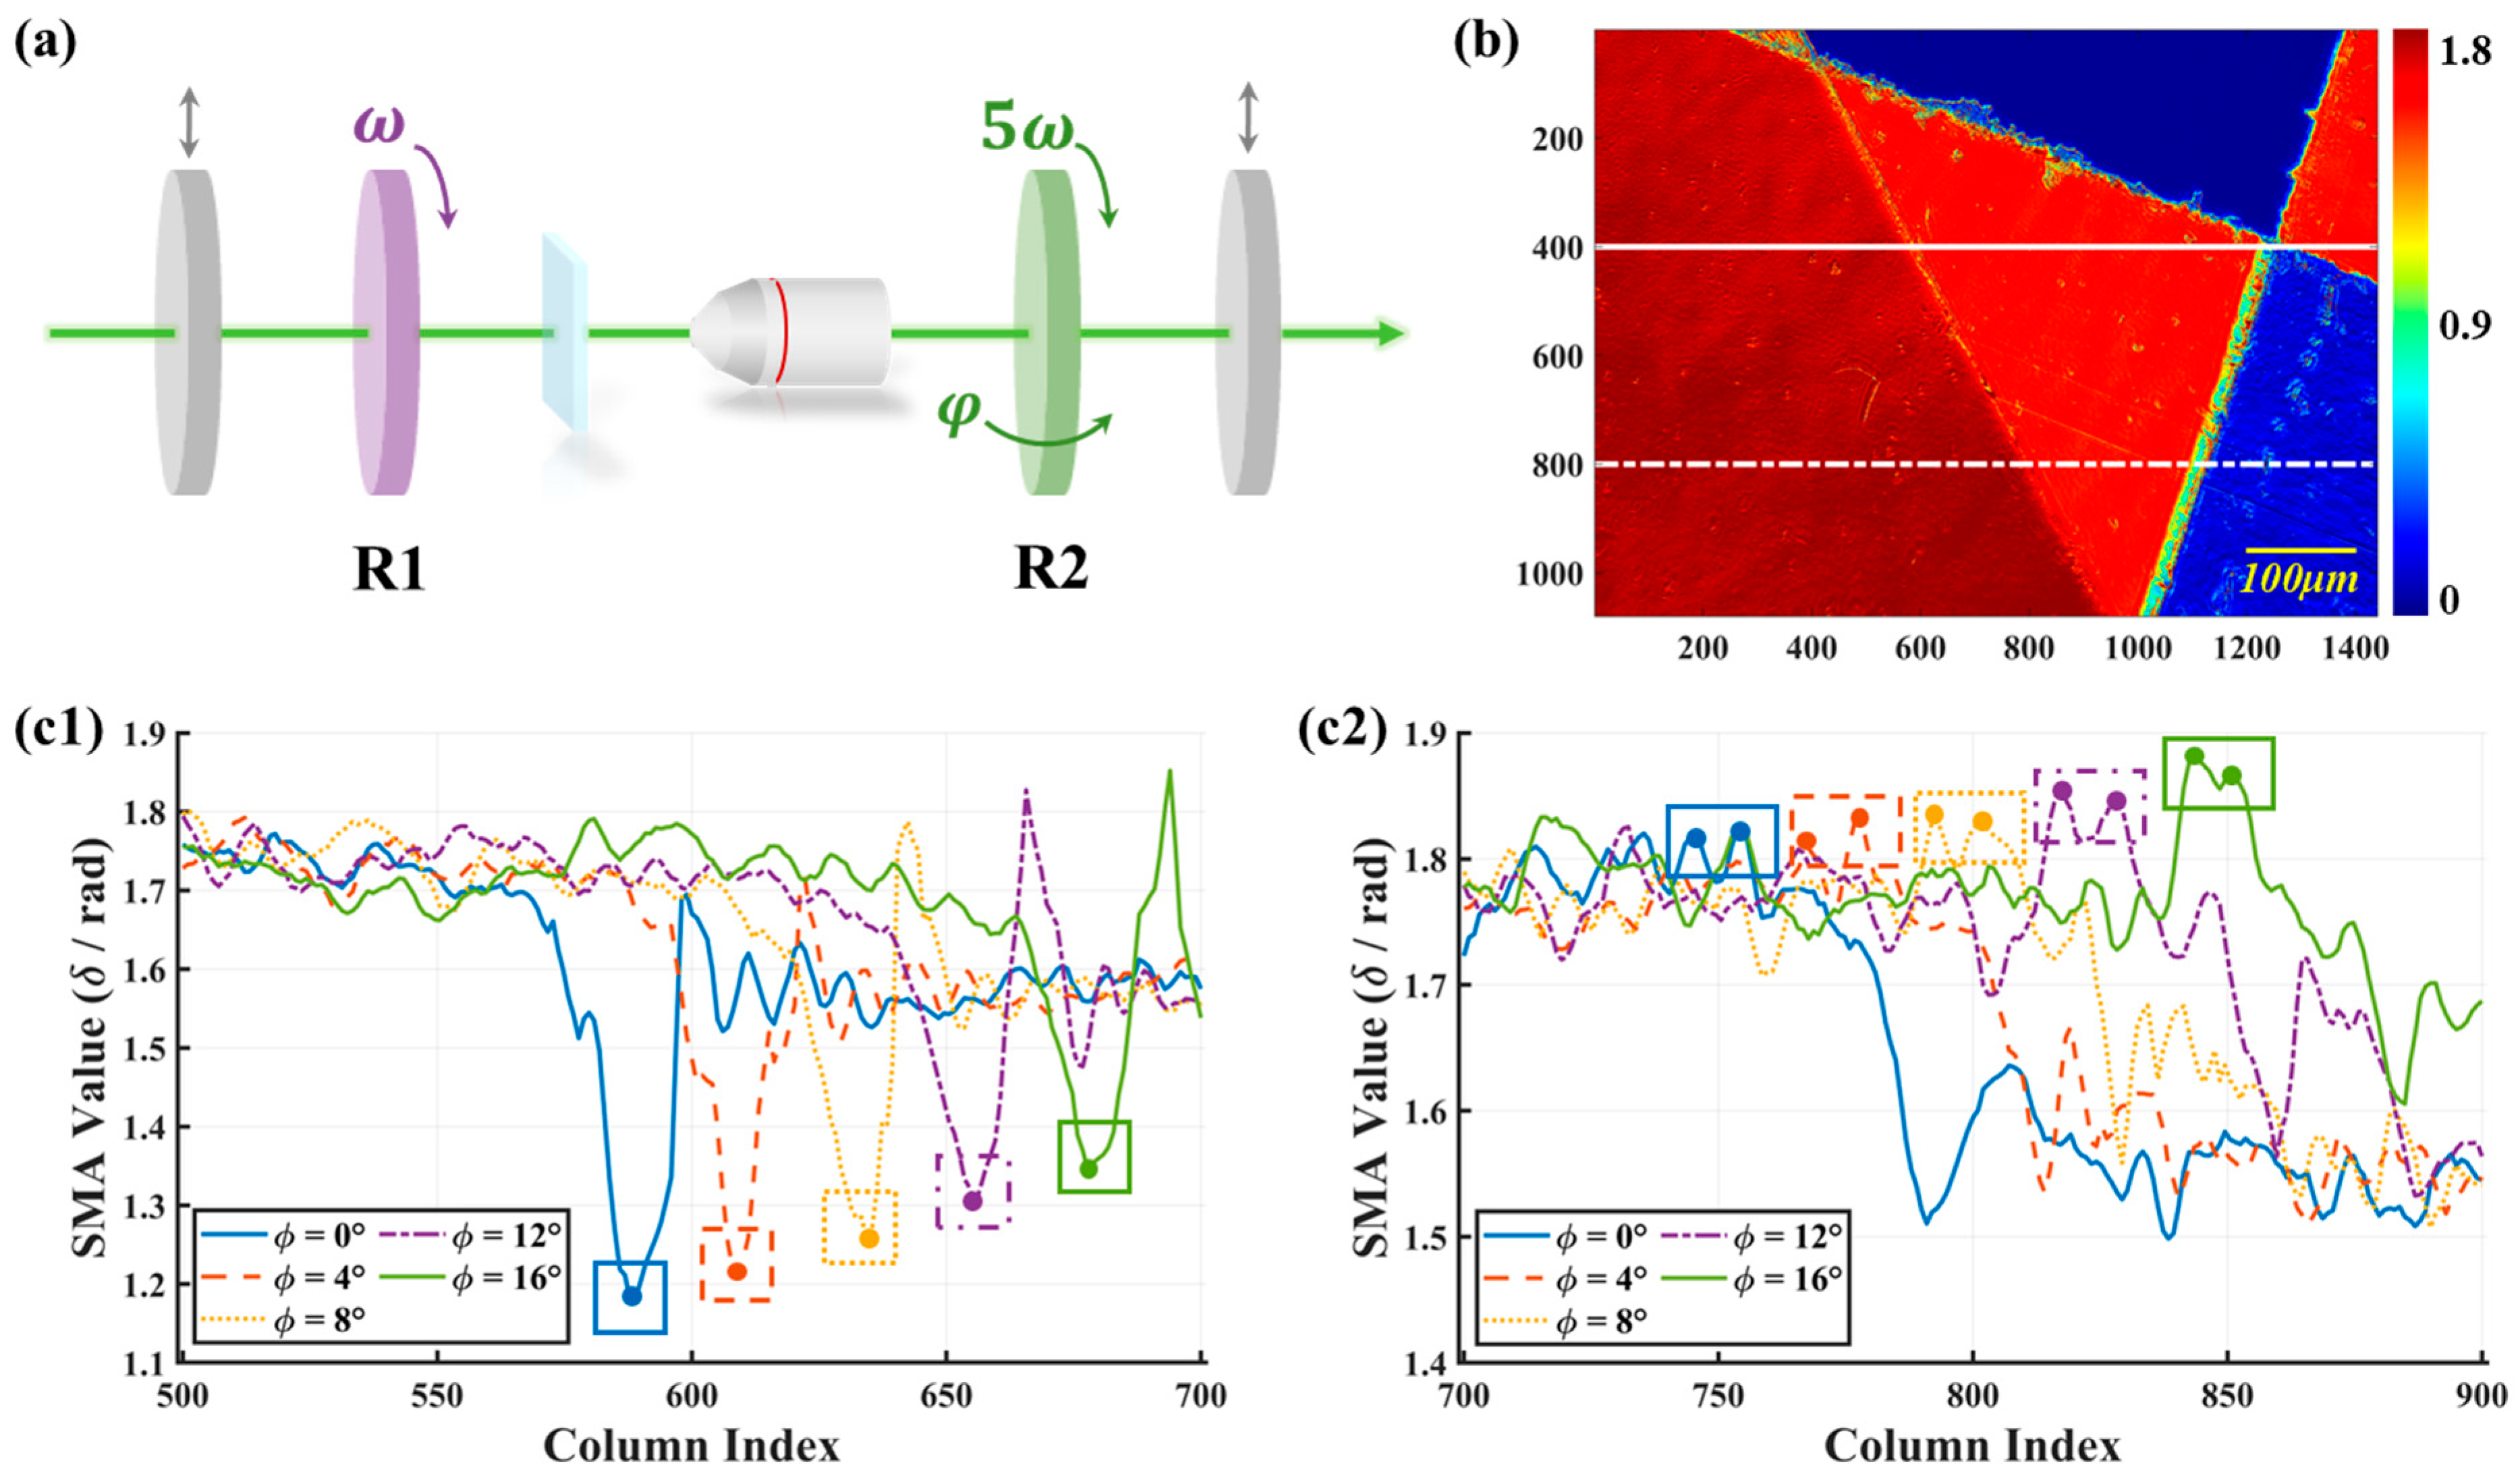
After identifying the primary source of beam drift, we continue to study its impact on linear retardance measurement. To amplify the beam drift effect and make it more readily observable and quantifiable for systematic study, we intentionally introduced relatively large tilt angles. The schematic diagram of the experimental setup is depicted in Figure 4a, in which R2 was tilted in steps of 4° within the range of 0–16°. While these angles exceed typical misalignment errors in a well-aligned system, they serve to unequivocally demonstrate the beam drift phenomenon and its impact. At the same time, the relationship between tilt angle and measurement error is established over a wider dynamic range, helping define the error bounds and provide tolerance specifications for practical systems. The phantom sample was prepared by asymmetrically stacking several layers of transparent tape. Its MMPD δ parameter image at 0° is shown in Figure 4b. The residual stress generated by the tape during mechanical stretching causes a significant linear birefringence effect, and the superposition of multiple layers of tape results in different δ values in each area. Notably, the boundaries between different tape layers exhibit stress concentration due to the discontinuous mechanical coupling, creating strong linear retardance gradients. These gradient regions amplify the pseudo-edge artifacts induced by beam drift, making them ideal for studying drift effects. To more intuitively show the change of δ at different tilted angles in the same sample region, we selected the 400th row (white solid line in Figure 4b) and the 800th row (white dotted line) of the δ image. The corresponding δ values were calculated using the Simple Moving Average (SMA) algorithm to smooth data fluctuations and effectively highlight the overall trend of the data [34].
Figure 4(c1,c2) show the SMA curves of linear retardance at 400th row and at 800th row. The linear retardance values are expressed in radians, with the observed range of 1.1–1.9 rad, which falls within the typical range observed for multilayer birefringent samples. In Figure 4(c1), the region between column index 500–550 corresponds to the relatively uniform interior area of the multilayer tapes. It can be seen that each curve shows a certain degree of fluctuation, attributable to the inherent non-uniformity in the tape layer distribution. As discussed in Equation (6), the theoretical linear retardance increment should be proportional to the square of the tilted angle. However, no significant increase in the value of the peaks or troughs with increasing tilted angle is observed in the curves. For the true zero-order quarter waveplate used in the experiment, its thickness d , refractive index difference Δ n , and wavelength λ satisfy the relationship as Equation (8) shown:
d = λ 4 Δ n .
Combining Equations (6) and (8), when the average refractive index n = 1.5 and the tilted angle takes the maximum value of 16° (0.28 rad), the linear retardance increment Δ δ can be calculated as Equation (9):
Δ δ = π 4 n 2 φ 2 0.027 .
This value differs from the actual phase delay value by two orders of magnitude, confirming that the change in δ caused by the increased optical path difference due to tilting is minimal, constrained by the optical parameters of the waveplate itself, and its impact on practical linear retardance measurement is negligible.
When the column index is between 550–700, the sample resides at the interface between tapes of different thicknesses, and the δ value exhibits a characteristic decrease followed by an increase. We use rectangular boxes of different colors to mark the trough positions in the figure. It can be seen that as the tilted angle increases, the rectangular box moves to the upper right in turn. The increase in column index directly reflects the lateral displacement of the beam spot on the detector induced by beam drift, while the gradual increase in δ clearly reflects the pseudo-edge artifact triggered by beam drift. Similarly, in Figure 4(c2), with increasing tilted angle, the boxes again shift sequentially towards the upper right. However, the upward movement is smaller than that in Figure 4(c1). This discrepancy may be related to the different stretching degrees and stress relaxation states of the tape at various spatial locations, resulting in spatial non-uniformity in the intensity of its edge effect.
In summary, compared with the minor δ value changes caused by the optical path difference variation inherent to waveplate tilting, the pseudo-edge artifact effect superimposed by beam drift in the sample’s edge regions is the dominant factor affecting the measurements, and its influence is much greater than the former.

3.2.2. Tissue Experiment Results

Subsequently, we studied the effect of beam drift on the linear retardance measurement in biological tissue. Since the thin tissue section inherently resulted in small δ value, to amplify the beam drift effects, we replaced the objective in Figure 4a with a 20×/0.4NA objective. The sample used here is a stained 12-μm thick human intestinal tissue section, whose δ image is shown in Figure 5a. The tissue sample was prepared and provided by Shenzhen Sixth People’s Hospital (Nanshan Hospital) Huazhong University of Science and Technology Union Shenzhen Hospital. As a typical anisotropic structure, the spatial orientation and microscopic arrangement of the fiber network in intestinal tissue can produce a complex linear retardance distribution. Therefore, the linear retardance characteristics of this sample exhibit high spatial heterogeneity, which can accurately represent complex biological tissue scenes [35].
For the δ images acquired at different waveplate tilted angles, we selected regions of interest (ROI) of size 30 × 30 pixels located at identical positions on the tissue boundaries. After applying a threshold to isolate the boundary regions, we calculated the mean δ value for each ROI and its relative error compared to the value at 0° tilted angle, as shown in the red and blue lines in Figure 5b. It can be seen that as the tilted angle increases, the measured δ values in the tissue boundary regions systematically rise, consistent with the findings from the phantom experiment. For this human intestinal tissue sample, when the tilted angle reaches 12°, the relative error of δ caused by beam drift in the edge area has surpassed 10%. To mitigate potential randomness in the results, we measured the δ values and their corresponding relative errors at 0° and 10° tilted angles across 10 different boundary regions. As shown in Table 1, the average relative error reached 0.0841.

4. Discussion

In this study, we quantitatively analyzed beam drift effects in dual-rotating retarder MM polarimetry using intentionally large tilt angles (4–16°) to establish clear relationships between optical element misalignment and measurement errors. While these angles exceed typical alignment tolerances, they enabled unambiguous characterization of the drift phenomenon and its impact on linear retardance measurements.
For practical clinical applications, extrapolation from our data suggests that at 1° tilt, the relative error would be approximately 0.8%, and at typical alignment tolerances (<0.5°), errors would fall below 0.5%. Although small, such errors remain critical for applications requiring high quantitative precision, particularly machine learning-based diagnostics, emphasizing the need for precise alignment and robust registration algorithms.
Our findings have important implications beyond traditional DRR systems. While snapshot polarimetry using division-of-focal-plane cameras or liquid crystal modulators avoids mechanical rotation, these approaches face their own challenges in spatial registration and pixel-to-pixel calibration. Our quantitative characterization provides valuable benchmarks for comparing different polarimetric architectures. For biomedical applications where DRR systems are prevalently used due to superior conditioning and full MM recovery, our results underscore the critical importance of mechanical stability. The systematic overestimation of linear retardance at tissue boundaries could significantly impact automated diagnostic algorithms, particularly those based on machine learning approaches that rely on accurate quantitative features. Implementation of robust image registration algorithms, as suggested by recent self-registration methods [15,16], becomes essential for achieving the measurement precision required for reliable pathological assessment.
While our study provides quantitative analysis of beam drift effects in dual-rotating retarder MM polarimetry, we acknowledge several limitations in our experimental characterization. First, our experiments did not definitively separate wedge-induced beam deflection from tilt-induced effective-retardance changes through direct measurement methods. Using a high-contrast knife-edge target or ruled pattern would enable clearer differentiation be-tween geometric drift and optical path effects. Second, the absence of a no-mechanical-rotation control experiment using liquid crystal or electro-optic modulators prevents us from conclusively ruling out other acquisition-chain confounders. Such a control would strengthen the claim that mechanical rotation itself is the dominant error source. Additionally, the systematic quantification of optical element tilt angles, detailed telecentricity measurements, and more comprehensive statistical analysis of the measurement results would provide more robust characterization of the beam drift phenomenon. These limitations represent important areas for future investigation and methodological improvement in MM polarimetry.

5. Conclusions

In this paper, we quantitatively analyzed the beam drift phenomenon in dual-rotating retarder MM microscopy and its impact on linear retardance measurement. First, we identified that rotating the polarizer induces significantly larger beam drift compared to the quarter waveplate, primarily due to optical surface non-uniformity and stress deformation. Furthermore, we demonstrated that the rotation of waveplate in the PSA introduces substantially larger beam drift and throughput loss than it in the PSG, caused by off-axis aberrations. Using a multilayer tape phantom, we showed that while the inherent retardance increment due to tilted waveplate optical path change is negligible, beam drift induces significant pseudo-edge artifacts. Validation on human intestinal tissue sections confirmed that beam drift leads to systematic linear retardance overestimation in boundary regions, with an average relative error of 0.0841 at 10°. These findings highlight beam drift as a dominant error source for quantifying linear retardance in heterogeneous samples, necessitating careful optical design alignment and reliable registration algorithms to obtain highly accurate polarization images before using polarization data for machine learning applications.

Author Contributions

Conceptualization, H.H. and C.H.; methodology, H.M. and N.Z.; software, L.D.; data curation, K.D. and S.L.; writing—original draft preparation, K.D.; writing—review and editing, H.H. All authors have read and agreed to the published version of the manuscript.

Funding

This research was funded by National Natural Science Foundation of China (NSFC) Grant No. 62335007.

Institutional Review Board Statement

The study was conducted according to the guidelines of the Declaration of Helsinki, and approved by the Ethics Committee of Tsinghua Shenzhen International Graduate School, Tsinghua University.

Informed Consent Statement

Informed consent was obtained from all subjects involved in the study.

Data Availability Statement

The data presented in this study are available on request from the corresponding author. The data are not publicly available due to privacy.

Conflicts of Interest

The authors declare no conflicts of interest.

References

  1. Tuchin, V.V. Polarized light interaction with tissues. J. Biomed. Opt. 2011, 21, 071114. [Google Scholar] [CrossRef] [PubMed]
  2. Ramella-Roman, J.C.; Saytashev, I.; Piccini, M. A review polarization-based imaging technologies for clinical and preclinical applications. J. Opt. 2020, 22, 123001. [Google Scholar] [CrossRef]
  3. He, C.; He, H.; Chang, J.; Chen, B.; Ma, H.; Booth, M.J. Polarisation optics for biomedical and clinical applications: A review. Light Sci. Appl. 2021, 10, 194. [Google Scholar] [CrossRef]
  4. Pezzaniti, J.L.; Russell, A.C. Mueller matrix imaging polarimetry. Opt. Eng. 1995, 34, 1558–1568. [Google Scholar] [CrossRef]
  5. Qi, J.; Elson, D.S. A high definition Mueller polarimetric endoscope for tissue characterization. Sci. Rep. 2016, 6, 25953. [Google Scholar] [CrossRef]
  6. Cameron, B.D.; Raković, M.J.; Mehrübeoǧlu, M.; Kattawar, G.W.; Rastegar, S.; Wang, L.V.; Coté, G.L. Measurement and calculation of the two-dimensional backscattering Mueller matrix of a turbid medium. Opt. Lett. 1998, 23, 485–487. [Google Scholar] [CrossRef]
  7. Alali, S.; Vitkin, I.A. Polarized light imaging in biomedicine: Emerging Mueller matrix methodologies for bulk tissue assessment. J. Biomed. Opt. 2015, 20, 061104. [Google Scholar] [CrossRef]
  8. Pierangelo, A.; Manhas, S.; Benali, A.; Fallet, C.; Antonelli, M.R.; Novikova, T.; Gayet, B.; Validire, P.; Martino, A.D. Ex vivo photometric and polarimetric multilayer characterization of human healthy colon by multispectral Mueller imaging. J. Biomed. Opt. 2012, 17, 066009. [Google Scholar] [CrossRef]
  9. Antonelli, M.R.; Pierangelo, A.; Novikova, T.; Validire, P.; Benali, A.; Gayet, B.; Martino, A.D. Mueller matrix imaging of human colon tissue for cancer diagnostics: How Monte Carlo modeling can help in the interpretation of experimental data. Opt. Express 2010, 18, 10200–10208. [Google Scholar] [CrossRef]
  10. Goldstein, D.H.; Chipman, R.A. Mueller matrix dual-rotating retarder polarimeter. Appl. Opt. 1992, 31, 6676–6683. [Google Scholar] [CrossRef]
  11. Smith, M.H. Optimization of a dual-rotating-retarder Mueller matrix polarimeter. Appl. Opt. 2002, 41, 2488–2493. [Google Scholar] [CrossRef]
  12. Twietmeyer, K.M.; Chipman, R.A. Optimization of Mueller matrix polarimeters in the presence of error sources. Opt. Express 2008, 16, 11589–11603. [Google Scholar] [CrossRef]
  13. Huang, T.; Meng, R.; Qi, J.; Liu, Y.; Wang, X.; Chen, Y.; Liao, R.; Ma, H. Fast Mueller matrix microscope based on dual DoFP polarimeters. Opt. Lett. 2021, 46, 1676–1679. [Google Scholar] [CrossRef] [PubMed]
  14. Chenault, D.B.; Pezzaniti, J.L.; Chipman, R.A. Mueller matrix algorithms. Proc. SPIE 1992, 1746, 231. [Google Scholar] [CrossRef]
  15. Li, X.; Goudail, F.; Chen, S.C. Self-calibration for Mueller polarimeters based on DoFP polarization imagers. Opt. Lett. 2022, 47, 1415–1418. [Google Scholar] [CrossRef] [PubMed]
  16. Xuan, T.; Zhai, H.; He, H.; He, C.; Liu, S.; Ma, H. Self-registration of constant-step rotating Mueller matrix polarimeters. Opt. Lett. 2022, 47, 5797–5800. [Google Scholar] [CrossRef]
  17. Lu, S.Y.; Chipman, R.A. Interpretation of Mueller matrices based on polar decomposition. J. Opt. Soc. Am. A 1996, 13, 1106–1113. [Google Scholar] [CrossRef]
  18. Ghosh, N.; Wood, M.F.G.; Vitkin, I.A. Mueller matrix decomposition for extraction of individual polarization parameters from complex turbid media exhibiting multiple scattering, optical activity, and linear birefringence. J. Biomed. Opt. 2008, 13, 044036. [Google Scholar] [CrossRef]
  19. Pierangelo, A.; Nazac, A.; Benali, A.; Validire, P.; Cohen, H.; Novikova, T.; Ibrahim, B.H.; Manhas, S.; Fallet, C.; Antonelli, M.R.; et al. Polarimetric imaging of uterine cervix: A case study. Opt. Express 2013, 21, 14120–14130. [Google Scholar] [CrossRef]
  20. Liang, Y.; Qu, Z.; Zhong, Y.; Song, Z.; Li, S. Analysis of errors in polarimetry using a rotating waveplate. Appl. Opt. 2019, 58, 9883–9895. [Google Scholar] [CrossRef]
  21. Hu, Z.; Zhao, Q.; Ma, H. Optimal configurations of Mueller polarimeter for Gaussian-Poisson mixed noise. Appl. Sci. 2022, 12, 6521. [Google Scholar] [CrossRef]
  22. Ren, L.; Yang, X.; Huang, S.; Zhong, Z.; Peng, J.; Ye, L.; Hou, Y.; Zhang, B. Towards high-performance polarimeters with large-area uniform chiral shells: A comparative study on the polarization detection precision enabled by the Mueller matrix and deep learning algorithm. Opt. Express 2024, 32, 16414–16425. [Google Scholar] [CrossRef] [PubMed]
  23. Lee, H.R.; Lotz, C.; Becker, F.K.G.; Dembski, S.; Novikova, T. Digital histology of tissue with Mueller microscopy and FastDBSCAN. Appl. Opt. 2022, 61, 9616–9624. [Google Scholar] [CrossRef]
  24. Robinson, D.; Hoong, K.; Kleijn, W.B.; Doronin, A.; Rehbinder, J.; Vizet, J.; Pierangelo, A.; Novikova, T. Polarimetric imaging for cervical pre-cancer screening aided by machine learning: Ex vivo studies. J. Biomed. Opt. 2023, 28, 102904. [Google Scholar] [CrossRef] [PubMed]
  25. Zhou, J.; He, H.; Chen, Z.; Wang, Y.; Ma, H. Modulus design multiwavelength polarization microscope for transmission Mueller matrix imaging. J. Biomed. Opt. 2018, 23, 016007. [Google Scholar] [CrossRef]
  26. Parazzoli, C.G.; Greegor, R.B.; Li, K.; Koltenbah, B.E.C.; Tanielian, M. Experimental verification and simulation of negative index of refraction using Snell’s law. Phys. Rev. Lett. 2003, 90, 107401. [Google Scholar] [CrossRef]
  27. Hodson, T.O. Root-mean-square error (RMSE) or mean absolute error (MAE): When to use them or not. Geosci. Model Dev. 2022, 15, 5481–5487. [Google Scholar] [CrossRef]
  28. Wang, W.; Lu, Y. Analysis of the mean absolute error (MAE) and the root mean square error (RMSE) in assessing rounding model. Mater. Sci. Eng. 2018, 324, 012049. [Google Scholar] [CrossRef]
  29. Karunasingha, D.S.K. Root mean square error or mean absolute error? Use their ratio as well. Inform. Sci. 2022, 585, 609–629. [Google Scholar] [CrossRef]
  30. Chipman, R.A. Mechanics of polarization ray tracing. Opt. Eng. 1995, 34, 1636. [Google Scholar] [CrossRef]
  31. Kärcher, V.; Kim, V.V.; Reddy, A.N.K.; Zacharias, H.; Ganeev, R.A. Generation of complex vector and vortex extreme ultraviolet beams using the S-waveplate and spiral phase plate during high-order harmonics generation in argon. ACS Photonics 2023, 10, 4519–4528. [Google Scholar] [CrossRef]
  32. Chen, T.A.; Tang, Y.; Zhang, L.J.; Chang, Y.E.; Zheng, C. Correction of astigmatism and coma using analytic theory of aberrations in imaging spectrometer based on concentric off-axis dual reflector system. Appl. Opt. 2014, 53, 565–576. [Google Scholar] [CrossRef] [PubMed]
  33. de Gracia, P.; Dorronsoro, C.; Gambra, E.; Marin, G.; Hernández, M.; Marcos, S. Combining coma with astigmatism can improve retinal image over astigmatism alone. Vis. Res. 2010, 50, 2008–2014. [Google Scholar] [CrossRef] [PubMed]
  34. Rusdiana, S.; Yuni, S.M.; Khairunnisa, D. Comparison of rainfall forecasting in simple moving average (SMA) and weighted moving average (WMA) methods (Case study at village of Gampong Blang Bintang, Big Aceh District-Sumatera-Indonesia. J. Res. Math. Trends Technol. 2020, 2, 21–27. [Google Scholar] [CrossRef]
  35. Deng, L.; Chen, C.; Yu, W.; Shao, C.; Shen, Z.; Wang, Y.; He, C.; Li, H.; Liu, Z.; He, H.; et al. Influence of hematoxylin and eosin staining on linear birefringence measurement of fibrous tissue structures in polarization microscopy. J. Biomed. Opt. 2023, 28, 102909. [Google Scholar] [CrossRef]
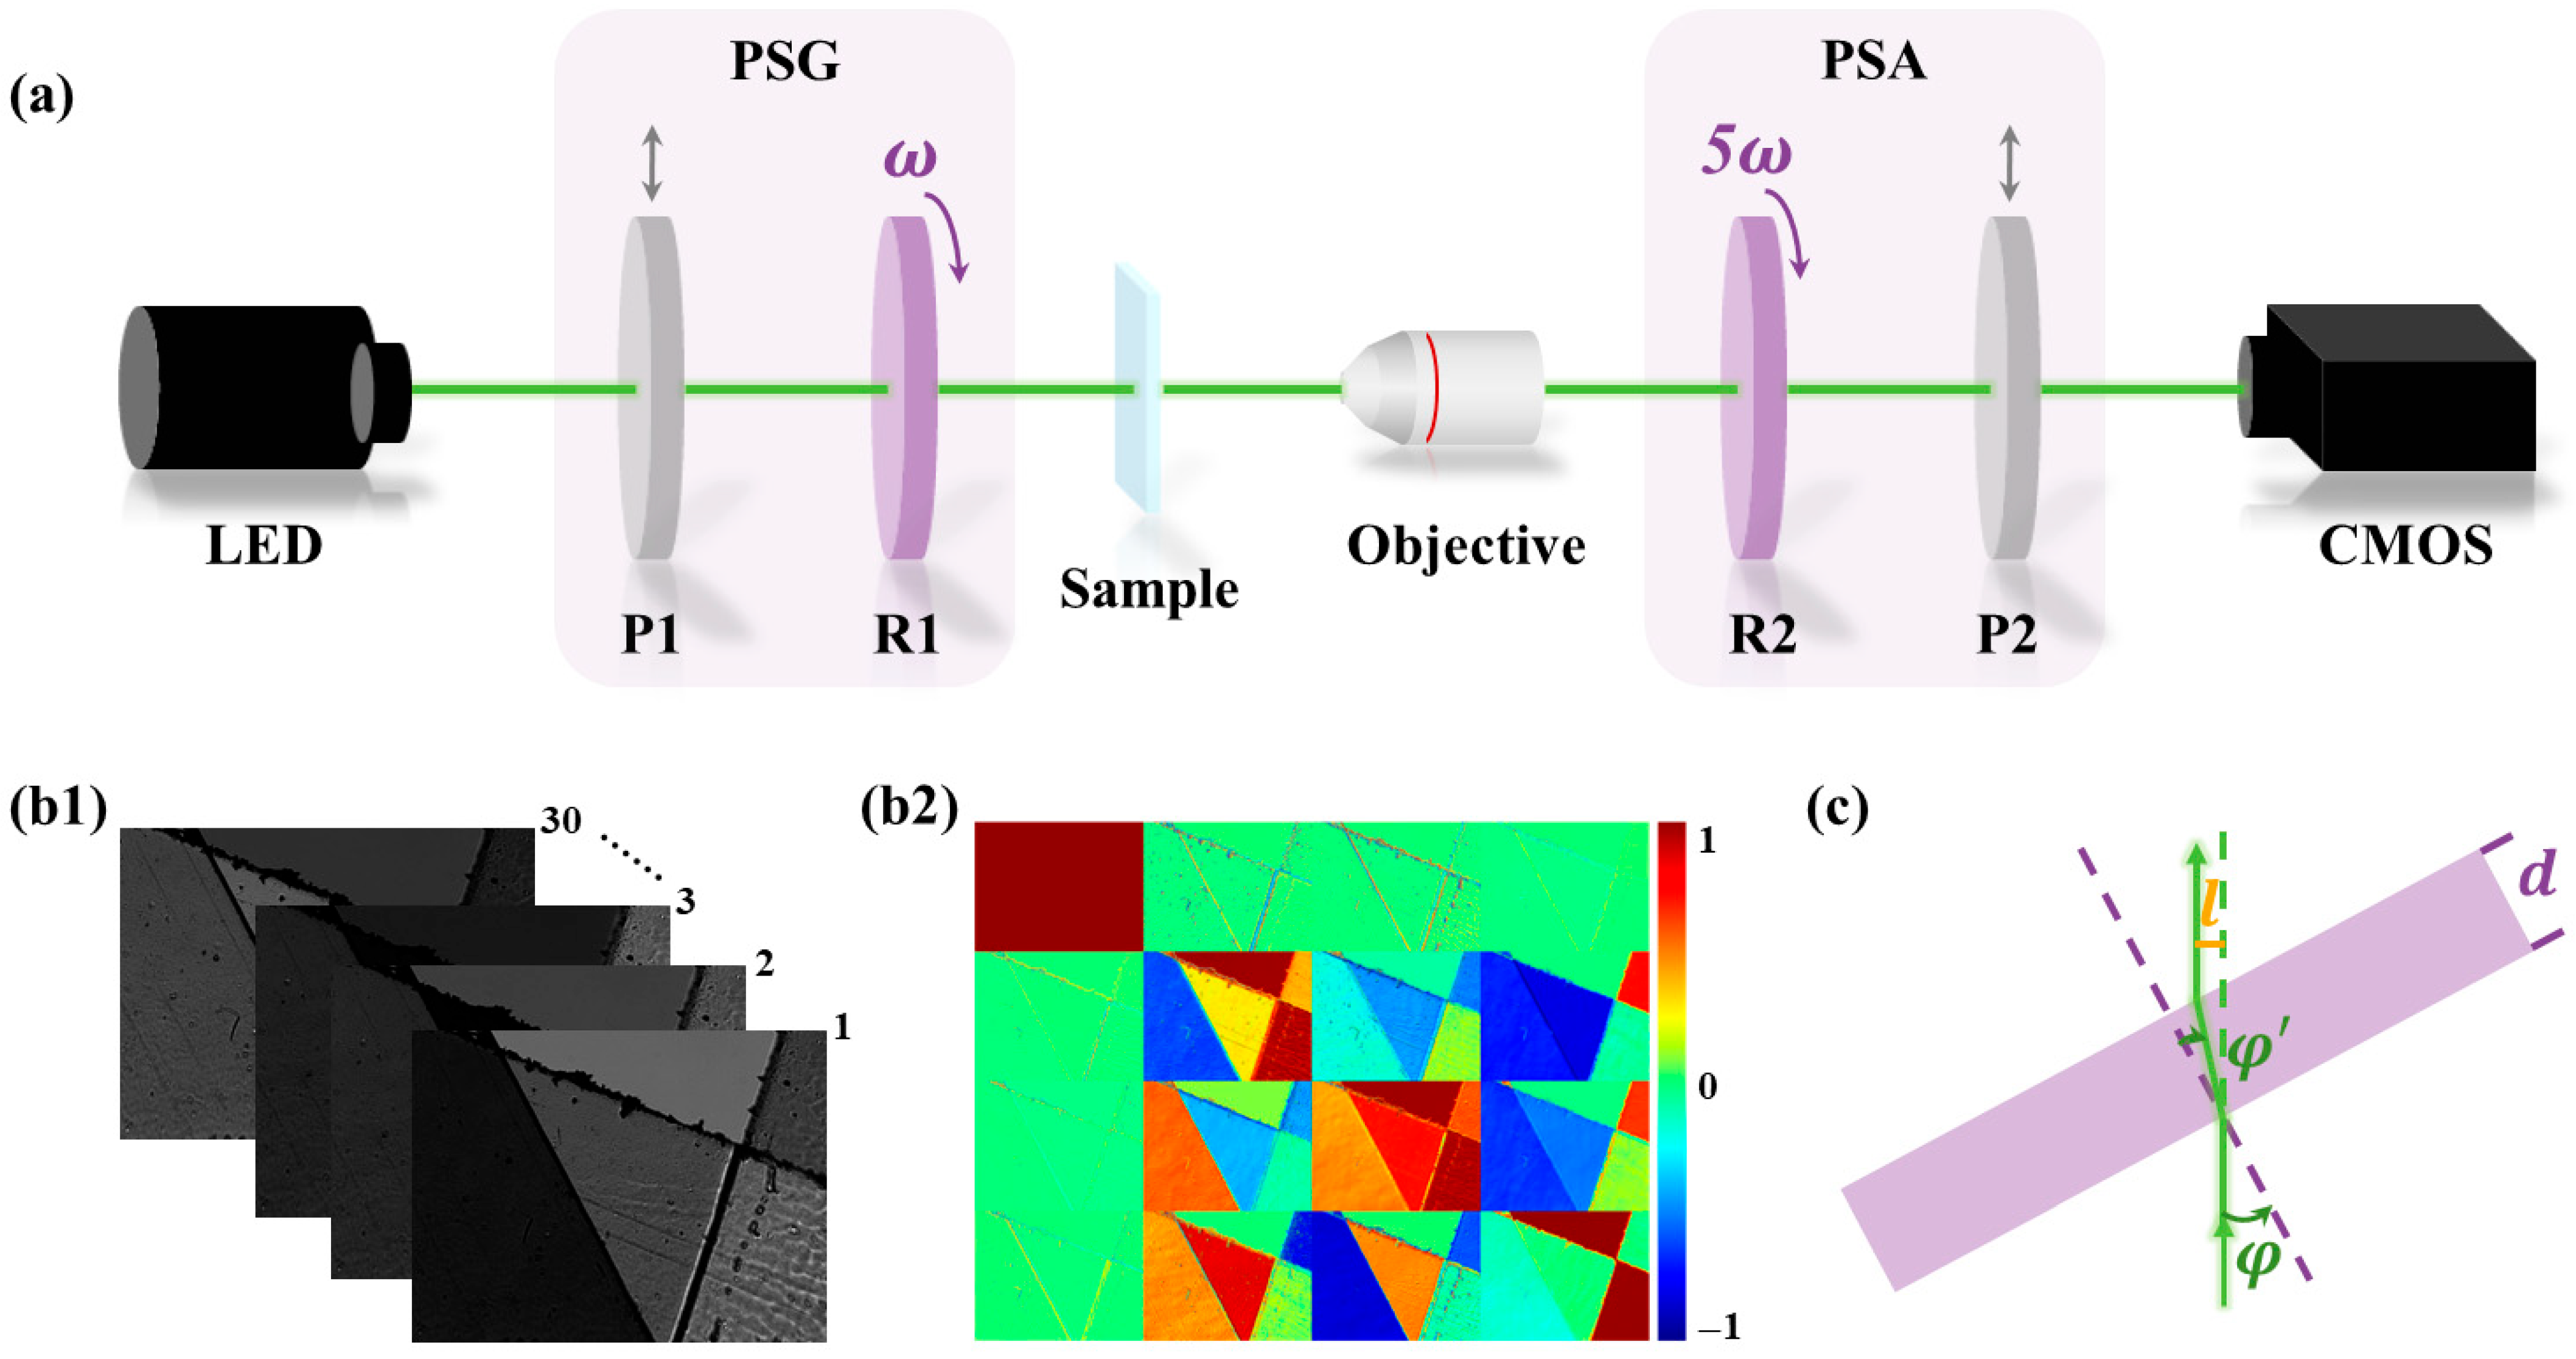
Figure 1. Schematics of: (a) transmission MM imaging system; (b1) polarization images and (b2) Mueller matrix image; (c) light path in the tilted optical element.
Photonics 12 00868 g001
Figure 2. Linear polarized light incident on different rotating polarization elements and the normalized average light intensity curves: (a1,a2) rotating polarizer (P); (b1,b2) rotating quarter waveplate (R).
Photonics 12 00868 g002
Figure 3. Linear polarized light incident on rotating waveplate with different tilted angles and the normalized average light intensity curves: (a1,a2) the waveplate is placed before the objective; (b1,b2) the waveplate is placed after the objective.
Photonics 12 00868 g003
Figure 4. Phantom experiment results: (a) schematic of measurement setup; (b) δ image of multilayer tapes sample; (c1) δ variation curves at 400th row and (c2) at 800th row.
Photonics 12 00868 g004
Figure 5. Tissue experiment results: (a) δ image of human intestinal tissue sample; (b) mean value and relative error curves of δ .
Photonics 12 00868 g005
Table 1. Relative error results of 10 different regions.
Region φ = 0 ° φ = 10 ° Relative Error
10.24250.26140.0781
20.24120.26690.1063
30.25160.27470.0918
40.25140.26890.0699
50.22370.24770.1073
60.23480.25380.0808
70.25010.26840.0732
80.22710.24330.0710
90.23870.26290.1011
100.25720.27300.0615
average0.24180.26210.0841
Disclaimer/Publisher’s Note: The statements, opinions and data contained in all publications are solely those of the individual author(s) and contributor(s) and not of MDPI and/or the editor(s). MDPI and/or the editor(s) disclaim responsibility for any injury to people or property resulting from any ideas, methods, instructions or products referred to in the content.