Article

Cladding–Thickness–Dependent Performance of SMS Optical Fiber Sensors

1
College of Science, University of Shanghai for Science and Technology, Shanghai 200093, China
2
Shanghai Key Laboratory of Modern Optical System, University of Shanghai for Science and Technology, Shanghai 200093, China
*
Author to whom correspondence should be addressed.
Photonics 2025, 12(9), 863; https://doi.org/10.3390/photonics12090863
Submission received: 17 July 2025 / Revised: 23 August 2025 / Accepted: 26 August 2025 / Published: 27 August 2025
(This article belongs to the Special Issue Advances in Optical Fiber Sensing Technology)

Abstract

This study presents a detailed investigation of single-mode–multimode–single-mode (SMS) fiber sensors with varied cladding thicknesses of multimode fiber (MMF) (4, 3, 2, 1, and 0 μm). The refractive index (RI) sensing performance of these sensors was evaluated using sensitivity, limit of detection (LOD), full width at half maximum (FWHM), quality factor (Q-factor), figure of merit (FOM), and comprehensive evaluation index (CEI). The results demonstrate that the sensor with a multimode fiber (MMF) cladding thickness of 0 μm achieves the highest overall performance, characterized by a superior sensitivity of 106.00 nm/RIU and a maximum figure of merit (FOM) of 5.54 RIU−1. In comparison, the sensor with a 2 μm MMF cladding thickness exhibits minimized energy loss, resulting in the highest quality factor of 169.02 and the narrowest full width at half maximum of 8.02 nm. Additionally, sensor stability is found to be independent of MMF cladding thickness.

1. Introduction

Optical fiber sensors have garnered significant attention due to their inherent advantages, including immunity to electromagnetic interference, compact size, and high sensitivity. These features make them widely applicable in various fields, including biomedical diagnostics [1,2], environmental monitoring [3,4], and chemical analysis [5]. Among the many optical fiber configurations, single-mode–multimode–single-mode (SMS) fiber structures have garnered particular interest owing to their simple fabrication, low cost, and excellent responsiveness to changes in ambient refractive index (RI).
Recent advances in SMS fiber sensor research have increasingly focused on enhancing sensing performance through structural optimization and modal interference control. For instance, tapered multimode fiber (MMF) segments have been employed to intensify the evanescent field and improve RI sensitivity by tailoring mode excitation and propagation conditions [6,7]. Cladding-modified structures, such as core-etched, side-polished, or coreless MMFs, have been shown to strengthen the interaction between the guided modes and the external environment, thereby enhancing spectral response [8,9]. Additionally, interference control strategies, including core-offset splicing and non-axial alignment, have enabled fine tuning of modal interference patterns and broadened the functional versatility of SMS-based devices [10,11]. These structural innovations have also laid the groundwork for multi-parameter sensing, enabling the simultaneous measurement of RI, temperature, strain, and magnetic field with enhanced precision and robustness.
In parallel with these developments, the multimode interference (MMI) effect inherent to SMS structures has been widely exploited in a variety of applications, including optical bandpass filters [12,13], refractive index sensors [14,15,16,17,18,19], chemical concentration monitoring [20], temperature and strain sensing [21,22,23,24], displacement measurement [25,26], and tunable fiber lenses [27]. Most existing studies have focused on the influence of MMF core diameter, length, and numerical aperture on sensor performance parameters such as sensitivity, full width at half maximum (FWHM), and figure of merit (FOM). However, the impact of cladding thickness—a critical geometric parameter—on these performance indicators remains largely underexplored, despite its potential to affect mode confinement, evanescent field distribution, and light–matter interaction.
To address this research gap, we systematically investigate the influence of MMF cladding thickness on the performance of SMS fiber RI sensors. Five distinct cladding thicknesses were fabricated through controlled chemical etching, and six key performance metrics were quantitatively evaluated: sensitivity, FWHM, FOM, quality factor (Q-factor), limit of detection (LOD), and a newly proposed comprehensive evaluation index (CEI). The results provide important insights into the design and optimization of SMS fiber structures, offering practical guidance for the development of high-performance optical fiber sensors across a wide range of application scenarios.

2. Sensor Fabrication and Principle

The experimental SMS fiber structure employed in this work consists of a 10 mm long MMF segment spliced between two single-mode fibers (SMFs), as illustrated in Figure 1. The MMF segment was fabricated by chemically etching an MMF with a core diameter of 105 μm and an original cladding thickness of 10 μm. To fabricate MMF segments with cladding thicknesses of 4, 3, 2, 1, and 0 μm, a two-step HF etching process was employed. A 35% HF solution was first used for rapid bulk removal, followed by a 15% diluted solution for precise control. During fine etching, the fiber was removed every minute, rinsed, and inspected under a near-field optical microscope to monitor the cladding thickness. This iterative approach enabled accurate control within ±0.5 μm. The method allows for repeatable fabrication of MMF segments with target cladding thicknesses, as confirmed by multiple successfully prepared batches. It is essential to note that both etching steps were performed under ambient laboratory conditions, specifically at a controlled room temperature of 25 °C.
Next, one end of the etched multimode fiber (MMF) was spliced to a single-mode fiber (SMF). The MMF segment was then precisely measured and trimmed to 10 mm, followed by splicing to another SMF to form a complete SMS fiber structure. A representative microscopic image of the fabricated SMS sensor is shown in Figure 2. As illustrated, the etched MMF exhibits a uniform cladding reduction with a smooth and well-defined surface morphology.
The SMF and MMF were aligned and spliced coaxially using a fiber fusion splicer. When light is coupled from the input SMF into the MMF, the core diameter mismatch leads to the excitation of multiple cladding modes and higher-order modes. As these modes propagate through the MMF, phase differences accumulate, which can be expressed as follows:
Δ ϕ m n = 2 π λ n e f f ( m ) n e f f ( n ) L
where n e f f ( m ) and n e f f ( n ) denote the effective RIs of the mth- and nth-order modes, respectively, L is the length of the MMF, and λ is the wavelength of the incident light. The interference among these modes forms the transmission spectrum at the output end, and the peak/valley wavelength is highly sensitive to variations in the external RI [28].
The cladding thickness d of the MMF directly influences the sensor’s sensitivity to external RI n ext by modulating the distribution of the evanescent field. The evanescent field of higher-order modes can penetrate through the cladding deeply, and its electric field intensity decays exponentially along the radial direction r, which is expressed as follows:
E ( r ) = E 0 exp r r c δ p
where E(r) denotes the electric field intensity of the evanescent wave at a radial distance r from the fiber axis. E0 represents the electric field amplitude at the cladding boundary located at r = rc. Parameter δ p is the penetration depth of the evanescent field, which characterizes the exponential decay length of the field intensity along the radial direction outside the cladding. Specifically, δ p defines the distance over which the electric field intensity decreases to 1/e of its value at the cladding interface. The following equation determines the penetration depth:
δ p = λ 2 π n c l a d 2 sin 2 θ n e x t 2
where θ is the incident angle, and n clad is the RI of the fiber cladding. When d < δ p , the evanescent field can penetrate through the cladding and interact with the external medium. In this work, the operational wavelength range is set to 1300–1500 nm, corresponding to the spectral region where the sensor exhibits the most prominent transmission redshift response. By assuming typical material parameters, such as nclad = 1.444 (silica), next = 1.0 (air), and an incidence angle of approximately 75°, the calculated penetration depths are approximately 0.45 μm at 1300 nm and 0.52 μm at 1500 nm. These results indicate that the selected cladding thicknesses—4, 3, 2, 1, and 0 μm—span a range from well above to below the characteristic penetration depth, allowing precise control over the degree of field leakage and evanescent interaction. This analysis provides strong support for the rationality of the cladding thicknesses (4, 3, 2, 1, 0 μm) selected in this study.
A variation in the external RI Δ n e x t alters the evanescent field distribution, thereby inducing a change in the effective RI Δ n e f f as described as follows:
Δ n e f f n e f f = Γ ( d ) Δ n e x t n e x t
where Γ(d) is the energy coupling ratio related to the cladding thickness and is defined as follows:
Γ ( d ) = r c r c + d | E ( r ) | 2 r d r 0 r c + d | E ( r ) | 2 r d r
As the cladding thickness d decreases, the energy coupling coefficient Γ(d) increases, which enhances the sensitivity of the effective RI variation Δ n e f f n e f f to changes in the external RI Δ n e x t n e x t . Consequently, variations in the MMF cladding thickness significantly influence the sensor’s responsiveness to external RI n ext . Though the decrease in cladding thickness strengthens the mode coupling of the interference peak/valley, increased scattering and absorption of higher-order modes will cause broadening of the FWHM as the cladding thickness reduces. Conversely, increasing the cladding thickness will weaken the mode coupling, but result in a narrower FWHM. Therefore, it is necessary to conduct a comprehensive evaluation and comparative analysis of the sensor with various MMF cladding thicknesses.
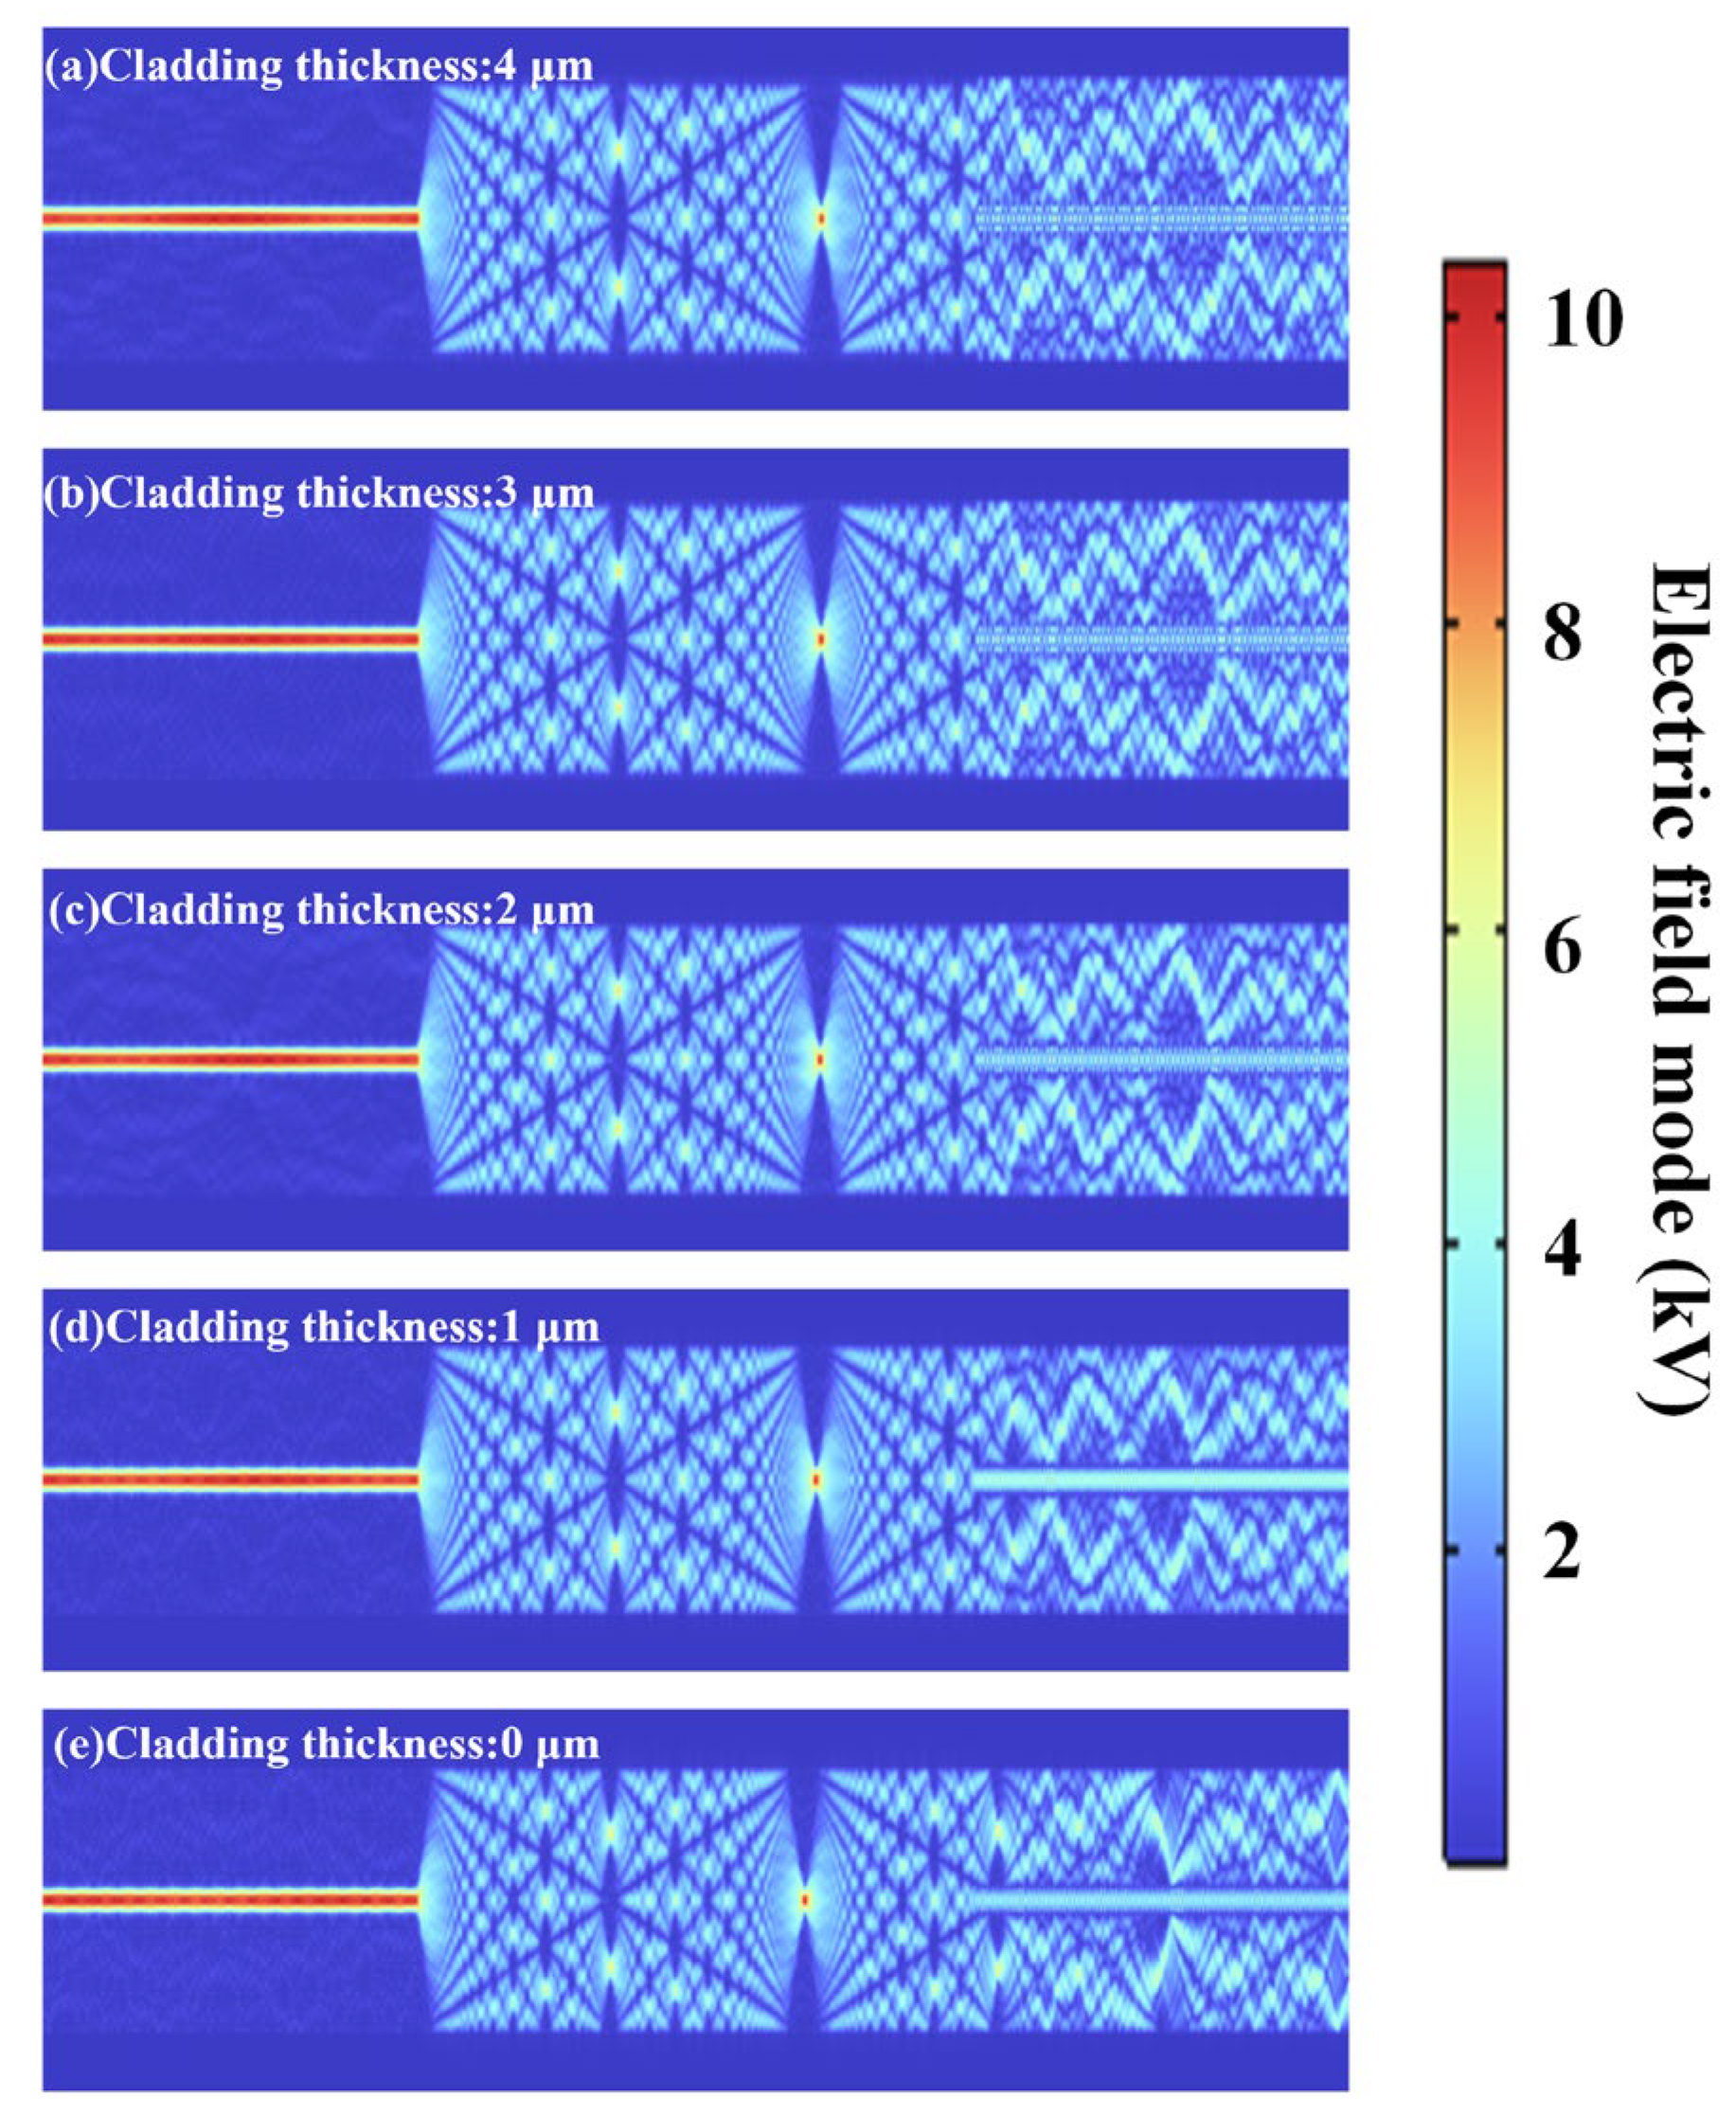
To gain deeper insight into the excitation and interference behavior of higher-order modes within the multimode fiber (MMF) segment of the SMS structure, a series of two-dimensional optical field simulations was performed using COMSOL Multiphysics (v6.2, COMSOL Inc., Stockholm, Sweden). In the COMSOL simulations, the input port was excited with the fundamental SMF mode (HE11), normalized to 1 W, while higher-order modes in the MMF were naturally generated through modal coupling. A 1-µm radial PML was applied at the lateral boundaries, and the other edges used scattering conditions to suppress reflections. The structure was meshed with a free triangular mesh, denser in the core and interfaces and coarser in the cladding, with edge divisions defined by a ceil() rule. Convergence was confirmed when the effective index variation was below 1 × 10⁻⁶ and the resonance wavelength shift was less than 0.05 nm upon refinement.
The simulation results are shown in Figure 3a–e. As light transitions from the single-mode fiber into the MMF segment, modal mismatch induces the excitation of multiple higher-order modes. These modes propagate and interfere coherently, forming characteristic multimode interference (MMI) patterns. The simulated results confirm the effectiveness of the MMI mechanism and reveal its high sensitivity to the cladding geometry.
In Figure 3a, with a cladding thickness of 4 μm, the optical field remains strongly confined near the core region. The interference pattern is dominated by lower-order modes, producing well-defined and stable fringes and resulting in weaker interaction with the external environment. As the cladding thickness decreases in Figure 3b–d, more higher-order modes are gradually excited, and the interference fringes become increasingly complex, indicating enhanced modal richness and extended spatial evolution.
In Figure 3e, where the cladding is completely removed (0 μm), the light confinement is significantly reduced. A strong evanescent field is observed, which interacts more intensively with the surrounding medium. The resulting interference pattern becomes denser and more disordered, indicating stronger external coupling and higher sensitivity to RI change. This evolution trend supports the theoretical prediction that thinner cladding enhances environmental sensitivity, thereby improving sensor performance.
It is noted that when the cladding thickness is reduced to 0 μm, the conventional step-index multimode fiber (MMF) structure transitions into a core–air configuration, significantly altering the waveguiding mechanism. In this case, the guiding condition shifts from total internal reflection to weak confinement, and the structure supports quasi-guided or leaky modes. Despite this, the simulated mode-field distributions in Figure 3e reveal that a stable multimode interference (MMI) pattern is still sustained over the short sensing region, indicating that spatial coherence among modes is preserved. Therefore, the “MMF” designation in the 0 μm case is used in a generalized sense to denote a multimode-supporting region. Moreover, the enhanced evanescent field interaction under this condition contributes to the observed increase in sensitivity, albeit with a weaker confinement regime.
It should be emphasized that this figure is primarily intended to qualitatively demonstrate the evolution of the evanescent field and modal interference as the cladding thickness decreases. The evaluation of sensing performance in this work does not rely on the absolute magnitude of the central electric-field intensity but rather on the wavelength shift in the transmission dips, which directly reflects the sensor’s response to external RI variations. Therefore, the differences in field brightness observed under different conditions (e.g., between the 1 μm and 0 μm cladding cases) are regarded as secondary effects and do not affect the main conclusions drawn from the spectral dip positions.

3. Results and Comprehensive Evaluation

3.1. Experiments and Results

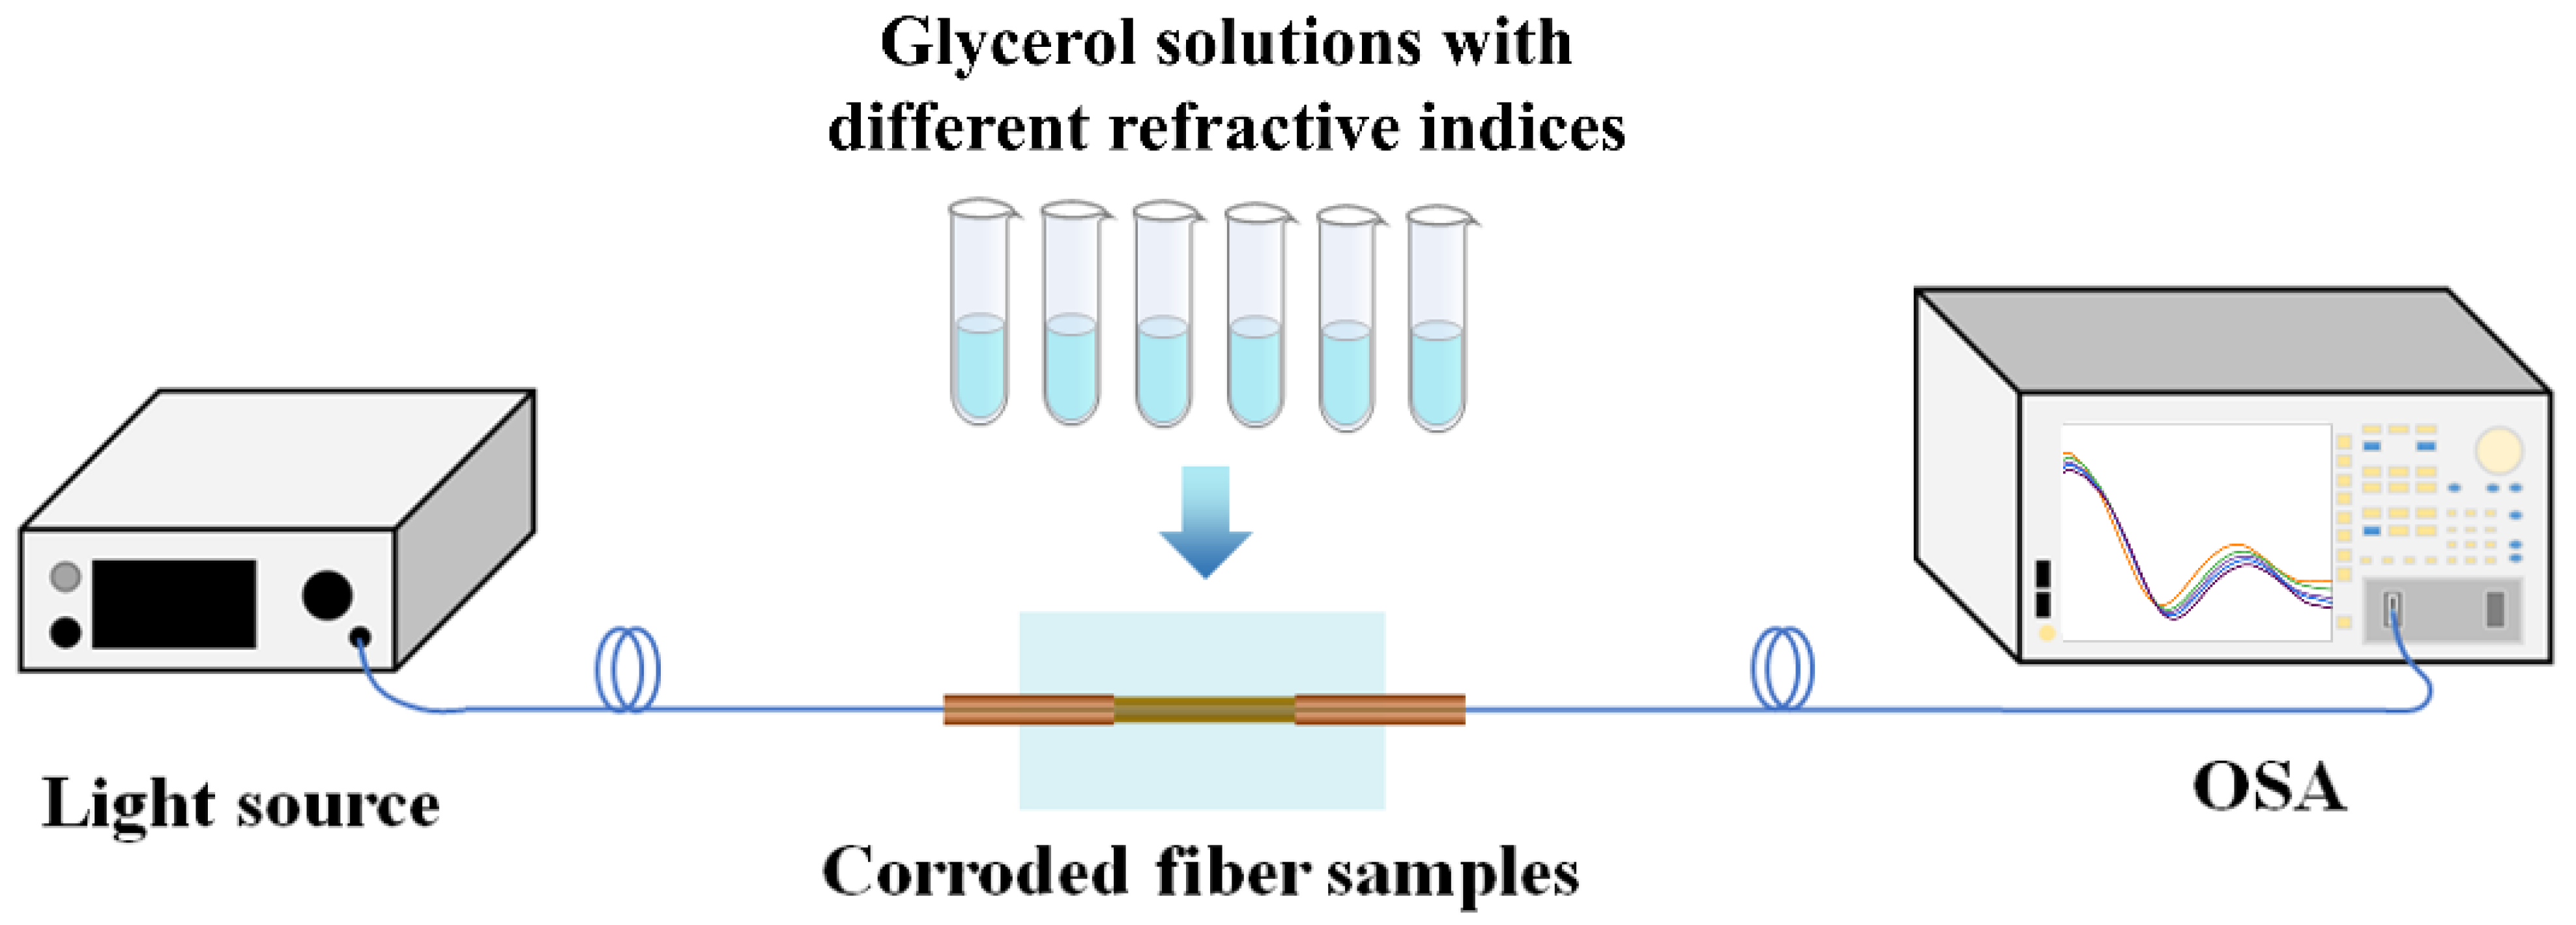
Figure 4 illustrates the experimental setup used to investigate the sensing performance of the as-fabricated five SMS sensors with different MMF cladding thicknesses. In the experiment, an Amplified Spontaneous Emission (ASE) light source was used to illuminate the SMS sensor, and the transmission spectra were recorded using an optical spectrum analyzer (OSA, AQ6370C, Yokogawa Electric Corp., Tokyo, Japan). The resolution of the OSA was set to 0.05 nm. During the measurement process, the ambient temperature was maintained at a constant level, and the sensing fiber was securely fixed to a glass substrate and positioned on a vibration-isolated optical platform to minimize the impact of external disturbances, including temperature fluctuations and mechanical stress. After each measurement, the sensing region was rinsed with anhydrous ethanol and air-dried until the transmission spectrum matched that of the sensor in air, ensuring spectral repeatability. The test liquids were aqueous glycerol solutions with RI ranging from 1.33 to 1.39. It is worth noting that the ASE light source was unpolarized. Thus, polarization effects were negligible. The stable spectral shift was observed during the experiments.
Figure 5 presents the spectral shifts for the as-fabricated five SMS sensors. As clearly observed, the sensors with MMF cladding thicknesses of 0, 1, 2, and 3 μm exhibit distinct redshifts in their interference spectra with increasing external RI. However, for the SMS sensor with an MMF cladding thickness of 4 μm, the sensor exhibits no apparent redshift in the spectrum with increasing external RI, as shown in Figure 5e.
Based on Equations (4) and (5), when d is excessively large, the energy coupling coefficient Γ(d) approaches zero, making it difficult for changes in external RI to induce a measurable variation in Δ n e f f or shift the interference spectrum. This will result in the failure of sensing. Therefore, it can be inferred that SMS sensors can effectively detect external RI changes only when the MMF cladding thickness d is less than approximately 3 μm. Hereafter, the four sensors with MMF cladding thicknesses of 0, 1, 2, and 3 μm, respectively, are employed for further comprehensive evaluation.

3.2. Comprehensive Evaluation

Sensitivity is a key metric for evaluating the performance of optical fiber sensors. Assuming that a change in the external RI (dn) induces a shift in the resonance wavelength (dλ), the sensitivity of the sensor is defined as follows:
S = d λ d n
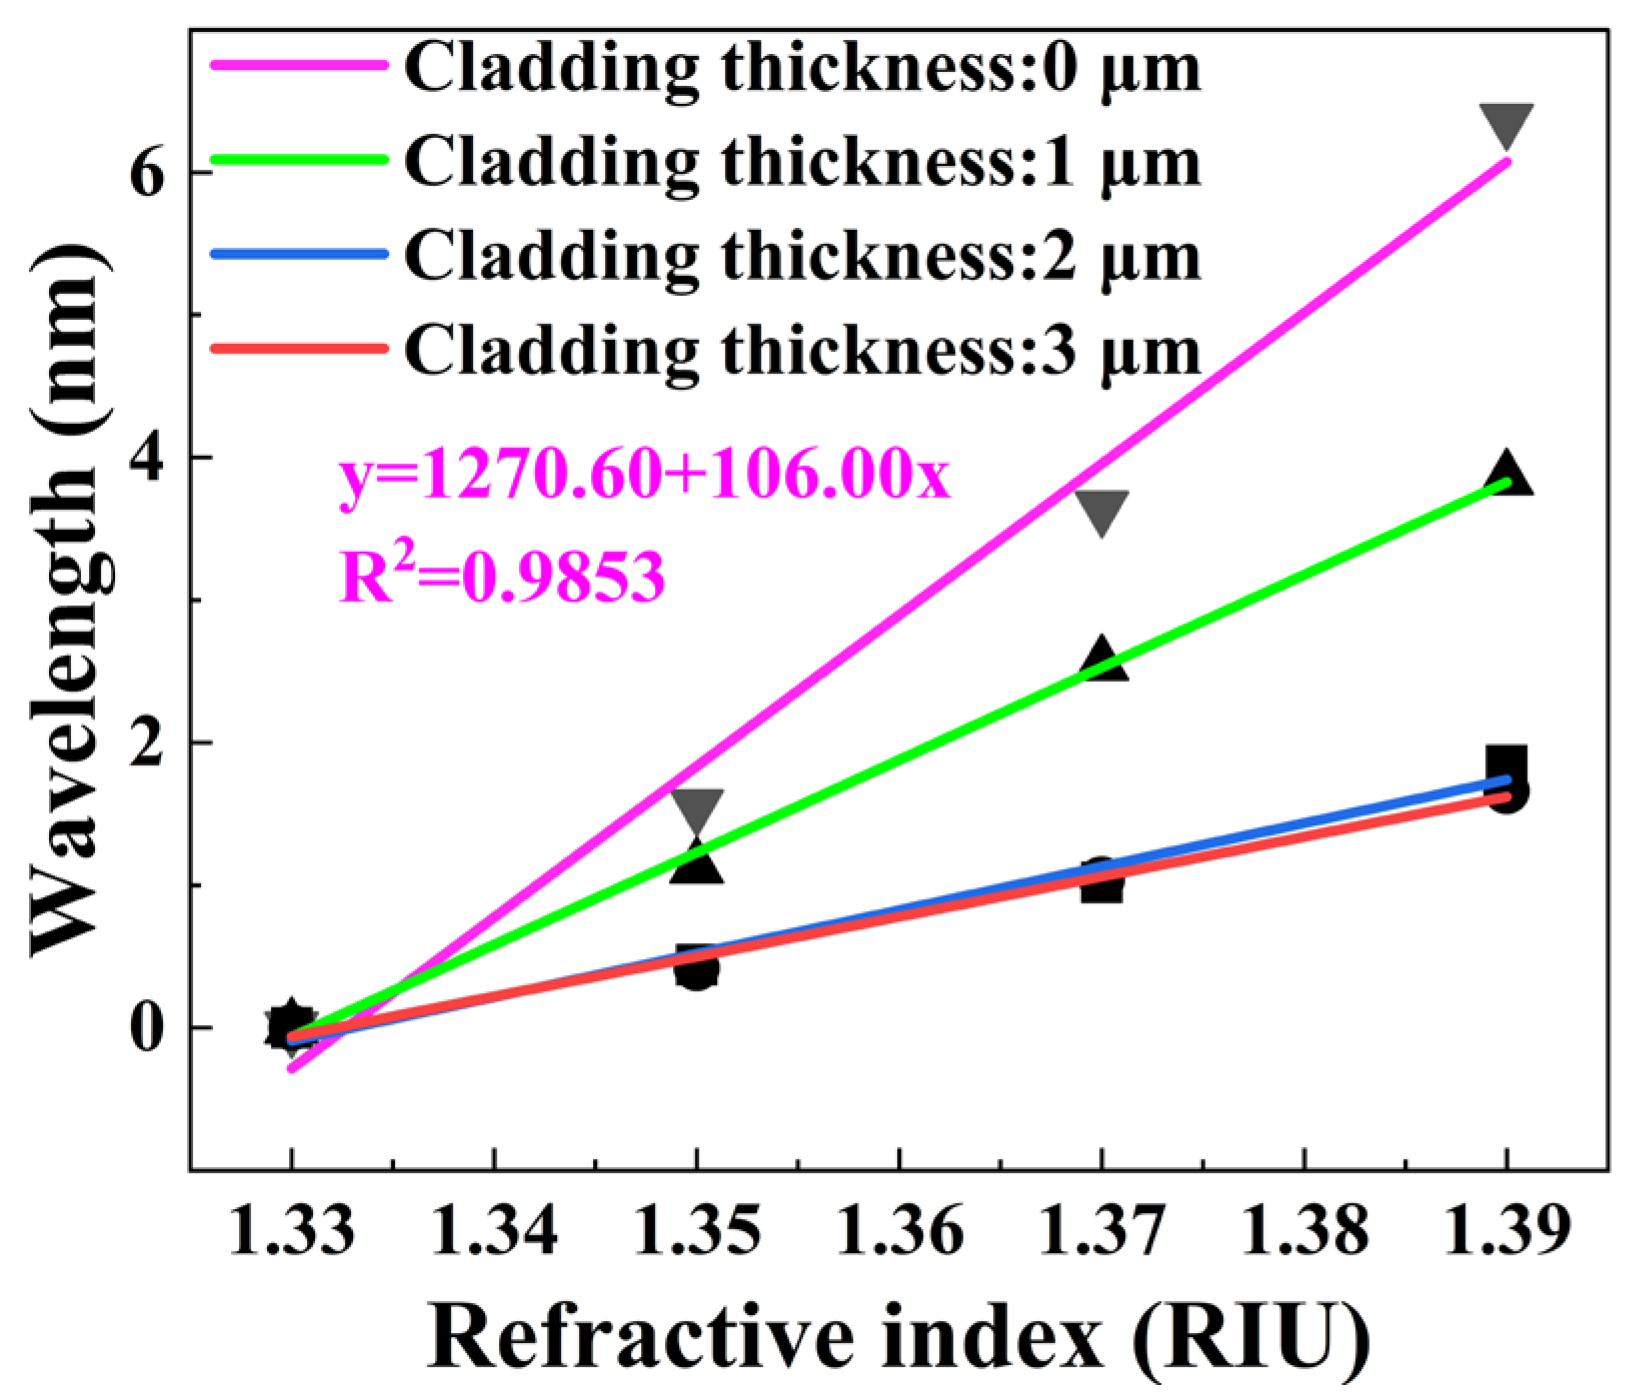
Higher sensitivity indicates that even a slight variation in the external RI can lead to a significant shift in the sensor’s output signal, making it a crucial performance parameter in optical fiber sensor research. To obtain a more accurate evaluation of sensitivity, linear fitting was applied to the experimental spectral data, with all correlation coefficients (R2) exceeding 0.9853, as shown in Figure 6. As the cladding thickness decreases, the slope of the fitted curve increases progressively. When the cladding thickness is reduced to 0 μm, the slope reaches its maximum value of 106.00.
In addition, LOD is another critical parameter for evaluating sensor performance, as it reflects the sensor’s ability to detect small changes in RI. In this study, the LOD was calculated using the following equation:
L O D = R S
It is important to note that the resolution refers to the minimum distinguishable spectral linewidth of the OSA utilized, which directly affects the precision in detecting resonance dips.
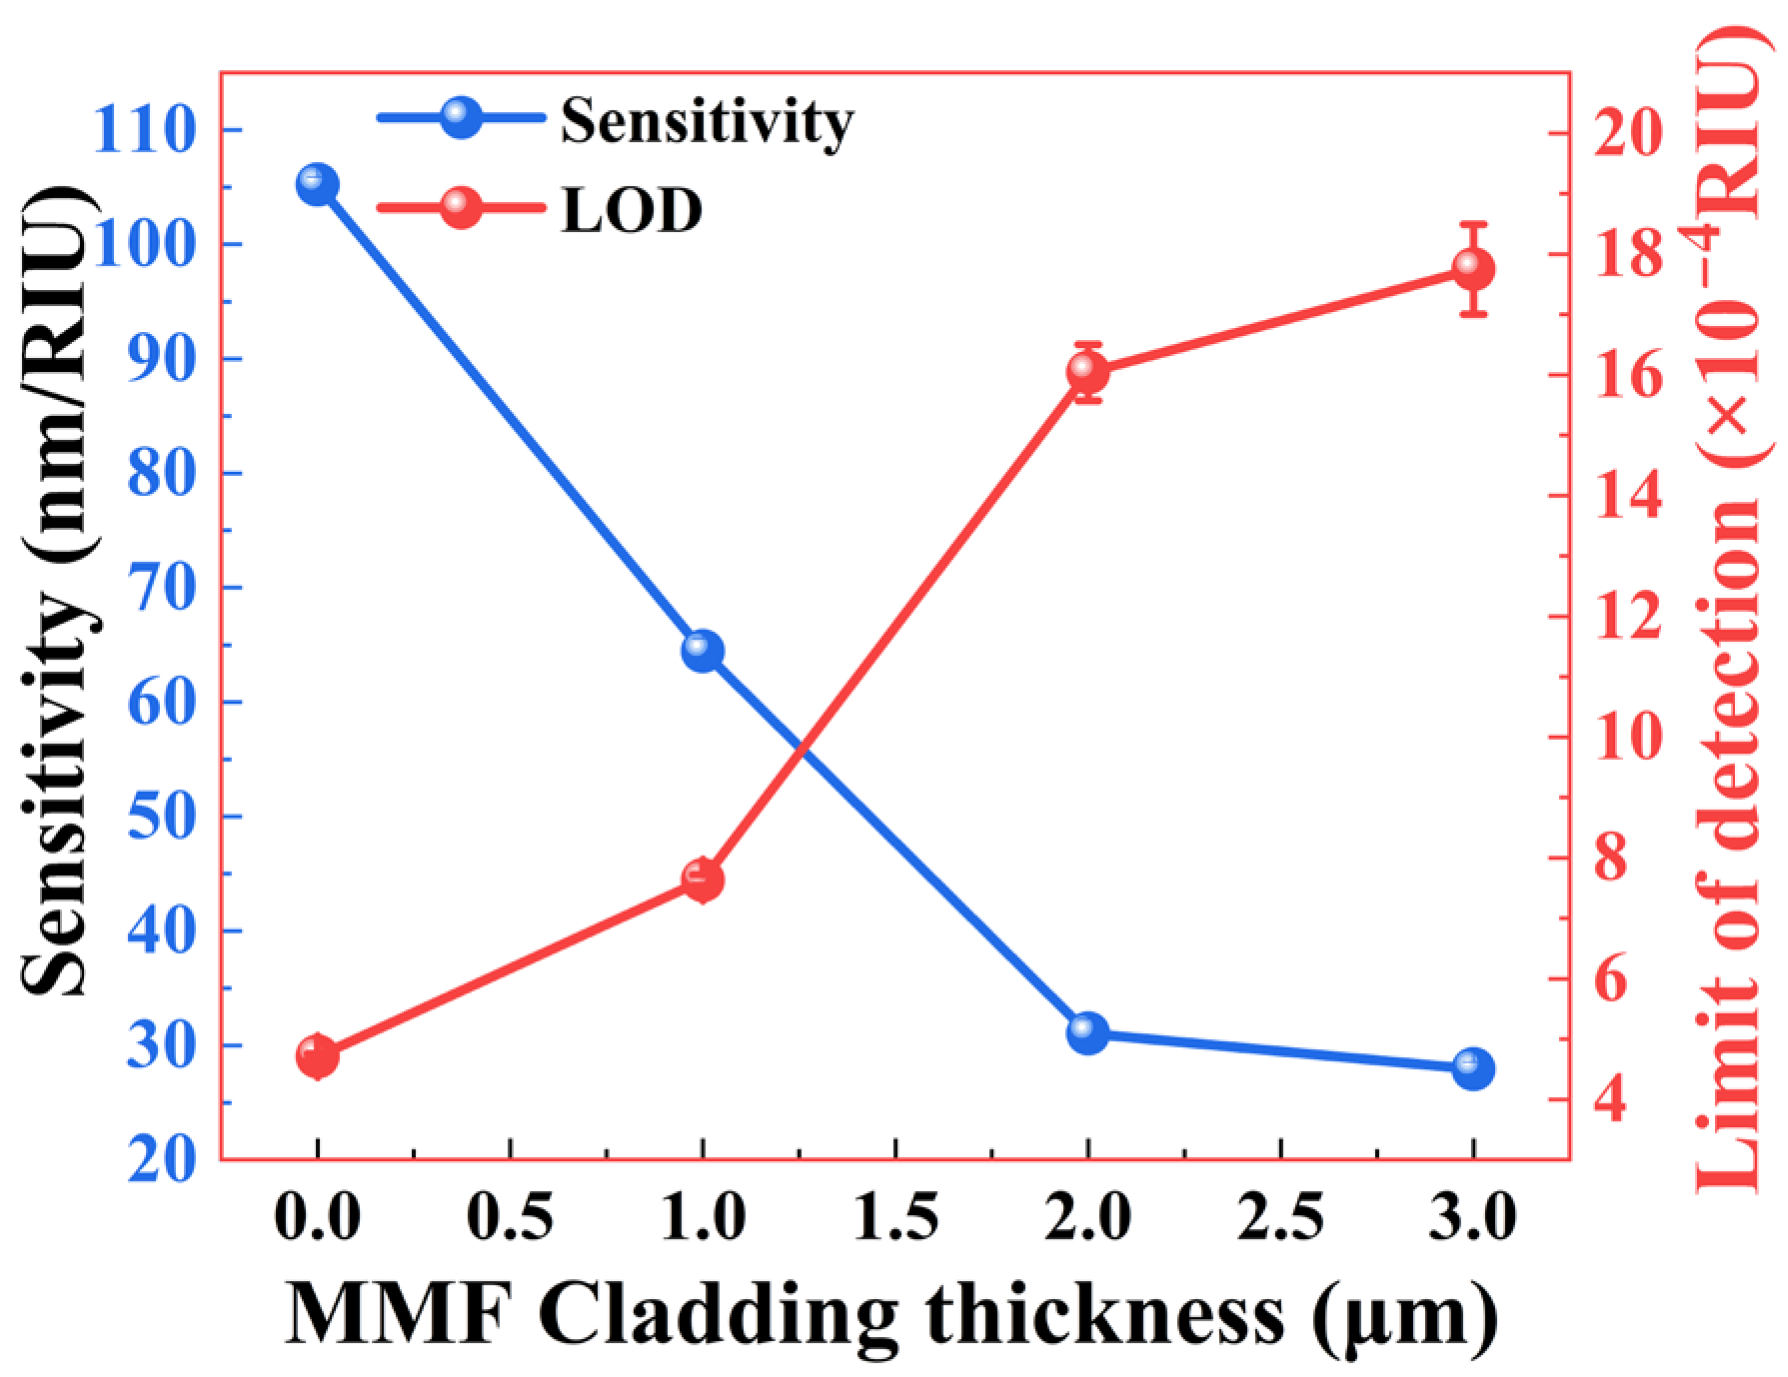
Figure 7 illustrates the sensitivity and LOD of the as-fabricated four SMS sensors with different MMF cladding thicknesses. As observed, the sensitivity decreases with increasing cladding thickness, while the LOD shows an upward trend. Each data point was obtained by averaging the results of three independent repeated measurements to ensure reliability. When the MMF cladding thickness is reduced to 0 μm, the sensor achieves the highest sensitivity of 106.00 nm/RIU, with a corresponding LOD of 4.72 × 10⁻⁴ RIU, indicating superior sensing performance and enhanced detection accuracy. These findings align well with the theoretical predictions, which suggest that reducing the cladding thickness enhances the coupling between the evanescent field and the external environment, thereby improving the sensor’s responsiveness to RI variations.
The Q-factor is a key parameter for evaluating the energy loss characteristics of optical fiber sensors. It is commonly used to quantify the sharpness of resonance peaks and signal quality. In this study, the Q-factor is calculated using the following equation:
Q = λ 0 FWHM
where λ0 denotes the resonance wavelength, and FWHM represents the full width at half maximum of the resonance curve. A higher Q-factor typically indicates greater energy efficiency and lower energy loss. In addition, a smaller FWHM signifies better resonance peak quality and higher spectral resolution. Therefore, a comprehensive evaluation of both Q-factor and FWHM is essential for characterizing sensor performance.
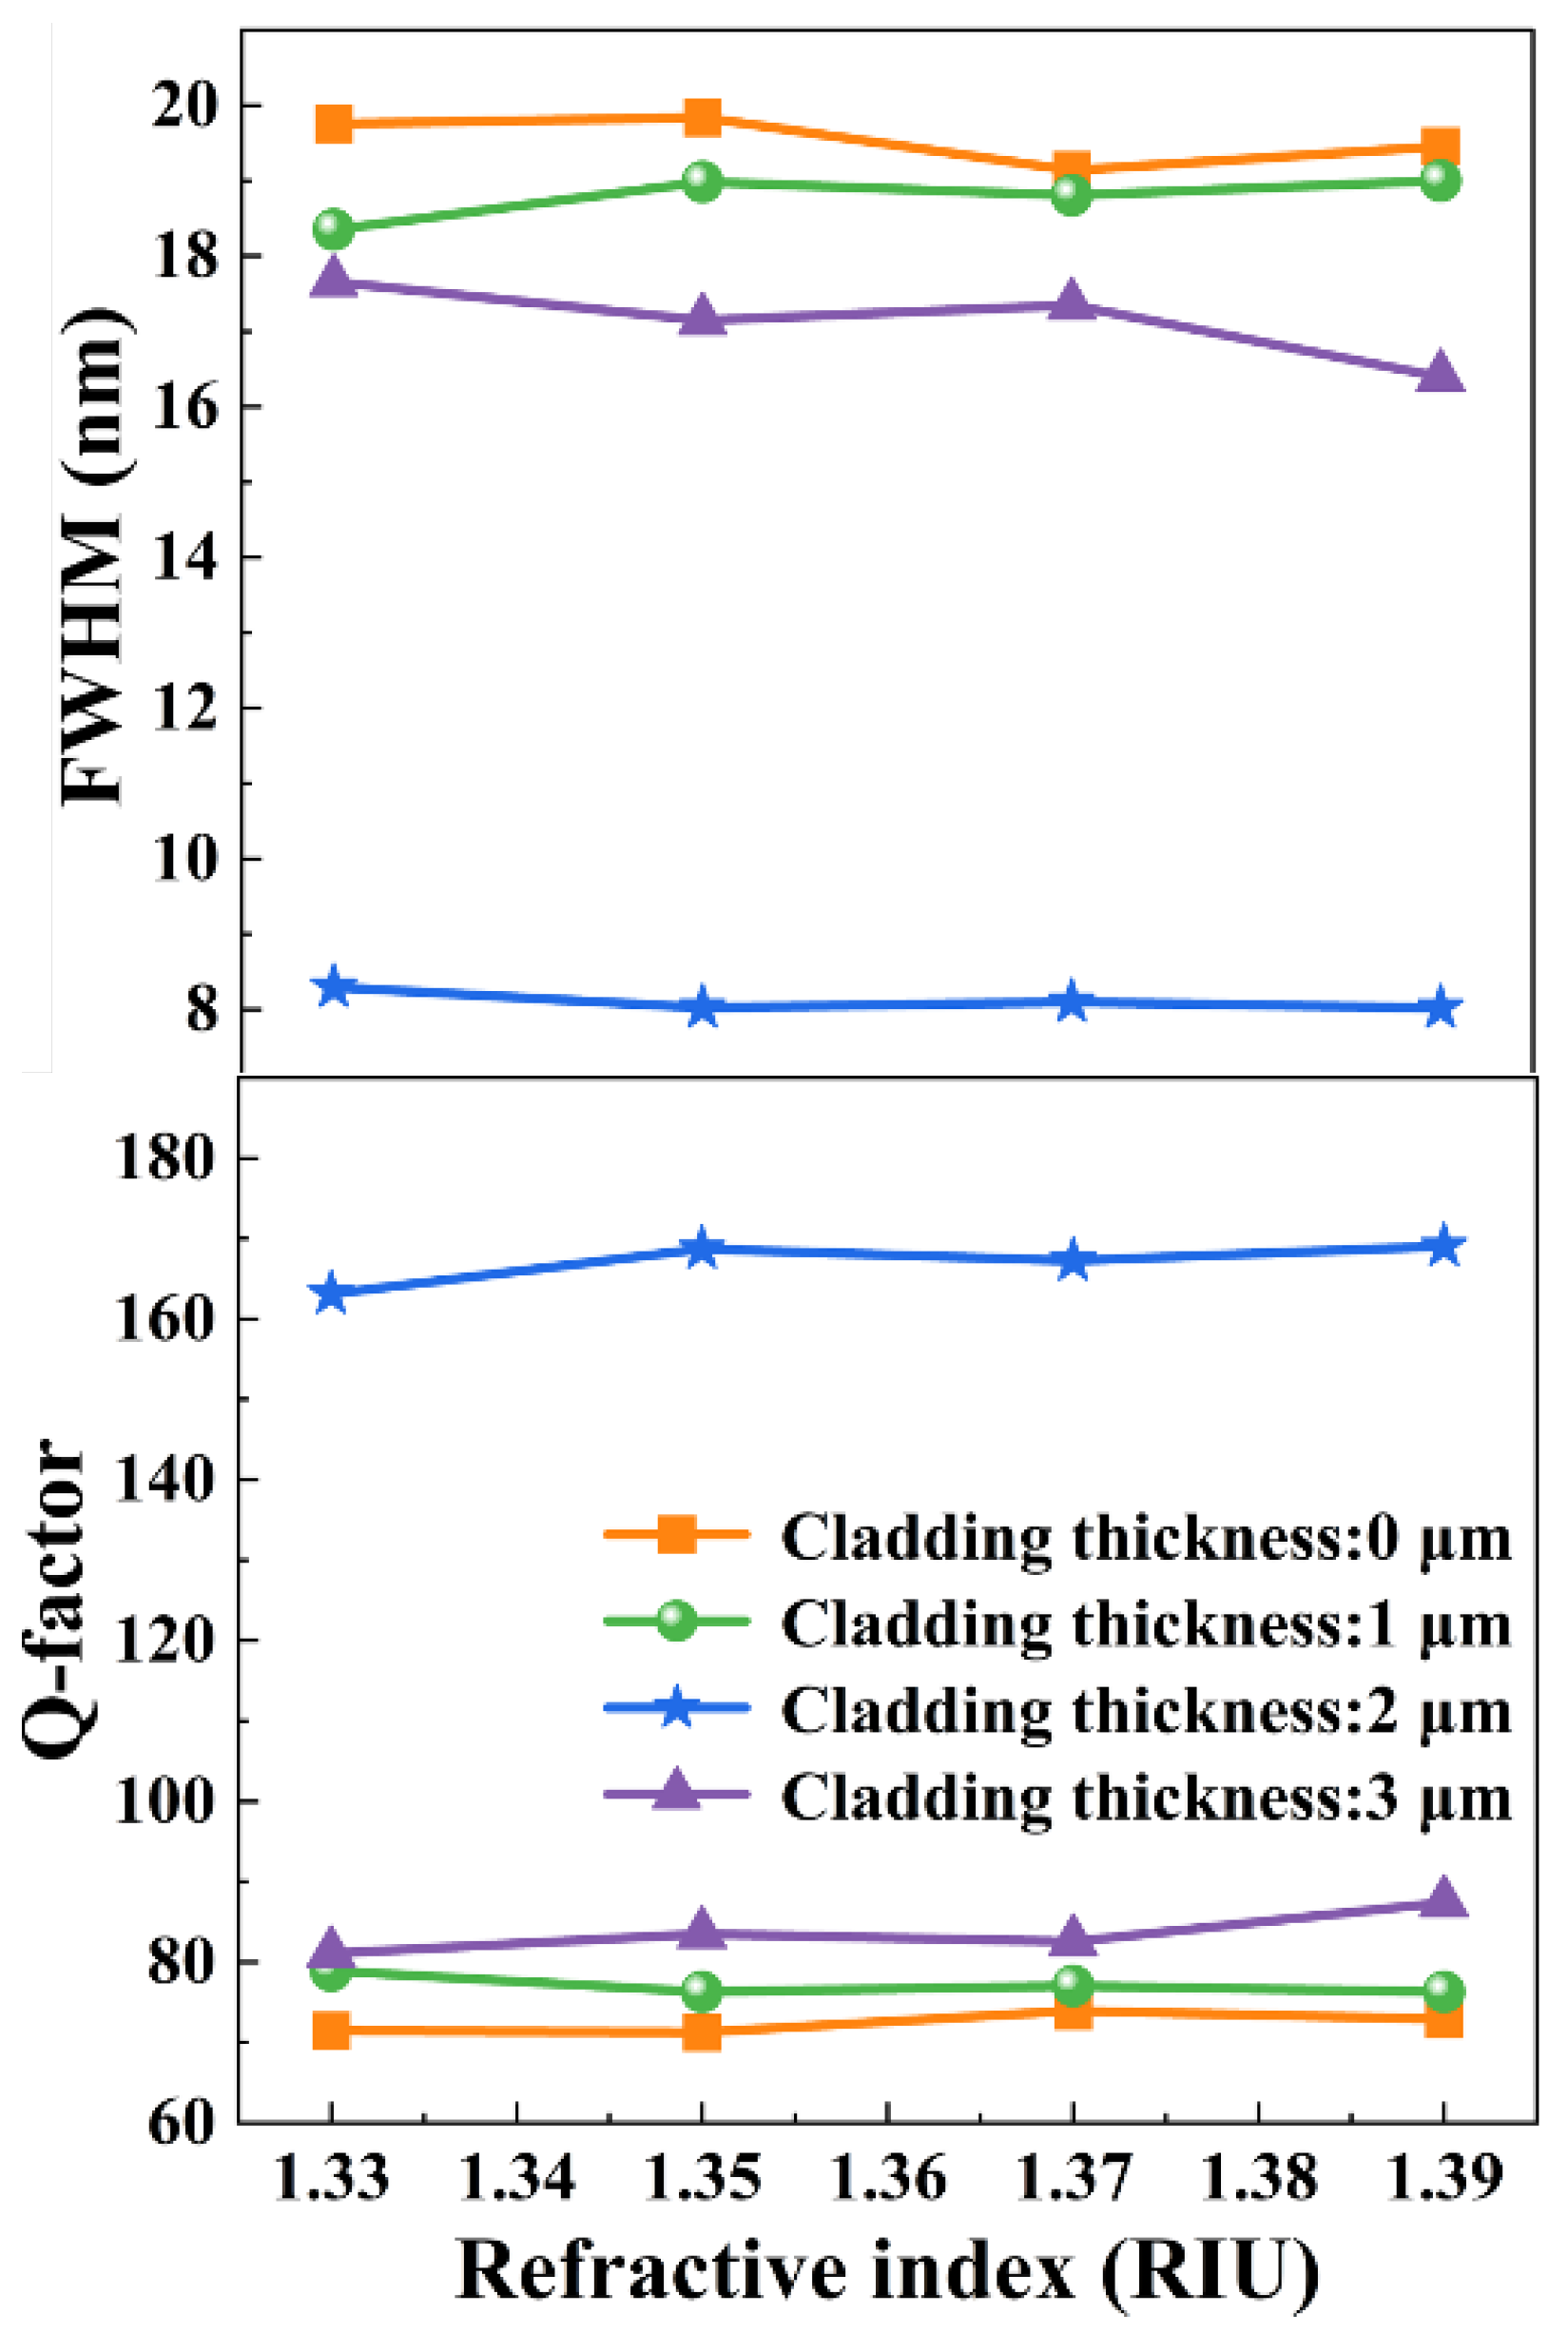
Figure 8 presents the FWHM and Q-factor of the as-fabricated four SMS sensors. The FWHM exhibits a trend of initially decreasing and then increasing with the growth of MMF cladding thickness. In contrast, the Q-factor shows an opposite trend—first increasing and then decreasing. Each data point was obtained by averaging the results of three independent repeated measurements to ensure reliability. When the MMF cladding thickness reaches 2 μm, the sensor achieves a maximum Q-factor of 169.02 and a minimum FWHM of 8.02 nm, demonstrating its minimal energy loss and superior spectral resolution during resonance. This comprehensive performance enables the sensor to exhibit strong resistance to external disturbances, making it highly suitable for high-resolution and high-stability sensing applications.
The FOM effectively characterizes the sharpness and resolution of the sensor’s resonance peak or valley, serving as an important parameter for evaluating sensing performance. In this study, the FOM is calculated using the following equation:
F O M = S F W H M
A higher FOM indicates that the sensor not only retains high sensitivity but also exhibits superior spectral resolution, which is crucial for improving the detection accuracy of the sensor. Therefore, during the investigation of the impact of MMF cladding thickness on the sensor performance, a comprehensive evaluation of the FOM is necessary.
Additionally, the CEI is an important metric used to quantify the overall performance of the sensor. It integrates multiple performance parameters, such as sensitivity and FOM, for a holistic assessment of the sensor’s capabilities. The CEI can be calculated using the following equation [29]:
CEI = S × R V D F W H M
where RVD represents the degree of resonance dip power attenuation relative to the baseline, expressed as a percentage, which reflects the signal contrast. To obtain more accurate RVD data, we need to convert the y-axis (dBm) values in the spectra (see Figure 5) to percentages. This conversion can be calculated using the following equation:
RVD   ( dB ) = P baseline P dip RVD ( % ) = 1 10 RVD   ( dB ) / 10 × 100 %
where P baseline is the baseline power, which refers to the average power in the flat region of the transmission spectrum, far from the resonance dip. P dip is the resonance dip power, which corresponds to the power at the lowest point of the resonance dip. Moreover, to mitigate the influence of high-frequency noise on the extraction of RVD and the calculation of CEI, a Savitzky–Golay smoothing filter was applied to the experimental transmission spectra using OriginPro 2024 (OriginLab Corporation, Northampton, MA, USA). This filtering technique significantly suppresses random spectral fluctuations while preserving the integrity of the resonance valley shape and depth, thereby improving the reliability and precision of power level determination and subsequent parameter analysis.
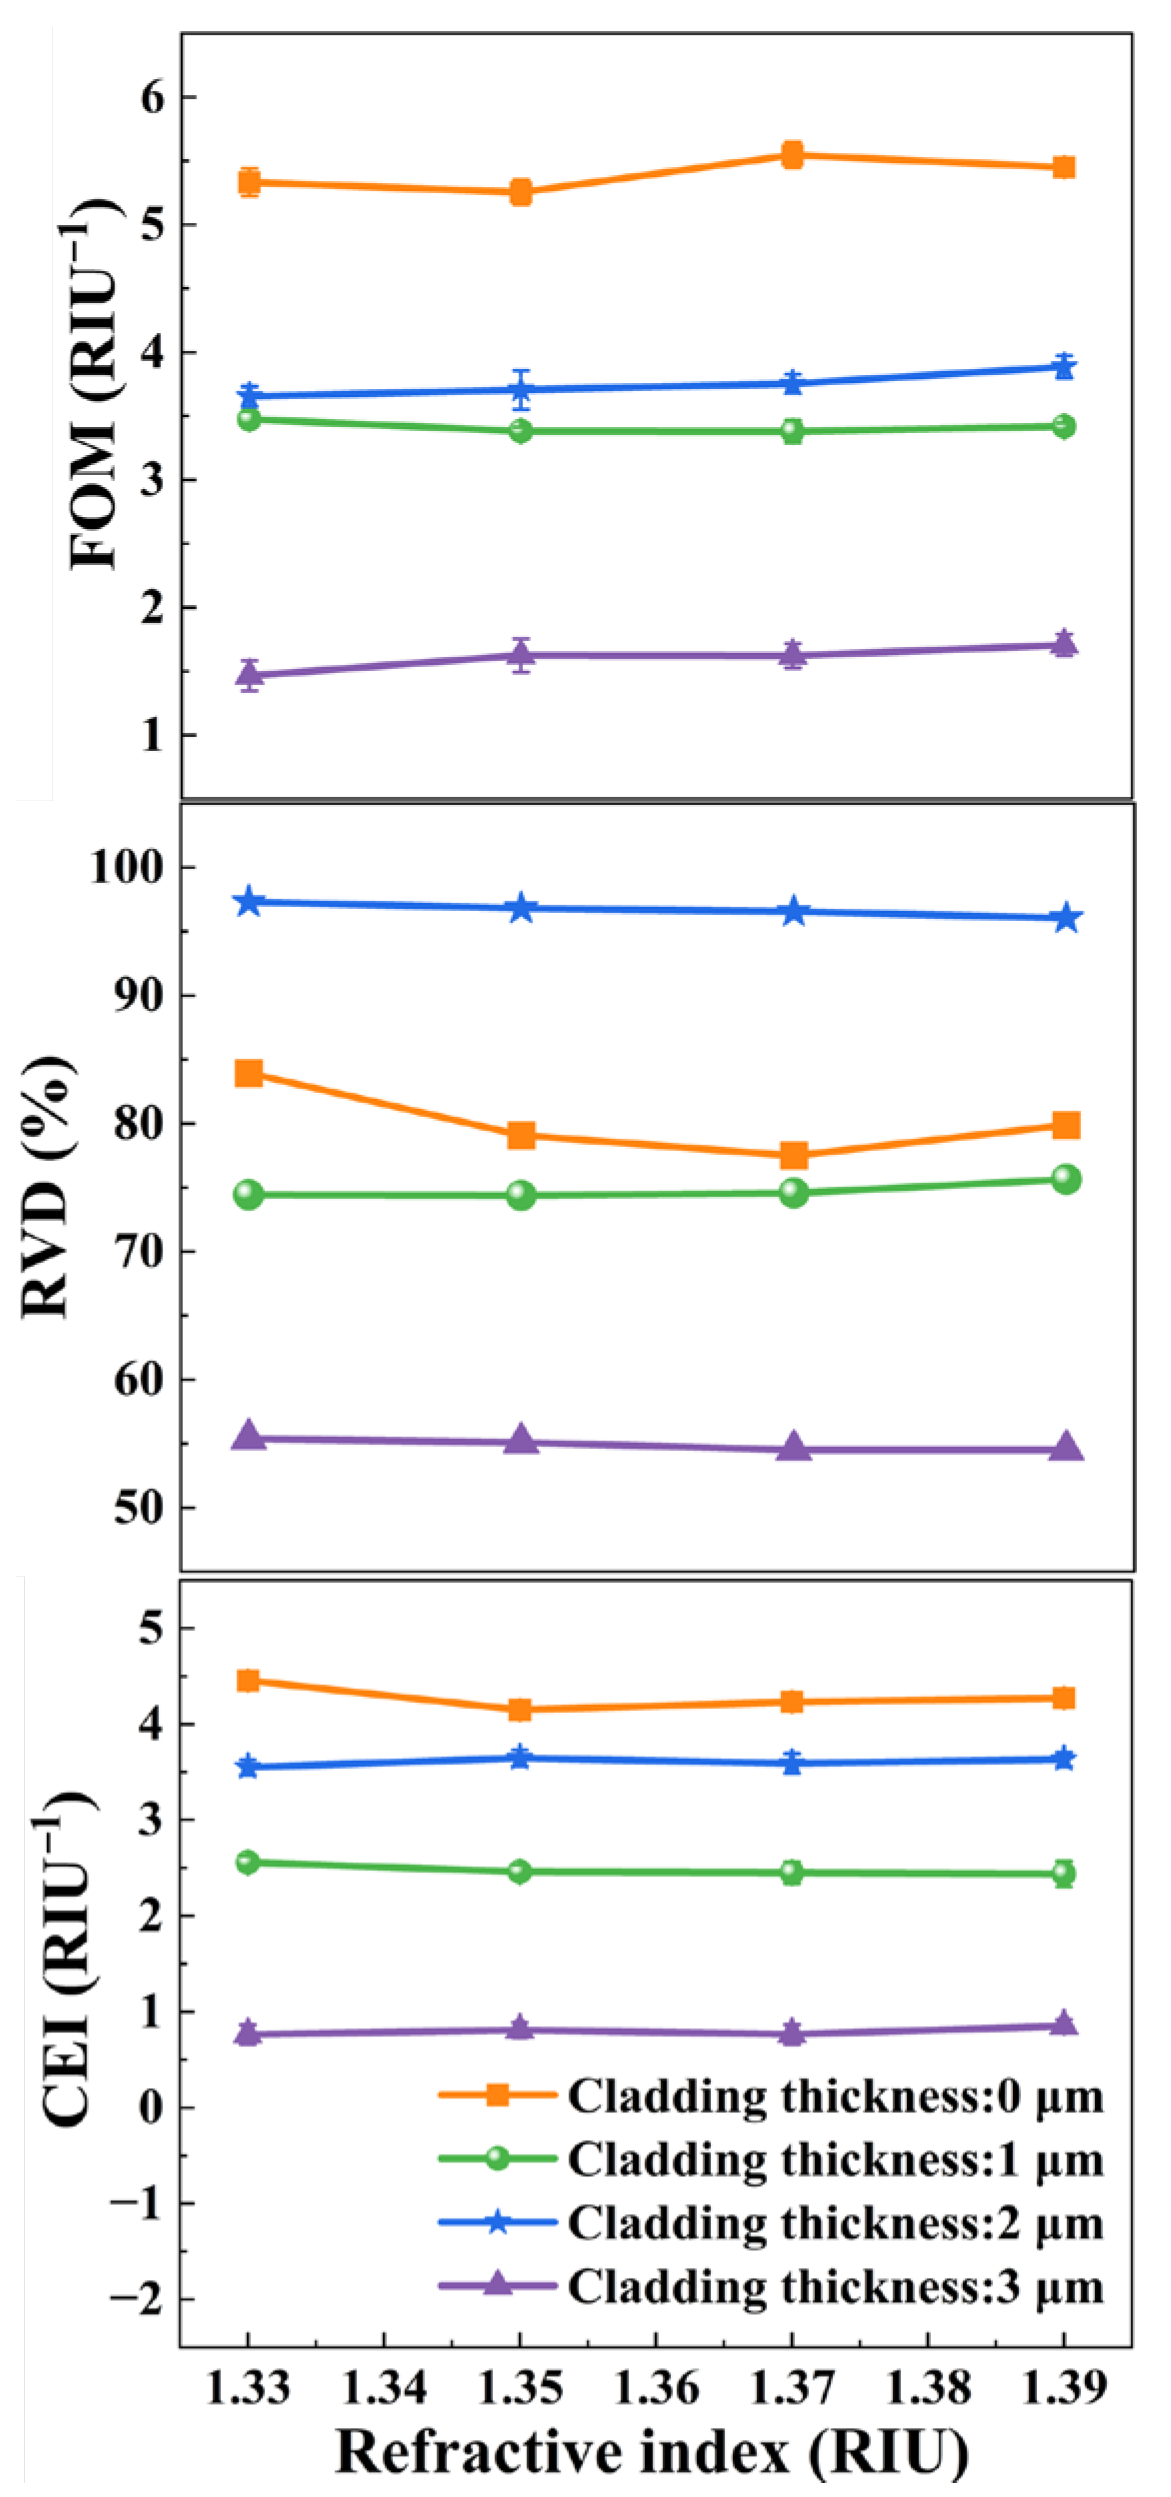
Figure 9 presents the FOM, RVD, and CEI of the as-fabricated four SMS sensors, which reveals that the SMS sensor with an MMF cladding thickness of 0 μm achieves the highest FOM (5.54 RIU−1) and the highest CEI (4.50 RIU−1). All data were obtained by averaging the results of three independent repeated measurements to ensure accuracy and repeatability. Meanwhile, the SMS sensor with an MMF cladding thickness of 2 μm exhibits the highest RVD (97.30%), indicating stronger signal contrast and reduced noise influence. Therefore, depending on the application scenario, one can choose a sensor with high FOM and CEI to enhance resolution and multi-parameter detection, or opt for a sensor with high RVD to improve noise resistance.
Table 1 summarizes the performance of the four fabricated sensors across six key performance metrics. Based on the data comparison and comprehensive evaluation from Table 1, the sensor with an MMF cladding thickness of 0 μm exhibits the highest sensitivity (106.00 nm/RIU), the lowest LOD (4.72 × 10⁻⁴ RIU), the highest FOM (5.54 RIU−1), and the highest CEI (4.50 RIU−1). The sensor with an MMF cladding thickness of 2 μm demonstrates the smallest FWHM (8.02 nm), the highest Q-factor (169.02), and the highest RVD (97.30%), indicating the lowest energy loss.
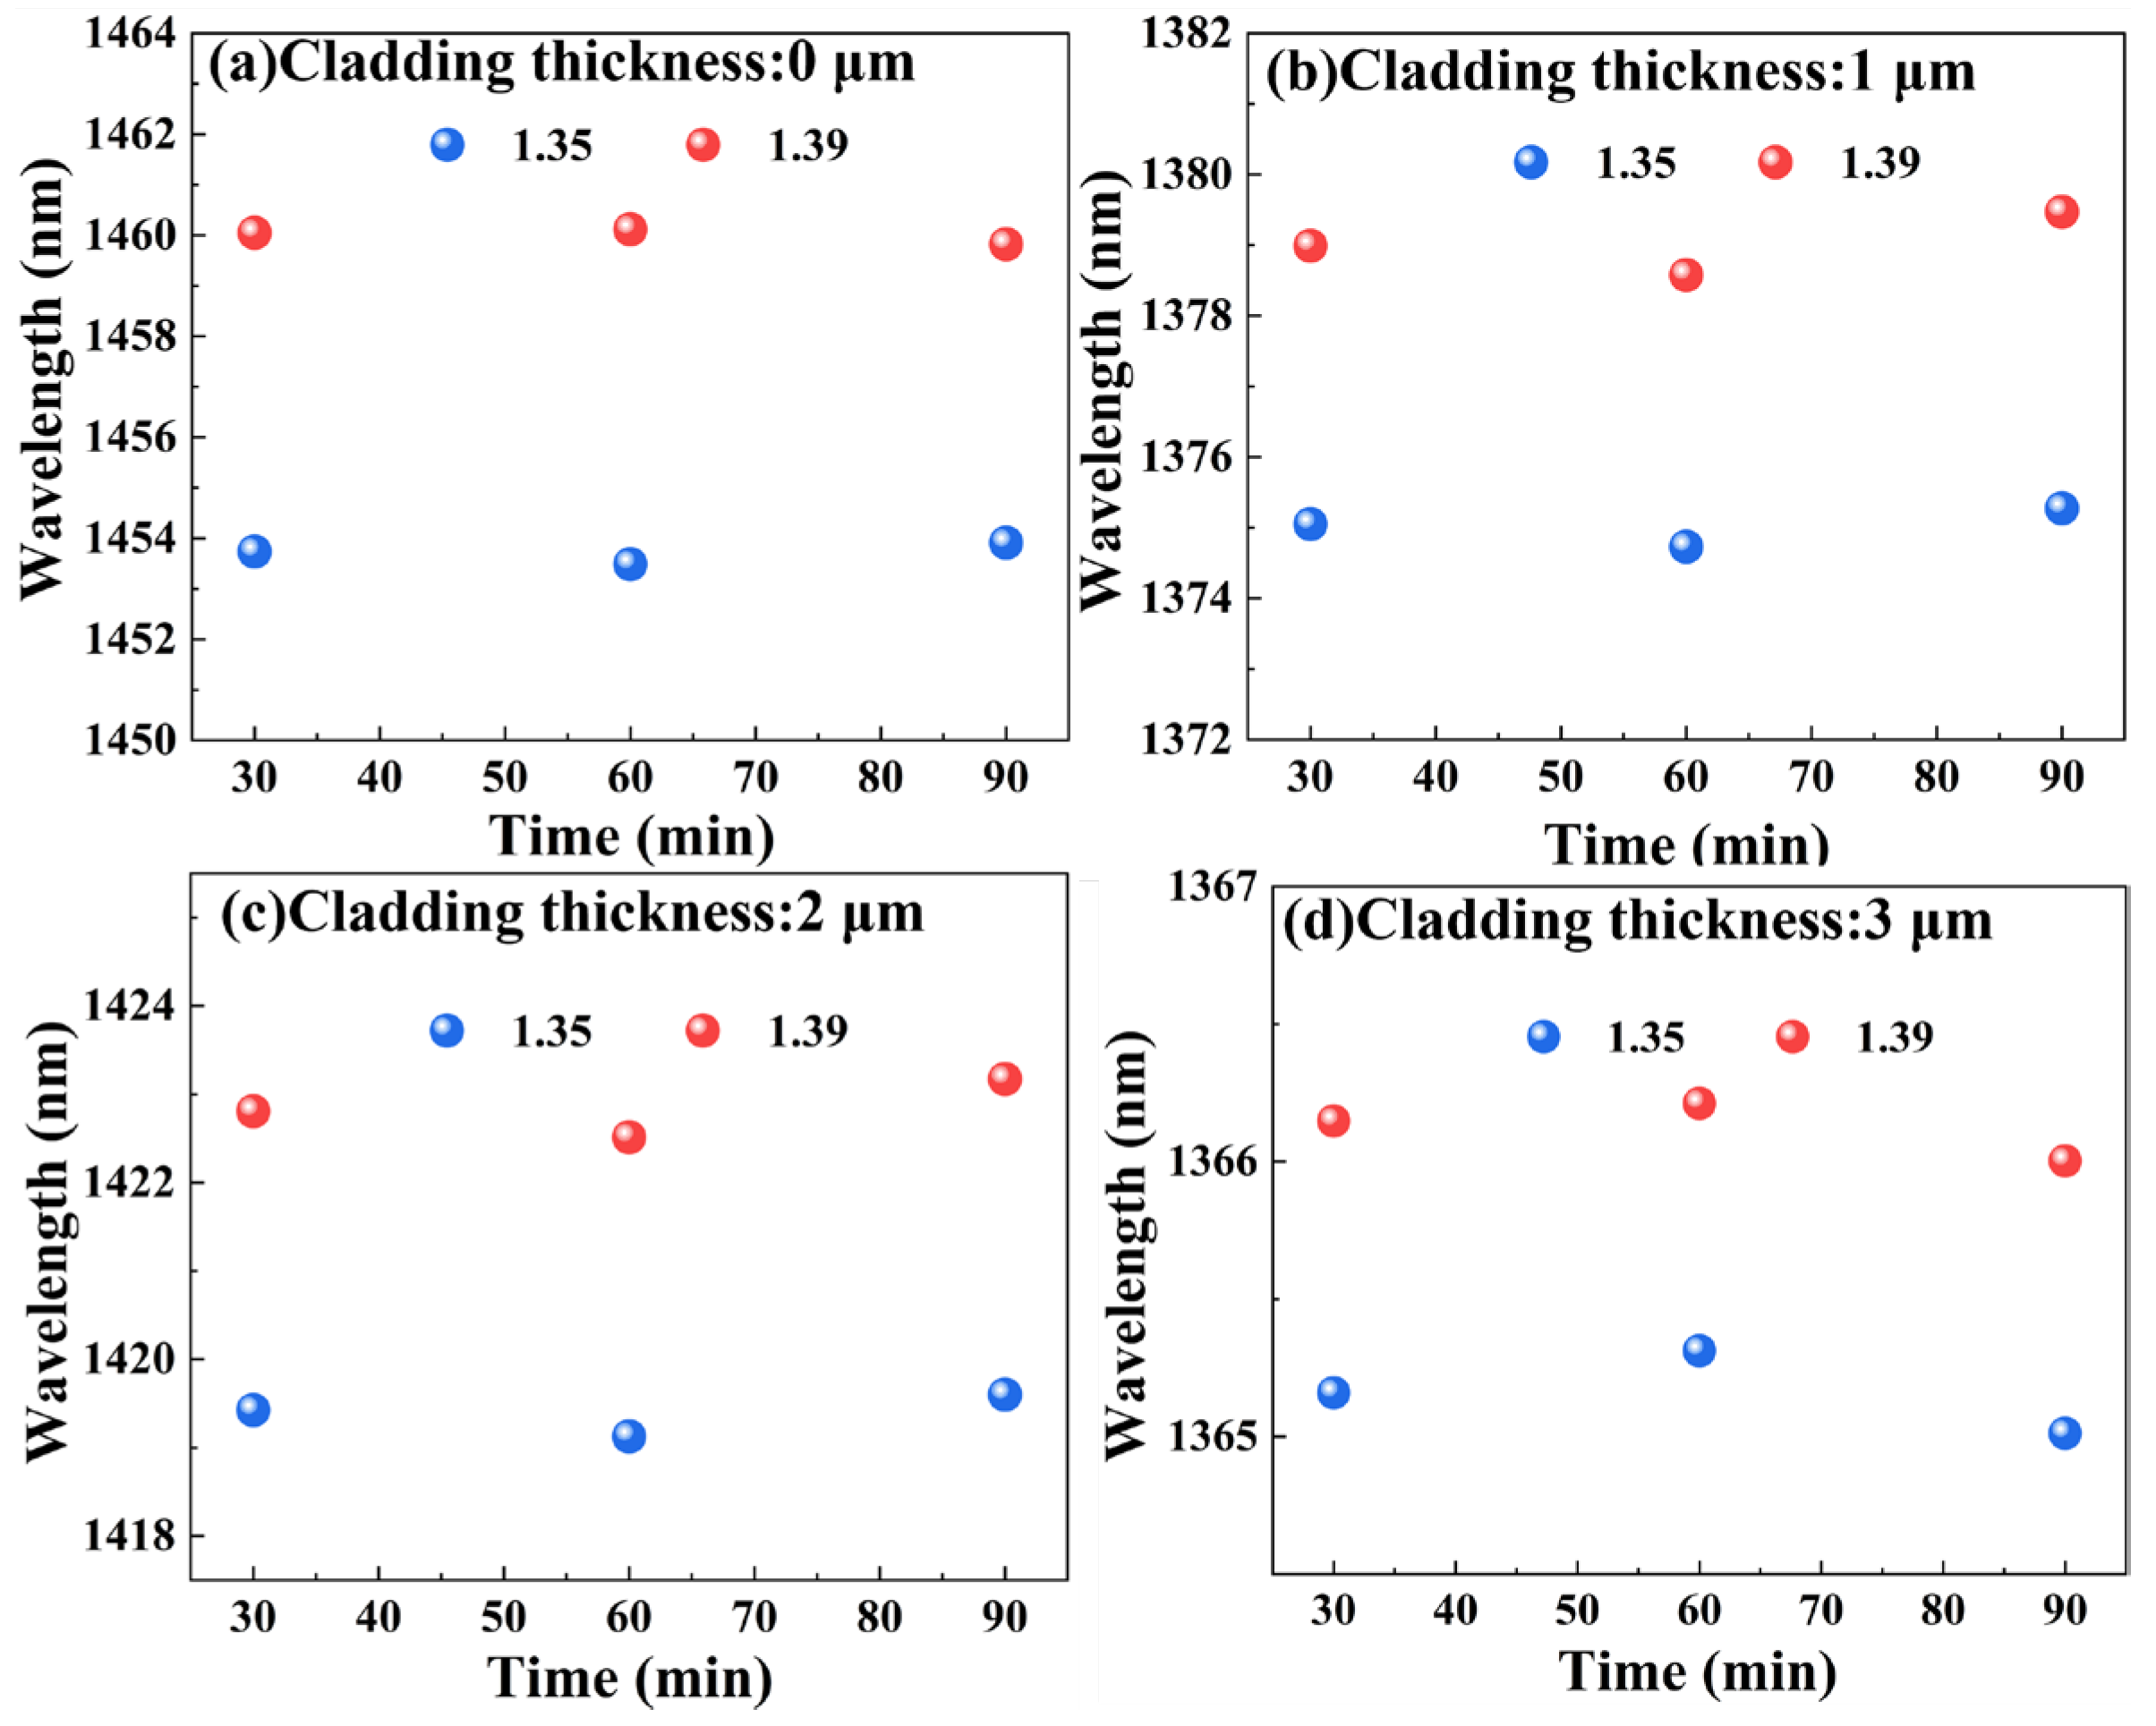
To further evaluate the impact of MMF cladding thickness on sensor stability, four sensors were subjected to a 90 min stability test at external refractive indices of 1.35 and 1.39. After immersing the sensors in solutions with fixed refractive indices for thirty minutes, measurements were taken at 30 min intervals. Experimental results in Figure 10 demonstrate negligible variations in the transmission spectra of all four sensors during the 90 min stability assessment. For quantitative evaluation of spectral stability, the standard deviation of resonance wavelengths was calculated from repeated measurements at two representative refractive indices (1.35 and 1.39). At a refractive index of 1.35, the standard deviations for sensors with cladding thicknesses of 0, 1, 2, and 3 μm were 0.22, 0.26, 0.23, and 0.17 nm, respectively. Corresponding values at a refractive index of 1.39 were 0.17, 0.44, 0.31, and 0.14 nm. The consistently low fluctuations across all configurations confirm excellent repeatability in sensor response. These findings indicate that MMF cladding thickness has no significant effect on the stability of the proposed SMS sensor.

4. Discussion

The SMS fiber structure has garnered significant attention in RI sensing due to its compact configuration, low cost, and well-defined interference characteristics. Prior studies have primarily focused on the influence of the MMF segment’s core diameter and length. For instance, Wu et al. [30] reported that decreasing the core diameter enhances modal coupling and sensitivity, while variations in MMF length had negligible effects. However, little attention has been paid to the impact of the cladding structure on modal behavior and optical field distribution.
To enhance the interaction between guided modes and the external environment, Socorro et al. [31] proposed coating the MMF surface with high-index films to induce mode transition and improve sensitivity. Despite performance gains, the reliance on functional coatings and complex fabrication limits practicality. Wang et al. [32] employed core-offset splicing to excite high-order modes and modulate interference patterns. However, this approach compromises symmetry and reproducibility and lacks a comprehensive performance evaluation.
In this work, we introduce the cladding thickness of the MMF segment as a key structural variable. Five SMS sensors with different cladding thicknesses were fabricated to systematically investigate their sensing behavior. A multi-metric performance framework was established by evaluating six key indicators: sensitivity, full width at half maximum (FWHM), quality factor (Q-factor), figure of merit (FOM), limit of detection (LOD), and a newly defined CEI.
The results indicate that cladding thickness has a significant impact on modal excitation, interference behavior, and the strength of the evanescent field. When the cladding is fully removed (bare core), extensive high-order and cladding modes are excited, enhancing the evanescent field penetration and achieving the highest sensitivity (106.00 nm/RIU), as well as optimal FOM and CEI. However, such configurations suffer from spectral broadening (FWHM = 19.14 nm) and reduced interference contrast. As the cladding thickness increases to 1–2 μm, modal confinement improves, resulting in sharper and more stable interference patterns. This results in a significantly narrower FWHM and the highest Q-factor (169.02), albeit at the expense of reduced sensitivity. Further increasing the cladding thickness to 3–4 μm results in stronger modal confinement within the core, thereby reducing environmental perturbation effects and decreasing both sensitivity and spectral modulation depth.
Overall, thinner cladding enhances light–matter interaction and sensing sensitivity at the cost of spectral stability, whereas thicker cladding offers better spectral resolution and stability with lower sensitivity. These findings reveal a multi-physics coupling mechanism governed by cladding thickness and highlight a critical trade-off between sensitivity and stability in SMS sensor design.
In contrast to previous SMS studies that relied on coatings or asymmetric splicing, this work introduces MMF cladding thickness as a simple and controllable design parameter. This strategy preserves structural symmetry, avoids complex fabrication steps, and offers high reproducibility and manufacturability. Moreover, by systematically evaluating the influence of cladding thickness, we demonstrate that the proposed design enables tailored trade-offs between sensitivity and spectral stability, allowing the sensor to be optimized for different application scenarios. The inclusion of CEI further provides a unified criterion for balancing multiple performance objectives. Together, these advantages distinguish our cladding—thickness–engineered SMS sensor as a practical, flexible, and high-performance solution for refractive index sensing.

5. Conclusions

In this work, SMS fiber sensors with five different MMF cladding thicknesses were designed and fabricated. The effect of cladding thickness on sensor performance was comprehensively evaluated using six key parameters. The sensor with an MMF cladding thickness of 0 μm demonstrated the best overall performance, including the highest sensitivity, lowest LOD, and superior FOM and CEI. It is worth noting that sensors with a cladding thickness of 0 μm, although demonstrating superior performance metrics, are significantly more prone to contamination and physical damage under harsh environmental conditions—a drawback that should not be overlooked in practical applications. In contrast, the sensor with an MMF cladding thickness of 2 μm exhibited the lowest energy loss and highest Q-factor. Furthermore, stability tests confirmed that cladding thickness does not affect sensor stability. These findings offer valuable insights for optimizing SMS sensor designs and expanding their applications in high-performance RI sensing.

Author Contributions

Conceptualization, G.N. and Y.W.; Methodology, G.N.; Software, G.N.; Validation, G.N. and Y.W.; Formal analysis, G.N. and Q.S.; Investigation, G.N.; Resources, S.P.; Data curation, G.N.; Writing—original draft preparation, G.N.; Writing—review and editing, S.P.; Visualization, G.N.; Supervision, S.P.; Project administration, G.N.; Funding acquisition, G.N. All authors have read and agreed to the published version of the manuscript.

Funding

This research was funded by the Natural Science Foundation of Shanghai (Grant No. 23ZR1443300), the Program of Shanghai Academic Research Leader (Grant No. 23XD1402200), and the National Natural Science Foundation of China (Grant No. 62075130).

Data Availability Statement

The original contributions presented in this study are included in the article. Further inquiries can be directed to the corresponding author.

Conflicts of Interest

The authors declare no conflict of interest.

References

  1. Shi, X.; Ge, K.; Tong, J.-H.; Zhai, T. Low-cost biosensors based on a plasmonic random laser on fiber facet. Opt. Express 2020, 28, 12233–12242. [Google Scholar] [CrossRef] [PubMed]
  2. Wang, L.; Li, C.; Cai, J.; Wu, S.; Dai, M.; Geng, Y.; Yi, D.; Li, X. Fabry–Perot interference optical fiber biosensor based on the ECF for label-free DNA detection. Appl. Opt. 2025, 64, 2255–2260. [Google Scholar] [CrossRef] [PubMed]
  3. Gu, C.; Liu, X.; Lang, X.; Zhang, W.; Singh, R.; Li, G.; Xie, Y.; Zhang, B.; Kumar, S. Development of a core-offset-based SMS fiber structure for detection of various biomolecules. Appl. Opt. 2023, 62, 1992–1998. [Google Scholar] [CrossRef] [PubMed]
  4. Jena, J.; Swanepoel, F.; Mahed, G.; Waswa, D. Simultaneous vibration and soil moisture sensing using a single mode fiber for structural health monitoring applications. Appl. Opt. 2025, 64, C74–C78. [Google Scholar] [CrossRef]
  5. Shum, P.; Zhang, L.; Li, J. Specialty optical fibers for advanced sensing applications. Opto-Electron. Sci. 2023, 12, 220025. [Google Scholar]
  6. Wen, Z.; Guan, Z.; Dong, J.; Li, H.; Cai, Y.; Gao, S. A review of sensitivity enhancement in interferometer-based fiber sensors. Sensors 2022, 22, 2506. [Google Scholar] [CrossRef]
  7. Borjikhani, P.; Granpayeh, N.; Zibaii, M.I. High sensitivity tapered fiber refractive index biosensor using hollow gold nanoparticles. Sci. Rep. 2025, 15, 1458. [Google Scholar] [CrossRef]
  8. Feng, Y.; Li, H.; Li, S.; Liu, Y.; Meng, X. A high-sensitivity SPR refractive index sensor based on no-core fiber with Ag–Cu composite films. Sensors 2021, 21, 7000. [Google Scholar] [CrossRef]
  9. Jin, Y.; Gao, L.; Xue, Y.; Yang, J.; Liu, Y.; Zhu, Z.; Shi, J.; Grattan, K.T.V.; Guan, C. Refractive index and temperature dual-parameter sensors based on loss mode resonance and directional coupler in side-polished hole-assisted dual-core fiber. Opt. Express 2025, 33, 573–582. [Google Scholar] [CrossRef]
  10. Srivastava, A.; Esposito, F.; Campopiano, S.; Iadicicco, A. Mode transition phenomena into an in-fiber Mach–Zehnder interferometer. Opt. Fiber Technol. 2023, 80, 103481. [Google Scholar] [CrossRef]
  11. Wu, Q.; Qu, Y.; Liu, J.; Yuan, J.-H. Singlemode–multimode–singlemode fiber structures for sensing applications—A review. IEEE Sens. J. 2020, 21, 12734–12751. [Google Scholar] [CrossRef]
  12. Mohammed, W.S.; Smith, P.W.E. All-fiber multimode interference bandpass filter. Opt. Lett. 2006, 31, 2547–2549. [Google Scholar] [CrossRef] [PubMed]
  13. Liu, H.; Wang, Y. Compact bandpass filter based on multimode interference in a tapered fiber structure. Appl. Opt. 2008, 47, 3778–3781. [Google Scholar]
  14. Zhang, X.; Yang, B.; Jiang, J.; Liu, K.; Fan, X.; Liu, Z.; Peng, M.; Chen, G.; Liu, T. Side-polished SMS based RI sensor employing macro-bending perfluorinated POF. Opto-Electron. Adv. 2021, 4, 200041. [Google Scholar] [CrossRef]
  15. Liu, F.; Lin, H.F.; Liu, Y.; Zhou, A.; Dai, Y.T. Femtosecond-induced spiral micro-structured SMS fiber structure for refractive index measurement. Opt. Express 2018, 26, 17388–17396. [Google Scholar] [CrossRef]
  16. Wang, P.; Zhang, S.; Wang, R.; Farrell, G.; Zhang, M.; Geng, T.; Lewis, E.; Tian, K. Temperature-insensitive refractometer based on an RI-modulated singlemode-multimode-singlemode fiber structure. Opt. Express 2019, 27, 13754–13764. [Google Scholar] [CrossRef]
  17. Del Villar, I.; Goñi, J.; Vicente, A.; Arregui, F.J.; Matias, I.R. Etched and nanocoated single-mode multimode single-mode (SMS) fibers for detection of wind turbine gearbox oil degradation. J. Light. Technol. 2019, 37, 4665–4673. [Google Scholar] [CrossRef]
  18. Song, Q.; Nie, G.; Xie, Y.; Wu, X.; Yang, K.; Pu, S. Comparative study and comprehensive evaluation of refractive index sensor based on hetero-core fusion-spliced fiber structures. Infrared Phys. Technol. 2025, 149, 105922. [Google Scholar] [CrossRef]
  19. Huang, S.; Pu, S.; Ji, Y.; Zhang, C.; Liu, W.; Xu, T.; Han, S. Refractive index and magnetic field sensing based on bent microfiber functionalized with graphene oxide. Opt. Express 2025, 33, 5355–5368. [Google Scholar] [CrossRef]
  20. Wu, Z.; Liu, B.; Zhu, J.; Liu, J.; Wan, S.; Wu, T.; Sun, J. Asymmetrical tapered SMS fiber coupler for simultaneous measurement of temperature and refractive index and its application for biosensing. Chin. Opt. Lett. 2020, 18, 061201. [Google Scholar] [CrossRef]
  21. Tian, K.; Zhang, M.; Farrell, G.; Wang, R.; Lewis, E.; Wang, P. Highly sensitive strain sensor based on composite interference established within S-tapered multimode fiber structure. Opt. Express 2018, 26, 33982–33992. [Google Scholar] [CrossRef]
  22. Wang, K.; Mizuno, Y.; Lee, H.; Dong, X.; Kurz, W.; Fink, M.; Jakobi, M.; Koch, A.W. Experimental demonstration of offset-induced sensitivity enhancement in SMS-based temperature and strain sensing. Appl. Phys. Express 2023, 16, 052003. [Google Scholar] [CrossRef]
  23. Dey, K.; Pavan, V.D.R.; Roy, S.; Shankar, S.; Ramesh, B. Interrogation of SMS for measuring of temperature and strain using half-etched FBG with enhanced sensitivity. Proc. SPIE 2020, 11355, 113550Z. [Google Scholar]
  24. Zhang, S.; Deng, S.; Geng, T.; Sun, C.; Niu, H.; Li, X.; Wang, Z.; Li, X.; Ma, Y.; Yang, W.; et al. A miniature ultra long period fiber grating for simultaneous measurement of axial strain and temperature. Opt. Laser Technol. 2020, 126, 106121. [Google Scholar] [CrossRef]
  25. Liang, H.; Wang, X.; Tian, K.; Yang, W.; Lewis, E.; Wang, P. Multimode-interference-effect-based all-fiber displacement sensing system for an orthopedic Ilizarov apparatus device. Appl. Opt. 2019, 58, 3209–3213. [Google Scholar] [CrossRef]
  26. Liang, H.; Jiang, Y.; Wang, X.; Lewis, E.; Wang, P. All-fiber optic displacement sensing system for an Ilizarov transverse tibial bone transport device. Appl. Opt. 2020, 59, 2077–2084. [Google Scholar] [CrossRef]
  27. Mohammed, W.S.; Mehta, A.; Johnson, E.G. Wavelength tunable fiber lens based on multimode interference. J. Light. Technol. 2004, 22, 469–477. [Google Scholar] [CrossRef]
  28. Li, Y.; Liu, Z.; Jian, S. Multimode interference refractive index sensor based on coreless fiber. Photonic Sens. 2014, 4, 21–27. [Google Scholar] [CrossRef]
  29. Ren, Z.-H.; Wang, Q.; Cong, X.-W.; Zhao, W.-M.; Tang, J.-R.; Wang, L.; Yan, X.; Zhu, A.-S.; Qiu, F.-M.; Chen, B.-H.; et al. A fiber SPR sensor with high comprehensive evaluation indicator based on core mismatched U-shaped and tapered arm. Measurement 2023, 206, 112248. [Google Scholar] [CrossRef]
  30. Wu, Q.; Semenova, Y.; Wang, P.; Farrell, G. High sensitivity SMS fiber structure-based refractometer—Analysis and experiment. Opt. Express 2011, 19, 7937–7944. [Google Scholar] [CrossRef]
  31. Socorro, A.B.; Posada-Roman, J.E.; Diaz-Herrera, N.; Mendez, A. Mode transition-based multimode interference refractometric sensor using high-index coatings. Opt. Express 2013, 21, 12668–12682. [Google Scholar] [CrossRef] [PubMed]
  32. Wang, K.; Mizuno, Y.; Su, X.; Dong, X.; Kurz, W.; Fink, M.; Lee, H.; Jakobi, M.; Koch, A.W. Core diameter and numerical aperture dependences on the performance of fiber-optic multimode interference sensing. Appl. Phys. Express 2023, 16, 012003. [Google Scholar] [CrossRef]
Figure 1. Schematic diagram of the SMS sensor structure with different MMF cladding thicknesses.
Photonics 12 00863 g001
Figure 2. Microscopic image of the etched SMS fiber structure.
Photonics 12 00863 g002
Figure 3. Electric field distribution in the MMF segment of the SMS structure with cladding thicknesses of (a) 4 μm, (b) 3 μm, (c) 2 μm, (d) 1 μm, and (e) 0 μm.
Photonics 12 00863 g003
Figure 4. Experimental setup for evaluating the sensing performance of the SMS sensors.
Photonics 12 00863 g004
Figure 5. Transmission spectra of the SMS sensors with MMF cladding thickness of (a) 0, (b) 1, (c) 2, (d) 3, and (e) 4 μm.
Photonics 12 00863 g005
Figure 6. Fitting results of wavelength shifts versus RI for sensors with different MMF cladding thicknesses.
Photonics 12 00863 g006
Figure 7. Comparison of sensitivity and LOD for sensors with different MMF cladding thicknesses.
Photonics 12 00863 g007
Figure 8. Comparison of FWHM and Q-factor for sensors with different MMF cladding thicknesses.
Photonics 12 00863 g008
Figure 9. Comparison of FOM, RVD, and CEI for sensors with different MMF cladding thicknesses.
Photonics 12 00863 g009
Figure 10. Stability of sensors with different MMF cladding thicknesses over a 90 min period.
Photonics 12 00863 g010
Table 1. Performance parameters for the as-fabricated four sensors.
Performance IndexMMF Cladding Thickness
0 μm1 μm2 μm3 μm
Sensitivity (nm/RIU)106.0064.833128.00
LOD (×10−4 RIU)4.727.7116.1317.86
FWHM (nm)19.1418.358.0216.40
Q-factor73.9478.89169.0287.39
FOM (RIU−1)5.543.533.871.71
RVD (%)83.9375.6397.3055.38
CEI (RIU−1)4.502.633.740.93
Disclaimer/Publisher’s Note: The statements, opinions and data contained in all publications are solely those of the individual author(s) and contributor(s) and not of MDPI and/or the editor(s). MDPI and/or the editor(s) disclaim responsibility for any injury to people or property resulting from any ideas, methods, instructions or products referred to in the content.