Article

Advanced Research and Engineering Application of Tunnel Structural Health Monitoring Leveraging Spatiotemporally Continuous Fiber Optic Sensing Information

1
School of Computer Science and Engineering, North China Institute of Science and Technology, Beijing 101601, China
2
School of Earth Sciences and Engineering, Nanjing University, Nanjing 210023, China
3
State Key Laboratory for Tunnel Engineering, Sun Yat-sen University, Zhuhai 519082, China
4
School of Mine Safety, North China Institute of Science and Technology, Beijing 101601, China
5
School of Civil Engineering, Suzhou University of Science and Technology, Suzhou 215011, China
*
Authors to whom correspondence should be addressed.
Photonics 2025, 12(9), 855; https://doi.org/10.3390/photonics12090855 (registering DOI)
Submission received: 25 July 2025 / Revised: 16 August 2025 / Accepted: 23 August 2025 / Published: 26 August 2025
(This article belongs to the Special Issue Advances in Optical Sensors and Applications)

Abstract

As an important traffic and transportation roadway, tunnel engineering is widely used in important fields such as highways, railways, water conservancy, subways and mining. It is limited by complex geological conditions, harsh construction environments and poor robustness of the monitoring system. If the construction process and monitoring method are not properly designed, it will often directly induce disasters such as tunnel deformation, collapse, leakage and rockburst. This seriously threatens the safety of tunnel construction and operation and the protection of the regional ecological environment. Therefore, based on distributed fiber optic sensing technology, the full–cycle spatiotemporally continuous sensing information of the tunnel structure is obtained in real time. Accordingly, the health status of the tunnel is dynamically grasped, which is of great significance to ensure the intrinsic safety of the whole life cycle for the tunnel project. Firstly, this manuscript systematically sorts out the development and evolution process of the theory and technology of structural health monitoring in tunnel engineering. The scope of application, advantages and disadvantages of mainstream tunnel engineering monitoring equipment and main optical fiber technology are compared and analyzed from the two dimensions of equipment and technology. This provides a new path for clarifying the key points and difficulties of tunnel engineering monitoring. Secondly, the mechanism of action of four typical optical fiber sensing technologies and their application in tunnel engineering are introduced in detail. On this basis, a spatiotemporal continuous perception method for tunnel engineering based on DFOS is proposed. It provides new ideas for safety monitoring and early warning of tunnel engineering structures throughout the life cycle. Finally, a high–speed rail tunnel in northern China is used as the research object to carry out tunnel structure health monitoring. The dynamic changes in the average strain of the tunnel section measurement points during the pouring and curing period and the backfilling period are compared. The force deformation characteristics of different positions of tunnels in different periods have been mastered. Accordingly, scientific guidance is provided for the dynamic adjustment of tunnel engineering construction plans and disaster emergency prevention and control. At the same time, in view of the development and upgrading of new sensors, large models and support processes, an innovative tunnel engineering monitoring method integrating “acoustic, optical and electromagnetic” model is proposed, combining with various machine learning algorithms to train the long–term monitoring data of tunnel engineering. Based on this, a risk assessment model for potential hazards in tunnel engineering is developed. Thus, the potential and disaster effects of future disasters in tunnel engineering are predicted, and the level of disaster prevention, mitigation and relief of tunnel engineering is continuously improved.

1. Introduction

The global topography is complex and diverse. Among this, the proportion of marine is about 71%, the proportion of land is about 29% and the proportion of mountains is about 20% of that of land. Therefore, in the process of carrying out engineering construction in the land area, a lot of geological and geotechnical problems have been faced. Since the beginning of the 20th century, the United States, the United Kingdom, France, Germany, Japan and other developed countries have successively carried out research on the development and application of geological and geotechnical engineering safety monitoring technology. Compared with developed countries, China’s urbanization started relatively late, the implementation of reform and opening up and other related policies has promoted its urbanization process. As of 2024, China’s urbanization rate has reached 67.00% [1]. However, because the monitoring technology lags behind the development of geology and geotechnical engineering, it leads to the frequent occurrence of various engineering disasters and accidents in the process of infrastructure construction. The healthy development of cities and social stability are seriously threatened. According to the Global Competitiveness Report, in the past decade, China’s geological and geotechnical engineering disasters have caused 487,000 casualties, and the operation and maintenance costs have increased by 900%. And the average annual growth rate of urbanization and infrastructure investment is 10.7%, as shown in Figure 1. Therefore, preventing various engineering geological disasters and ensuring the safety of the whole life cycle of geotechnical engineering are important issues for global sustainable development.
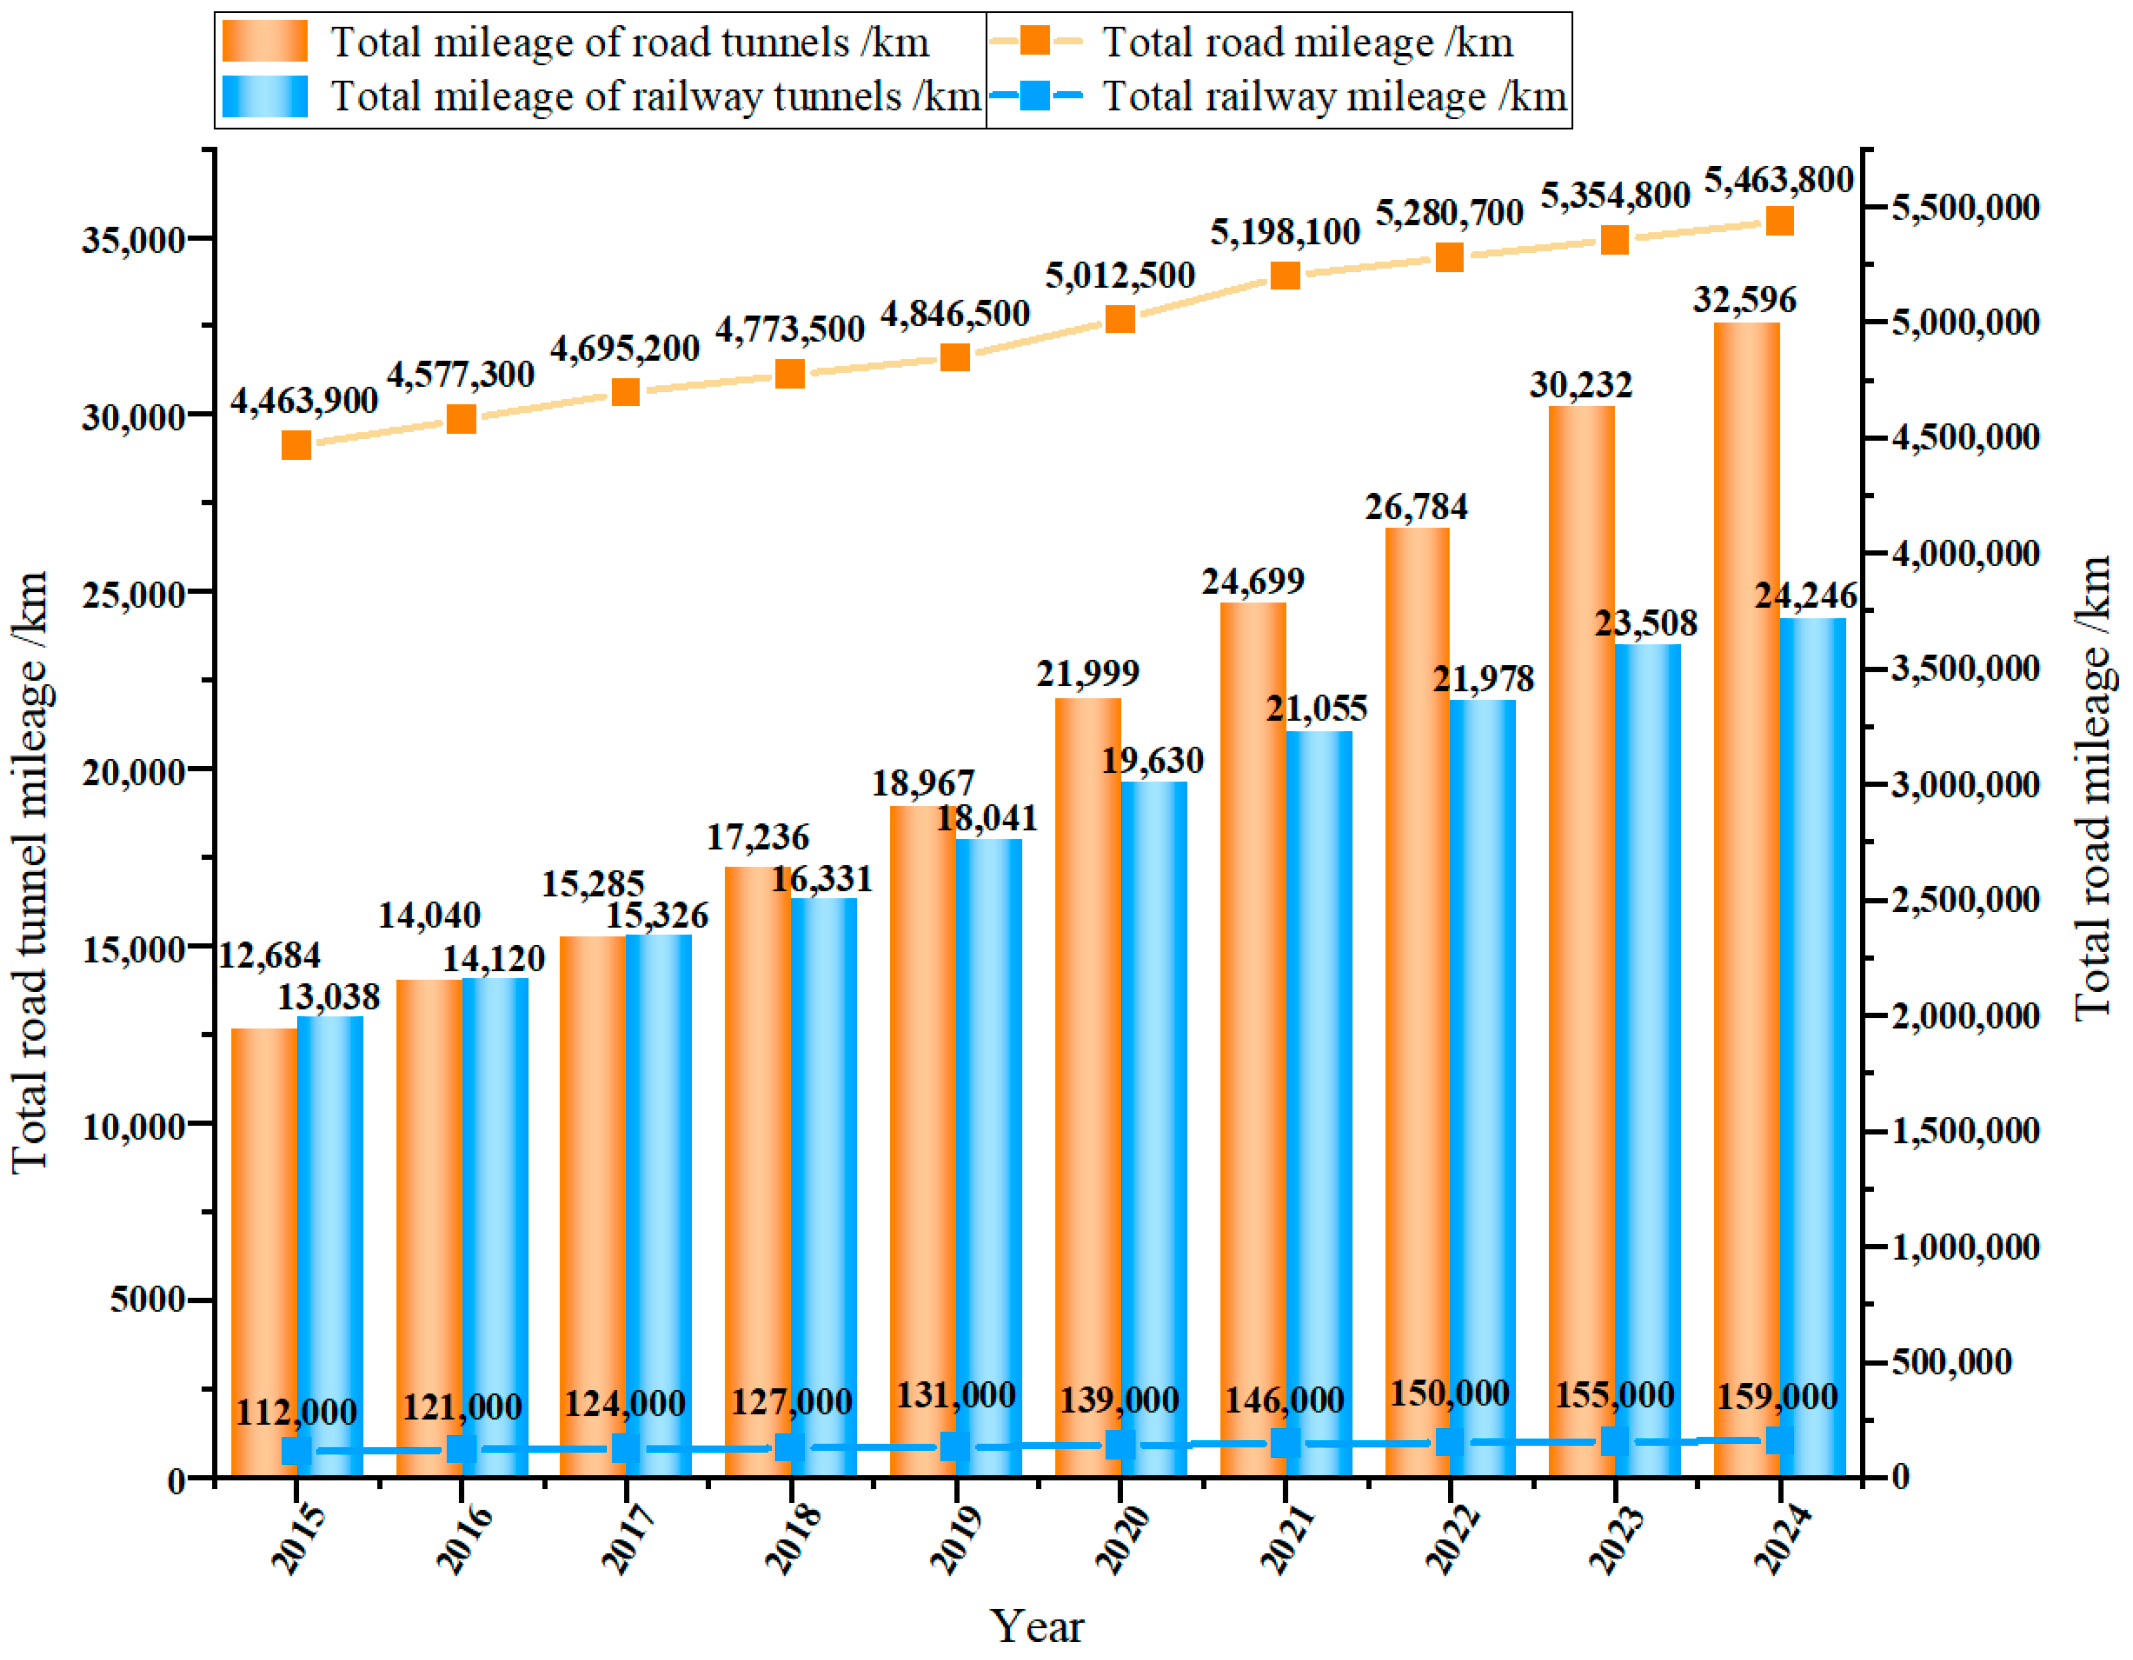
Tunnelling work is used as transportation structures to lay railways or build roads, and is built underground, underwater or in mountains. It is widely used in important fields such as transportation, water conservancy, municipal administration and mining, and is of great significance to improve the level of transportation infrastructure and the convenience of people’s lives. Modern tunnelling technology emerged at the end of the 19th century. The application of new tunnel construction methods represented by the shield method has promoted the rapid development of tunnel engineering. At the beginning of the 20th century, British engineer James Henry Grevos proposed steel tunnel lining and mechanized propulsion technology, which laid the foundation for modern shield machine technology. In 1994, the Anglo–French Channel Tunnel was completed, realizing the first land connection between the United Kingdom and the European continent, which greatly promoted the transportation and economic development between the United Kingdom and France. In 2000, the world’s longest urban road tunnel, the Lodal Tunnel, was completed, reducing travel time between Oslo and Bergen from 14 h to 7 h. In 2014, China’s Xinguanjiao Tunnel was put into use as the world’s longest mountain tunnel, and it shortened the time for Qinghai–Tibet railway trains to cross Guanjiao Mountain from 2 h to 20 min. In 2016, Switzerland completed the world’s longest and deepest urban rail tunnel, the Gotthard Tunnel, which was the fastest land transport link between North and South Europe [2]. After nearly 200 years of development, tunnels have become a core component of the modern transportation network. Particularly, China’s topography is complex, the mountainous terrain in the western region is widely distributed, the land resources in the central region are scarce and the waters in the southeast coastal area are widely distributed, so tunnel engineering is widely used in the construction and development of various regions in China. In the western region, many tunnel projects have been built in many key construction projects, such as the Qinghai–Tibet Railway, the Sichuan–Tibet Railway and the Xizhao Expressway. In the central and eastern regions, to make full use of the underground space, many subway tunnels, submarine tunnels and river (lake) bottom tunnel projects have been built. In particular, the completion of the Hong Kong–Zhuhai–Macao Bridge and its cross–sea tunnel, the Bohai Bay cross–sea tunnel and the second Jiaozhou Bay tunnel have opened the natural barrier for regional economic development. Figure 2 shows the total length of roads and railways and their tunnels in China in the past decade.
For a long time, the construction of global tunnel engineering has faced problems such as complex geological conditions, harsh construction environment and poor robustness of monitoring systems. In addition, the superposition of some natural environmental impact effects has caused a serious threat to the construction, operation and maintenance of tunnel engineering, especially in the construction of tunnels carried out on soft soil foundations or under water bodies in coastal areas. Once the excavation technology and monitoring methods are not properly designed, they will often directly induce disasters such as tunnel fires, collapses, seepage and rock bursts (Figure 3). Most of the above–mentioned disasters are the results of the deformation, movement and destruction of the surrounding rock of the tunnel under the action of excavation. In particular, it is closely related to the multi–field interaction of rocks, such as mineral composition, geological structure, stress field, temperature field, seepage field and vibration field [3,4,5]. It has caused huge casualties and economic losses, and seriously threatened the safety of tunnel construction and operation and the ecological and environmental protection of tunnel distribution areas.
At the same time, due to tunnel cracks and long–term differential subsidence, which are caused by excavation, its impact on the surrounding buildings and ecological environment is characterized by slow deterioration, accumulation and complexity of genesis. At present, the relevant theoretical and experimental research is relatively lagging. National norms also have fewer provisions on control standards. It is difficult for existing monitoring methods to accurately and in real–time obtain the influence of overlying rock and soil deformation on the local deformation and surface subsidence of surrounding rock during tunnel excavation, especially when constructing tunnels on soft ground. Therefore, distributed fiber optic sensing (DFOS) allows for carrying out tunnel structure health monitoring on the internal and external environment of the tunnel, obtaining the spatiotemporally continuous information of the whole cycle of the tunnel structure and dynamically grasping the health status of the tunnel. To carry out accurate operation and maintenance of the tunnel, this is significant to the whole life cycle of tunnel engineering in order to be intrinsically safe from construction to operation and maintenance, and to improve the disaster prevention, mitigation and relief capabilities of tunnel engineering.
Thus, this manuscript systematically reviews the development of the theory and technology in tunnel engineering’s structural health monitoring. The application scope, advantages and disadvantages of the main means of tunnel engineering structural health monitoring are compared and analyzed. The application points of DFOS in tunnel engineering monitoring, such as deformation, temperature, seepage and vibration in tunnel engineering, are introduced in detail. Finally, taking a high–speed railway tunnel in Northern China as an example, the deformation monitoring of tunnel structures was carried out using optical fiber sensing technology. The safety evaluation method of the structural health status of high–speed rail tunnel engineering has been systematically mastered, and technical support has been provided to ensure the safe operation of the whole life cycle of tunnel engineering.

2. Theoretical and Technical Research on Structural Health Monitoring of Tunnel Engineering

Structural health monitoring (SHM) of tunnel engineering refers to the real–time or periodic collection of displacement, settlement, frequency, seepage flow and other related data of tunnel structures by installing sensors on tunnel structures. Combined with data analysis algorithms, the integrity, performance and safety status of the tunnel were evaluated. Ensure the normal operation of the tunnel and the prolongation of its service life. For this reason, it is frequently employed in the assessment of safety in tunnel engineering. Scholars at home and abroad have conducted systematic research on tunnel engineering through theoretical studies for a long time, numerical calculation, laboratory tests, computational simulation and on–site monitoring [6,7,8,9,10], plenty of models and theories have been proposed, as shown in Figure 4. In the 1920s, Terzaghi et al. put forward the “relaxation load theory”, which believed that during the tunnel excavation process, the surrounding rock will relax, but not necessarily collapse, and the supporting structure needs to bear the load generated during the relaxation process. In the 1950s, Miller–Fecher et al. put forward the “surrounding rock bearing theory”, which believed that the excavated rock and soil mass has a certain self–stability ability, and it takes a time process to achieve instability and failure. If reasonable support can be applied to the surrounding rock at the right time, the rock and soil mass can remain stable. In the 1970s, Rabcewicz et al. put forward the “wedge shear fracture theory”, which explained the reason for the formation of wedge–shaped fracture bodies due to shear action in the surrounding rock after tunnel excavation. In 1985, Chua et al. proposed the “shear–slip model”, which described the stress redistribution phenomenon of the interface under the action of shear slip. In 1994, Chambon et al. [11] studied the influence mechanism of sand density and tunnel location on the deformation of surrounding rock based on centrifugal experiments, and gave the ultimate internal support pressure under different conditions for the ultimate bearing capacity of tunnel surrounding rock collapse. In 1995, Zhu et al. [12] conducted an in–depth study on the construction and excavation processes of geotechnical engineering, and put forward the theory of dynamic construction mechanics of rock mass. In 2002, Zhu et al. [13] proposed a set of information–based monitoring and construction methods for large–section highway tunnels under complex geological conditions, which were successfully applied in practice. In 2006, Lee et al. [14] combined centrifugal model tests and numerical simulations to study the surface settlement groove, excess pore water pressure generation, tunnel stability and arching effect during tunnel excavation in soft soil areas. They also determined the collapse arch boundaries of single–hole tunnels and parallel double–hole tunnels, which provided a theoretical basis for the prevention and control of tunnel surrounding rock collapse disasters. In 2010, Wang et al. [15] used the ESO (Evolutionary Structural Optimization) algorithm to optimize the shape of the tunnel section design, and proposed the concepts of error area and weighted error area, which were used as quantitative indicators for ESO optimization of tunnel section shape optimization. In 2018, Li et al. [16] proposed a reliability analysis method for subgrade grading of surrounding rock by analyzing the probability distribution law of evaluation indicators such as rock strength and rock mass integrity, which realized the accurate evaluation of surrounding rock grade. In 2023, Xu et al. [17] summarized the large deformation law and stress characteristics of the surrounding rock of the tunnel through on–site monitoring, model tests and finite element analysis simulations, and realized the reliable support of the tunnel project under the large deformation of the surrounding rock. In 2024, in view of the safety construction and maintenance of traffic tunnels under multiple disaster–causing factors, Wang et al. [18] proposed a composite tunnel lining support system of “surrounding rock–primary lining–polymer–secondary lining” to furnish a crucial reference for the construction of traffic tunnels under the conditions of high intensity, water–rich environment and high and low–temperature zones.
In order to further clarify the basic performance, method overview and advantages and disadvantages of various types of tunnel engineering structural health monitoring technologies, a comparative analysis of the technical equipment for structural health monitoring of tunnel engineering is systematically carried out in this manuscript, as shown in Table 1 [19,20,21,22].
The above–mentioned technical equipment provides an important reference for ensuring the safety, operation and maintenance of tunnel engineering construction. In actual monitoring, most of them rely on conventional sensors such as resistive, magnetostrictive, piezoelectric and vibrating wire to obtain key parameters, such as strain, stress, displacement, temperature, resistivity and vibration of the target to be measured. However, most of the tunnel projects have the characteristics of strong concealment, complex construction environment and poor monitoring conditions. Therefore, the abovementioned sensors generally have problems such as insufficient measurement accuracy and poor durability, complex installation and burial, low survival rate, susceptibility to electromagnetic interference and high error rate in tunnel and structural health monitoring. This severely limits the reliability of the monitoring data and the robustness of the sensor. At the same time, the data obtained by the sensor are relatively discrete, and there is a blind spot for monitoring, which cannot fully capture the continuous accumulation of deformation information of shallow rock and soil mass and the overlying rock layer of the tunnel. In addition, it is difficult to accurately identify precursors to an impending disaster and to disseminate early warning signals in a timely manner, thereby allowing for sufficient response time to emergency response measures. Therefore, there is an urgent need to improve monitoring methods and technologies to achieve spatiotemporally continuous perception and precise control of the structural health status of the whole cycle of tunnel engineering [23,24].

3. Application of DFOS in the Safety Monitoring of Tunnel Engineering

Structural health monitoring of tunnel engineering can effectively and timely obtain the status information of the tunnel. It can then identify the identification of abnormal areas and their hidden risks and propose corresponding diagnosis and treatment plans accordingly. Most of the current tunnel structure health monitoring technologies are point or non–contact sensing technologies. This type of technology is susceptible to the interference of the field environment, and the data obtained are relatively discrete. And it is difficult to achieve large–scale, fully distributed and real–time monitoring. Therefore, it is essential to carry out spatiotemporally continuous perception research on tunnel engineering to obtain the state information of the whole section of the tunnel in real time. Accordingly, the identification of hidden dangers and early warning of tunnel engineering risks and disasters are carried out. The development trend of tunnel engineering deformation can be predicted through the massive monitoring data accumulated in a certain period of time, which provides an important reference for tunnel engineering risk prevention and control as well as emergency response.
In the regional business environment, as a specific form of the national business environment in a geographical context, DFOS is a technology that uses optical fiber as the signal transmission medium and light as the sensing signal. By demodulating the frequency, intensity or phase changes of the scattered light, it can achieve millimeter–level spatial resolution to sense the surrounding environment temperature, strain, seepage and other parameters and their change processes [25,26,27,28,29]. At present, it has been widely used in transportation, water conservancy, municipal administration and mining and other engineering fields, effectively improving the accuracy and timeliness of disaster risk early warning and forecasting, and the main principles and classification of these technologies are shown in Figure 5.
In tunnel engineering, DFOS is the main method to realize the structural health monitoring of tunnel engineering at this stage. Actually, it is often necessary to deploy optical fiber sensors and sensing cables in the tunnel according to specific geological conditions, monitoring conditions and monitoring objectives. It is akin to implanting a perceptible “nerve” in the tunnel, constantly capturing every “action” of the tunnel project, thereby achieving precise early warning of abnormal information regarding the tunnel project [30]. Figure 6 shows spatiotemporally continuous perception of tunnel engineering based on DFOS technologies.
Because this technology can achieve large–scale, continuous, and full real–time monitoring, the monitoring data information has increased massively. Thus, it has become an important means for the construction of various infrastructure projects, and has realized the perfect evolution of monitoring data from sparse to dense to big data. Figure 7 shows the layout methods and data characteristics of various optical fiber sensing technologies.

3.1. Deformation Monitoring of Tunnel Engineering Based on FBG

Tunnel engineering deformation refers to the irreversible deformation of tunnel structure throughout the entire life cycle of tunnel construction and operation, which is due to internal and external factors such as concrete shrinkage creep, insufficient lining thickness, surrounding rock rheology and external load coupling. The deformation is mainly divided into two categories: stress–strain and settlement displacement. The tunnel deformation monitoring technology based on Fiber Bragg Grating (FBG) mainly encapsulates FBG fiber grating in various sensors. Alternatively, fiber grating points can be burned at certain intervals in the optical fiber, and the sensing cable can be prepared by selecting the corresponding encapsulating process based on the monitoring target and environment [31]. The main principle of this technique is that when the FBG is subjected to uniform axial strain, the FBG pitch changes with the axial stress. At the same time, the effective refractive index also changes with the axial stress. The FBG center wavelength drift λ B can be expressed as
λ B = 2 n e f f Λ + 2 n e f f Λ
where Δ Λ is the change in the fiber grid area. Δ n e f f is the effective refractive index change of the fiber.
In practice, FBG optical fiber sensors or sensing optical cables are laid along the tunnel direction in a ring, straight or U–shaped shape at key positions such as cross section, two sides or roof. And it is anchored in key stress parts such as arch rings, linings, side walls, bottom plates and excavation–free surfaces to form a strain perception network with high spatial resolution. When the tunnel structure is deformed, the grating is modulated by axial or bending strain. The Bragg wavelength drifts, and the deformation status of the tunnel is determined in real time by calculating the wavelength drift [32,33,34]. In this way, the full–cycle safety monitoring of the deformation state of the tunnel engineering construction and operation process can be realized.
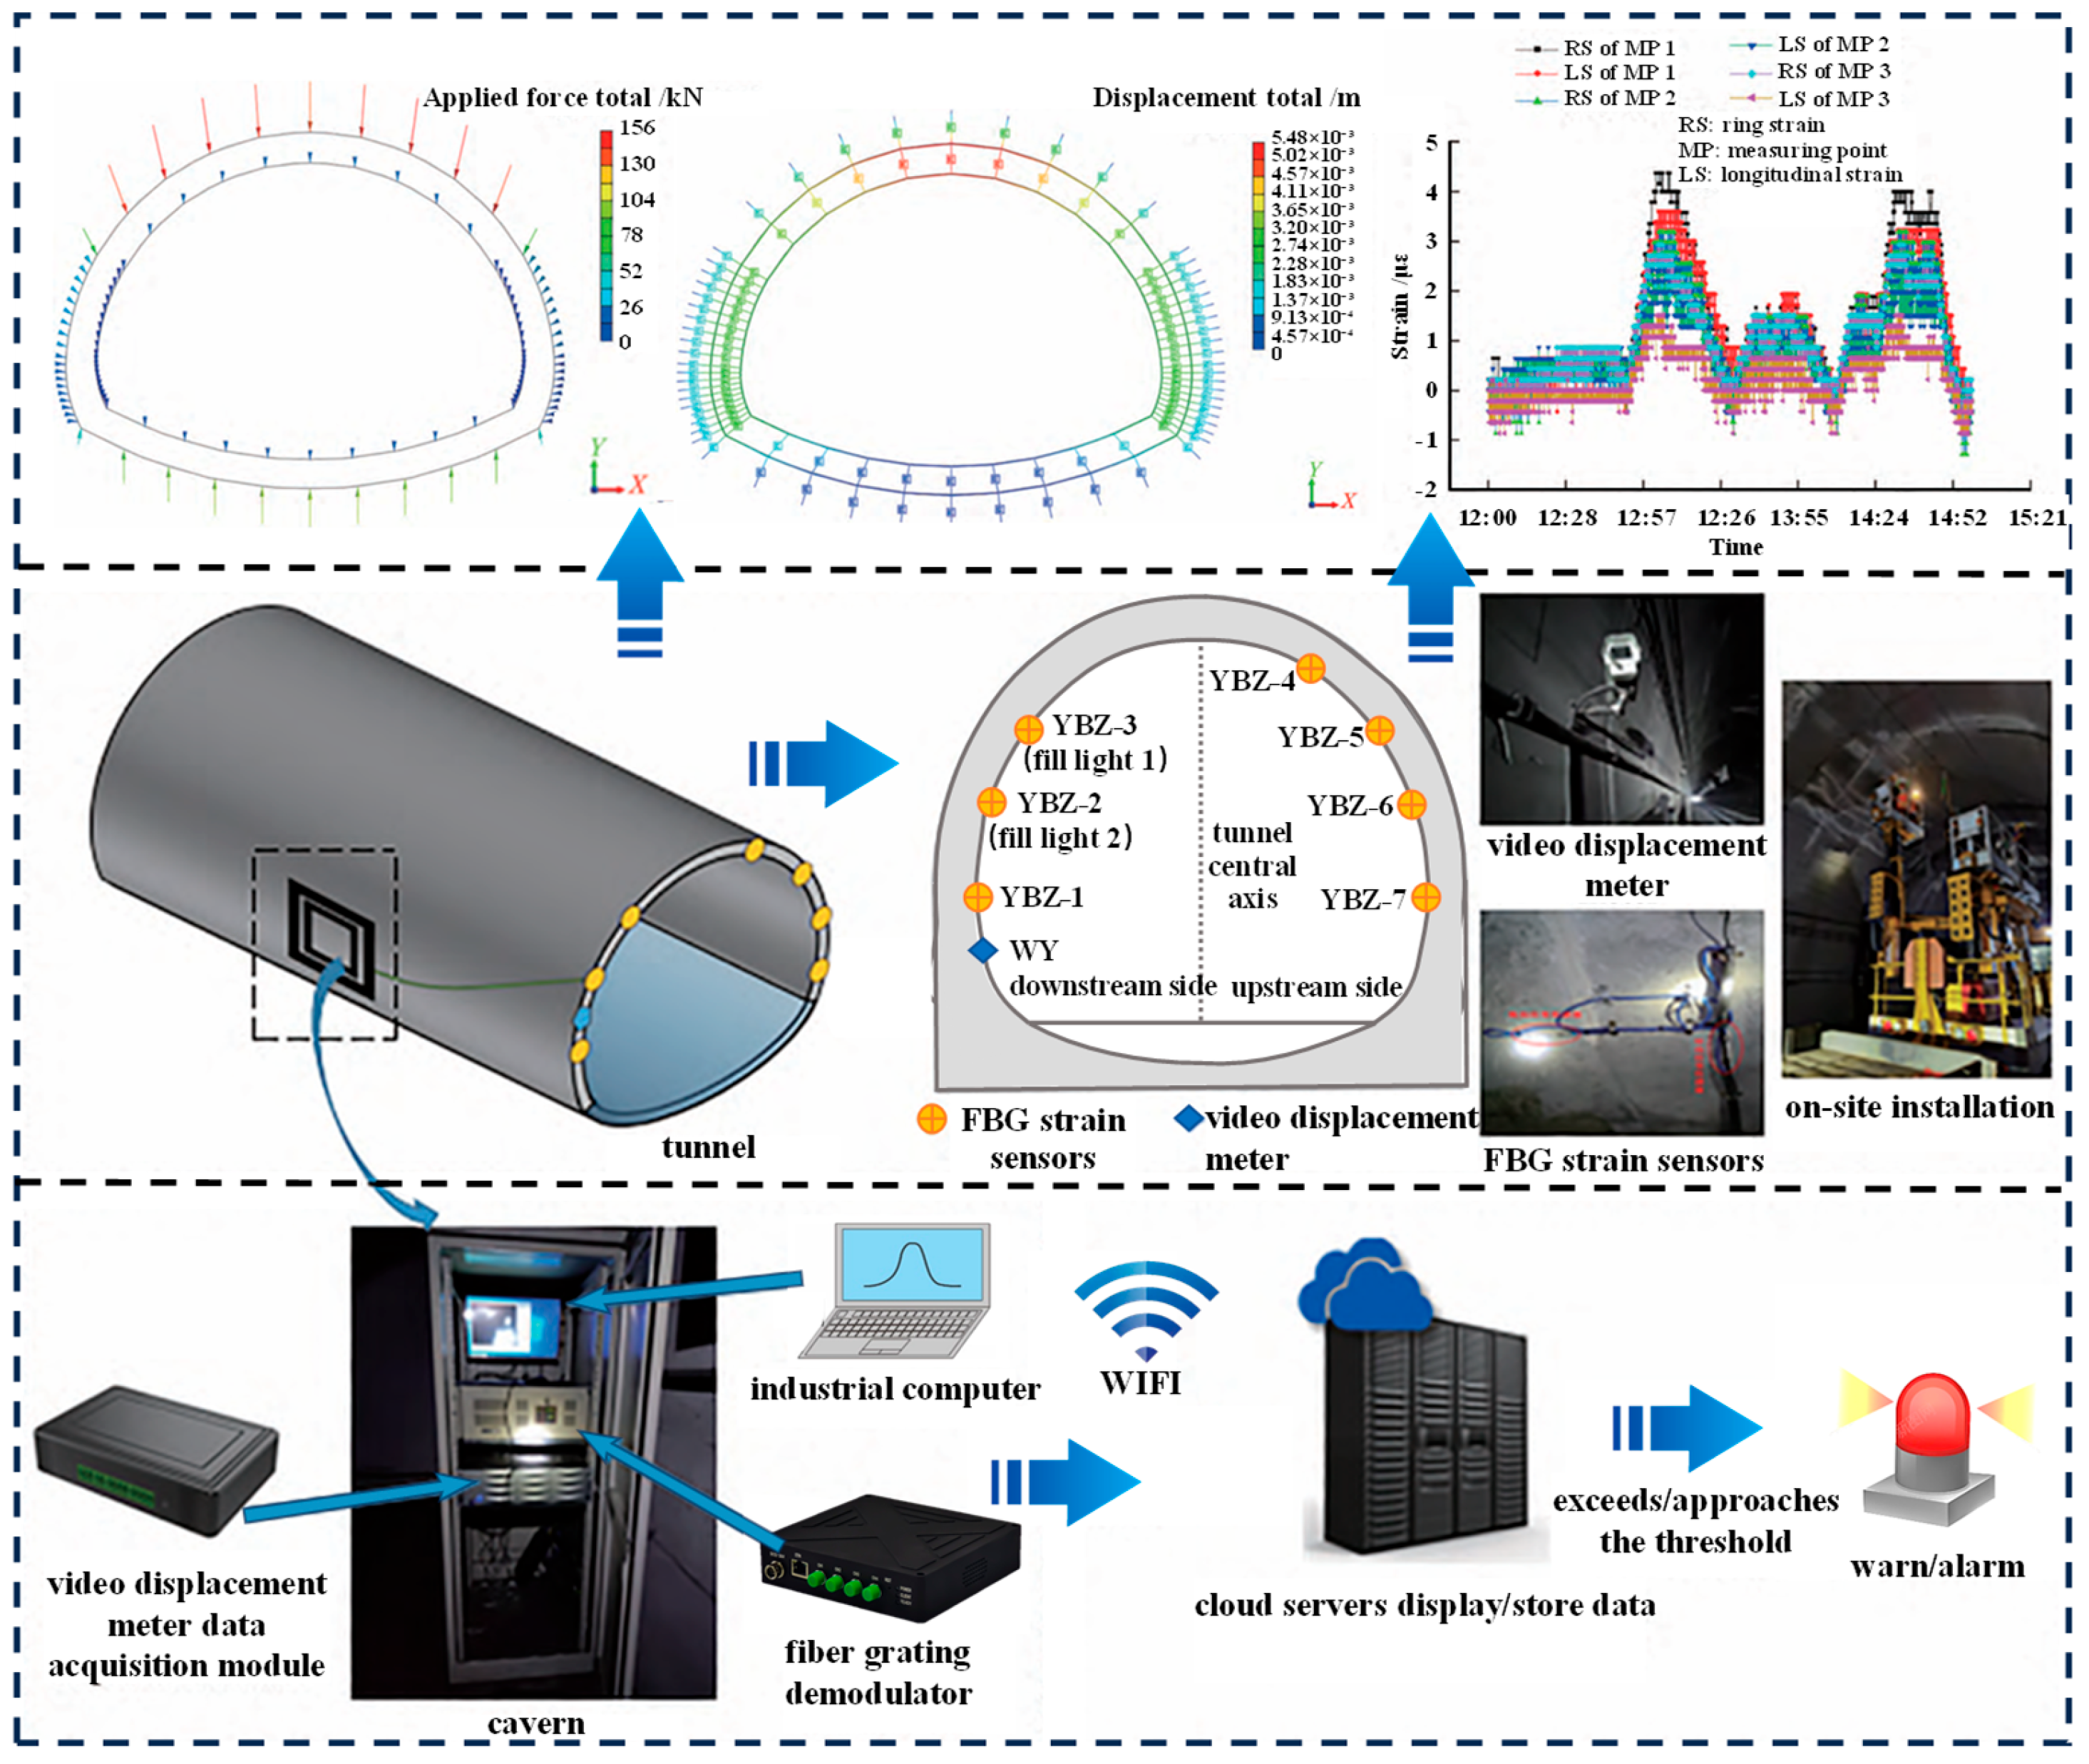
Li et al. [35] carried out structural health and safety monitoring of railway tunnels during operation based on stress–strain and other parameters (Figure 8), through FBG strain sensors and optical video displacement meters. By comparing and analyzing the measured data of tunnel deformation under static conditions and transient conditions of train traffic, and combined with finite element simulation, it is concluded that the strain increment of a single train passage on the inner wall of the tunnel does not exceed 5 μ ε . Further analysis shows that the strain amplitude of No. 1, 2 and 3 measurement points is negatively correlated with the height from the ground when the train passes, that is, the closer the measurement point is to the ground, the greater the strain it will receive. At a same measurement point, the hoop strain is usually greater than the longitudinal strain. The results show that the shear stress caused by train passage is mainly the hoop shear stress, supplemented by the longitudinal shear stress.

3.2. Temperature Monitoring of Tunnel Engineering Based on BOFDA

The temperature change in the tunnel has an important impact on the supporting structure and the concrete structure. When the temperature change gradient exceeds the limit or shows periodic abnormal changes, it will accelerate the rust and corrosion of the supporting structure. It will also induce problems such as cracking and lining deformation of concrete structures. Therefore, as one of the key evaluation indicators, temperature is widely used in the health monitoring of tunnel engineering structures. Brillouin Optical Frequency–Domain Analysis (BOFDA) technology has become the preferred monitoring technology for long–term monitoring of the temperature field in the whole tunnel area, because of its high–precision monitoring of temperature–strain parameters. Based on the stimulated Brillouin Scattering (SBS) effect, this technique can quickly locate the local abnormal temperature rise and stress concentration areas, which are caused by leakage water, joint opening and closing, or lining cracking through continuous decoupling analysis of temperature–strain data. In tunnel engineering, the sensing optical fiber is laid inside the lining or at the interface of the segment joint in the form of embedded or surface adhesive. The temperature distribution and structural strain evolution data along the lining line can be obtained in real time, which provides a key basis for the safety assessment and operation and maintenance decisions of the tunnel structure. In BOFDA–based tunnel temperature monitoring, the relationship between strain and temperature can be expressed as [36]
f B ( ε , T ) = f B ( 0 ) + f B ( ε ) ε ε + f B ( T ) T T
In the formula, f B ( ε , T ) is the center frequency of Brillouin. f B 0 is the initial center frequency of Brillouin. Δ ε and Δ T are the changes in strain and temperature. f B ( ε ) ε is the strain coefficient. f B ( T ) T is the temperature coefficient.
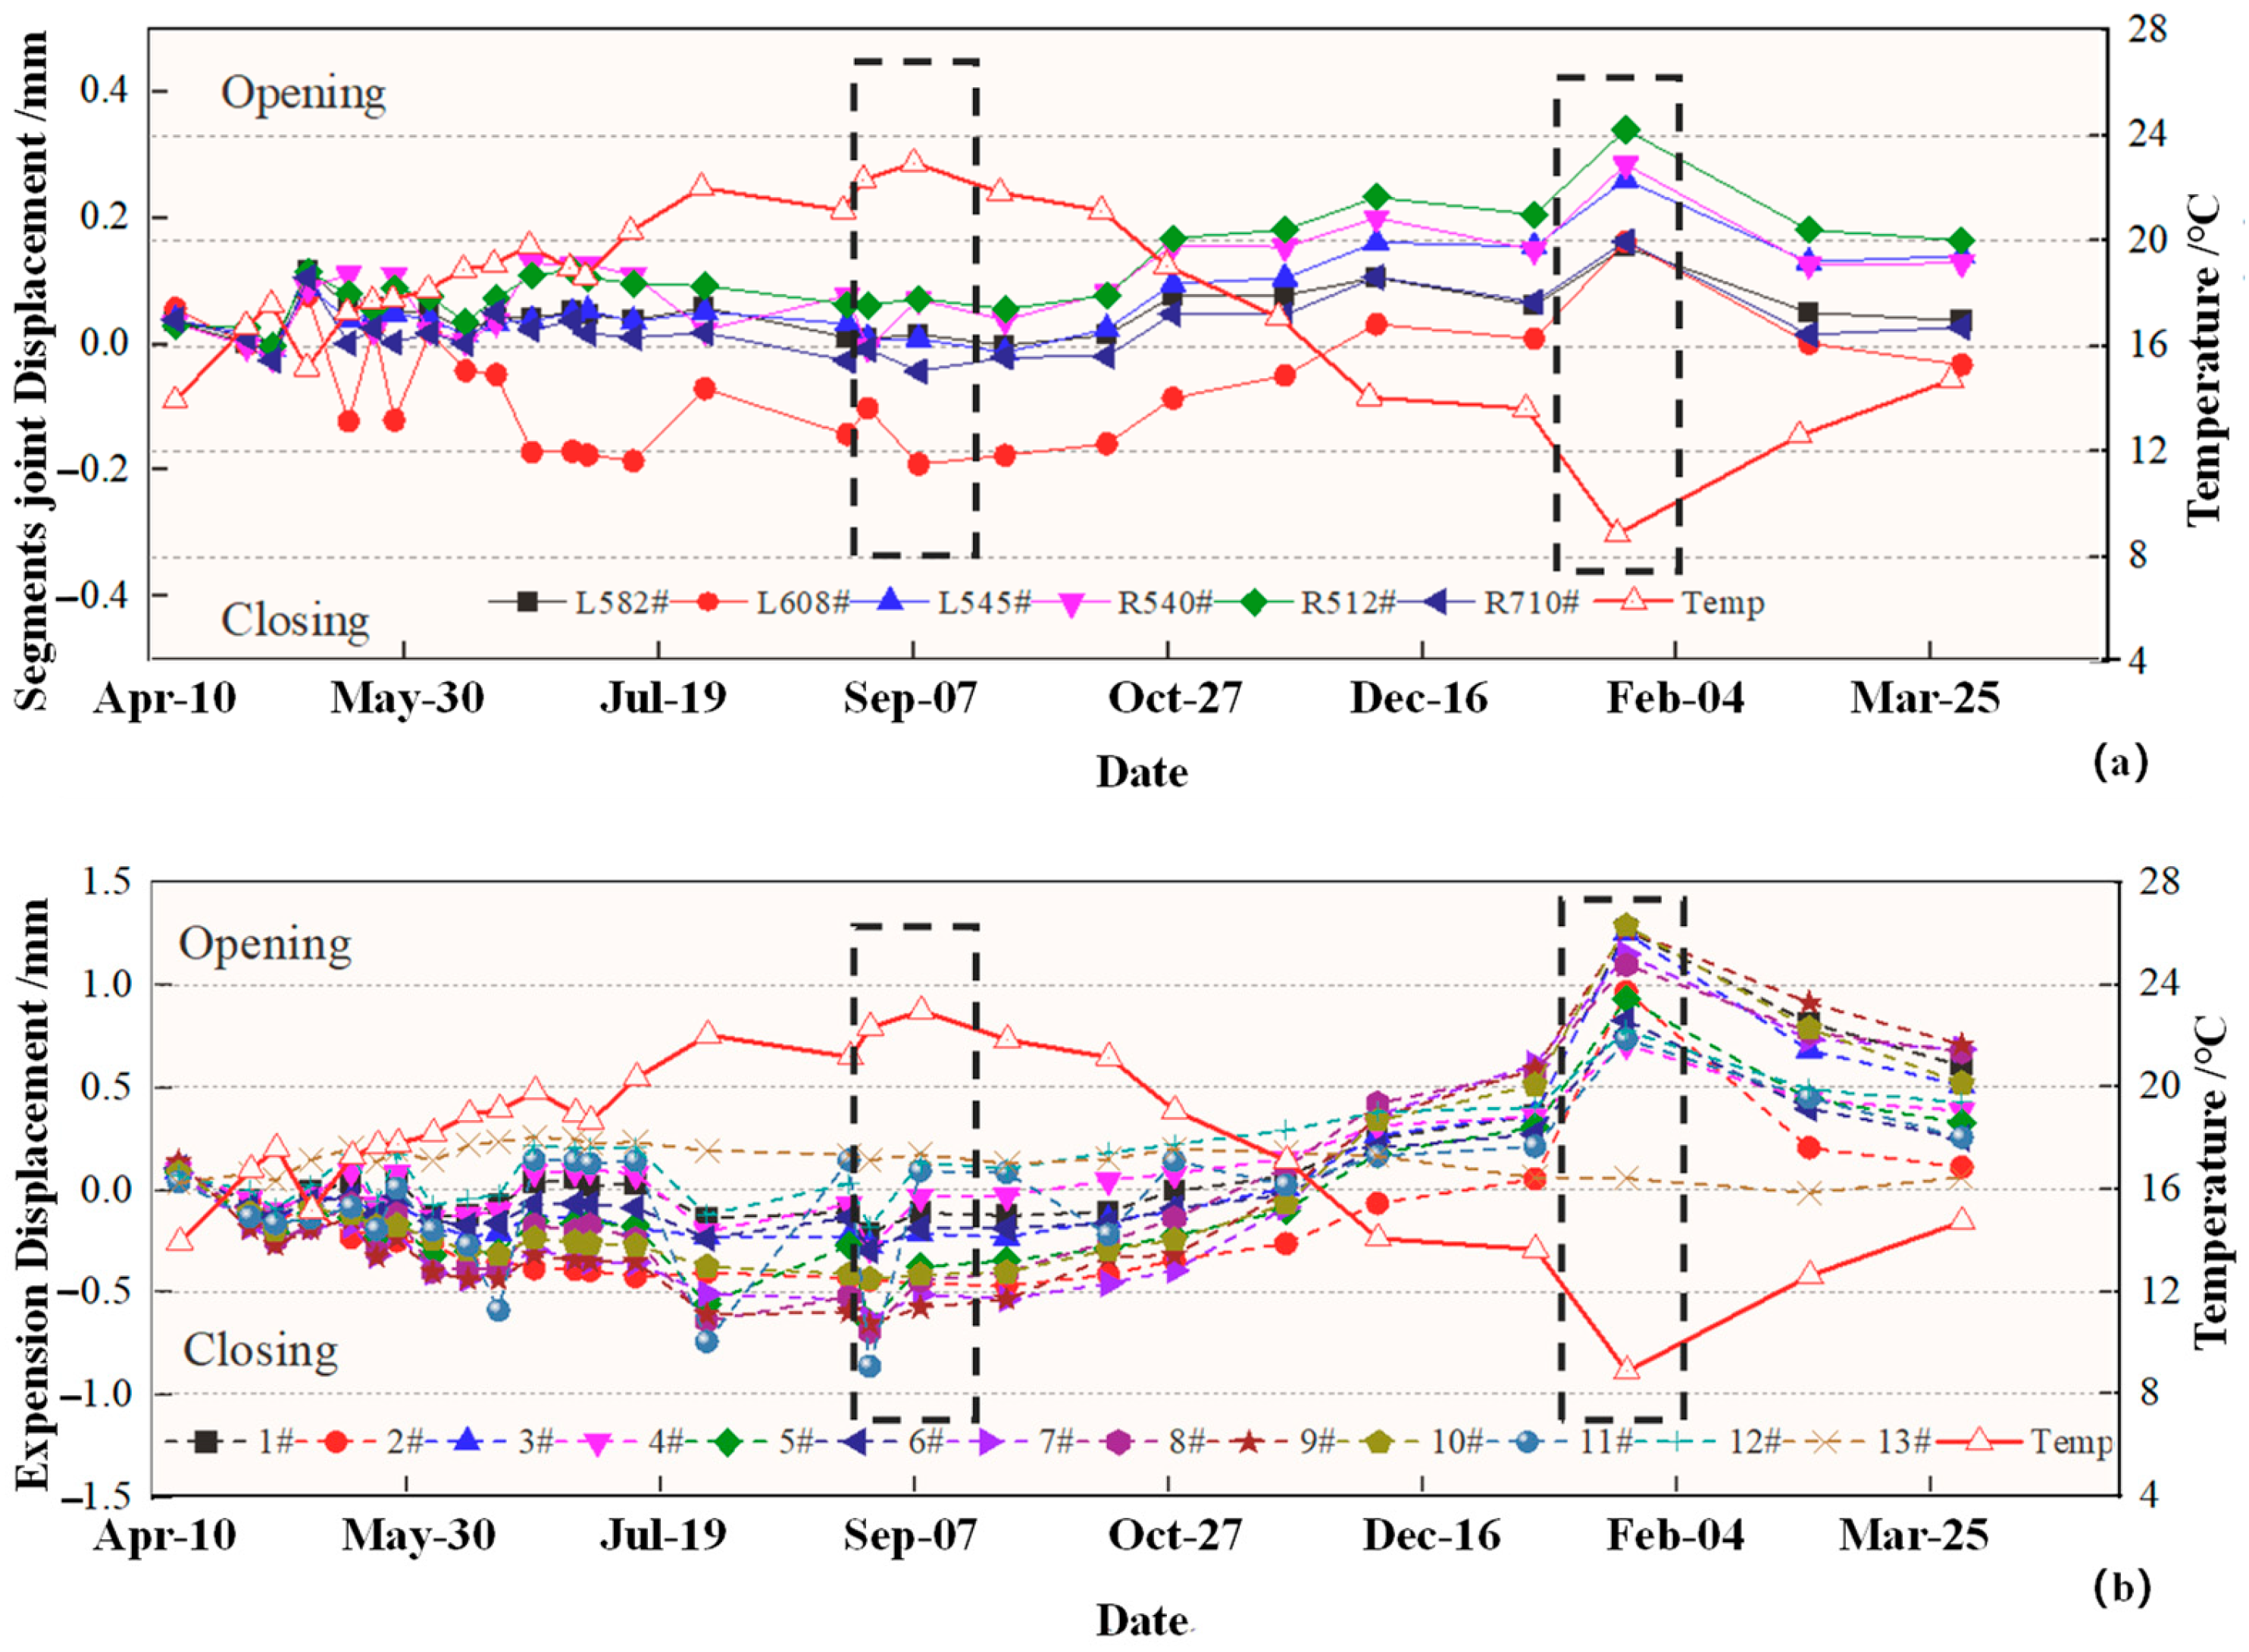
Wang et al. [37] took the tunnel of Metro Line 1 in Suzhou, China as an example, and applied the monitoring technology based on Brillouin optical frequency domain analysis to the joint monitoring of the tunnel lining section. Through this technology, the micro–deformation at the joints of the segments of the operating tunnel is obtained. On this basis, combined with the actual on–site observation results, the seepage location in the monitoring tunnel section was located. Further research shows that the slight deformation of segmental joints and the expansion of the track bed are closely related to the temperature change. The telescopic and expansive displacements of all nodes in the entire monitoring area continued to increase, and showed consistent timing. Since April 2015, with the increase in ambient temperature, the joints have gradually closed, and the orbit is in a state of expansion. In September 2015, the joint reached the maximum closure and the displacement value was the smallest. At this time, the telescopic displacement was −0.19 mm, the expansion displacement was −1.00 mm, corresponding to the maximum temperature during the monitoring period. The joints then gradually opened, the orbit contracted, and reached its maximum opening in February 2016. At this point, the displacement peaks, with a telescopic displacement of 0.34 mm and an expansion displacement of 1.40 mm, corresponding to the lowest temperature during the monitoring period (Figure 9). After that, as the temperature gradually rises, the joints again turn into a closed development trend. The fiber optic data during the monitoring period showed that the track spacing was set reasonably and the track bed structure was in good health.

3.3. Seepage Monitoring of Tunnel Engineering Based on DTS

Distributed Temperature Sensing (DTS) is a temperature measurement method based on optical fiber sensing technology. It emits laser pulses to the special temperature sensing optical cable and bases optical time–domain reflection localization technology. In this way, the location of abnormal temperature areas can be realized. On this basis, combined with the relationship between temperature and seepage, the seepage field of rock and soil can be accurately depicted. Tunnel seepage refers to the phenomenon of groundwater or external water source penetrating the tunnel through rock cracks or soil layers. Seepage will cause the water pressure inside the tunnel to increase and weaken the effective stress of the tunnel structure. In turn, lining cracking, softening of surrounding rock and tunnel water accumulation are induced. The stability and safety of the tunnel structure are seriously threatened by this. So, based on DTS, the tunnel seepage field is monitored to accurately locate the hidden danger points and seepage rate of the tunnel. This can effectively reduce the incidence and disaster effects of large–scale leakage and water inrush in tunnels [38,39]. The main principles of this method are when seepage occurs at a certain location of the tunnel, the seepage water will exchange heat with the rock around the tunnel. This will lead to an unsteady and non–uniform change in the local temperature of the tunnel. The heat exchange formula is
2 T c 0 ρ 0 λ · V ¯ T = c ρ λ T t
In the formula, is the Hamiltonian operator. T is the groundwater temperature. c 0 and c are the specific heat of the fluid and the surrounding rock, respectively. ρ 0 and ρ are the densities of the fluid and surrounding rock, respectively. λ is the thermal conductivity of the surrounding rock. V ¯ is the velocity vector of groundwater. t is the heat exchange time.
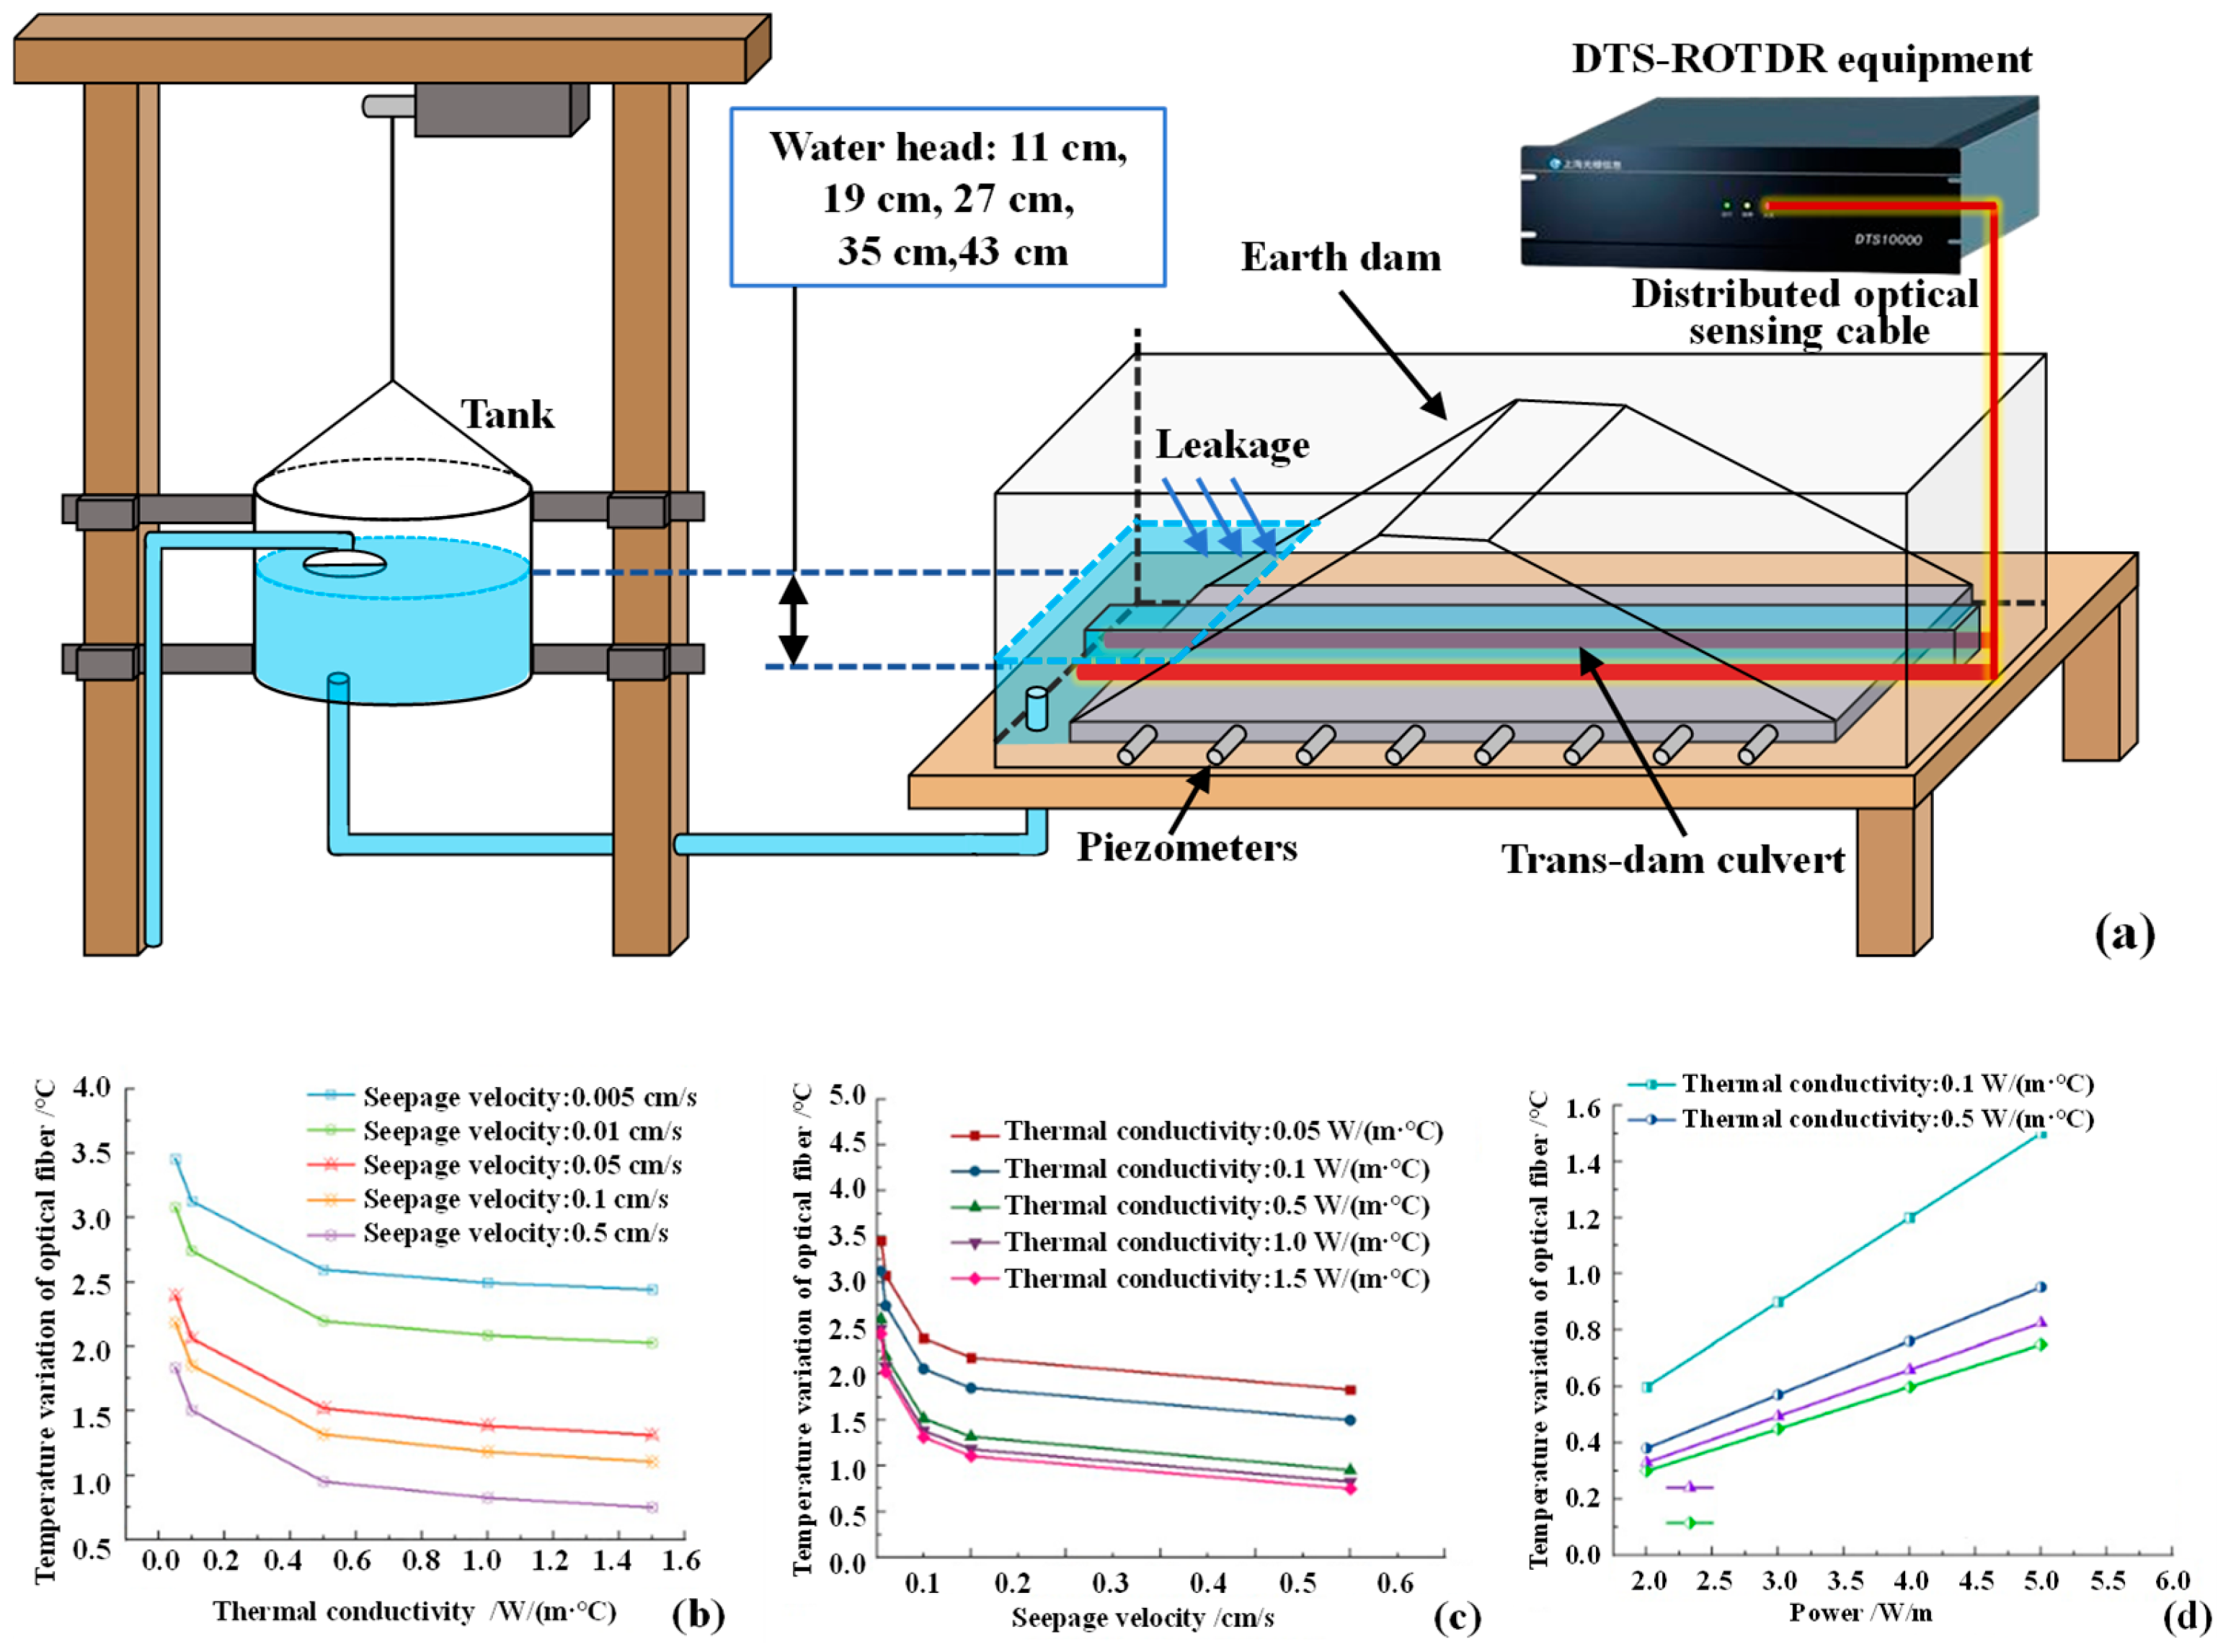
In practice, temperature sensing optical cables are laid in the direction and circumference of the tunnel. The temperature field distribution along the tunnel and in the whole section can be accurately obtained by the sensing optical cable. That is, when the temperature changes abnormally in a certain place in the tunnel, it can be preliminarily determined that there is a hidden risk of seepage at that location. At this time, the continuous temperature monitoring data of the hidden danger area were further calculated and combined with the tunnel geological survey data to determine the seepage rate and seepage scale. However, during the initial stage of contact seepage between an earth–rock dam and its culvert, the velocity of the seepage is often extremely low and constant. There is no significant relationship between temperature differences and seepage or optical fiber, which makes it difficult for the DTS method to identify the precursor information of seepage at this stage. Meanwhile, the current seepage monitoring research based on DTS mainly focuses on the calculation of heat transfer between seepage and optical cables. The impact on thermal variations on the seepage monitoring outcomes of the fiber optic cable itself has not been taken into account. To solve this problem, Liu et al. [40] used heated distributed optical cables to monitor the seepage field of the dam culvert. By increasing the temperature difference between seepage and optical cable, it improves the accuracy of DTS for identifying weak seepage. On this basis, the indoor model test has been carried out to study the temperature change law of distributed optical cable at different stages of contact seepage and establish a numerical calculation model of thermal fluid coupling. Based on this, the temperature change process of the optical cable under different seepage velocities, heating power and optical fiber thermal parameters was analyzed (Figure 10). Combined with the model test and numerical calculation results, a DTS–based contact seepage monitoring scheme between earth dam and culvert was proposed. The specific implementation process of the scheme is as follows: Firstly, according to the geological conditions of the dam culvert and the seepage characteristics are analyzed. The heating fiber optic cable is arranged to extend to both sides with the culvert as the center, and distributed in waves along the slope. Secondly, the horizontal space between the optical cable is set to 15 m, lengthwise going from the bottom of the slope to the top. Finally, the above sensing optical cable is constructed as a temperature sensing network to realize real–time distributed monitoring of the seepage field of the culvert through the dam. The layout scheme can significantly increase the monitoring distance and resolution of seepage field in the dam culvert, and provides a new technical approach for the identification and evolution assessment of seepage precursors at low flow velocity.

3.4. Vibration Monitoring of Tunnel Engineering Based on DAS

Distributed acoustic sensing (DAS) technology is a fully distributed optical fiber sensing technology that uses the interference effect of optical fiber backward Rayleigh scattering. It mainly uses the phase information of Rayleigh–scattered light to demodulate the linear relationship between the differential phase and the sound wave, so as to realize the continuous distributed measurement of the acoustic wave signal. This technology was first used in the field of geophysical research, such as VSP observation in oil and gas exploration, microseismical monitoring and hydraulic fracturing monitoring. Since 2019, many scholars have successively carried out the research work of “dark fiber” on the seabed based on DAS technology. Its research covers the monitoring of earthquakes, fault activity, hydroacoustic signals and ocean–solids–earth interactions. At present, this technology has become an important technical paradigm for high–resolution distributed sensing of various acoustic vibrations. The measurement principle is as follows:
Δ φ = β L Δ L L
In the formula, Δ φ denotes the phase difference. β represents the propagation constant of the optical fiber. L denotes the total length of the fiber. Δ L represents a small change in the length of the fiber.
The formula for locating a seismic event is
Z = V T / 2
where Z is the distance at which the sound wave disturbance or event occurs. V is the speed at which sound waves or light pulses propagate in an optical fiber. T is the time it takes for an optical pulse to be transmitted and reflected and received by the detector.
In recent years, DAS technology has relied on its ability to continuously detect acoustic signals at any position along the optical fiber. It is widely used in pipeline leaks, oil exploration, perimeter security and other fields [41,42,43,44]. However, in geological and geotechnical engineering monitoring, due to a complex monitoring environment, there is often a significant quantity of noise and interference in the collected data. Consequently, how to quickly and accurately identify catastrophic information from massive fiber data has become a key breakthrough point in technology development. To solve this problem, Shi Bin’s team [45] developed an automated tunnel monitoring system that integrates machine learning and distributed acoustic sensing (DAS). By constructing an integrated processing framework of “signal pickup–feature separation–adaptive filtering”, the system established an optical fiber vibration acoustic dataset for tunnel disturbance identification, which significantly improves the information capture ability of the sensing fiber and realizes the monitoring of tunnel anomaly data in seconds. In addition, through the ensemble learning model, the high–precision automatic classification of nine typical disturbance events, such as on–site excavation, leakage and train passing, was completed. And relying on the tunnel of the Hebei section of the Beijing–Xiong’an intercity railway, on–site measurement and verification were carried out. In the field measurement, based on the system, different vibration events such as tunnel leakage, excavation activities and vehicle traffic were accurately identified. By comparing the on–site observation with the construction record, it is found that the two have good consistency. Thus, it is effectively verified that the tunnel automation monitoring system based on DAS has good technical feasibility and engineering application value in the safety monitoring of operational tunnels (Figure 11).
Through the spatiotemporally continuous perception technology based on DFOS, a new paradigm of health monitoring of modern underground tunnel engineering has been opened. Through the optical fiber neural network covering the ground and underground in all directions, uninterrupted and real–time perception is used to realize the safety monitoring and early warning of disasters throughout the entire life cycle of tunnel engineering structures, and provides reliable data support for tunnel operation and maintenance and disaster risk control [46,47]. Furthermore, combined with different machine learning algorithms, the historical monitoring data training of tunnel engineering is carried out. Based on this, the potential and disaster–causing effects of future disasters in tunnel engineering are predicted, and the level of disaster prevention, mitigation and relief of tunnel engineering is continuously improved.

4. High–Speed Railway Tunnel Engineering Application

4.1. Project Overview

In this manuscript, the DK46 + 092~DK53 + 300 section of a high–speed railway tunnel in Northern China is selected as the field measurement research object. The tunnel engineering’s total length is 7208 m, of which 1783 m is through the river. The tunnel adopts a single–hole double–line design, with a line spacing of 5 m. The tunnel site area is constructed by open–cut method. The tunnel distribution area is mainly located in the alluvial plain. The landform is generally flat and open, with slight undulations in some areas. The surface of the tunnel site area is dominated by cultivated land. There are a few buildings (structures) above the tunnel. Based on geological mapping and drilling data, and referring to the standard classification of regional stratigraphy, the strata in the tunnel area are mainly Quaternary Holocene artificial fill (Q4ml), Quaternary Holocene alluvial deposits (Q4al) comprising organic–rich silty clay, organic–rich silty clay, clay, silty clay, silt, silty sand and fine sand. Underlying Quaternary Upper Pleistocene alluvial deposits (Q3al) comprise clay, silty clay, silt, silty sand and fine sand.

4.2. Monitoring Program

To learn about how a high–speed railway tunnel changes in the structure and how it evolutes over time, this manuscript conducts real–time monitoring of the circumferential strain, axial force and bending moment of the tunnel based on FBG technology. There are a total of 25 tunnel lining circumferential strain monitoring sections in the monitoring section, which are arranged in the form of 5 monitoring surfaces as 1 group and the spacing between the groups is 2 m. It is divided into five groups and distributed in five sections: DK49 + 200, DK50 + 410, DK51 + 060, DK51 + 900 and DK52 + 700. It is used to monitor in the lining structure’s circumferential strain changes of the cycle, including pouring, backfilling and subsequent operations.

4.3. Analysis of Monitoring Results

Taking the DK51 + 907–DK51 + 916 section as an example, the stress of the tunnel section during the process of concrete pouring and backfilling was analyzed. The section inverted arch sensor was laid on 17 March 2019, and the pouring time was on 22 March. The laying time of the lining sensor was on 7–10 April, and the pouring time was on 12 April. After the pouring was completed, continuous automatic monitoring of the circumferential strain of the tunnel began on 15 April. The backfill operation started on 28 May and reached a backfill height of 14 m by 5 September.
As can be seen from Figure 12, the strain value of measurement point 8 fluctuates near the zero value, showing the characteristics of compression–tension alternating conversion. Measurement points 7 and 9 show slowly increasing tensile strain, but the strain value is small. Measurement points 5, 6, 10 and 11 show progressive compressive strain, and the maximum value does not exceed −10 μ ε . Measurement points 3, 13, 4 and 12 are compressive strains, which fluctuate and increase with time, with a peak of about −40 μ ε . Measurement points 1, 2 and 14 are located in the tunnel vault area, and the tensile strain is presented in the initial stage. Then, it converted into a fluctuating compressive strain. The statistics of the average strain of each measurement point during the pouring period can be seen as follows: the strain evolution trend of symmetrical measurement points is highly consistent. During pouring, the lining is at the measurement point 2, subjected to the maximum tensile strain; the strain value is 23.3 μ ε . The maximum compressive strain is subjected to at the measurement point 13, and the strain value is −41.7 μ ε , as detailed in Table 2.
According to the assumption of flat section and the theory of material mechanics, the strain at the upper and lower ends of the section is determined to be the result of the coupling superposition of bending moment and axial force. Therefore, the neutral axis takes the shape of the mandrel. The axial forces and bending moments are calculated according to the following formula:
N = ε 1 + ε 2 2 × E × l
M = ε 1 ε 2 12 × l 2 × E
where ε 1 and ε 2 are the measured values of the outer and inner strain gauges, respectively. l is the center distance of the strain gage, and its value is determined according to the field measurement; E is the elastic modulus of reinforced concrete, and 32.5 GPa of C35 concrete is taken. To specify the direction of axial force, the concrete is positive when tensile and negative when compressed. For the bending moment direction, make the inner arc surface of the lining compressed positive and the tension negative.
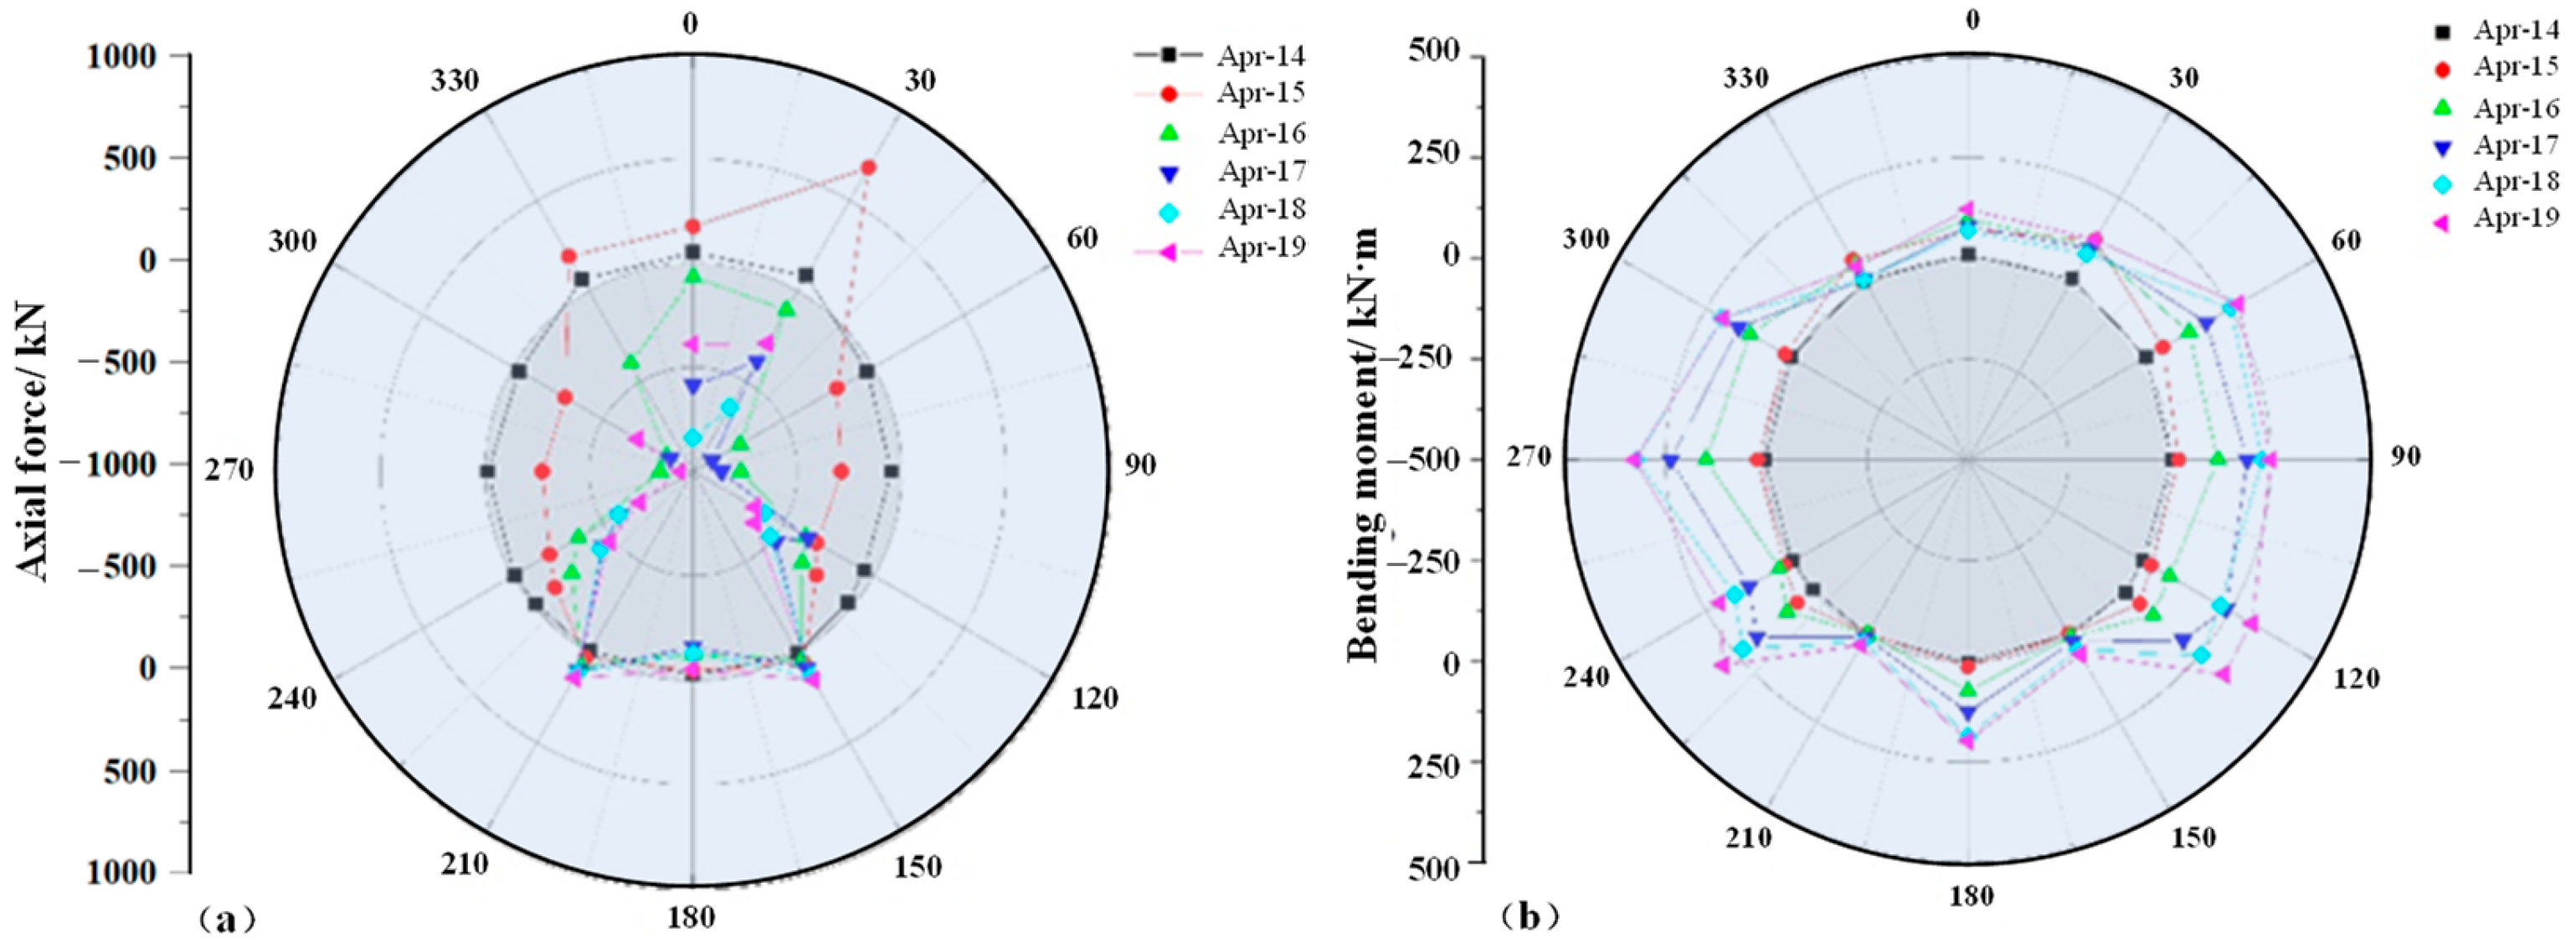
Figure 13 shows the distribution of axial force and bending moment of the tunnel lining section after the pouring. Figure 13a indicates that the axial force changes little with time at 150°, 180° and 210° in the bottom of the tunnel. At the initial monitoring stage (14 April), tensile forces appeared at 0°, 30° and 330° at the top of the tunnel. With time, the axial force at each point is under pressure and gradually increases. Among them, the pressure is the largest at 60°, 90°, 270° and 300° on both waists. It can be seen from Figure 13b that the tunnel section in the maintenance stage shows the characteristics of compression bending. The extreme value of the bending moment occurs in the same position as the axial force. And at both waists, the bending moment values at the top and bottom of the tunnel are relatively small.
Compared with the pouring and curing period, the overall circumferential strain of the tunnel during the backfill period increased significantly. The pressure and strain of each measurement point showed an increasing trend. Figure 14 shows the changes in the average strain of 14 measurement points in the DK51 + 907 section with time during backfilling. Combined with the strain data of each measurement point in Table 3, the increase of strain at measurement points 10 and 11 is the smallest, the increase of strain at measurement point 13 is the largest, and the peak compressive strain is about 90 μ ε . When backfilling, there are differences in the strain change of symmetrical measurement points. The compressive strain at measurement point 13 is significantly higher than at measurement point 3, and the compressive strain at measurement points 5 and 6 is significantly higher than at measurement points 10 and 11.
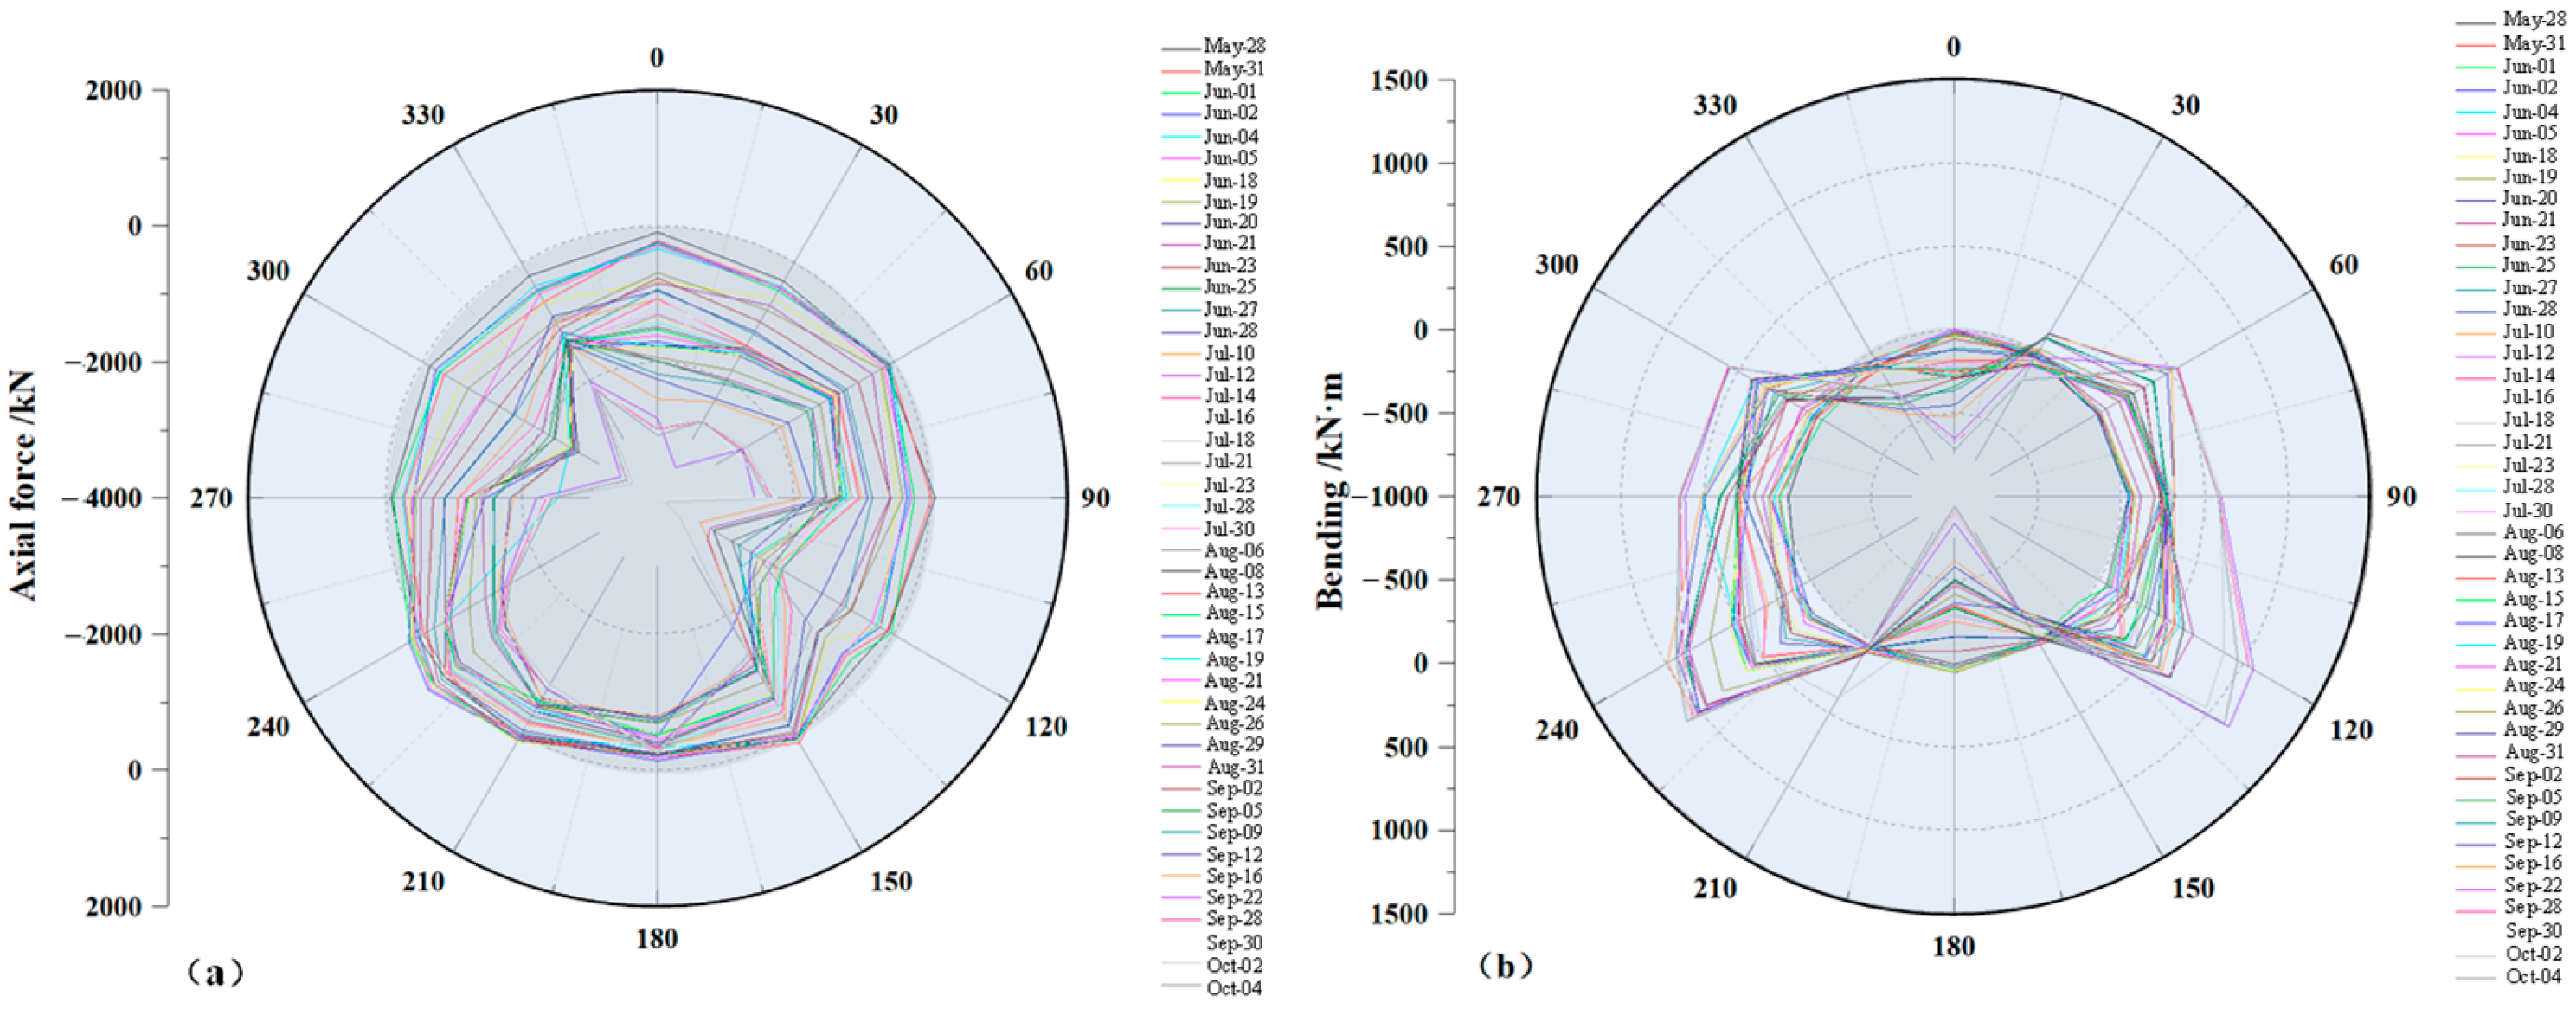
Figure 15 shows the distribution of the axial force and bending moment of the tunnel lining section during backfilling. It can be seen from Figure 15a that the axial force changes significantly in the 300° and 120° directions. The compressive stress continues to increase with the advancement of the backfilling process, and the axial force changes in other positions are not obvious. Figure 15b shows that the compressive bending moment is the largest at 60°, 130°, 230° and 300° of the tunnel waists, and the distribution of the lining bending moment is approximately symmetrical.

5. Discussion

Based on the spatiotemporally continuous fiber optic sensing technology, this research systematically explores the key points, difficulties and implementation process of tunnel engineering structural health monitoring and carries out a demonstration and analysis from three aspects: theoretical technological innovation, monitoring technology verification and field engineering test.

5.1. Aspects of Theoretical and Technological Innovation

This manuscript systematically sorts out the development and evolution process of tunnel engineering structure health monitoring theory and technology by clarifying the basic performance, implementation process, advantages and disadvantages of various tunnel engineering structure health monitoring technologies. It provides a new path for clarifying the key points and difficulties of tunnel engineering monitoring. However, tunnel engineering is highly concealed. The multi–field coupling effect of rock and soil has an important impact on its stability. Therefore, it is urgent to conduct in–depth research on monitoring network deployment [48], multi–field data fusion [49], intelligent algorithm interpretation [50] and prediction model construction [51], so as to continuously break through the bottleneck of technological innovation.

5.2. Aspects of Monitoring Technology Verification

As a new intelligent sensing technology, distributed fiber sensing has the advantages of anti–electromagnetic interference, good durability, high sensitivity, distribution and so on, which is one of the best technologies for realizing the healthy spatiotemporal continuous sensing of tunnel engineering structures [52]. In the actual monitoring of tunnel engineering, the “longitudinal–lateral–circumferential” joint method is used to construct a full–section fiber optic sensing network, which can effectively obtain the spatiotemporally continuous information of the tunnel structure state. This makes up for the misjudgment of monitoring results caused by missed detection and misdetection by conventional monitoring technology. The manuscript describes in detail the mechanism of action of typical fiber optic sensing technology. The key parameters of tunnel engineering structural health monitoring are taken as the research objectives, such as deformation, temperature, seepage and vibration. The application effectiveness of various fiber optic sensing technologies in tunnel engineering monitoring is verified [53]. On this basis, a spatiotemporally continuous perception method for tunnel engineering based on DFOS is proposed, which provides a new idea for the safety monitoring and early warning of disasters in the whole life cycle of tunnel engineering structures.

5.3. Aspects of On–Site Engineering Tests

In this manuscript, a high–speed rail tunnel in northern China is used as the research object to carry out the real–time monitoring of tunnel circumferential strain, axial force and bending moment. Through comparing and analyzing the change process of the average strain, which is the tunnel section measurement point with time after the pouring is completed, it is found that the tunnel vault area shows tensile strain in the early stage. This is subsequently converted into fluctuating compressive strain. At the same time, through the statistics of the average strain of each measurement point during the pouring period, it can be seen that the strain evolution trend of the symmetrical measurement point on the tunnel section is highly consistent. The axial force changes relatively little over time at the bottom of the tunnel. In the maintenance stage, the tunnel section as a whole shows the characteristics of compression bending, and the position of the extreme value in the bending moment is basically the same as the axial force. According to the change process of the average strain of each measurement point with time during the backfilling period, it can be seen that compared with the pouring and curing period, the overall circumferential strain of the tunnel during the backfilling period is significantly increased. The pressure and strain of each measuring point showed an increasing trend. The compression bending moment of the tunnel waist was the largest, and the distribution of the lining bending moment was approximately symmetrical. The test results can provide technical support for the safety evaluation and disaster prevention, control of high–speed rail tunnel construction and operation and maintenance period.

6. Conclusions

Tunnel engineering structural health monitoring realizes advanced warning of various disaster risks by obtaining the response information of the surrounding rock–support system in real time. Therefore, it is widely used in tunnel engineering safety evaluation. This manuscript systematically sorts out the development and evolution process of tunnel engineering structural health monitoring theory and technology. The monitoring application of DFOS–based spatiotemporally continuous information perception technology in tunnel engineering is introduced in detail. And taking the application of a high–speed rail tunnel in northern China as an example, the feasibility and effectiveness of DFOS technology in the health monitoring of tunnel engineering structures are further verified. The following conclusions are drawn:
(1) The systematic sorting out of the development and evolution process has been completed, including tunnel engineering structure health monitoring theory and technology. From the two dimensions of equipment and technology, the scope of application, advantages and disadvantages of tunnel engineering structure health monitoring methods are compared and analyzed. On this basis, the technical bottleneck that needs to be broken through in the current tunnel engineering structural health monitoring is proposed. The spatiotemporally continuous perception of the full–cycle status information and the precise control of safety risks are realized for tunnel engineering.
(2) The mechanism of fiber optic sensing technologies such as FBG, BOFDA, DTS and DAS and their monitoring and application in tunnel engineering are introduced in detail. On this basis, a spatiotemporally continuous perception technology based on DFOS is proposed. It realizes the safety monitoring of the whole life cycle and early warning of disasters for tunnel engineering.
(3) Taking a high–speed rail tunnel in northern China as the field measurement research object, the circumferential strain, axial force and bending moment of the tunnel are monitored in real time. The structural deformation characteristics and evolution trend of the high–speed rail tunnel in this section are accurately obtained. By obtaining the change value of the average strain of the tunnel section measurement point with time after the pouring is completed and during the backfilling period, the stress deformation characteristics and evolution laws of different locations of tunnels in different periods are compared and analyzed. This provides important data support for carrying out health diagnosis, risk assessment and precise support for tunnel engineering.
(4) With the gradual application of new technologies such as fiber optic gas sensors, inspection robots and full–space laser scanning to the health monitoring of tunnel engineering structures, integrated monitoring technology that integrates “acoustic, optic and electromagnetic” can be built. It can realize comprehensive real–time monitoring of structural parameters and environmental parameters such as tunnel structure status, gas concentration, temperature and humidity. At the same time, long–term monitoring data can be integrated for training, and a tunnel engineering risk and hidden danger evaluation model can be established. Based on this, the potential and disaster effects of tunnel disasters are predicted, and the level of disaster prevention, mitigation and relief of tunnel engineering is continuously improved.

Author Contributions

G.C. designed the overall framework and conceived the idea of this paper; Z.W., G.L. and B.S. completed the analysis and summary of the research progress of the tunnel structure health; B.S., J.W., D.C. and Y.N. provided some suggestions on the structure of the paper and the optimization of figures; G.C., Z.W. and G.L. wrote the paper. All authors have read and agreed to the published version of the manuscript.

Funding

This research was funded by the National Natural Science Foundation of China (42377200, 42030701); the Natural Science Foundation of Hebei Province, China (D2025508013); Supported by State Key Laboratory for Tunnel Engineering (TESKL202435); Graduate Student Innovation Ability Training Funding Project of Hebei Province, China (CXZZSS2025139); the Funds for the Key Laboratory of Earth Fissures Geological Disaster, Ministry of Natural Resources (JSDDY-HJ-D-2024-006); the Fundamental Research Funds for the Central Universities (3142025033).

Institutional Review Board Statement

Not applicable.

Informed Consent Statement

Not applicable.

Data Availability Statement

Data are contained within the paper.

Acknowledgments

The authors would like to thank Lei Zhang for his assistance in the manuscript proofreading process, and Liu Yang for her assistance in paper drawing.

Conflicts of Interest

The authors declare no conflicts of interest.

References

  1. National Bureau of Statistics of China. Statistical Communiqué of the People’s Republic of China on the 2024 National Economic and Social Development [EB/OL]. Available online: https://www.gov.cn/lianbo/bumen/202502/content_7008605.htm (accessed on 28 February 2025).
  2. Zhang, X.H.; Zhu, H.H.; Jiang, X.; Broere, W. Distributed fiber optic sensors for tunnel monitoring: A state–of–the–art review. J. Rock. Mech. Geotech. Eng. 2024, 16, 3841–3863. [Google Scholar] [CrossRef]
  3. Zhang, T.; Gan, Q.; Zhao, Y.X.; Zhu, G.P.; Nie, X.D.; Yang, K.; Li, J.Z. Investigations into mining–induced stress–fracture–seepage field coupling effect considering the response of key stratum and composite aquifer. Rock. Mech. Rock. Eng. 2019, 52, 4017–4031. [Google Scholar] [CrossRef]
  4. Zheng, J.T.; Zheng, L.G.; Liu, H.H.; Ju, Y. Relationships between permeability, porosity and effective stress for low–permeability sedimentary rock. Int. J. Rock. Mech. Min. Sci. 2015, 78, 304–318. [Google Scholar] [CrossRef]
  5. Sun, Y.J.; Zhao, X.M.; Xu, Z.M.; Zhang, L.; Chen, G.; Feng, L.; Li, X.; Chen, T.C.; Yuan, H.Q.; Liu, Q.; et al. Hydrodynamic field driving effect and mathematical model construction of water quality formation and evolution in coal mine. J. China Coal Soc. 2023, 48, 4157–4170. [Google Scholar] [CrossRef]
  6. Yu, P.; Liu, H.H.; Wang, Z.S.; Fu, J.N.; Zhang, H.; Wang, J.; Yang, Q. Development of urban underground space in coastal cities in China: A review. Deep. Undergr. Sci. Eng. 2023, 2, 148–172. [Google Scholar] [CrossRef]
  7. Sun, Q.; Yan, C.H.; Qiu, J.F.; Xu, B.; Sha, J.Q. Numerical Simulation of a Deep Excavation near a Shield Tunnel. Technol. Gaz. 2018, 25, 670–678. [Google Scholar]
  8. Wang, S.Y.; Sloan, S.W.; Tang, C.A.; Zhu, W.C. Numerical simulation of the failure mechanism of circular tunnels in transversely isotropic rock masses. Tunn. Undergr. Space Technol. 2012, 32, 231–244. [Google Scholar] [CrossRef]
  9. Mao, M.M.; Yang, X.W.; Liu, C.; Zhao, T.; Liu, H. Deformation monitoring at shield tunnel joints: Laboratory test and discrete element simulation. Deep. Undergr. Sci. Eng. 2025, 4, 149–157. [Google Scholar] [CrossRef]
  10. Zhong, S.H.; Li, S.C.; Sun, H.Z.; Li, X. Tunnel construction of exploratory forecasting faults, fracture zones and groundwater technology. Superv. Test. Cost. Constr. 2009, 2, 69–73. [Google Scholar]
  11. Li, S.C.; Liu, B.; Sun, H.F.; Nie, L.C.; Zhong, S.H.; Su, M.X.; Li, X.; Xu, Z.H. State of art and trends of advanced geological prediction in tunnel construction. Chin. J. Rock. Mech. Eng. 2014, 33, 1090–1113. [Google Scholar] [CrossRef]
  12. Chambon, P.; Corte, J.F. Shallow tunnels in cohesionless soil: Stability of tunnel face. J. Geotech. Eng. 1994, 120, 1148–1165. [Google Scholar] [CrossRef]
  13. Zhu, W.S.; He, M.C. Stability of Surrounding Rock and Dynamic Construction Mechanics of Rock Mass Under Complex Conditions; China Science Publishing & Media Ltd. (CSPM): Beijing, China, 1995. [Google Scholar]
  14. Zhu, H.H.; Jiang, Y.; Xia, C.C.; Yang, L.D.; Cui, M.Y. Study on Tunnel Construction Informational Technology in Complicated Geological Condition. Chin. J. Rock. Mech. Eng. 2002, 2, 2548–2553. [Google Scholar]
  15. Lee, C.J.; Wu, B.R.; Chen, H.T.; Chiang, K.H. Tunnel stability and arching effects during tunneling in soft clayey soil. Tunn. Undergr. Space Technol. 2006, 21, 119–132. [Google Scholar] [CrossRef]
  16. Gu, S.L.; Wang, F.M.; Dong, X.P. Evaluation of the effect of ESO algorithm for tunnel section shape optimization. Yellow River 2010, 32, 109–110. [Google Scholar]
  17. Li, S.C.; He, P.; Li, L.P.; Zhang, Q.Q.; Shi, S.S.; Xu, F.; Liu, H.L. Reliability analysis method of sub–classification of tunnel rock mass and its engineering application. Rock. Soil. Mech. 2018, 39, 967–976. [Google Scholar]
  18. Xu, C.B.; Zheng, Z.T.; Xin, H.S.; Miu, Y.B.; Du, J. Classification and prospect for large deformation of tunnel surrounding rock. Tunn. Constr. 2023, 43, 27–40. [Google Scholar]
  19. Wang, F.M.; Guo, C.C.; Sun, B.; Wang, H.R.; Guan, H.; Liu, J.Y.; Huo, J.X.; Da, Z.Q. Research on Key Technologies for Integrated Waterproofing, Seismic Reduction, and Thermal Insulation in Tunnels. Railw. Stand. Des. 2024, 68, 1–10. [Google Scholar]
  20. Bao, Y.B.; Sun, J.Q.; Huang, Q. Distributed Fiber Sensor Based on Brillouin Optical Time Domain Reflection Technique. Laser Optoelectron. Prog. 2020, 57, 21–39. [Google Scholar] [CrossRef]
  21. Mohamad, H.; Soga, K.; Bennett, P.J.; Mair, R.J.; Lim, C.S. Monitoring twin tunnel interaction using distributed optical fiber strain measurements. J. Geotech. Geoenviron. Eng. 2012, 138, 957–967. [Google Scholar] [CrossRef]
  22. Wang, J.; Garg, A.; Satyam, N.; Zhussupbekov, A.; Sushkova, S. DFOS Technology in Geoengineering Monitoring in the Past 35 Years: A Bibliometric Analysis. Sensors 2024, 24, 5051. [Google Scholar] [CrossRef]
  23. Su, H.Z.; Ou, B.; Yang, L.F.; Wen, Z.P. Distributed optical fiber–based monitoring approach of spatial seepage behavior in dike engineering. Opt. Laser Techno. 2018, 103, 346–353. [Google Scholar] [CrossRef]
  24. Sun, Y.J.; Shi, B.; Chen, S.E.; Zhu, H.H.; Zhang, D.; Lu, Y. Feasibility study on corrosion monitoring of a concrete column with central rebar using BOTDR. Smart Struct. Syst. 2014, 13, 41–53. [Google Scholar] [CrossRef]
  25. Fajkus, M.; Nedoma, J.; Mec, P.; Hrubešová, E.; Martinek, R.; Vasinek, V. Analysis of the highway tunnels monitoring using an optical fiber implemented into primary lining. J. Electr. Eng. 2017, 68, 364–370. [Google Scholar] [CrossRef]
  26. Hoes, O.A.C.; Schilperoort, R.P.S.; Luxemburg, W.M.J.; Clemens, F.H.L.R.; van de Giesen, N.C. Locating illicit connections in storm water sewers using fiber–optic distributed temperature sensing. Water Res. 2009, 43, 5187–5197. [Google Scholar] [CrossRef]
  27. Monsberger, C.M.; Bauer, P.; Buchmayer, F.; Lienhart, W. Large–scale distributed fiber optic sensing network for short and long–term integrity monitoring of tunnel linings. J. Civ. Struct. Health Monit. 2022, 12, 1317–1327. [Google Scholar] [CrossRef]
  28. Guo, J.Y.; Fang, J.H.; Shi, B.; Zhang, C.C.; Liu, L. High–sensitivity water leakage detection and localization in tunnels using novel ultra–weak fiber Bragg grating sensing technology. Tunn. Undergr. Space Technol. 2024, 144, 105574. [Google Scholar] [CrossRef]
  29. Zhang, X.H.; Zhu, H.H.; Jiang, X.; Broere, W.; Long, L.Y. Designing a Distributed Sensing Network for Structural Health Monitoring of Concrete Tunnels: A Case Study. Struct. Control Health Monit. 2024, 2024, 6087901. [Google Scholar] [CrossRef]
  30. Klar, A.; Dromy, I.; Linker, R. Monitoring tunneling induced ground displacements using distributed fiber–optic sensing. Tunn. Undergr. Space Technol. 2014, 40, 141–150. [Google Scholar] [CrossRef]
  31. Shi, B. On the ground sensing system and ground sensing engineering. J. Eng. Geol. 2017, 25, 582–591. [Google Scholar] [CrossRef]
  32. Wang, H.P.; Dai, J.G.; Wang, X.Z. Improved temperature compensation of fiber Bragg grating–based sensors applied to structures under different loading conditions. Opt. Fiber Technol. 2021, 63, 102506. [Google Scholar] [CrossRef]
  33. Ren, C.; Sun, X.M.; He, M.C.; Tao, Z.G. Application of FBG Sensing Technology for Real–Time Monitoring in High–Stress Tunnel Environments. Appl. Sci. 2024, 14, 8202. [Google Scholar] [CrossRef]
  34. Song, H.B.; Pei, H.F.; Zhu, H.H. Monitoring of tunnel excavation based on the fiber Bragg grating sensing technology. Measurement 2021, 169, 108334. [Google Scholar] [CrossRef]
  35. Li, J.; Zhang, D.B.; Zhang, X.W.; Zhang, J.R.; Yao, R.X.; Fan, B.B. Safety Monitoring of Railway Tunnel Structure During Operation Period Based on Fiber Grating Sensing and Video Displacement Meter Technology. Laser Optoelectron. Prog. 2023, 60, 177–185. [Google Scholar]
  36. Jiao, H.R.; Shi, B.; Wei, G.Q.; Wang, X.; Jia, L.X. Study on influence factors of temperature coefficient of sensing optical fiber based on BOFDA. J. Electron. Meas. Instrum. 2018, 32, 73–80. [Google Scholar] [CrossRef]
  37. Wang, X.; Shi, B.; Wei, G.Q.; Chen, S.E.; Zhu, H.H.; Wang, T. Monitoring the behavior of segment joints in a shield tunnel using distributed fiber optic sensors. Struct. Control Health Monit. 2018, 25, e2056. [Google Scholar] [CrossRef]
  38. Gong, X.N.; Guo, P.P. Prevention and Mitigation Methods for Water Leakage in Tunnels and Underground Structures. China J. Highw. Transp. 2021, 34, 1–30. [Google Scholar] [CrossRef]
  39. Wu, X.G.; Liu, P.C.; Wang, L.; Chen, H.Y.; Zhang, L.M. Monitoring and Warning of Seepage in Subway Operation Tunnel Based on 3D Laser Scanning. J. Civ. Eng. Manag. 2020, 37, 1–7+15. [Google Scholar] [CrossRef]
  40. Liu, J.; Zhou, L.Z.; Zhang, X.S.; Sun, H.L.; Miao, M.; Qu, S.G.; Xie, Q.Y.; Han, B.; Wang, K. Monitoring contact seepage between earth–fill dam and trans–dam culvert based on temperature variation regularity of optical fiber. J. Civ. Struct. Health Monit. 2023, 13, 767–780. [Google Scholar] [CrossRef]
  41. Fu, S.C.; Zhang, D.; Peng, Y.; Shi, B.; Yedili, N.; Ma, Z. A simulation of gas pipeline leakage monitoring based on distributed acoustic sensing. Meas. Sci. Technol. 2022, 33, 095108. [Google Scholar] [CrossRef]
  42. Jousset, P.; Reinsch, T.; Ryberg, T.; Blanck, H.; Clarke, A.; Aghayev, R.; Hersir, G.P.; Henninges, J.; Weber, M.; Krawczyk, C.M. Dynamic strain determination using fibre–optic cables allows imaging of seismological and structural features. Nat. Commun. 2018, 9, 2509. [Google Scholar] [CrossRef]
  43. Williams, E.F.; Fernández-Ruiz, M.R.; Magalhaes, R.; Vanthillo, R.; Zhan, Z.W.; González-Herráez, M.; Martins, H.F. Distributed sensing of microseisms and teleseisms with submarine dark fibers. Nat. Commun. 2019, 10, 5778. [Google Scholar] [CrossRef]
  44. Spica, Z.J.; Perton, M.; Martin, E.R.; Beroza, G.C.; Biondi, B. Urban Seismic Site Characterization by Fiber–Optic Seismology. J. Geophys. Res. Solid. Earth 2020, 125, e2019JB018656. [Google Scholar] [CrossRef]
  45. Zhang, T.Y.; Zhang, C.C.; Xie, T.; Xu, X.M.; Shi, B. Automatic Identification of Diverse Tunnel Threats with Machine Learning–Based Distributed Acoustic Sensing. Struct. Control Health Monit. 2025, 2025, 9780866. [Google Scholar] [CrossRef]
  46. Yang, H.; Xu, X.Y. Structure monitoring and deformation analysis of tunnel structure. Compos. Struct. 2021, 276, 114565. [Google Scholar] [CrossRef]
  47. Xu, X.; Yang, H. Vision Measurement of Tunnel Structures with Robust Modelling and Deep Learning Algorithms. Sensors 2020, 20, 4945. [Google Scholar] [CrossRef] [PubMed]
  48. Cheng, G.; Wang, Z.X.; Shi, B.; Zhu, W.; Li, T.B. Research on a Space–Time Continuous Sensing System for Overburden Deformation and Failure during Coal Mining Overburden Deformation and Failure during Coal Mining. Sensors 2023, 23, 5947. [Google Scholar] [CrossRef]
  49. Wang, D.Y.; Zhu, H.H.; Huang, J.W.; Yan, Z.R.; Zheng, X.; Shi, B. Fiber optic sensing and performance evaluation of water conveyance tunnel with composite linings under super high internal pressures. J. Rock. Mech. Geotech. Eng. 2023, 15, 1997–2012. [Google Scholar] [CrossRef]
  50. Afrazi, M.; Armaghani, D.J.; Afrazi, H.; Fattahi, H.; Samui, P. Real–time monitoring of tunnel structures using digital twin and artificial intelligence: A short overview. Deep. Undergr. Sci. Eng. 2025. [Google Scholar] [CrossRef]
  51. Zhang, Z.L.; Zhang, T.T.; Li, X.Z.; Dias, D. Bayesian ensemble methods for predicting ground deformation due to tunnelling with sparse monitoring data. Undergr. Space 2024, 16, 79–93. [Google Scholar] [CrossRef]
  52. Wang, X.; Wang, M.; Jiang, R.; Xu, J.; Li, B.; Wang, X.; Yu, J.; Su, P.; Liu, C.; Yang, Q.; et al. Structural deformation monitoring during tunnel construction: A review. J. Civ. Struct. Health Monit. 2024, 14, 591–613. [Google Scholar] [CrossRef]
  53. Gue, C.Y.; Wilcock, M.; Alhaddad, M.M.; Elshafie, M.Z.E.B.; Soga, K.; Mair, R.J. The monitoring of an existing cast iron tunnel with distributed fibre optic sensing (DFOS). J. Civ. Struct. Health Monit. 2015, 5, 573–586. [Google Scholar] [CrossRef]
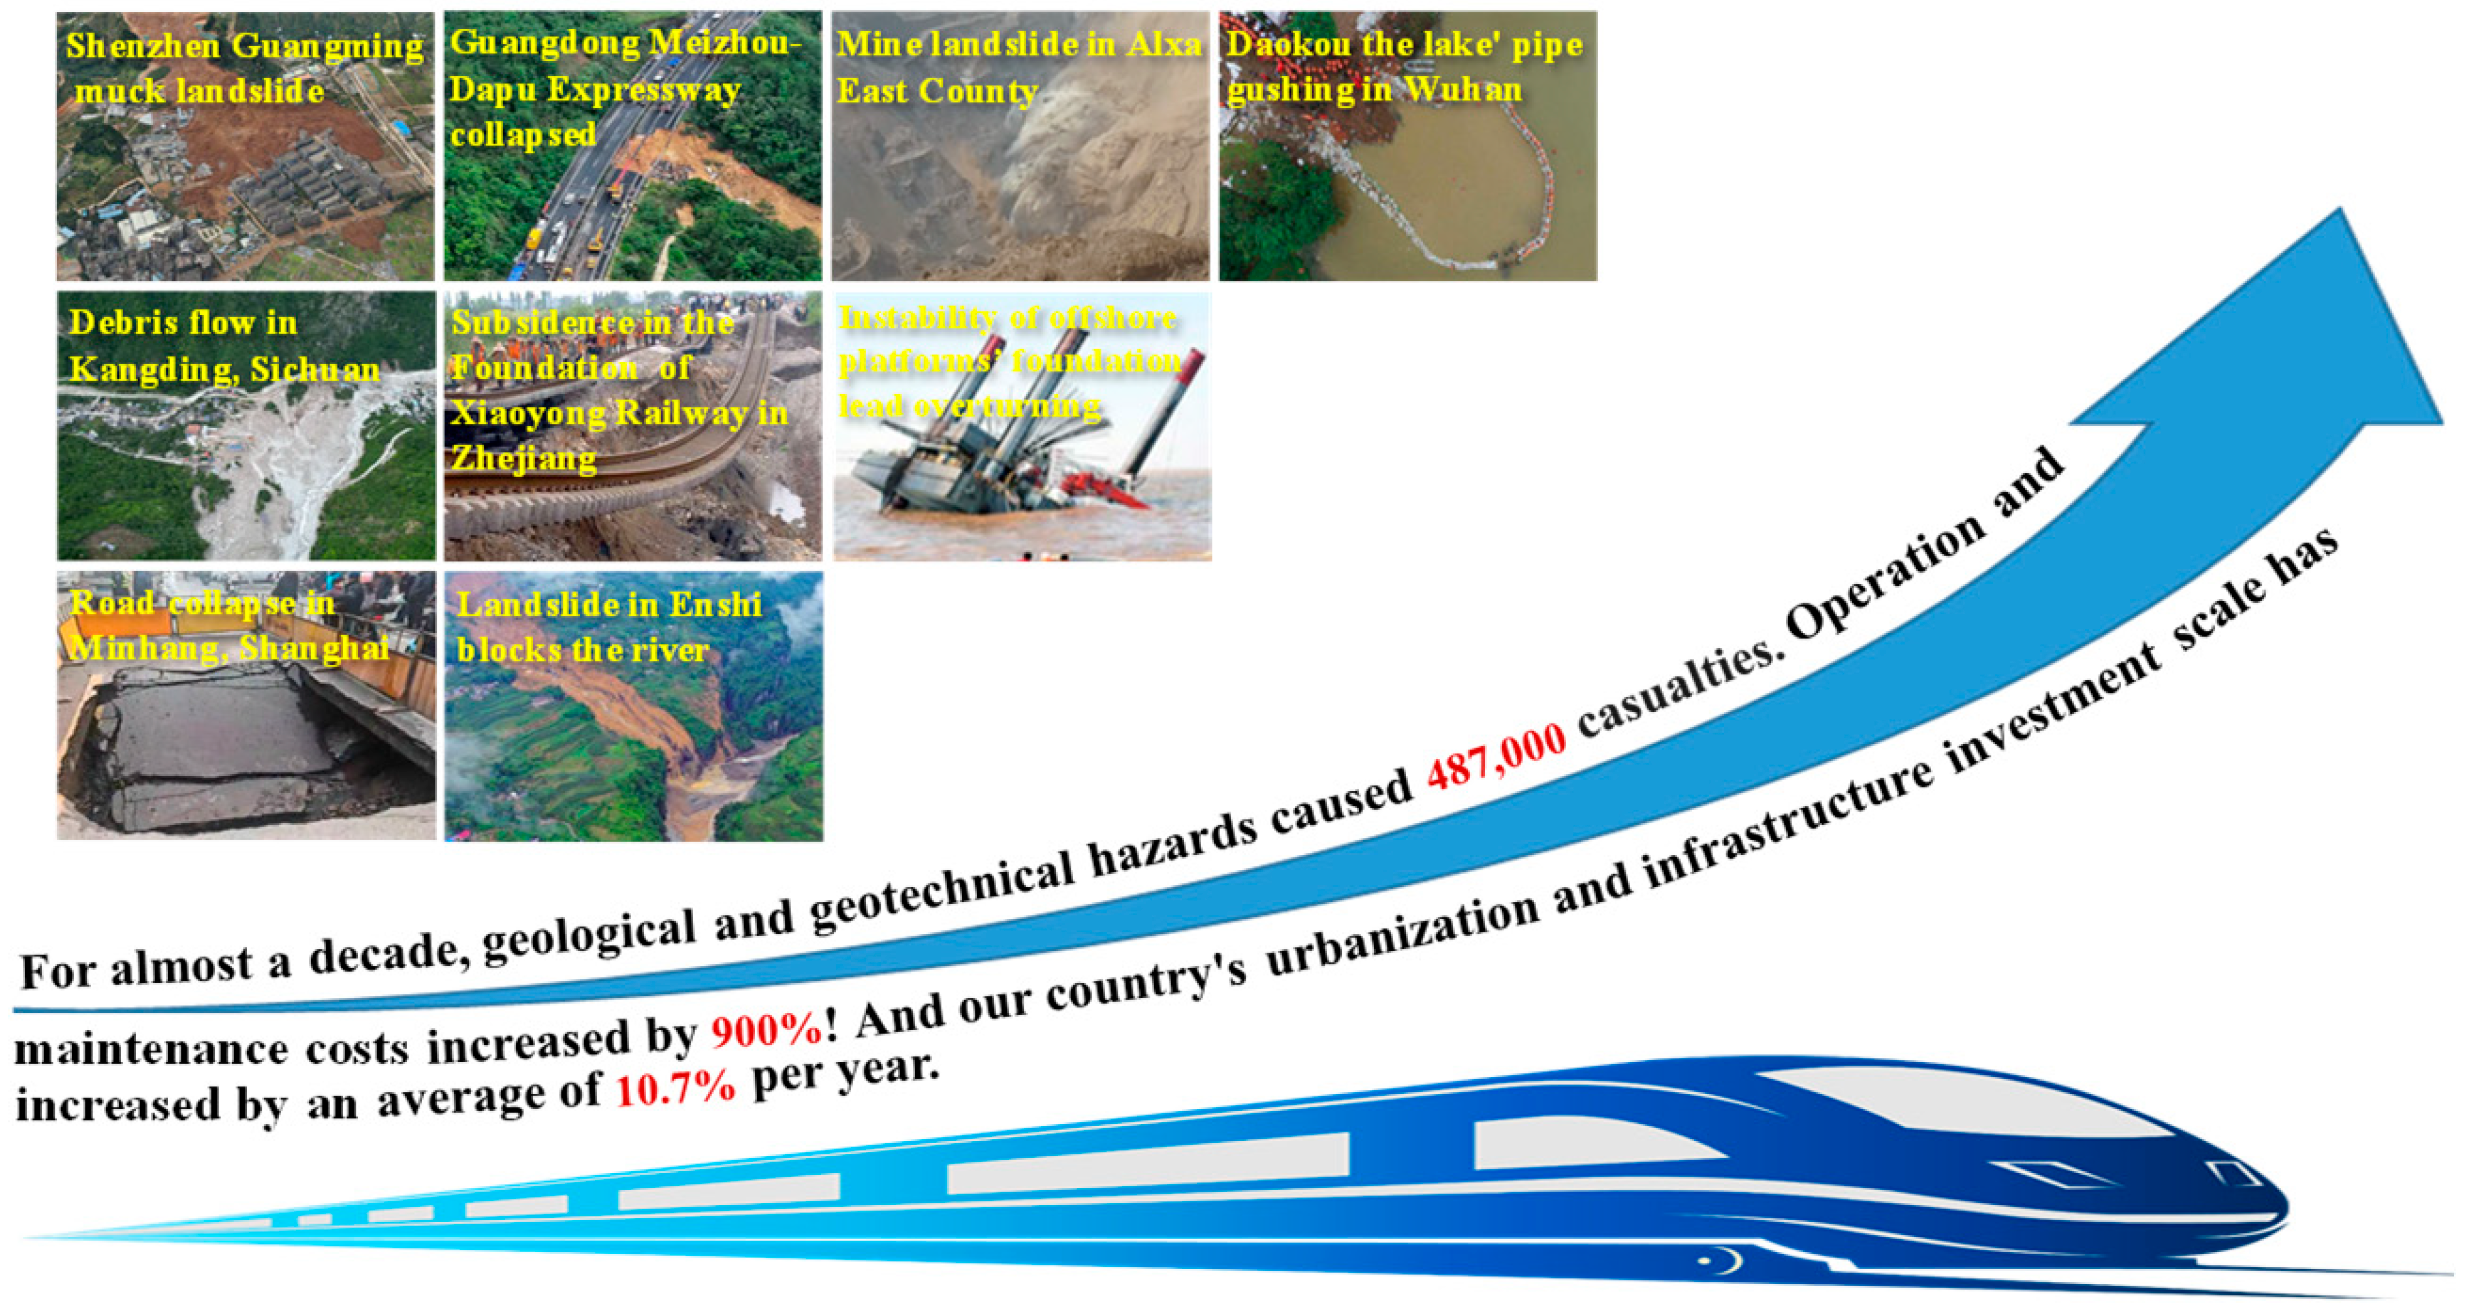
Figure 1. Geological and geotechnical disaster cases in China. (Data from the Global Competitiveness Report).
Photonics 12 00855 g001
Figure 2. The total mileage of roads, railways and the corresponding total mileage of tunnels in China, 2015–2024.
Photonics 12 00855 g002
Figure 3. The scenes of various typical tunnel disasters and accidents around the world.
Photonics 12 00855 g003
Figure 4. Development and evolution of theoretical models in tunnel engineering.
Photonics 12 00855 g004
Figure 5. Main principles and classification of DFOS technologies.
Photonics 12 00855 g005
Figure 6. Spatiotemporally continuous perception of tunnel engineering based on DFOS technologies.
Photonics 12 00855 g006
Figure 7. Classification of optical fiber sensing technological methods.
Photonics 12 00855 g007
Figure 8. Structural safety monitoring system for tunnel engineering.
Photonics 12 00855 g008
Figure 9. The relationship between the small deformation of segmental joints and the expansion of the track bed with temperature change: (a) segment joints displacement in both left and right sides, and (b) expansion displacement in the ballast bed.
Photonics 12 00855 g009
Figure 10. Simulation of leakage in cross–dam culvert and temperature change of distributed optical fiber under different conditions: (a) schematization of how leakage is simulated in the trans–dam culvert, (b) fiber temperature variation under different thermal conductivity conditions, (c) fiber temperature variation under different seepage discharge conditions, and (d) fiber temperature variation under different power conditions.
Photonics 12 00855 g010
Figure 11. On–site layout and monitoring data of the Beijing–Xiong’an intercity railway tunnel: (a) waveforms and spectrograms of nine types of events, (b) Beijing–Xiong’an intercity railway tunnel and sensing fiber deployment scheme and (c) disturbance events identified in the Beijing–Xiong’an intercity railway tunnel.
Photonics 12 00855 g011
Figure 12. Variations in average strain of 14 measurement points in the DK51 + 907 section after pouring completion.
Photonics 12 00855 g012
Figure 13. Changes in internal forces of 14 measurement points of DK51 + 907 cross–section after completion of pouring: (a) axial force, and (b) bending moment.
Photonics 12 00855 g013
Figure 14. The changes in the average strain of 14 measurement points in DK51 + 907 section with time during backfilling.
Photonics 12 00855 g014
Figure 15. The internal force changes in 14 measurement points of DK51 + 907 cross section during the backfilling: (a) axial force, and (b) bending moment.
Photonics 12 00855 g015
Table 1. Classification of main technologies and equipment for tunnel engineering’s structural health monitoring.
ClassificationNameBasic Performance MetricsScope of ApplicationAdvantages and Disadvantages
EquipmentVibrating Wire Displacement MeterMeasurement range: 25~200 mm
Resolution: ≤0.05%F·S
Non–repetition: ≤0.5%F·S
Monitor the displacement changes in multiple measurement points of the tunnel structure concurrently.High accuracy; multi–point monitoring; real–time monitoring. High cost; low environmental adaptability; complex data processing.
MEMS InclinometerMeasurement range: ±30° (dual axis) or ±90° (single axis)
Measurement accuracy: ±0.02°~±0.1°
Resolution: 0.001°~0.005°
Monitor the joint of shield tunnel segments and the inner surface of the tunnel lining.Low cost; low power consumption; high reliability; easy to integrate; achieve intelligence. short lifespan; difficult to adapt to the harsh working environment.
Tunnel Clearance Convergence MeterMeasurement range: ±0.06 mm
Measurement accuracy: ±0.06~±2 mm
Resolution: 0.01 mm
Monitor the relative displacement between the tunnel vault, arch feet and side walls.High precision; easy to operate; real–time monitoring. Susceptibility to environmental influences; measurement point layout restrictions; data processing is complex.
Rock–Bolt DynamometerMeasurement range: Tensile stress, 0~200 MPa; Compressive stress: 0~100 MPa
Resolution: ≤0.05%F·S
Operating temperature range: −20 °C~+80 °C
Monitor key support sections such as tunnel vaults, arches, and side walls.Real–time monitoring; high precision; good stability. Higher cost; complex installation and maintenance.
LiDAR Laser ScannerVertical scanning range: ≥270°
Horizontal scanning range: mostly 360°
Maximum scanning distance: ≥100 m
Monitor tunnel sections, cracks and damage, and tunnel settlement.Rich measurement data; high precision; working around the clock; non–contact measurement. There are errors in the monitoring data; the monitoring accuracy is limited; high cost.
TechnologyFiber Bragg Grating (FBG)Strain accuracy: ±1 με
Temperature accuracy: ±0.1 °C
Distance: ≤3.00 km
Spatial resolution: >0.20 m
Sampling resolution: 0.5 cm
Monitor tunnel linings, supporting structures, cracks and other parts, and carry out large–scale networked integrated monitoring.High sensitivity; anti–electromagnetic interference; quasi–distributed; the measured data are stable; easy to implement multiplexing. High maintenance costs; there is a missed detection; it is difficult to demodulate.
Ultra–Weak Fiber Bragg Grating (UWFBG)Strain accuracy: ±1 με
Temperature accuracy: ±0.1 °C
Distance: ≥10 km
Spatial resolution: 1.0 m
Sampling resolution: 1.0 m
Monitor key structural parts such as tunnel lining structures and surrounding rock convergence.Quasi–distributed; high precision; real–time monitoring; strong anti–interference ability; low operating costs. High hardware costs; high requirements for technical personnel; data processing is complex.
Brillouin Optical Time Domain Reflectometer (BOTDR)Strain accuracy: ±10 με
Temperature accuracy: ±1.0 °C
Distance: <80 km
Spatial resolution: 1.00 m
Sampling resolution: 0.05 m
Monitor the deformation of key positions such as the surface layer of the structure, lining structure, arch circle, and surrounding geological body in the tunnel.Distributed; long distance; high precision; anti–electromagnetic interference; light, fine and flexible. High cost; long measurement time; large amount of data processing.
Distributed Sensor System (DSS)Strain accuracy: ±2~10 με
Temperature accuracy: ±0.35~1°C
Distance: 10~50 km
Spatial resolution: 0.50~1.00 m
Sampling resolution: 0.50 m
Monitor the strain of tunnel engineering: tunnel headroom convergence, vault deformation, surrounding rock settlement, and horizontal/vertical displacement of soil.High precision; long distance; anti–electromagnetic interference; real–time monitoring; non–intrusive installation. High cost; high requirements for technical personnel.
Distributed Temperature Sensing (DTS)Distance: 2 km~30 km
Temperature measurement range: −200 °C~+600 °C
Spatial sampling resolution: 0.50 m~4.00 m
Temperature resolution: 0.01 °C~1.00 °C
Monitor the seepage locations that are prone to occur, such as the contact surface between the tunnel lining and the surrounding rock, the vault and side walls, and the construction joints.Distributed; long distance; high precision; real–time monitoring. High cost; complex data processing; there is a bias in the data.
Distributed Acoustic Sensing (DAS)Distance: >50 km
Sound response frequency: 0~50 kHz
Spatial sampling resolution: 0.25 m
Real–time vibration monitoring can be carried out on the tunnel vault, side wall, along the line, road surface and other positions.Long distance; continuous monitoring; high precision; multi–parameter; high temperature resistance; small size; strong networking ability; low cost. Affected by the environment; high technical requirements for operators.
Table 2. Statistics of average strain at each measurement point during the pouring period.
Measurement Point Strain   Values   During   the   Pouring   Period   / μ ε Measurement Point Strain   Values   During   the   Pouring   Period   / μ ε
MaxAveMinMaxAveMin
18.7−13.8−29.1////
223.3−10.1−27.8146.5−34.251.8
3−0.6−30.2−40.413−0.5−29.2−41.7
4−0.9−26.9−34.6120.0−29.0−38.2
5−0.2−6.5−9.911−0.1−7.1−10.1
6−0.2−6.0−9.010−0.1−5.0−6.9
75.23.20.194.83.2−0.2
82.2−3.3−6.2////
Abbreviations: Max, maximum; Ave, Average; Min, minimum.
Table 3. Statistics of average strain at each measurement point during the backfilling period.
Measurement Point Strain   Value   During   the   Backfilling   Period   / μ ε Measurement Point Strain   Value   During   the   Backfilling   Period   / μ ε
MaxAveMinMaxAveMin
1−7.3−40.8−68.8////
2−13.7−42.4−68.814−13.6−39.2−51.2
3−1.5−27.8−49.813−7.7−59.9−90.8
40.7−29.9−48.612−3.5−28.9−48.9
5−0.5−23.1−43.5113.1−5.6−24.3
6−4.2−21.7−42.5105.5−1.2−12.6
75.4−12.4−37.794.7−7.4−21.7
8−4.8−12.9−27.1////
Disclaimer/Publisher’s Note: The statements, opinions and data contained in all publications are solely those of the individual author(s) and contributor(s) and not of MDPI and/or the editor(s). MDPI and/or the editor(s) disclaim responsibility for any injury to people or property resulting from any ideas, methods, instructions or products referred to in the content.