3.1. Two-Grating Model
The imperfect fit of independent individual grating units in TGA causes intensity and phase deterioration. This fit mismatch can be either translations (shifts) or rotations (twists) in nature. The changes observed in the far field and the degradation caused by the tiling errors are discussed in detail in the following.
Theoretical simulations and experimental results demonstrate that the misalignments in TGA impact the Strehl ratio (SR) value, too. The Strehl ratio is defined as the ratio of the aberrated and ideal image intensity of a point source [
26]. In the case of diffraction-limited beams, SR values reach closer to 1, while a lower SR value (<0.8) indicates poorer beam quality. To investigate the impact of misalignments in the TGA, Strehl ratio calculations were also performed using the Huygens point spread function tool in Zemax, both before and after introducing various misalignments, and the results are discussed in detail. Furthermore, the misalignments lead to focal spot degradation as a result of wavefront errors caused by the misaligned grating sections. The far-field intensity distributions are thoroughly analysed to investigate this issue.
Figure 2 shows a schematic representation of the various translational and rotational misalignments applied to the TGA, which consists of two gratings. To study the impact of lateral shifts (X-shifts represented in
Figure 2a, perpendicular to the grooves) in the two-grating model, one grating was displaced by a distance of
order while the other remained fixed. For a perfectly tiled assembly (without any shifts or twists), the SR values were observed to be 1, as expected.
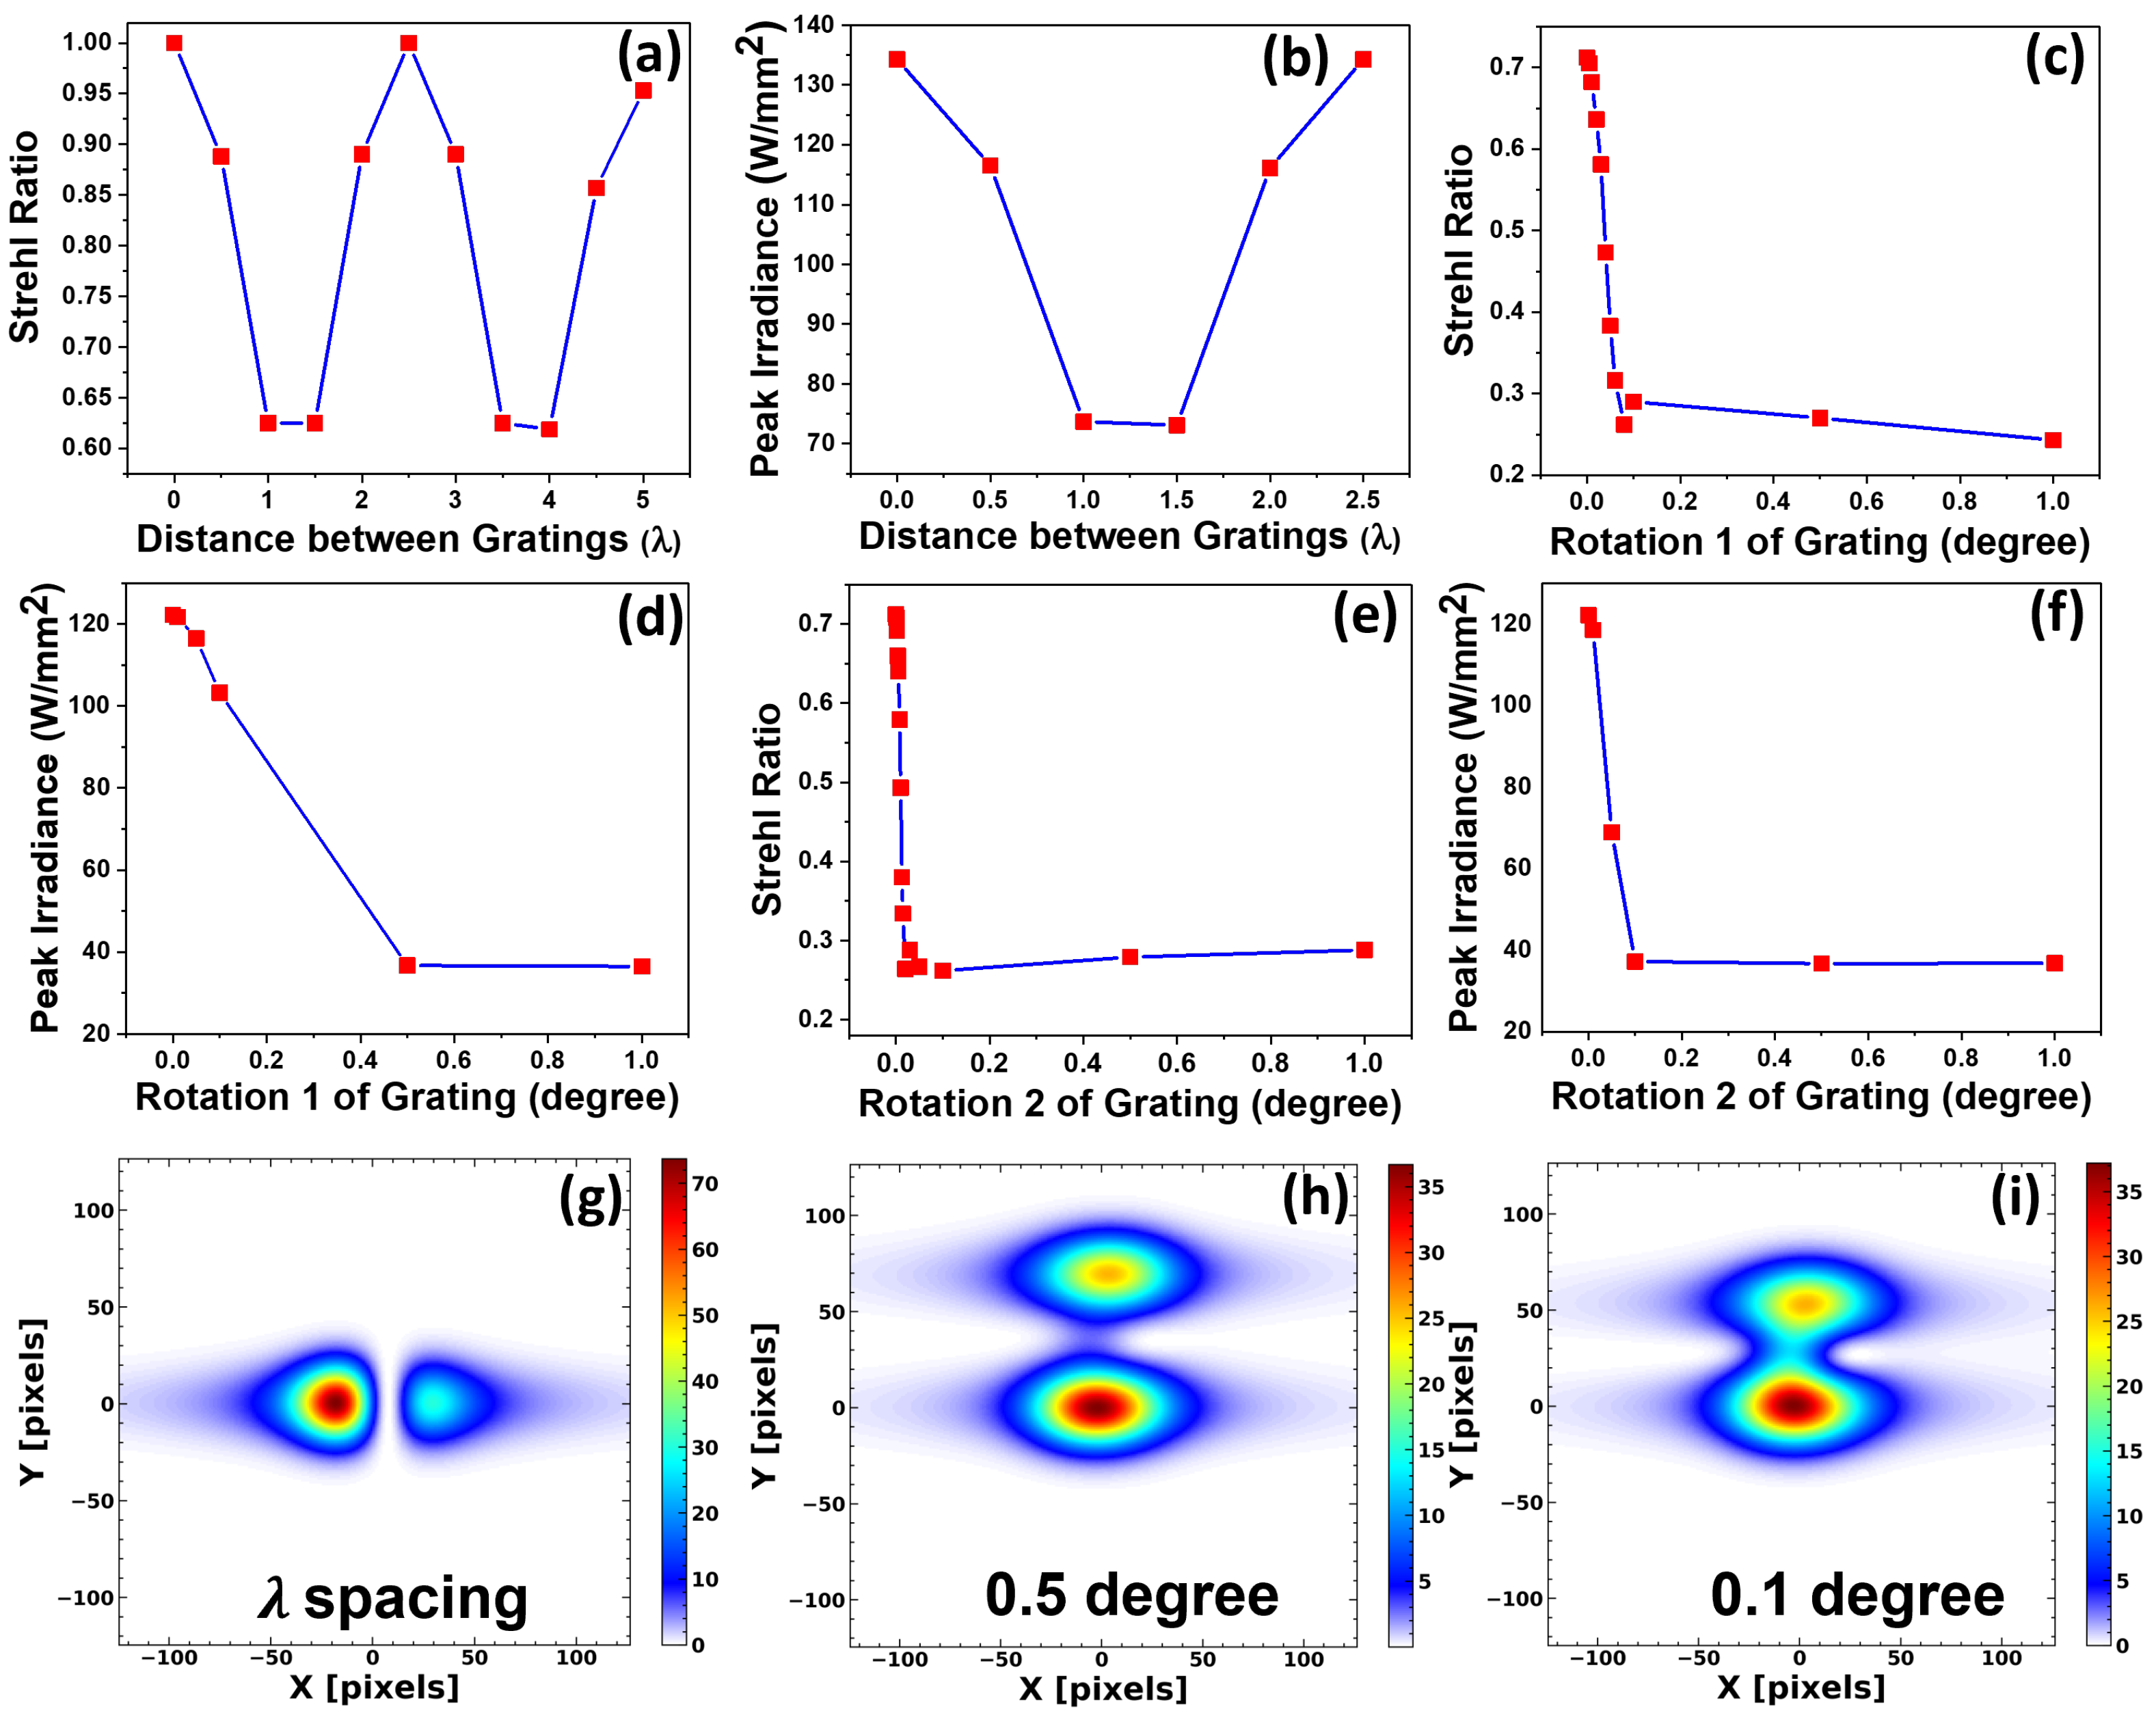
Figure 3a illustrates the variation in SR values with different X-shifts, ranging from
/2 to 10
/2 values. SR values decreased from 1 to 0.625 as the X-shift values increased up to 1.5
. The maximum SR values were observed when the X-shifts were multiples of the grating period, indicating a periodic variation in
Figure 3a. As illustrated in
Figure 3b, the peak irradiance values (measured using the POP analysis method) decreased to 45.58% with increasing X-shifts up to 1.5
and further increased to their initial value when the X-shift was a multiple of the grating period.
The maxima in SR value and irradiance occur when the lateral shift is an integer multiple of the grating period. The diffracted waves from adjacent grating periods align in phase when the X-shift is an integer multiple of the grating period. This kind of alignment introduces constructive interferences and optimal beam combinations, resulting in higher peak intensities and thus higher SR values, whereas the lower SR and irradiance values are observed when the X-shift causes an out-of-phase alignment, leading to destructive interference and degraded beam quality. The periodicity of these effects is governed by the grating period and the wavelength of the incident beam and is strongly influenced by the coherence and phase uniformity of the input wavefront. The periodic variation in Strehl ratio values observed with translational misalignment is consistent with trends reported in previous studies [
14,
27].
For studying the effect of longitudinal shifts (Y-shifts shown in
Figure 2b, parallel to the grooves), one of the two gratings is displaced vertically in increments from P/2 to 5P/2, where P represents the grating period. The SR values remained constant (SR value of 1) when one of the gratings was vertically displaced by a distance ranging from 0 to 5P/2. Additionally, the peak irradiance also showed negligible variations, indicating the system is much less sensitive to the longitudinal displacement within this range of Y-shifts compared to the X-shifts.
Rotational misalignments of individual tiles can significantly affect the performance of TGAs in high-power laser systems. So, rotational misalignments were also studied in the case of the two-grating model as represented through the schematics in
Figure 2c,d.
Figure 3c and
Figure 3e illustrate the significant effect of rotational misalignments on SR values for rotation types 1 and 2, respectively, while
Figure 3d and
Figure 3f depict the dependence of peak irradiance with such rotations. For both rotations, the SR values decreased suddenly with increasing rotational misalignments and eventually became saturated around a 0.25 SR value. The peak irradiance in the far field continuously decreased with increasing rotational errors, with the maximum intensity drop for rotation type 1 and rotation type 2 being 70.11% and 69.87%, respectively, within the studied range.
The irradiance distribution in the far field for an X-shift of
unit, a 0.5° rotation (rotation type 1) and a 0.1° rotation (rotation type 2) for the two-grating model is shown in
Figure 3g,
Figure 3h and
Figure 3i, respectively. These figures demonstrate the degradation of the focal spots due to different misalignments. Horizontal splitting of the focal spot and associated degradations are observed for the X-shift, while vertical splitting and degradations are noted for the rotational misalignments.
3.2. Four-Grating Model
To obtain a bigger picture of the effect of tile misalignment in a large, tiled grating structure, the original simple model with two gratings has been extended. The four-grating configuration introduces a greater number of degrees of freedom, resulting in increased alignment complexity and more realistic results. Conversely, the two-grating system simplifies the management of tiling errors. This section aims to validate the results obtained for the two-grating model by comparing them with those of its four-grating counterpart. Simulations and calculations were conducted with all the parameters held the same, except for the number of gratings, which varied from two to four.
Figure 4 shows the schematic representation of the ideal four-grating TGA and the selected translational and rotational misalignments introduced to the TGA.
3.2.1. Tiling Errors with Lateral Shifts in the Four-Grating Model
To analyse tiling tolerances through lateral shifts (X-shift in
Figure 4b) in the position of gratings in a TGA, a single grating is laterally displaced in the order of
(ranging from
/2 to 5
/2). Meanwhile, the other three gratings remain fixed in the four-grating assembly.
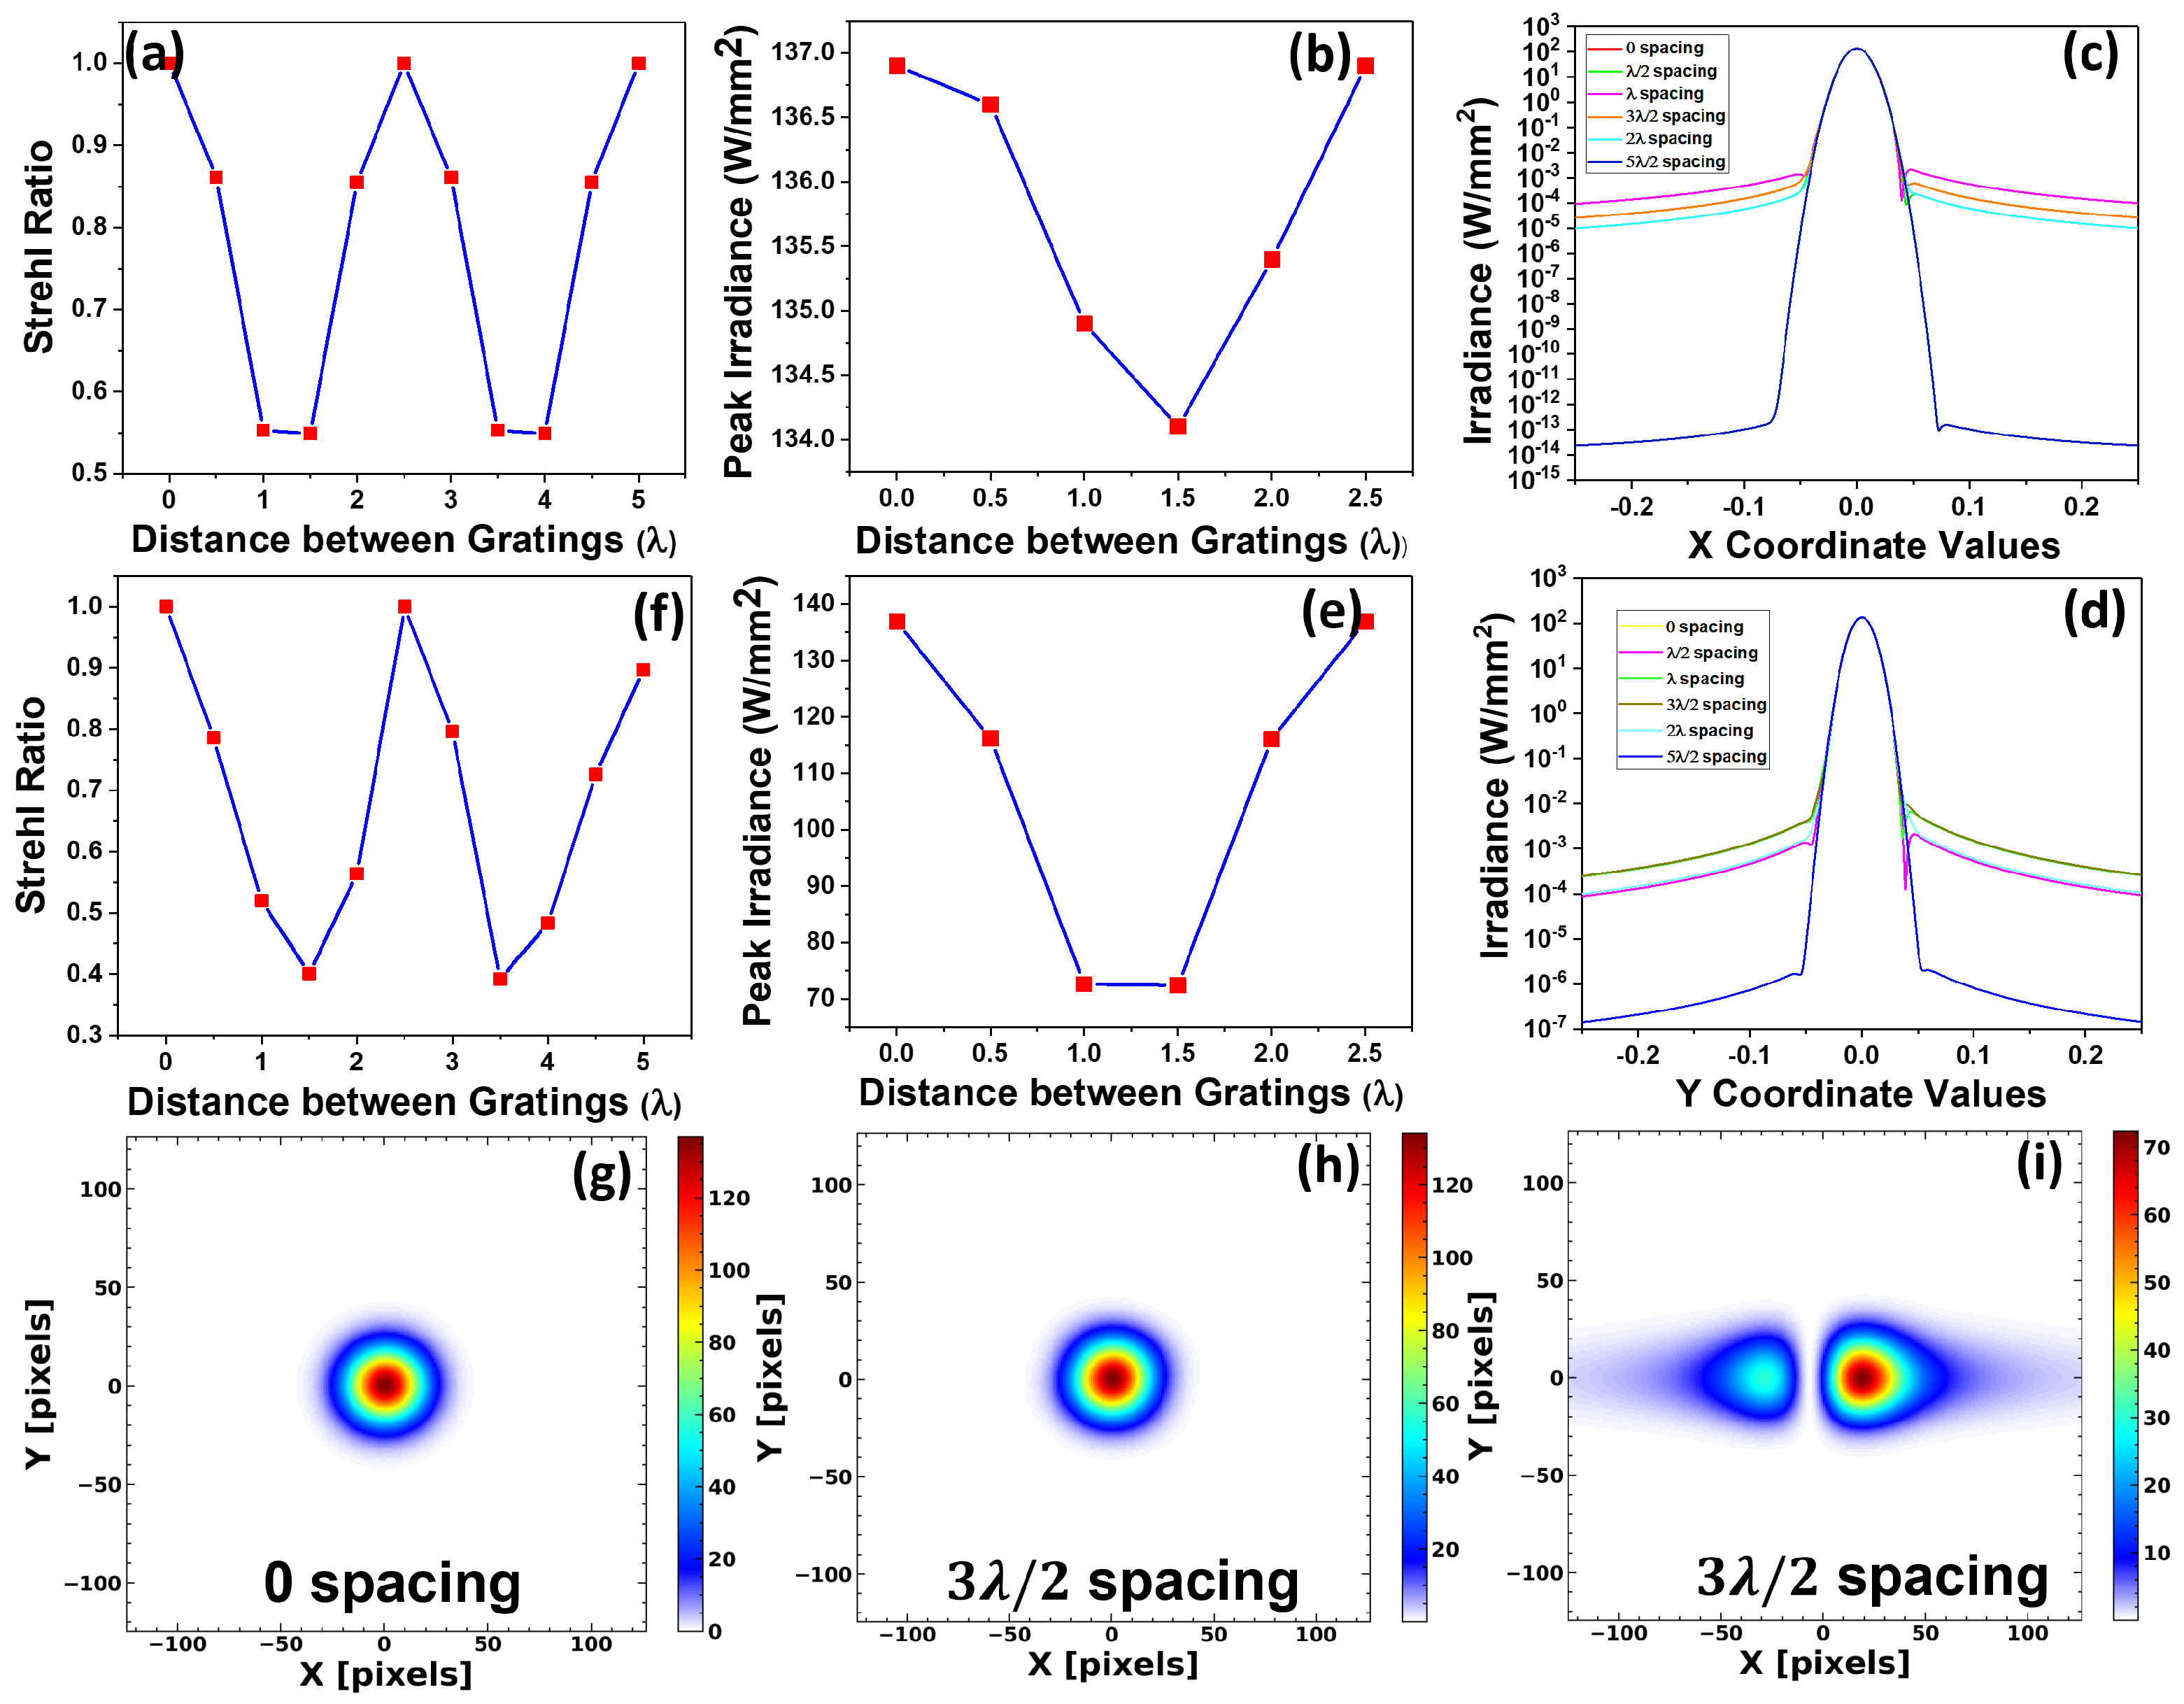
Figure 5a illustrates the impact of SR values with varying X-shift values, ranging from
/2 to 10
/2. For a perfectly tiled assembly (without any shifts or twists, represented through
Figure 4a), the SR value was observed to be 1. The results shown in
Figure 5a indicate that the X-shift tiling error is highly sensitive, showing a periodic variation in Strehl ratio values with different X-shift values, similar to our observations in the two-grating model. SR values decreased from 1 to 0.549 as the X-shift increased from 0 to 1.5
, marking the lowest value within the measurement range. Similarly, the peak intensity values decreased as the X-shift increased to 1.5
. However, these values rise again when the X-shift further increases, and maximum values were observed at multiples of the grating period, as shown in
Figure 5b. The irradiance distribution along X and Y coordinates is depicted in
Figure 5c,d, showing a similar trend in peak intensity with X-shift between gratings.
Based on the analysis presented in
Figure 5a–d, we have examined the X-shift of an individual grating within the TGA. However, it is also crucial to investigate the misalignments involving multiple gratings within the TGA, as it models a manufacturing process much more realistically. For that, we have selected two diagonally opposite gratings and displaced them laterally at equal distances but in opposite directions, as illustrated in the schematic representation in
Figure 4c. This approach facilitates a more comprehensive understanding of the impact of misalignments on multiple gratings in TGA, as well as the directional effects.
Figure 5f illustrates the impact of these displacements on the SR value with varying X-shifts from
/2 to 10
/2 for diagonally opposite gratings. Similar to the single-grating movement case shown in
Figure 5a, the SR value exhibits periodic variations with increasing X-shift values, reaching maxima at multiples of the grating period. Additionally, our results validate that the direction of the X-shift does not significantly affect the SR values. From
Figure 5e, SR values decrease from 1 to 0.401 as the X-shift increases from 0 to 1.5
, which is even lower than the single-grating X-shift depicted in
Figure 5a.
Figure 5e shows that the peak intensity values in the far field decrease up to a 1.5
shift and then increase, with the maxima occurring at multiples of the grating period.
Figure 5g–i show the far-field irradiance distribution under three conditions: 0 spacing (no shift), a 3
/2 X-shift for a single grating and a 3
/2 X-shift for two diagonally opposite gratings. For the single grating with 3
/2 X-shift, the far-field irradiance distribution resembles that of TGA without any shifts, but the peak intensity decreases by 2.05%. However, when an X-shift is applied to the diagonally opposite gratings, a horizontal deviation and two focal spots emerge in the far field (similar to the two-grating model), accompanied by a significant summarised intensity drop of up to 47.12%. This further validates the high sensitivity of lateral shifts. Although a single-grating shift induces minor phase changes, shifts in multiple gratings create complex interferences, resulting in deviations, degradations and intensity drops in the far field.
3.2.2. Tiling Errors with Longitudinal Shifts
To examine the impact of tiling tolerances through longitudinal shifts in the position of gratings (Y-shift in
Figure 4d) in TGA, a single grating was vertically displaced in the range of P/2 to 5P/2.
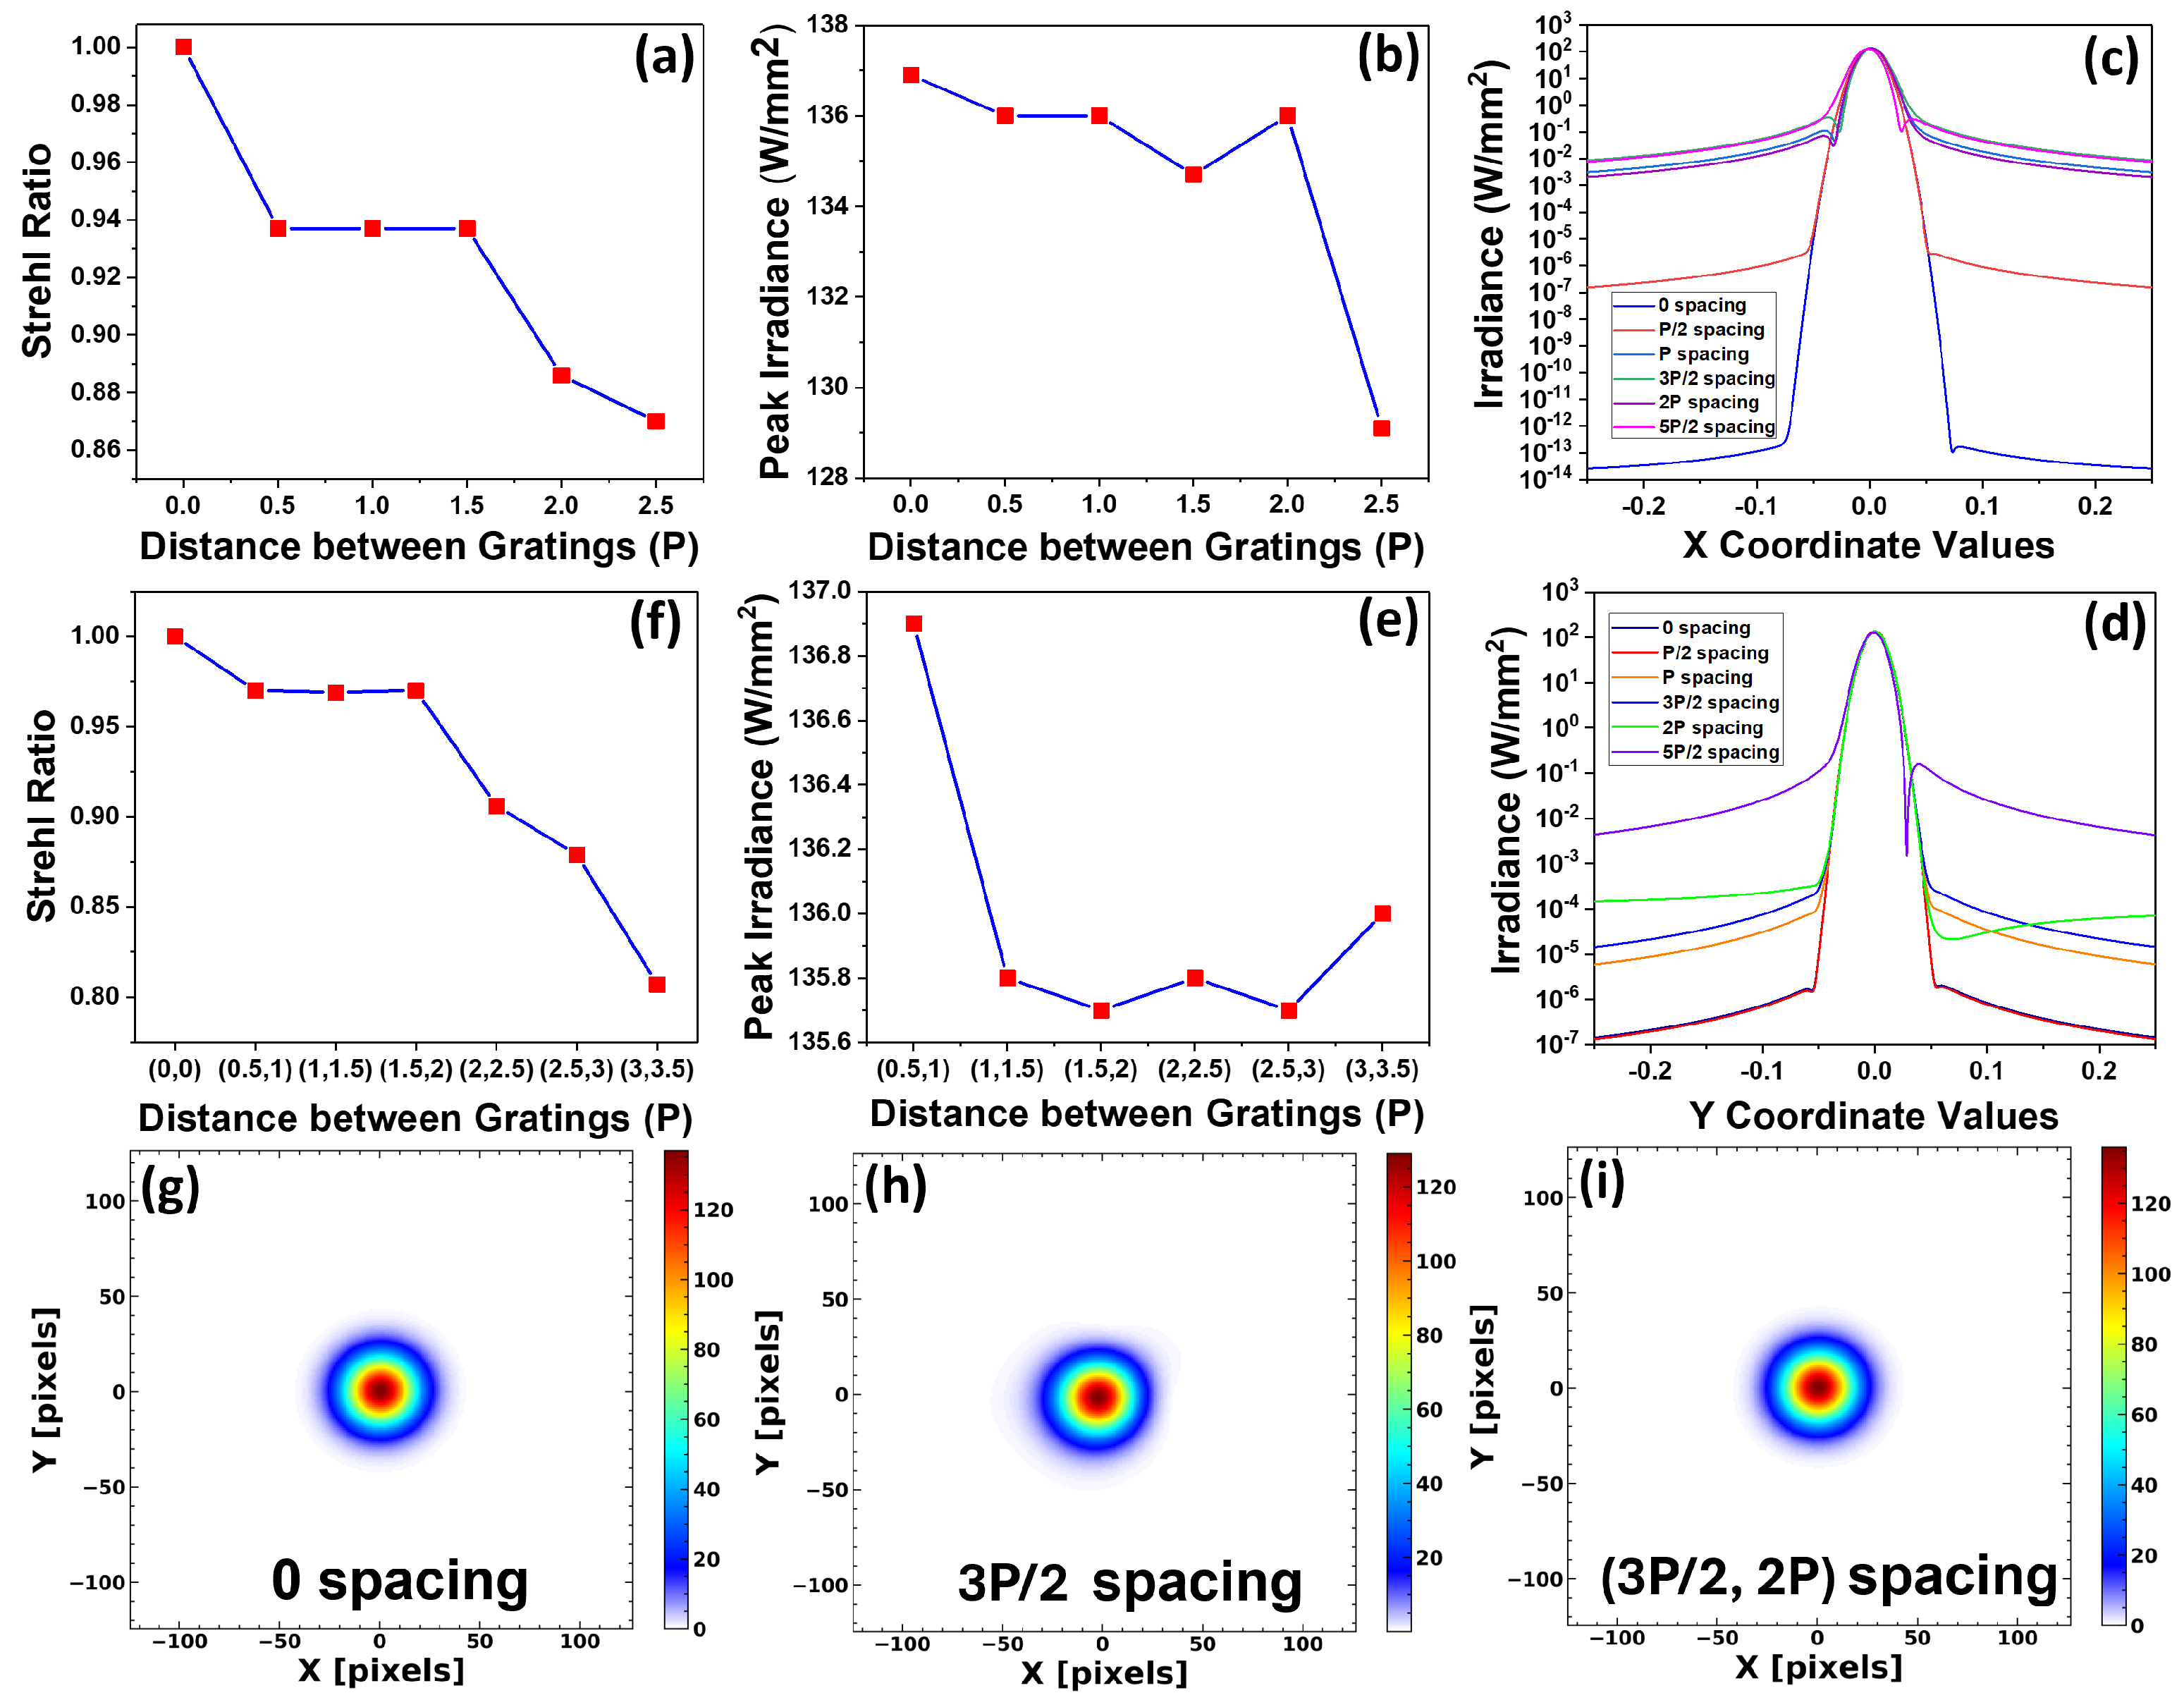
Figure 6a shows the variation in SR values with different Y-shift values. As the Y-shift increased, the SR values gradually decreased from 1 to a minimum of 0.87 in the measured range. Even with a vertical shift of 5P/2, the SR values were only reduced up to 0.87. This suggests that longitudinal shifts have a weak effect on creating tiling errors. Furthermore, the peak intensity values in the far field gradually reduced with increasing Y shift, as shown in
Figure 6b. The maximum intensity drop observed in the measured range was only 5.7%.
Figure 6c,d display the distribution of intensity along X and Y coordinates, showing a similar trend.
To study the effect of longitudinal misalignments caused by multiple gratings, two gratings in the TGA were subjected to different Y-shifts (Y, Y+P/2), as depicted in
Figure 4e. The decrease in peak intensity within the measured range was negligible, with a percentage drop of less than 1% shown in
Figure 6e. The variation in SR values with Y and Y+P/2 shift is illustrated in
Figure 6f. Similar to the Y-shift of a single grating, the SR values decreased gradually. The minimum SR value observed within the measurement range is 0.807. Far-field irradiance distributions were also recorded at 0 spacing (no Y-shift), 3P/2 Y-shift and (3P/2,2P) Y-shift, as shown in
Figure 5g–i, representing negligible variations. At higher Y-shifts, distortions were observed in the wavefront maps, indicating the presence of longitudinal shifts. However, overall, longitudinal shifts do not significantly alter the phase relationship in the TGA, allowing for a consistent phase of diffracted light, which ensures constructive interference.
3.2.3. Tiling Errors with Rotational Shifts
To determine the tiling tolerances due to rotational shifts, a single grating in the four-grating assembly is rotated at angles ranging from 0 to 1°. Both rotation type 1 and rotation type 2 (illustrated in
Figure 4f,g) are introduced, similar to the two-grating TGA configuration. The resulting changes in SR values for different rotation type 1 angles are depicted in
Figure 7a.
Table S1 in the Supplementary Materials presents the rotation angles alongside their corresponding SR values.
Figure 7a and
Table S1 illustrate that the SR values exhibit extremely high sensitivity to rotational misalignments. It is observed that the SR values consistently decrease with increasing rotational angles of rotation type 1 up to 0.08°, after which they become saturated at higher angles. The table further emphasises the high-sensitivity measurement of the simulation software Zemax, demonstrating significant SR value variations even with smaller rotational shifts.
The far-field peak intensity distributions with varying angles of rotation type 1 are shown in
Figure 7b. By increasing the angles of rotation type 1, the peak intensity values diminish, with the maximum intensity reduction being approximately 37.7% at a rotation angle of 0.05°. The effect of rotation type 2 (0.001° to 1°, shown in
Figure 4g), for a single grating in the TGA on the SR values is illustrated in
Figure 7c and
Table S1. The rotations were systematically introduced as shown in
Table S1, and the SR values gradually decreased with increasing rotation angles up to 0.05°, after which they became saturated.
Comparing the SR values of rotation type 1 and type 2, for rotation type 1 at 0.01°, the SR value decreased from 0.944 to 0.921, whereas for rotation type 2 at 0.01°, it drastically decreased to 0.752. This indicates a higher sensitivity of rotation type 2 over rotation type 1 in TGA.
Figure 7d illustrates the relationship between peak irradiance and rotation type 2. The plot resembles that of rotation type 1, with a maximum intensity drop of 40.6% occurring at a rotation angle of 0.05°. To study the impact of rotational misalignments caused by multiple gratings in the TGA, rotation type 1 (shown in
Figure 4h) was introduced for two diagonally opposite gratings, also rotating in opposite directions at varying angles from 0.001 to 1°. The SR values consistently decreased and eventually saturated, similar to the behaviour observed with a single grating rotation. Additionally, peak irradiance values reduced with increasing rotations, showing a significant 75.56% drop at an angle of 0.05°.
Figure 7g–i show the far-field irradiance with an angle of 0.05° with rotation type 1 and rotation type 2 for a single grating and rotation type 1 for two diagonally opposite gratings in the TGA. The figures demonstrate that the degradation of the far-field focal spot varies with the grating’s rotation.
Figure 7g,h show two different far-field irradiance patterns for the same angle of rotation (0.05°). This difference allows for identifying and differentiating the tiling errors involved. When rotation type 1 is applied to two diagonally opposite gratings, vertical splitting of the focal spots is observed in the image plane, similar to the two-grating model. These results highlight that rotational misalignments are the most sensitive tiling errors, and Zemax OpticStudio is a powerful tool for calculating and differentiating various rotational misalignments in a TGA.
3.2.4. Comparison Between the Two- and Four-Grating Models
As a comparative summary, both the two- and four-grating models exhibited maximum SR values when lateral misalignments corresponded to integer multiples of the grating period, consistent with constructive interference between diffracted wavefronts. A lateral shift of between gratings reduced the SR to 0.62 and introduced horizontal splitting in the focal spot, indicating performance degradation below acceptable limits for the two-grating model, whereas in the case of the four-grating model, the lateral displacement of the single grating by reduced the SR value to 0.55, though no visible focal spot splitting occurred. However, when two diagonally opposite gratings were shifted by , the SR dropped to 0.52, and horizontal splitting with significant focal spot degradation was observed. The longitudinal shifts show relatively low sensitivity in both models. For rotational misalignments, both models exhibited high sensitivity. In the two-grating configuration, SR values began to decline significantly beyond a 0.04° rotation type 1, with complete focal spot degradation and vertical splitting occurring from 0.5°. For rotation type 2, SR degradation was evident even from 0.01, with visible splitting from 0.1°.
For rotational misalignments in the four-grating model, SR values dropped significantly from 0.04° (rotation type 1) and 0.01° (rotation type 2). While single-grating rotations did not produce visible splitting, simultaneous rotation of two gratings led to focal spot degradation and vertical splitting from 0.05°. The horizontal and vertical splitting observed in the far-field patterns due to translational and rotational misalignments, respectively, are consistent with existing literature, further validating the simulation results [
23]. Moreover, the observations and inferences are consistent in both models. This further validates the observations and calculations performed in Zemax.
The simulation results presented in this study provide a foundation for defining practical alignment strategies and tolerances in the assembly of tiled grating systems. These findings are particularly relevant for overcoming the size limitations of a single diffraction grating while maintaining the optical performance in large-scale, high-power applications. The periodic dependence of SR values and peak irradiance on lateral shifts indicates that ideally aligning grating tiles at integer multiples of the grating period maximises constructive interference. The relatively low sensitivity to longitudinal displacements indicates that this degree of freedom may tolerate a relaxed alignment. But the high sensitivity to rotational misalignments highlights the need for stringent angular alignment tolerances. These findings suggest that rotational alignment should be prioritised during assembly and actively monitored during operation. Moreover, the distinct far-field degradation associated with different misalignment types may serve as a diagnostic tool for identifying and correcting alignment errors and thereby enhancing system robustness and performance. While incorporating TGA into real systems, efforts should be made in the mechanical design specifications to reduce the displacements of individual tiles. Real-time alignment monitoring of the far-field pattern is also essential.


