Article

Modelling of Tiled Grating Arrangement Efficiency

by
Haritha Vijayakumar Sheela
1,*,
Gabor Horváth
1 and
Miklós Füle
1,2,*
1
ELI-ALPS, ELI-HU Non-Profit Ltd., Wolfgang Sandner u. 3, 6728 Szeged, Hungary
2
Department of Experimental Physics, University of Szeged, 6720 Szeged, Hungary
*
Authors to whom correspondence should be addressed.
Photonics 2025, 12(8), 818; https://doi.org/10.3390/photonics12080818
Submission received: 12 July 2025 / Revised: 30 July 2025 / Accepted: 13 August 2025 / Published: 15 August 2025

Abstract

The precise alignment of individual diffraction grating units within a tiled grating assembly (TGA) is essential for enhancing the quality of optical throughput and overall functional performance of such kinds of optical systems. This study presents a comprehensive simulation analysis of TGAs comprising two and four gratings to assess the sensitivity of optical imaging performance to a range of induced alignment errors. The misalignments are systematically introduced to the grating sections in the tiled grating assemblies, and their effects in far-field imaging are examined and compared. The results highlight the critical role of accurate alignment in maintaining coherent beam combination and optimal system performance. Zemax OpticStudio®-based simulations offer valuable insights for designing high-performance, large-aperture grating systems and pave the way for future experimental validation and integration.

1. Introduction

Large laser systems that deliver ultrashort pulses with peak powers exceeding one petawatt (PW) have been developed worldwide. These systems have a significantly advanced research focus on high-energy-density (HED) science, nonlinear physics and high-field physics [1,2]. Chirped pulse amplification (CPA) is a predominant technique in high-power laser systems for amplifying picosecond and femtosecond pulses to high energies by avoiding the damage threshold limitations of optics in direct amplification through pulse stretching and compression [3,4].
Diffraction gratings are the most commonly used optical elements for stretching and compressing pulses [5,6]. The use of CPA has increased the demand for meter-sized gratings to temporally compress kJ-level energetic chirped laser pulses and enhance the output capability of laser systems [7,8]. Gratings with meter-scale dimensions are available on the market, but producing large-aperture optics with current technology is challenging [9]. Consequently, meter-sized monolithic gratings are costly and not readily accessible.
The coherent grating tiling approach, which involves assembling multiple small aperture gratings, offers a cost-effective solution for creating large optical diffractive surfaces of the required dimensions [10,11,12,13,14,15,16]. In a tiled grating arrangement, the maintenance of the relative alignment of the sub-aperture grating within acceptable limits is essential [17,18]. Therefore, the inherent challenge of TGA lies in precisely aligning the individual grating sections and maintaining their alignment despite the environmental influence.
Many experimental reports have demonstrated the characteristic challenges and solutions for aligning TGA systems in high-power laser applications. Qiao et al. [13] have developed two 1.5 m large aperture tiled grating compressors for the OMEGA EP for high-energy PW-class laser systems. Both compressors achieved sub-picosecond pulse durations without tiling-induced temporal degradation, and their work highlighted the relevance of sub-micron tiling accuracy. Moreover, interferometric techniques and ray tracing models were also employed to demonstrate the need for precise alignment and optimisation in TGAs [14,19].
For tiling error measurement, several techniques are available, but they are often challenging to implement under vacuum conditions. Among the potential strategies available, monitoring the far-field distributions of the laser beam diffracted by a TGA has proven to be an effective method for calculating tiling errors [20,21,22,23]. In the present study, we adopted a ray-tracing simulation analysis method using Zemax OpticStudio® (version-16.5) software to evaluate and calculate the sensitivities of optical imaging for different translational and rotational misalignment errors in TGA. The wavefront and far-field intensity distributions were studied after introducing various translational and rotational misalignments for the tiled section of the gratings, and tolerance levels and sensitivities were derived. This study also demonstrates the effectiveness of Zemax-based simulations in analysing and evaluating the sensitivities of different misalignments in TGA, providing useful insights into their practical applications and configurations.

2. Modelling Arrangement

The main objective of this modelling study is to investigate the sensitivity of TGAs to various alignment errors, with a focus on quantifying their impact on the beam quality parameters. Two TGA model configurations consisting of two- and four-grating arrangements are selected as representatives of a practical design of TGAs in optical systems. The various possible tiling errors, including translational (lateral and longitudinal) and rotational misalignments, were selected based on their dominant influence on phase and the beam quality in real-world systems. Through the systematic introduction of different alignment errors and by varying each misalignment type, alignment tolerances and degradation mechanisms can be estimated. Further, this can be generalised and incorporated into larger TGA configurations’ practical design and alignment strategies.
Zemax OpticStudio® was selected as the modelling platform for this study due to its capability to perform physical optics propagation simulations. Zemax supports two distinct approaches for ray tracing: sequential and non-sequential. In sequential ray tracing, rays follow a predetermined path through a defined sequence of surfaces, interacting with each surface as the rays travel from the object to the image plane. Using this method, the physical optics properties can be calculated perfectly. Non-sequential ray tracing mode enables rays to travel through optical components in any order, allowing for scattering, splitting and reflecting to the object, nevertheless without the possibility for the physical optics calculation. An optical design that incorporates both sequential and non-sequential methods is known as a hybrid or mixed-mode analysis. This combination has the advantage of a standalone method; a large-scale beam path can be modelled taking scattering, splitting and reflection into account, but physical optical calculation is possible in the case of the critical region. This is the reason why a mixed-mode approach is employed to develop the desired design in this study.
According to the two different approaches, two primary analysis modes in Zemax are physical optics propagation (POP) and geometrical ray tracing [24]. POP models the behaviour of light as it travels through different optical components within a system, simulating interactions with elements like lenses, mirrors, gratings and prisms, considering its wave-like nature. In the case of geometric optics, the software analyses light paths through reflection and refraction, emphasising image formation, location and magnification while neglecting the wave behaviour of light. Unlike geometric optics, POP accounts for wavefront distortions too, providing deeper insights into aberrations and their impact on image quality [25]. Instead of geometrical ray tracing, the POP algorithm is selected in this work, as the former is only applicable when diffraction limits can be ignored. The key analysis tools used to assess the performance of our optical arrangement include the (i) wavefront map, to quantify the wavefront aberrations, (ii) the Huygens point spread function, to estimate the Strehl ratio values, and (iii) irradiance, to measure intensity distributions in the far field and along X and Y directions.
The current simulation design features two/four pieces of identical rectangular diffraction gratings with a grating period of 2.5 µm (400 lines/mm), and a laser beam with a wavelength of 1 µm is incident on the TGA. The system utilises a Gaussian beam that enters through an entrance pupil with a diameter of 3.6 mm, ensuring controlled beam size and apodisation. The beam is directed onto the TGAs at an angle of incidence of 35°. A lens with a focal length of 10 mm is incorporated to focus the first-order diffracted output beams from the TGA into the image plane. The focal spots in the image plane are analysed with various analysis tools mentioned above. Figure 1 illustrates the designed shaded model created using Zemax OpticStudio software. To assess the arrangement efficiency and to estimate the tolerance levels and sensitivity, various translational and rotational misalignments were systematically applied to the system. The present study investigates and compares two TGA models: one consisting of two gratings and the other with four gratings. The inset of Figure 1 shows the TGA configuration consisting of four gratings. Figure S1 in the Supplementary Materials shows the Zemax model with two gratings.

3. Results and Discussion

3.1. Two-Grating Model

The imperfect fit of independent individual grating units in TGA causes intensity and phase deterioration. This fit mismatch can be either translations (shifts) or rotations (twists) in nature. The changes observed in the far field and the degradation caused by the tiling errors are discussed in detail in the following.
Theoretical simulations and experimental results demonstrate that the misalignments in TGA impact the Strehl ratio (SR) value, too. The Strehl ratio is defined as the ratio of the aberrated and ideal image intensity of a point source [26]. In the case of diffraction-limited beams, SR values reach closer to 1, while a lower SR value (<0.8) indicates poorer beam quality. To investigate the impact of misalignments in the TGA, Strehl ratio calculations were also performed using the Huygens point spread function tool in Zemax, both before and after introducing various misalignments, and the results are discussed in detail. Furthermore, the misalignments lead to focal spot degradation as a result of wavefront errors caused by the misaligned grating sections. The far-field intensity distributions are thoroughly analysed to investigate this issue.
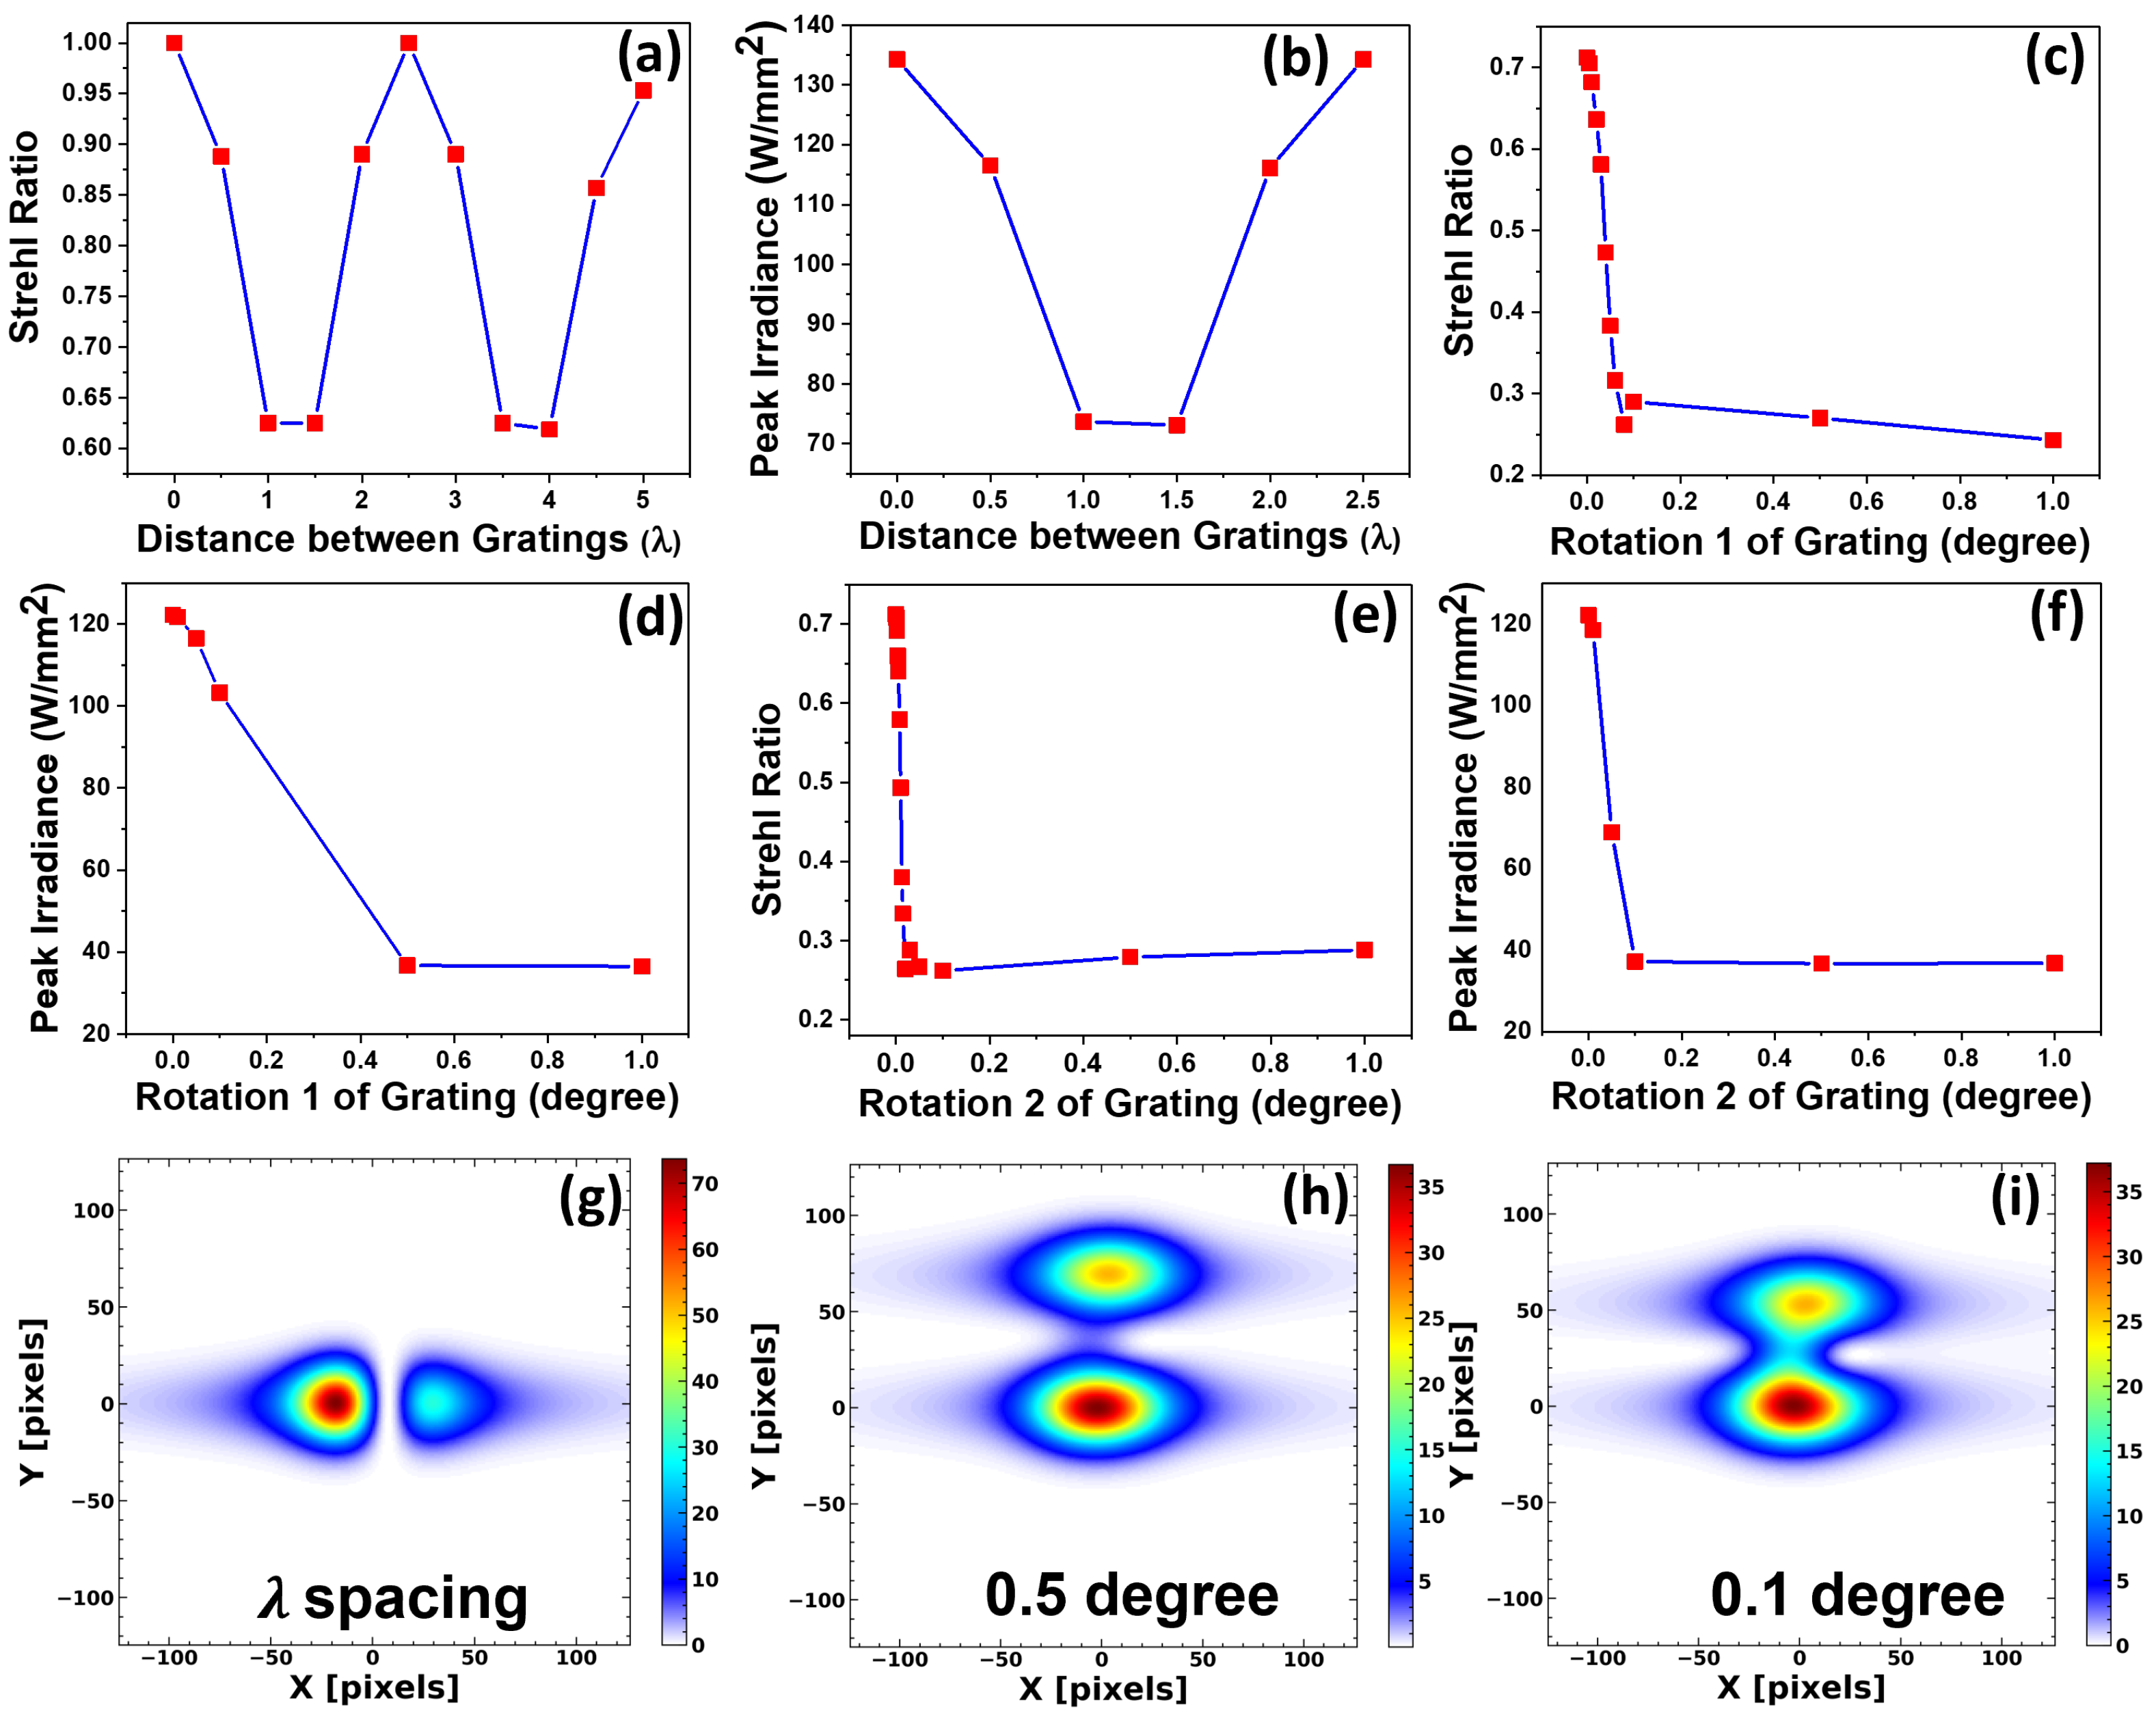
Figure 2 shows a schematic representation of the various translational and rotational misalignments applied to the TGA, which consists of two gratings. To study the impact of lateral shifts (X-shifts represented in Figure 2a, perpendicular to the grooves) in the two-grating model, one grating was displaced by a distance of λ order while the other remained fixed. For a perfectly tiled assembly (without any shifts or twists), the SR values were observed to be 1, as expected. Figure 3a illustrates the variation in SR values with different X-shifts, ranging from λ /2 to 10 λ /2 values. SR values decreased from 1 to 0.625 as the X-shift values increased up to 1.5 λ . The maximum SR values were observed when the X-shifts were multiples of the grating period, indicating a periodic variation in Figure 3a. As illustrated in Figure 3b, the peak irradiance values (measured using the POP analysis method) decreased to 45.58% with increasing X-shifts up to 1.5 λ and further increased to their initial value when the X-shift was a multiple of the grating period.
The maxima in SR value and irradiance occur when the lateral shift is an integer multiple of the grating period. The diffracted waves from adjacent grating periods align in phase when the X-shift is an integer multiple of the grating period. This kind of alignment introduces constructive interferences and optimal beam combinations, resulting in higher peak intensities and thus higher SR values, whereas the lower SR and irradiance values are observed when the X-shift causes an out-of-phase alignment, leading to destructive interference and degraded beam quality. The periodicity of these effects is governed by the grating period and the wavelength of the incident beam and is strongly influenced by the coherence and phase uniformity of the input wavefront. The periodic variation in Strehl ratio values observed with translational misalignment is consistent with trends reported in previous studies [14,27].
For studying the effect of longitudinal shifts (Y-shifts shown in Figure 2b, parallel to the grooves), one of the two gratings is displaced vertically in increments from P/2 to 5P/2, where P represents the grating period. The SR values remained constant (SR value of 1) when one of the gratings was vertically displaced by a distance ranging from 0 to 5P/2. Additionally, the peak irradiance also showed negligible variations, indicating the system is much less sensitive to the longitudinal displacement within this range of Y-shifts compared to the X-shifts.
Rotational misalignments of individual tiles can significantly affect the performance of TGAs in high-power laser systems. So, rotational misalignments were also studied in the case of the two-grating model as represented through the schematics in Figure 2c,d. Figure 3c and Figure 3e illustrate the significant effect of rotational misalignments on SR values for rotation types 1 and 2, respectively, while Figure 3d and Figure 3f depict the dependence of peak irradiance with such rotations. For both rotations, the SR values decreased suddenly with increasing rotational misalignments and eventually became saturated around a 0.25 SR value. The peak irradiance in the far field continuously decreased with increasing rotational errors, with the maximum intensity drop for rotation type 1 and rotation type 2 being 70.11% and 69.87%, respectively, within the studied range.
The irradiance distribution in the far field for an X-shift of λ unit, a 0.5° rotation (rotation type 1) and a 0.1° rotation (rotation type 2) for the two-grating model is shown in Figure 3g, Figure 3h and Figure 3i, respectively. These figures demonstrate the degradation of the focal spots due to different misalignments. Horizontal splitting of the focal spot and associated degradations are observed for the X-shift, while vertical splitting and degradations are noted for the rotational misalignments.

3.2. Four-Grating Model

To obtain a bigger picture of the effect of tile misalignment in a large, tiled grating structure, the original simple model with two gratings has been extended. The four-grating configuration introduces a greater number of degrees of freedom, resulting in increased alignment complexity and more realistic results. Conversely, the two-grating system simplifies the management of tiling errors. This section aims to validate the results obtained for the two-grating model by comparing them with those of its four-grating counterpart. Simulations and calculations were conducted with all the parameters held the same, except for the number of gratings, which varied from two to four. Figure 4 shows the schematic representation of the ideal four-grating TGA and the selected translational and rotational misalignments introduced to the TGA.

3.2.1. Tiling Errors with Lateral Shifts in the Four-Grating Model

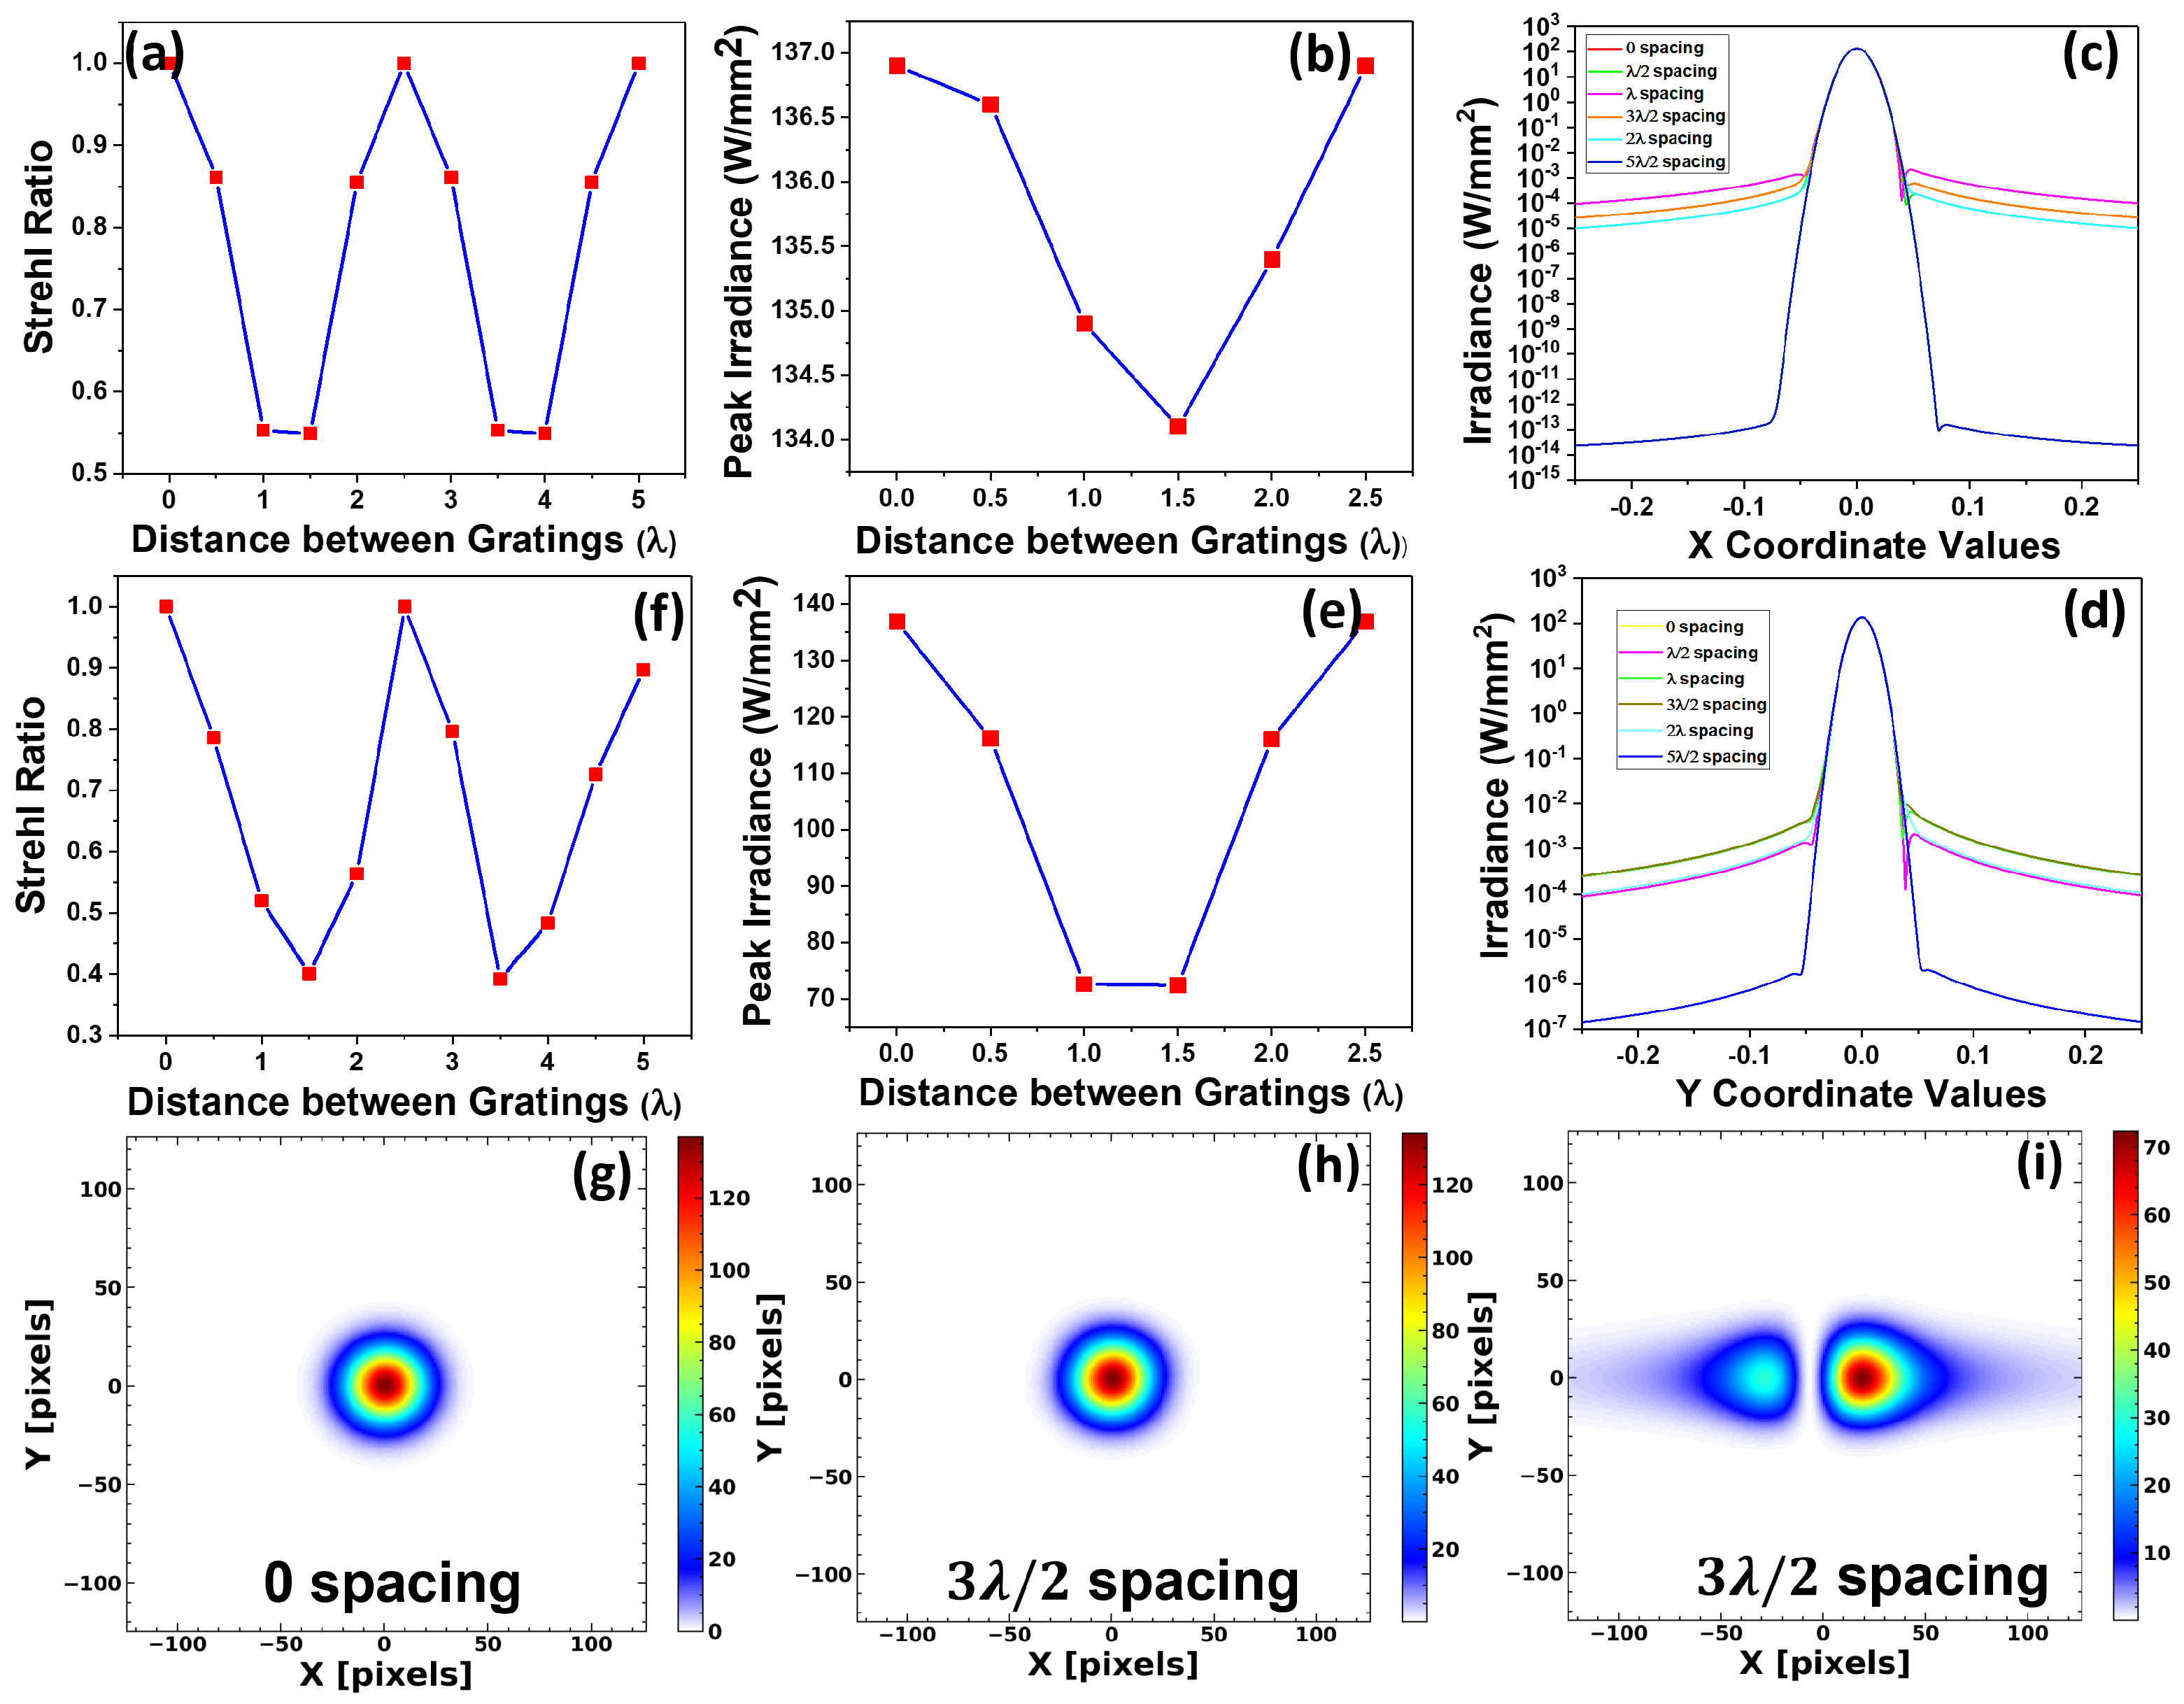
To analyse tiling tolerances through lateral shifts (X-shift in Figure 4b) in the position of gratings in a TGA, a single grating is laterally displaced in the order of λ (ranging from λ /2 to 5 λ /2). Meanwhile, the other three gratings remain fixed in the four-grating assembly. Figure 5a illustrates the impact of SR values with varying X-shift values, ranging from λ /2 to 10 λ /2. For a perfectly tiled assembly (without any shifts or twists, represented through Figure 4a), the SR value was observed to be 1. The results shown in Figure 5a indicate that the X-shift tiling error is highly sensitive, showing a periodic variation in Strehl ratio values with different X-shift values, similar to our observations in the two-grating model. SR values decreased from 1 to 0.549 as the X-shift increased from 0 to 1.5 λ , marking the lowest value within the measurement range. Similarly, the peak intensity values decreased as the X-shift increased to 1.5 λ . However, these values rise again when the X-shift further increases, and maximum values were observed at multiples of the grating period, as shown in Figure 5b. The irradiance distribution along X and Y coordinates is depicted in Figure 5c,d, showing a similar trend in peak intensity with X-shift between gratings.
Based on the analysis presented in Figure 5a–d, we have examined the X-shift of an individual grating within the TGA. However, it is also crucial to investigate the misalignments involving multiple gratings within the TGA, as it models a manufacturing process much more realistically. For that, we have selected two diagonally opposite gratings and displaced them laterally at equal distances but in opposite directions, as illustrated in the schematic representation in Figure 4c. This approach facilitates a more comprehensive understanding of the impact of misalignments on multiple gratings in TGA, as well as the directional effects. Figure 5f illustrates the impact of these displacements on the SR value with varying X-shifts from λ /2 to 10 λ /2 for diagonally opposite gratings. Similar to the single-grating movement case shown in Figure 5a, the SR value exhibits periodic variations with increasing X-shift values, reaching maxima at multiples of the grating period. Additionally, our results validate that the direction of the X-shift does not significantly affect the SR values. From Figure 5e, SR values decrease from 1 to 0.401 as the X-shift increases from 0 to 1.5 λ , which is even lower than the single-grating X-shift depicted in Figure 5a. Figure 5e shows that the peak intensity values in the far field decrease up to a 1.5 λ shift and then increase, with the maxima occurring at multiples of the grating period.
Figure 5g–i show the far-field irradiance distribution under three conditions: 0 spacing (no shift), a 3 λ /2 X-shift for a single grating and a 3 λ /2 X-shift for two diagonally opposite gratings. For the single grating with 3 λ /2 X-shift, the far-field irradiance distribution resembles that of TGA without any shifts, but the peak intensity decreases by 2.05%. However, when an X-shift is applied to the diagonally opposite gratings, a horizontal deviation and two focal spots emerge in the far field (similar to the two-grating model), accompanied by a significant summarised intensity drop of up to 47.12%. This further validates the high sensitivity of lateral shifts. Although a single-grating shift induces minor phase changes, shifts in multiple gratings create complex interferences, resulting in deviations, degradations and intensity drops in the far field.

3.2.2. Tiling Errors with Longitudinal Shifts

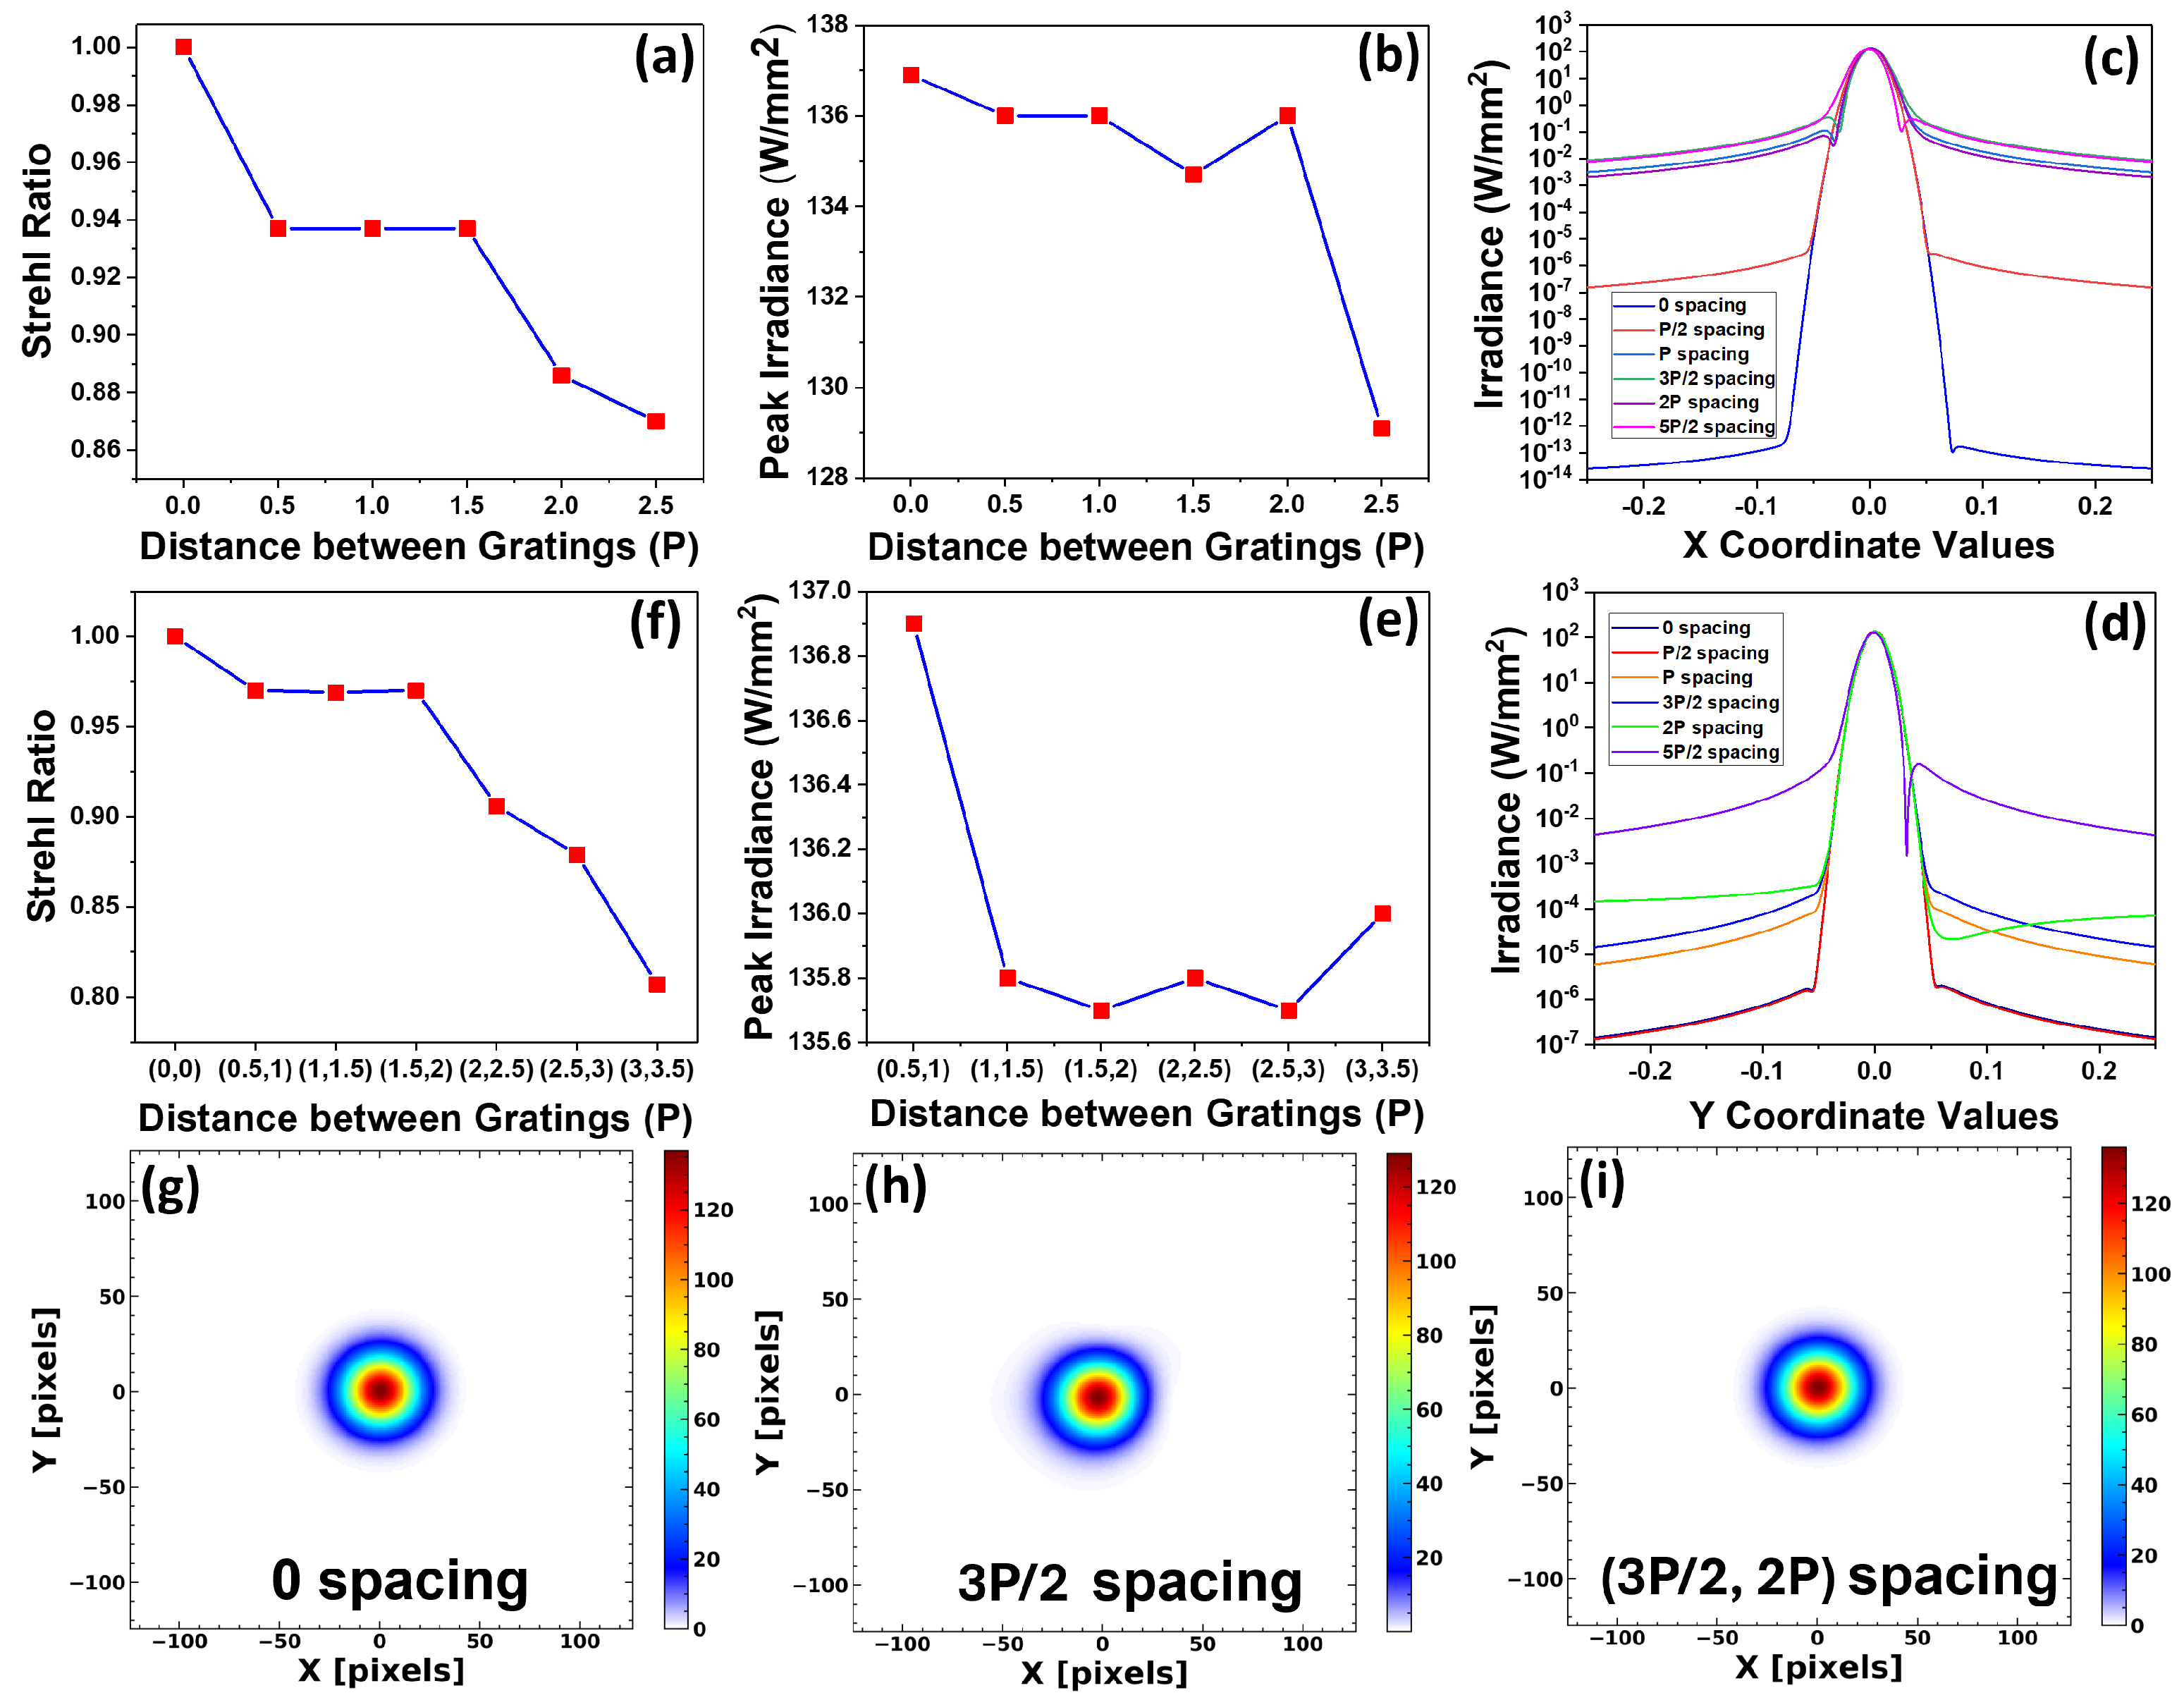
To examine the impact of tiling tolerances through longitudinal shifts in the position of gratings (Y-shift in Figure 4d) in TGA, a single grating was vertically displaced in the range of P/2 to 5P/2. Figure 6a shows the variation in SR values with different Y-shift values. As the Y-shift increased, the SR values gradually decreased from 1 to a minimum of 0.87 in the measured range. Even with a vertical shift of 5P/2, the SR values were only reduced up to 0.87. This suggests that longitudinal shifts have a weak effect on creating tiling errors. Furthermore, the peak intensity values in the far field gradually reduced with increasing Y shift, as shown in Figure 6b. The maximum intensity drop observed in the measured range was only 5.7%. Figure 6c,d display the distribution of intensity along X and Y coordinates, showing a similar trend.
To study the effect of longitudinal misalignments caused by multiple gratings, two gratings in the TGA were subjected to different Y-shifts (Y, Y+P/2), as depicted in Figure 4e. The decrease in peak intensity within the measured range was negligible, with a percentage drop of less than 1% shown in Figure 6e. The variation in SR values with Y and Y+P/2 shift is illustrated in Figure 6f. Similar to the Y-shift of a single grating, the SR values decreased gradually. The minimum SR value observed within the measurement range is 0.807. Far-field irradiance distributions were also recorded at 0 spacing (no Y-shift), 3P/2 Y-shift and (3P/2,2P) Y-shift, as shown in Figure 5g–i, representing negligible variations. At higher Y-shifts, distortions were observed in the wavefront maps, indicating the presence of longitudinal shifts. However, overall, longitudinal shifts do not significantly alter the phase relationship in the TGA, allowing for a consistent phase of diffracted light, which ensures constructive interference.

3.2.3. Tiling Errors with Rotational Shifts

To determine the tiling tolerances due to rotational shifts, a single grating in the four-grating assembly is rotated at angles ranging from 0 to 1°. Both rotation type 1 and rotation type 2 (illustrated in Figure 4f,g) are introduced, similar to the two-grating TGA configuration. The resulting changes in SR values for different rotation type 1 angles are depicted in Figure 7a. Table S1 in the Supplementary Materials presents the rotation angles alongside their corresponding SR values. Figure 7a and Table S1 illustrate that the SR values exhibit extremely high sensitivity to rotational misalignments. It is observed that the SR values consistently decrease with increasing rotational angles of rotation type 1 up to 0.08°, after which they become saturated at higher angles. The table further emphasises the high-sensitivity measurement of the simulation software Zemax, demonstrating significant SR value variations even with smaller rotational shifts.
The far-field peak intensity distributions with varying angles of rotation type 1 are shown in Figure 7b. By increasing the angles of rotation type 1, the peak intensity values diminish, with the maximum intensity reduction being approximately 37.7% at a rotation angle of 0.05°. The effect of rotation type 2 (0.001° to 1°, shown in Figure 4g), for a single grating in the TGA on the SR values is illustrated in Figure 7c and Table S1. The rotations were systematically introduced as shown in Table S1, and the SR values gradually decreased with increasing rotation angles up to 0.05°, after which they became saturated.
Comparing the SR values of rotation type 1 and type 2, for rotation type 1 at 0.01°, the SR value decreased from 0.944 to 0.921, whereas for rotation type 2 at 0.01°, it drastically decreased to 0.752. This indicates a higher sensitivity of rotation type 2 over rotation type 1 in TGA. Figure 7d illustrates the relationship between peak irradiance and rotation type 2. The plot resembles that of rotation type 1, with a maximum intensity drop of 40.6% occurring at a rotation angle of 0.05°. To study the impact of rotational misalignments caused by multiple gratings in the TGA, rotation type 1 (shown in Figure 4h) was introduced for two diagonally opposite gratings, also rotating in opposite directions at varying angles from 0.001 to 1°. The SR values consistently decreased and eventually saturated, similar to the behaviour observed with a single grating rotation. Additionally, peak irradiance values reduced with increasing rotations, showing a significant 75.56% drop at an angle of 0.05°.
Figure 7g–i show the far-field irradiance with an angle of 0.05° with rotation type 1 and rotation type 2 for a single grating and rotation type 1 for two diagonally opposite gratings in the TGA. The figures demonstrate that the degradation of the far-field focal spot varies with the grating’s rotation. Figure 7g,h show two different far-field irradiance patterns for the same angle of rotation (0.05°). This difference allows for identifying and differentiating the tiling errors involved. When rotation type 1 is applied to two diagonally opposite gratings, vertical splitting of the focal spots is observed in the image plane, similar to the two-grating model. These results highlight that rotational misalignments are the most sensitive tiling errors, and Zemax OpticStudio is a powerful tool for calculating and differentiating various rotational misalignments in a TGA.

3.2.4. Comparison Between the Two- and Four-Grating Models

As a comparative summary, both the two- and four-grating models exhibited maximum SR values when lateral misalignments corresponded to integer multiples of the grating period, consistent with constructive interference between diffracted wavefronts. A lateral shift of λ between gratings reduced the SR to 0.62 and introduced horizontal splitting in the focal spot, indicating performance degradation below acceptable limits for the two-grating model, whereas in the case of the four-grating model, the lateral displacement of the single grating by λ reduced the SR value to 0.55, though no visible focal spot splitting occurred. However, when two diagonally opposite gratings were shifted by λ , the SR dropped to 0.52, and horizontal splitting with significant focal spot degradation was observed. The longitudinal shifts show relatively low sensitivity in both models. For rotational misalignments, both models exhibited high sensitivity. In the two-grating configuration, SR values began to decline significantly beyond a 0.04° rotation type 1, with complete focal spot degradation and vertical splitting occurring from 0.5°. For rotation type 2, SR degradation was evident even from 0.01, with visible splitting from 0.1°.
For rotational misalignments in the four-grating model, SR values dropped significantly from 0.04° (rotation type 1) and 0.01° (rotation type 2). While single-grating rotations did not produce visible splitting, simultaneous rotation of two gratings led to focal spot degradation and vertical splitting from 0.05°. The horizontal and vertical splitting observed in the far-field patterns due to translational and rotational misalignments, respectively, are consistent with existing literature, further validating the simulation results [23]. Moreover, the observations and inferences are consistent in both models. This further validates the observations and calculations performed in Zemax.
The simulation results presented in this study provide a foundation for defining practical alignment strategies and tolerances in the assembly of tiled grating systems. These findings are particularly relevant for overcoming the size limitations of a single diffraction grating while maintaining the optical performance in large-scale, high-power applications. The periodic dependence of SR values and peak irradiance on lateral shifts indicates that ideally aligning grating tiles at integer multiples of the grating period maximises constructive interference. The relatively low sensitivity to longitudinal displacements indicates that this degree of freedom may tolerate a relaxed alignment. But the high sensitivity to rotational misalignments highlights the need for stringent angular alignment tolerances. These findings suggest that rotational alignment should be prioritised during assembly and actively monitored during operation. Moreover, the distinct far-field degradation associated with different misalignment types may serve as a diagnostic tool for identifying and correcting alignment errors and thereby enhancing system robustness and performance. While incorporating TGA into real systems, efforts should be made in the mechanical design specifications to reduce the displacements of individual tiles. Real-time alignment monitoring of the far-field pattern is also essential.

4. Conclusions

In this study, we have systematically introduced various translational and rotational misalignments to TGA, consisting of two-/four-grating configurations. The obtained results revealed that the lateral shifts introduce a periodic variation in SR values and peak irradiance, with maximum values occurring when the shift is a multiple of the grating period. This is attributed to constructive interference from in-phase alignment of diffracted waves. In contrast, the longitudinal displacements have shown a negligible sensitivity and are found to be prominent only at higher values of shifts and with a larger number of gratings. Among the various misalignments introduced, the rotational misalignments were found to be the extremely sensitive tiling error, with SR values decreasing consistently with increasing rotation angles and plateauing at higher rotational angles. The degradation of focal spots was also evident from our analysis; lateral shifts caused horizontal splitting, while rotational misalignments led to vertical splitting of focal spots in the far-field pattern. Our simulation results highlight the importance of precise alignment of diffraction grating units in a tiled grating assembly to maintain its optical performance.

Supplementary Materials

The following supporting information can be downloaded at: https://www.mdpi.com/article/10.3390/photonics12080818/s1, Figure S1: The shaded model created using Zemax for a two-grating assembly. The inset figure represents the TGA assembly; Table S1: Strehl Ratios for different rotations for a single grating in TGA obtained from four-grating assembly.

Author Contributions

Conceptualisation, H.V.S. and M.F.; methodology, H.V.S.; software, H.V.S.; validation, M.F.; formal analysis, H.V.S. and G.H.; writing—original draft preparation, H.V.S. and M.F.; writing—review and editing, H.V.S., G.H. and M.F. All authors have read and agreed to the published version of the manuscript.

Funding

Not applicable.

Institutional Review Board Statement

Not applicable.

Informed Consent Statement

Not applicable.

Data Availability Statement

The data presented in this study are available on a reasonable request from the corresponding author.

Acknowledgments

All authors acknowledge the ELI-ALPS project (GINOP-2.3.6-15-2015-00001) supported by the European Union and co-financed by the European Regional Development Fund. All the authors acknowledge the facilities provided by ELI-ALPS research institute, ELI-HU Non Profit Ltd.

Conflicts of Interest

The authors declare no conflicts of interest.

References

  1. Haefner, C.; Bayramian, A.; Betts, S.; Bopp, R.; Buck, S.; Cupal, J.; Drouin, M.; Erlandson, A.; Horáček, J.; Horner, J.; et al. High average power, diode pumped petawatt laser systems: A new generation of lasers enabling precision science and commercial applications. In Proceedings of the Research Using Extreme Light: Entering New Frontiers with Petawatt-Class Lasers III; SPIE: Bellingham, WA, USA, 2017; Volume 10241, p. 1024102. [Google Scholar]
  2. Perry, M.; Pennington, D.; Stuart, B.; Tietbohl, G.; Britten, J.; Brown, C.; Herman, S.; Golick, B.; Kartz, M.; Miller, J.; et al. Petawatt laser pulses. Opt. Lett. 1999, 24, 160–162. [Google Scholar] [CrossRef]
  3. Strickland, D.; Mourou, G. Compression of amplified chirped optical pulses. Opt. Commun. 1985, 55, 447–449. [Google Scholar] [CrossRef]
  4. Sun, R.; Jin, D.; Tan, F.; Wei, S.; Hong, C.; Xu, J.; Liu, J.; Wang, P. High-power all-fiber femtosecond chirped pulse amplification based on dispersive wave and chirped-volume Bragg grating. Opt. Express 2016, 24, 22806–22812. [Google Scholar] [CrossRef] [PubMed]
  5. Webb, B.; Guardalben, M.; Dorrer, C.; Bucht, S.; Bromage, J. Simulation of grating compressor misalignment tolerances and mitigation strategies for chirped-pulse–amplification systems of varying bandwidths and beam sizes. Appl. Opt. 2019, 58, 234–243. [Google Scholar] [CrossRef] [PubMed]
  6. Bonod, N.; Neauport, J. Diffraction gratings: From principles to applications in high-intensity lasers. Adv. Opt. Photonics 2016, 8, 156–199. [Google Scholar] [CrossRef]
  7. Danson, C.N.; Haefner, C.; Bromage, J.; Butcher, T.; Chanteloup, J.C.F.; Chowdhury, E.A.; Galvanauskas, A.; Gizzi, L.A.; Hein, J.; Hillier, D.I.; et al. Petawatt and exawatt class lasers worldwide. High Power Laser Sci. Eng. 2019, 7, e54. [Google Scholar] [CrossRef]
  8. Miyanaga, N.; Azechi, H.; Tanaka, K.; Kanabe, T.; Jitsuno, T.; Kawanaka, J.; Fujimoto, Y.; Kodama, R.; Shiraga, H.; Knodo, K.; et al. 10-kJ PW laser for the FIREX-I program. Proc. J. Phys. IV 2006, 133, 81–87. [Google Scholar] [CrossRef]
  9. Britten, J.; Nguyen, H.; Jones, L.; Carlson, T.; Hoaglan, C.; Summers, L.; Aasen, M.; Rigatti, A.; Oliver, J. First Demonstration of a Meter-Scale Multilayer Dielectric Reflection Grating for High-Energy Petawatt-Class Lasers; Lawrence Livermore National Laboratory: Livermore, CA, USA, 2004. [Google Scholar]
  10. Li, Z.; Li, S.; Wang, C.; Xu, Y.; Wu, F.; Li, Y.; Leng, Y. Stable and near Fourier-transform-limit 30fs pulse compression with a tiled grating compressor scheme. Opt. Express 2015, 23, 33386–33395. [Google Scholar] [CrossRef]
  11. Kessler, T.J.; Bunkenburg, J.; Huang, H.; Kozlov, A.; Meyerhofer, D.D. Demonstration of coherent addition of multiple gratings for high-energy chirped-pulse-amplified lasers. Opt. Lett. 2004, 29, 635–637. [Google Scholar] [CrossRef]
  12. Li, Y.; Mi, X.; Qi, X.; Zhang, S.; Yang, G.; Yu, H.; Li, X.; Li, W. Echelle gratings tiling method based on lateral shearing interferometry. Opt. Laser Technol. 2022, 145, 107475. [Google Scholar] [CrossRef]
  13. Qiao, J.; Kalb, A.; Nguyen, T.; Bunkenburg, J.; Canning, D.; Kelly, J. Demonstration of large-aperture tiled-grating compressors for high-energy, petawatt-class, chirped-pulse amplification systems. Opt. Lett. 2008, 33, 1684–1686. [Google Scholar] [CrossRef] [PubMed]
  14. Qiao, J.; Kalb, A.; Guardalben, M.; King, G.; Canning, D.; Kelly, J. Large-aperture grating tiling by interferometry for petawatt chirped-pulse-amplification systems. Opt. Express 2007, 15, 9562–9574. [Google Scholar] [CrossRef] [PubMed]
  15. Shi, L.; Zeng, L.; Li, L. Fabrication of optical mosaic gratings with phase and attitude adjustments employing latent fringes and a red-wavelength dual-beam interferometer. Opt. Express 2009, 17, 21530–21543. [Google Scholar] [CrossRef] [PubMed]
  16. Daiya, D.; Patidar, R.K.; Moorti, A.; Benerji, N.; Bindra, K. Online monitoring and active control of alignment errors in a tiled grating assembly using single wedge plate. Opt. Lasers Eng. 2023, 161, 107355. [Google Scholar] [CrossRef]
  17. Li, Z.; Wang, X.; Mu, J.; Yan, W.; Zhu, Q.; Su, J.; Zhou, K.; Zhang, J.; Wu, Z.; Zhou, S.; et al. Two-pass full-tiled grating compressor with real-time monitoring and control for XG-III petawatt-class laser facility. Laser Phys. 2014, 25, 015301. [Google Scholar] [CrossRef]
  18. Daiya, D.; Patidar, R.; Sharma, J.; Joshi, A.; Naik, P.; Gupta, P. Optical design and studies of a tiled single grating pulse compressor for enhanced parametric space and compensation of tiling errors. Opt. Commun. 2017, 389, 165–169. [Google Scholar] [CrossRef]
  19. Bunkenburg, J.; Kessler, T.; Skulski, W.; Huang, H. Phase-locked control of tiled-grating assemblies for chirped-pulse-amplified lasers using a Mach–Zehnder interferometer. Opt. Lett. 2006, 31, 1561–1563. [Google Scholar] [CrossRef]
  20. Zuo, Y.; Wei, X.; Wang, X.; Zhu, Q.; Ren, R.; Huang, Z.; Liu, H.; Ying, C. Eliminating the longitudinal piston error between tiled gratings by angle tuning. Opt. Lett. 2007, 32, 280–282. [Google Scholar] [CrossRef]
  21. Hornung, M.; Bödefeld, R.; Siebold, M.; Schnepp, M.; Hein, J.; Sauerbrey, R.; Kaluza, M.C. Alignment of a tiled-grating compressor in a high-power chirped-pulse amplification laser system. Appl. Opt. 2007, 46, 7432–7435. [Google Scholar] [CrossRef]
  22. Hu, Y.; Zeng, L. Grating mosaic based on image processing of far-field diffraction intensity patterns in two wavelengths. Appl. Opt. 2007, 46, 7018–7025. [Google Scholar] [CrossRef]
  23. Hu, Y.; Zeng, L.; Li, L. Method to mosaic gratings that relies on analysis of far-field intensity patterns in two wavelengths. Opt. Commun. 2007, 269, 285–290. [Google Scholar] [CrossRef]
  24. Naeem, M.; Imran, T. Aberration analysis of reflective and transmissive type optical spectrometer using Zemax. Opt. Contin. 2025, 4, 75–85. [Google Scholar] [CrossRef]
  25. Naeem, M.; Imran, T. ZEMAX Simulations and Experimental Validation of Laser Interferometers. Proc. Photonics 2025, 12, 206. [Google Scholar] [CrossRef]
  26. Ma, X.; Zhu, J. Piston phase alignment of tiled grating assemblies by use of temporal coherence of ultra-short pulse. Chin. Opt. Lett. 2007, 5, S25–S26. [Google Scholar]
  27. Zhang, S.; Zhang, J.; Wang, Y.; Wang, X.; Feng, X.; Mu, J.; Xiang, X.; Lin, D.; Su, J.; Li, Z.; et al. Theoretical and experimental research of tiling error compensation method based on a small-size mirror for large-aperture tiled-grating compressors. Opt. Laser Technol. 2018, 104, 190–196. [Google Scholar] [CrossRef]
Figure 1. The overall shaded model created using Zemax shows the direction of beam paths. The inset figure represents the tiled grating assembly. The presented configuration shows the four-grating situation.
Photonics 12 00818 g001
Figure 2. Schematic representation of translational misalignments: (a) and (b), rotational misalignments: (c) rotation type 1 (around Z axis) and (d) rotation type 2 (around X axis), applied to one of the gratings in the two-grating model.
Photonics 12 00818 g002
Figure 3. (a) Periodic variation in SR values after introducing different lateral shifts (X-shift values ranging from λ /2 to 10 λ /2) between the gratings in the two-grating model, (b) change in peak irradiance with X-shift from λ /2 to 5 λ /2, (c) change in SR values at different rotation angles ranging from 0.001° to 1° of rotation type 1 applied to a single grating in the two-grating model, (d) change in peak irradiance with rotation type 1 (0.01 to 1), (e) change in SR values after introduction of 0.001° to 1° rotation type 2 misalignment to one of the gratings, (f) peak irradiance variation with rotation type 2 misalignment from 0.01° to 1°, (gi) irradiance in far-field focal spot pattern with λ X-shift between the gratings showing the horizontal splitting of the focal spot, 0.5° rotation type 1 and 0.1° rotation type 2 for one of the gratings in the two-grating model, showing the vertical spitting of the focal spot pattern.
Photonics 12 00818 g003
Figure 4. A schematic representation of TGA consisting of four identical gratings: (a) the ideal case without any misalignments, (b,c) X-shifts for a single grating and two diagonally opposite gratings, (d,e) Y-shifts for a single grating and (Y, Y+P/2) shift for two gratings, (f) rotation type 1 for a single grating, (g) rotation type 2 for a single grating and (h) rotation type 1 for two diagonally opposite gratings.
Photonics 12 00818 g004
Figure 5. (a) Periodic change in Strehl ratio with X-shift (ranging from λ /2 to 10 λ /2) for a single grating in a four-grating TGA configuration, (b) peak intensity variation for different X-shift values from λ /2 to 5 λ /2 for a single grating, (c,d)the corresponding irradiance distribution in the image plane along X and Y coordinates, (e) peak intensity variation with X-shift values ranging from λ /2 to 5 λ /2 for diagonally two opposite gratings, (f) change in SR values with X-shift for two diagonally opposite gratings, (gi) irradiance in far field with no X-shift (0 spacing), 3 λ /2 X-shift for a single grating and 3 λ /2 X-shift for two diagonally opposite gratings, showing the horizontal splitting of the focal spot.
Photonics 12 00818 g005
Figure 6. (a) Change in SR values with a single-grating longitudinal (Y-shift) from P/2 to 5P/2 in the four-grating configuration, (b) corresponding peak intensity variation with P/2 to 5P/2 Y-shift for a single grating, (c,d) the corresponding irradiance distribution along X and Y coordinates, (e) change in SR values with unequal Y-shift (Y, Y+P/2) for two gratings in the four-grating configuration, (f) corresponding peak intensity variation with unequal Y-shift (Y, Y+P/2) for two gratings, (gi) irradiance in the far field with no Y-shift (0 spacing), 3P/2 Y-shift for a single grating and (3P/2, 2P) Y-shift for two gratings, showing negligible effects in the focal spot pattern.
Photonics 12 00818 g006
Figure 7. (a) Change in SR values with rotation type 1 for single grating from 0.001° to 1° rotation angles in the four-grating configuration, (b) peak intensity variation with rotation type 1 from 0.01° to 1°, (c) change in SR values with rotation type 2 from 0.001° to 1° for a single grating in the four-grating configuration, (d) peak intensity variation with rotation type 2 from 0.01° to 1°, (e) change in SR values versus rotation type 2 for two gratings in opposite directions at rotation angles from 0.001° to 1°, (f) peak intensity variation versus rotation type 2 from 0.01° to 1° for two gratings in opposite directions, (gi) irradiance in the far field with 0.05° rotation type 1 for a single grating, rotation type 2 for a single grating, showing degraded focal spot patterns, and rotation type 1 for two gratings in opposite directions, showing the vertical splitting of focal spot patterns.
Photonics 12 00818 g007
Disclaimer/Publisher’s Note: The statements, opinions and data contained in all publications are solely those of the individual author(s) and contributor(s) and not of MDPI and/or the editor(s). MDPI and/or the editor(s) disclaim responsibility for any injury to people or property resulting from any ideas, methods, instructions or products referred to in the content.