Article

High-Efficiency Mid-Infrared Transmission Modulator Based on Graphene Plasmon Resonance and Photonic Crystal Defect States

1
Department of Physics, Harbin Institute of Technology, Harbin 150001, China
2
Institute of Systems Engineering, Academy of Military Sciences, Beijing 100191, China
3
Chongqing Key Laboratory of Multi-Scale Manufacturing Technology, Chongqing Institute of Green and Intelligent Technology, Chinese Academy of Sciences, Chongqing 400714, China
4
Institute of Flexible Electronics Technology of Tsinghua University, Jiaxing 314000, China
*
Authors to whom correspondence should be addressed.
These authors contributed equally to this work.
Photonics 2025, 12(8), 800; https://doi.org/10.3390/photonics12080800 (registering DOI)
Submission received: 7 July 2025 / Revised: 6 August 2025 / Accepted: 7 August 2025 / Published: 9 August 2025
(This article belongs to the Special Issue Metamaterials and Nanophotonics: Fundamentals and Applications)

Abstract

With the continuous exploration and advancement of communication frequency bands, terahertz and mid-to-far-infrared communication systems have attracted significant attention in recent years. Modulators are essential components in these systems, making the enhancement of modulator performance in the infrared and terahertz bands a prominent research focus. In this study, we propose a high-performance infrared transmission-type modulator based on the plasmon resonance effect of graphene nanoribbons. This design synergistically exploits near-field enhancement from metal slits and defect states in one-dimensional photonic crystals to strengthen light–graphene interactions. The modulator achieves a modulation depth exceeding 80% and an operating bandwidth greater than 4 THz in the mid-infrared range, enabling efficient signal modulation for free-space optical communication. Importantly, the proposed design alleviates experimental challenges typically associated with the need for high graphene mobility and a wide Fermi energy tuning range in conventional approaches, thereby improving its practical feasibility. Moreover, the approach is scalable to far-infrared and terahertz bands, offering valuable insights for advancing signal modulation technologies across these spectral regions.

1. Introduction

In optical communication, optical modulators are essential components for signal generation, modulation, and demodulation. The performance of communication systems is strongly influenced by key modulator parameters such as modulation depth and modulation speed [1,2]. A higher modulation depth enhances the contrast between signal states, thereby improving reliability and resistance to interference. Modulation speed characterizes the responsiveness of the modulator to input variations, where higher speeds are crucial for high-speed data transmission.
Although efficient modulators based on lithium niobate electro-optic technology have been successfully developed for near-infrared and visible light communications, enabling high-speed fiber optic systems [3,4,5,6], they are unsuitable for the long-wave-infrared spectral window (8–14 µm), which is important for applications such as space laser communication [7,8]. This limitation arises from the intrinsic electromagnetic properties of the materials and device architectures. Consequently, considerable research has focused on this spectral band. However, simultaneously achieving both high modulation speed and large modulation depth remains a significant challenge. Current mid-infrared modulators primarily employ phase-change materials such as GST [9,10] and VO2 [11,12]. Yet, the electromagnetic properties of these materials are fundamentally governed by the thermodynamics of their phase transitions, which typically occur on microsecond timescales or longer. This intrinsic constraint severely limits modulation speeds, rendering megahertz (MHz) operation difficult to achieve.
In this context, graphene has attracted considerable interest due to its widely tunable electrical conductivity and rapid electrical tuning response [13,14]. Studies have demonstrated that graphene devices gated by solid-state electrodes can achieve modulation speeds exceeding 1 GHz [15]. In the mid-infrared range, graphene-based modulators typically operate by exciting plasmon resonances, which induce absorption and modulate the transmission or reflection [16,17]. The modulation depth of graphene plasmons is fundamentally limited by two intrinsic factors: carrier relaxation time and the achievable Fermi level range. For large-area chemical vapor deposition (CVD) graphene, carrier relaxation times typically range between 10 and 20 fs [18,19], significantly shorter than the hundreds of femtoseconds often assumed in prior studies [20,21,22]. The other limitation involves the Fermi level. According to the Drude model [23], graphene electrical conductivity scales with its Fermi level; hence, a wider Fermi level tuning range enhances modulation performance. However, due to dielectric breakdown constraints, the Fermi level tuning in single-layer graphene is usually restricted to within approximately 0.5 eV [24]. Therefore, a key challenge is to achieve a large modulation depth using experimentally feasible graphene quality and Fermi level tuning ranges that are lower than commonly assumed.
To address this challenge, one feasible strategy involves enhancing light–graphene interactions via metal gratings [25,26] or dielectric cavities [19]; however, transmission modulation depth remains below 50%. Here, we propose a novel graphene plasmon transmission modulation device that significantly increases the resonance of graphene plasmons through two mechanisms. First, it exploits the funneling effect of metallic slit antennas to enhance the local electric field of graphene plasmons. Second, it leverages the high photon density of states associated with defect states in a photonic crystal [27,28,29] to amplify light intensity at the graphene modulation region, thereby improving plasmon excitation efficiency. This approach enables transmission modulation with a modulation depth exceeding 80% over a frequency band of 4 THz in the mid-infrared range, under experimentally feasible conditions of a 10 fs carrier relaxation time and a Fermi level tuning range below 0.5 eV. These results offer a promising solution for signal modulation in infrared space optical communication systems.

2. Design of the Structure

In the subsequent stage, we will engage in the design and optimization of the specific structure of the device and employ the finite-element simulation module for electromagnetic fields in COMSOL Multiphysics® v6.1 to simulate and validate the optical properties of the designed device structure. Graphene is modeled as a current boundary condition, with its surface conductivity configured according to the Drude model as σ = i4e2Ef/[h2(ω + iτ−1)], where e denotes the elementary charge, Ef denotes the Fermi level, ω denotes the angular frequency of incident light, τ denotes the carrier relaxation time and h denotes the Planck constant. The grid size of graphene is restricted to below 5 nm to ensure the accuracy of the results. Given that the structure is a periodically arranged array and the incident TM light wave is normally incident on the structure, the boundary conditions on both lateral sides are set as continuous periodic boundary conditions. Perfectly matched layers with a thickness of 10 μm are implemented on the upper and lower sides to eliminate boundary reflection echoes.

2.1. Overall Structural Design

As illustrated in Figure 1, the proposed infrared modulator comprises two functional components: the antenna-enhanced graphene plasmonic (AEGP) structure and the one-dimensional photonic crystal (PC) cavity, with the AEGP structure positioned at the center of the PC cavity.
The AEGP structure incorporates graphene nanoribbons suspended above gold slit antennas, with the width (w) of the nanoribbons designed to exceed or equal the width (s) of the slits. A thin dielectric layer, referred to as the spacer layer, is conformally grown over the metallic structure, creating suspended graphene regions above the slits (Figure 1b). The structure employs an electrical gating mechanism where graphene nanoribbons connect to the positive terminal of a voltage source, while the metal slit antenna serves as the gate electrode. This configuration enables precise control of the graphene Fermi level through voltage modulation, thereby tuning the optical transmission characteristics of the device. More importantly, the metallic slit antennas generate a light funneling effect, creating intense local electric fields that enhance light-plasmon interactions.
The PC cavity consists of alternating layers of calcium fluoride (n1 = 1.35) and germanium (n2 = 4), arranged symmetrically to form an optical cavity. The graphene plasmonic device is centrally positioned within a dielectric cavity layer (CL). In this paper, we select calcium fluoride as the dielectric material (n3 = n1) to simplify the design process and reduce the variety of materials required for device fabrication. This arrangement intentionally breaks the PC periodicity, generating a defect state that amplifies light intensity in the central slit antenna region, further enhancing light-plasmon interactions and improving modulation depth.
Considering the device as a sandwich structure with PC on both the upper and lower layers, for TM-polarized light under normal incidence, the forward and backward transmission coefficients of the PC layers over (PCA) and under (PCB) the AEGP structure are denoted as tA, tB, and tAi, tBi, respectively. Meanwhile, the reflection coefficients are denoted as rA, rB and rAi, rBi, respectively. Given the transmission coefficient tM and reflection coefficient rM of the plasmonic metasurface, the overall transmittance of the device can be derived as follows:
T = n 1 n 0 t A t M t B e i θ r Ai r M e i θ + r B r M e i θ r Ai r M 2 r B e i 2 θ + r Ai t M 2 r B e i 2 θ 1 2
Here, n0 is the refractive index of air (n0 = 1) and θ represents the phase corresponding to the optical path of the CL. From Equation (1), it is evident that the overall transmittance of the device is determined by the transmission and reflection characteristics of both the AEGP structure (tM, rM) and the PC cavity (tA, tB, tAi, tBi, rA, rB, rAi, rBi). Consequently, in the subsequent analysis, the optical properties and optimization designs of these components will be examined separately.

2.2. Design of the Antenna Enhanced Graphene Plasmonic Structure

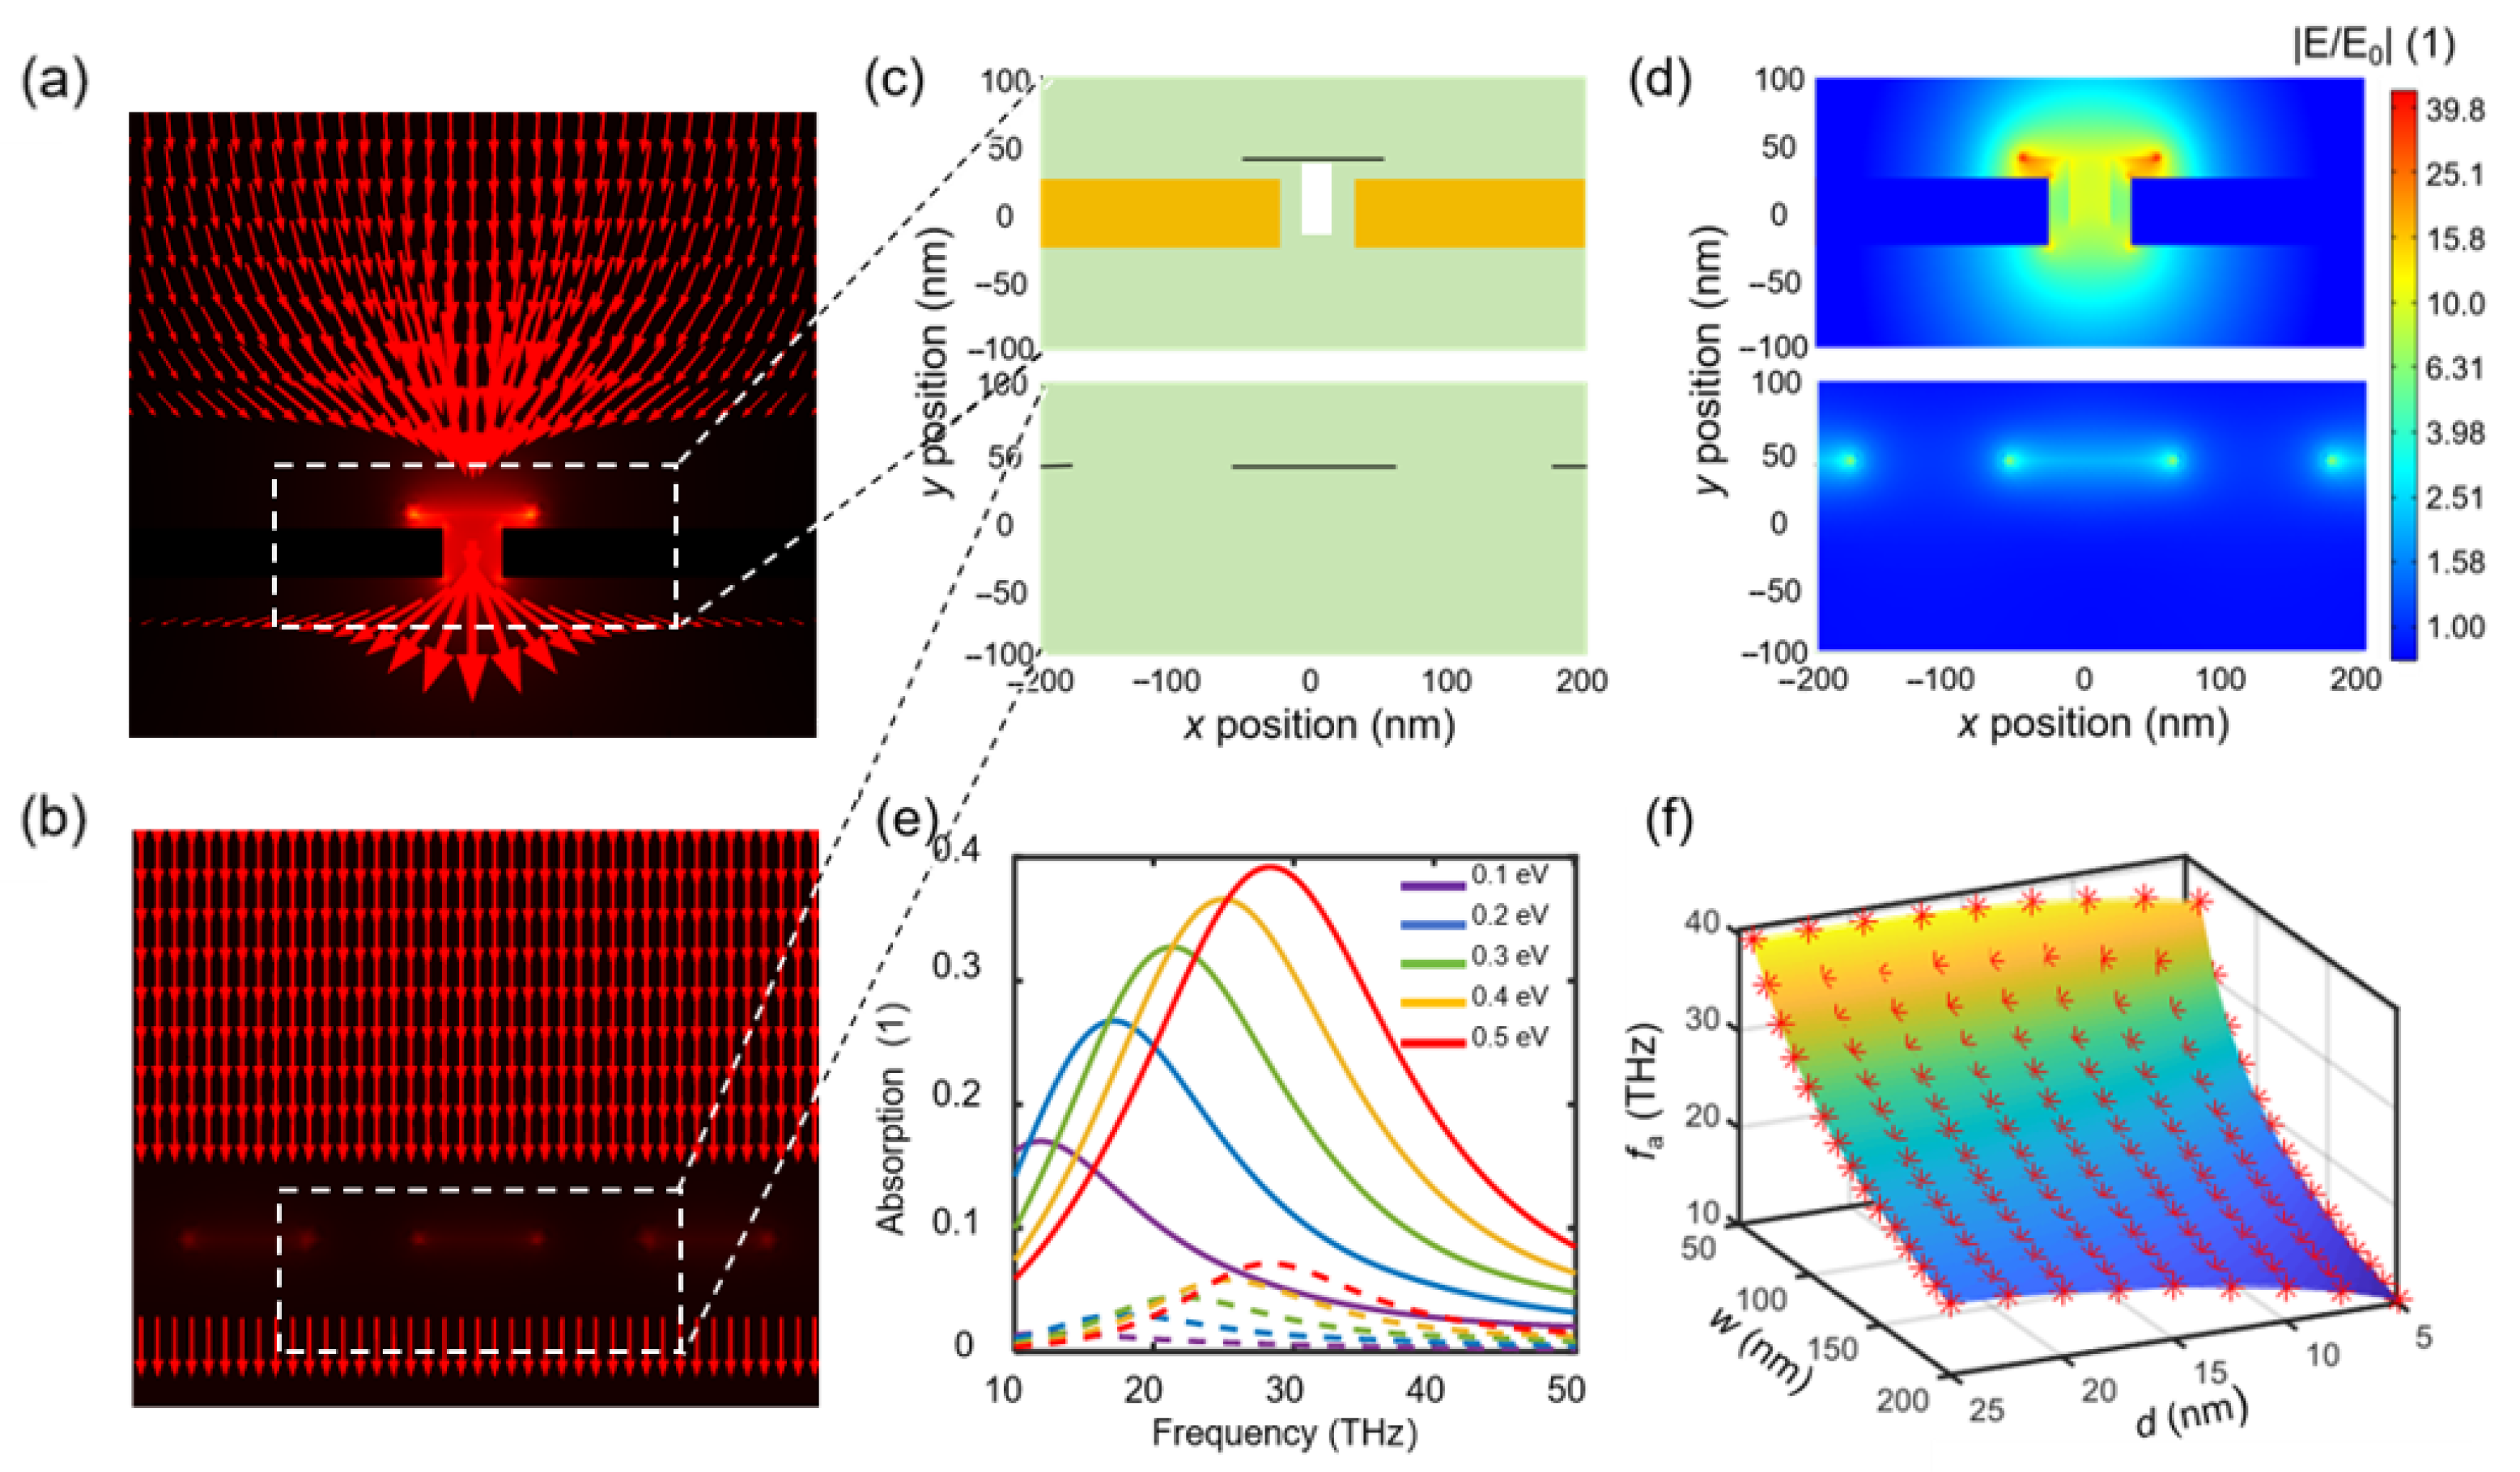
First, the optical properties of the AEGP structure are quantitatively modeled to optimize its design. In conventional graphene plasmonic devices, low plasmon excitation efficiency caused by short carrier relaxation times limits the modulation depth of nanoribbon array devices to less than 20%. To overcome this limitation, the optical funneling effect of a large-period metallic slit antenna is utilized to enhance the resonance strength of graphene plasmons. As illustrated in Figure 2a, at the metal slits, incident light bends around the metal film and transmits through the slits, resulting in focused and enhanced electromagnetic fields on the slit surfaces.
To assess the field enhancement resulting from the light funneling effect of the metallic slit antenna, the field enhancement (FE) coefficient is calculated. The FE coefficient is defined as χ = 0 p E x 2 / 2 P Z d x , where P and Z are the incident power and optical impedance, respectively. This calculation is performed on a plane located 10 nm above the metallic slit antenna, as indicated in Figure 2a, at the 10.6 µm wavelength of a carbon dioxide laser. The calculated FE coefficients, shown in Figure 2b, exceed unity in all cases and reach a maximum value of 4.7, confirming the presence of strong evanescent waves in the near field of the metallic slit antenna. For a fixed slit width, there exists an optimal period popt that maximizes the coefficient, corresponding to the strongest evanescent field enhancement, as marked by red circles in Figure 2b. As the slit width increases from 40 nm to 100 nm, popt exhibits a gradual increase from 700 nm to 1050 nm, albeit at a diminishing rate, while the maximum FE coefficient value decreases from 4.7 to 4.3.
The parameter popt can be considered the effective absorption cross-section of the slot antenna. When the array period is smaller than popt the absorption cross-sections of adjacent slot antennas overlap, which prevents the full utilization of the light funneling effect and consequently reduces the local electric field intensity. Conversely, when the array period exceeds popt, a portion of the incident light falls outside the coverage of the antenna absorption cross-section and is directly reflected, as illustrated in Figure 3c, leading to a decline in transmittance. The incident light that is not effectively captured in this region is unable to be focused within the slit, thus also diminishing the local electric field intensity. Moreover, although increasing the slit width enlarges the absorption cross-section of the antenna, it concurrently weakens the local field enhancement caused by evanescent waves. Therefore, simply increasing the slit width or array period does not necessarily enhance the electric field intensity inside the slit.
When a graphene nanoribbon is positioned on a metallic slit antenna, forming the AEGP structure, graphene plasmons can be excited by the enhanced local electric field. Figure 3 compares the AEGP structure with the standalone graphene nanoribbon (GNR) structure to highlight the advantage provided by the funneling effect of the metallic slit antenna. Figure 3b presents the cross-sections of both structures, and Figure 3a,b display their corresponding Poynting vector distributions at graphene plasmonic resonant frequencies. Clearly, in the AEGP structure, the electromagnetic energy of light is funneled into graphene plasmons, while in the GNR structure, no obvious funneling effect is observed. The field distributions of graphene plasmons in the two structures are shown in Figure 3d. The plasmonic electric field in the AEGP structure is significantly enhanced, reaching a maximum enhancement factor exceeding 35, which is far greater than the factor (<7) observed in the GNR structure. Figure 3e presents a comparison of the plasmonic resonant absorptions of the two structures. It is observed that the introduction of metal slits significantly enhances the resonant absorption. For example, at a Fermi energy of 0.5 eV, the absorption rate increases from 7% in the GNR structure to 39% in the AEGP structure. This demonstrates the enhancement effect of the metallic slit antenna on graphene plasmon resonance.
Figure 3e shows that the resonance frequency of the device gradually changes with the Fermi level, demonstrating that the device exhibits tunable dispersive characteristics. We developed a dispersion relation for the graphene plasmons in the AEGP structure. The graphene plasmons are divided into two components: waveguide-type acoustic graphene plasmons in the metal region (with wave vector magnitude k1) and graphene plasmons suspended in the slits (with wave vector magnitudes k2 and k3 for air and calcium fluoride substrates, respectively). Constructive interference occurs when the total phase accumulated by the traveling waves from the two plasmon components and the phase shift ∆φ at the interface equals π. This condition is expressed by the equation: k1(ws) + [k2(s − 2d) + k3(2d)] + ∆φ = π. Based on this equation and the dispersion characteristics of graphene plasmons [30,31], we modeled the boundary phase shift in the AEGP structure. The detailed model is described in the Supplementary Materials. As shown in Figure 3f, the resonance frequency calculated using the phase shift model (colored plane) is in good agreement with the finite element simulation results, indicating the capability of the model to accurately predict the resonance frequency of AEGP structure.
To quantitatively analyze the transmission modulation effect of the AEGP structure, the temporal coupled-mode theory (TCMT) is employed to describe its behavior [32,33]. In TCMT, the AEGP structure can be considered as a symmetric two-channel system as follows:
d a d t = i ω a γ 0 γ 1 a + γ 1 r 0 i t 0 S 1 + S 1 = e i φ r 0 S 1 + γ 1 r 0 i t 0 a S 2 = e i φ i t 0 S 1 + + γ 1 r 0 i t 0 a
where a is the complex amplitude of the mode resonator, and its time-dependent term is e−iωt. S1− and S1+ are the incident channel and the reflection channel, respectively, and S2+ is the transmission channel. γ0 is the intrinsic loss of the graphene plasmon mode, which is inversely proportional to the carrier relaxation time of graphene as γ0 = 1/(2τ) [34] and γ1 is the coupling rate between the graphene plasmon mode and the external space. r0 and t0 represent the absolute values of the reflection and transmission coefficients, respectively, when the incident light vertically irradiates the device without graphene loaded. φ is the phase term of the reflection coefficient. ωa represents the resonance frequency of graphene plasmons. Based on Equation (2), the complex amplitudes tM and rM of transmission and reflection of the AEGP structure can be solved as follows:
t M = e i φ i t 0 + γ 1 r 0 i t 0 i ω ω a + γ 0 + γ 1
r M = e i φ r 0 γ 1 r 0 i t 0 i ω ω a + γ 0 + γ 1
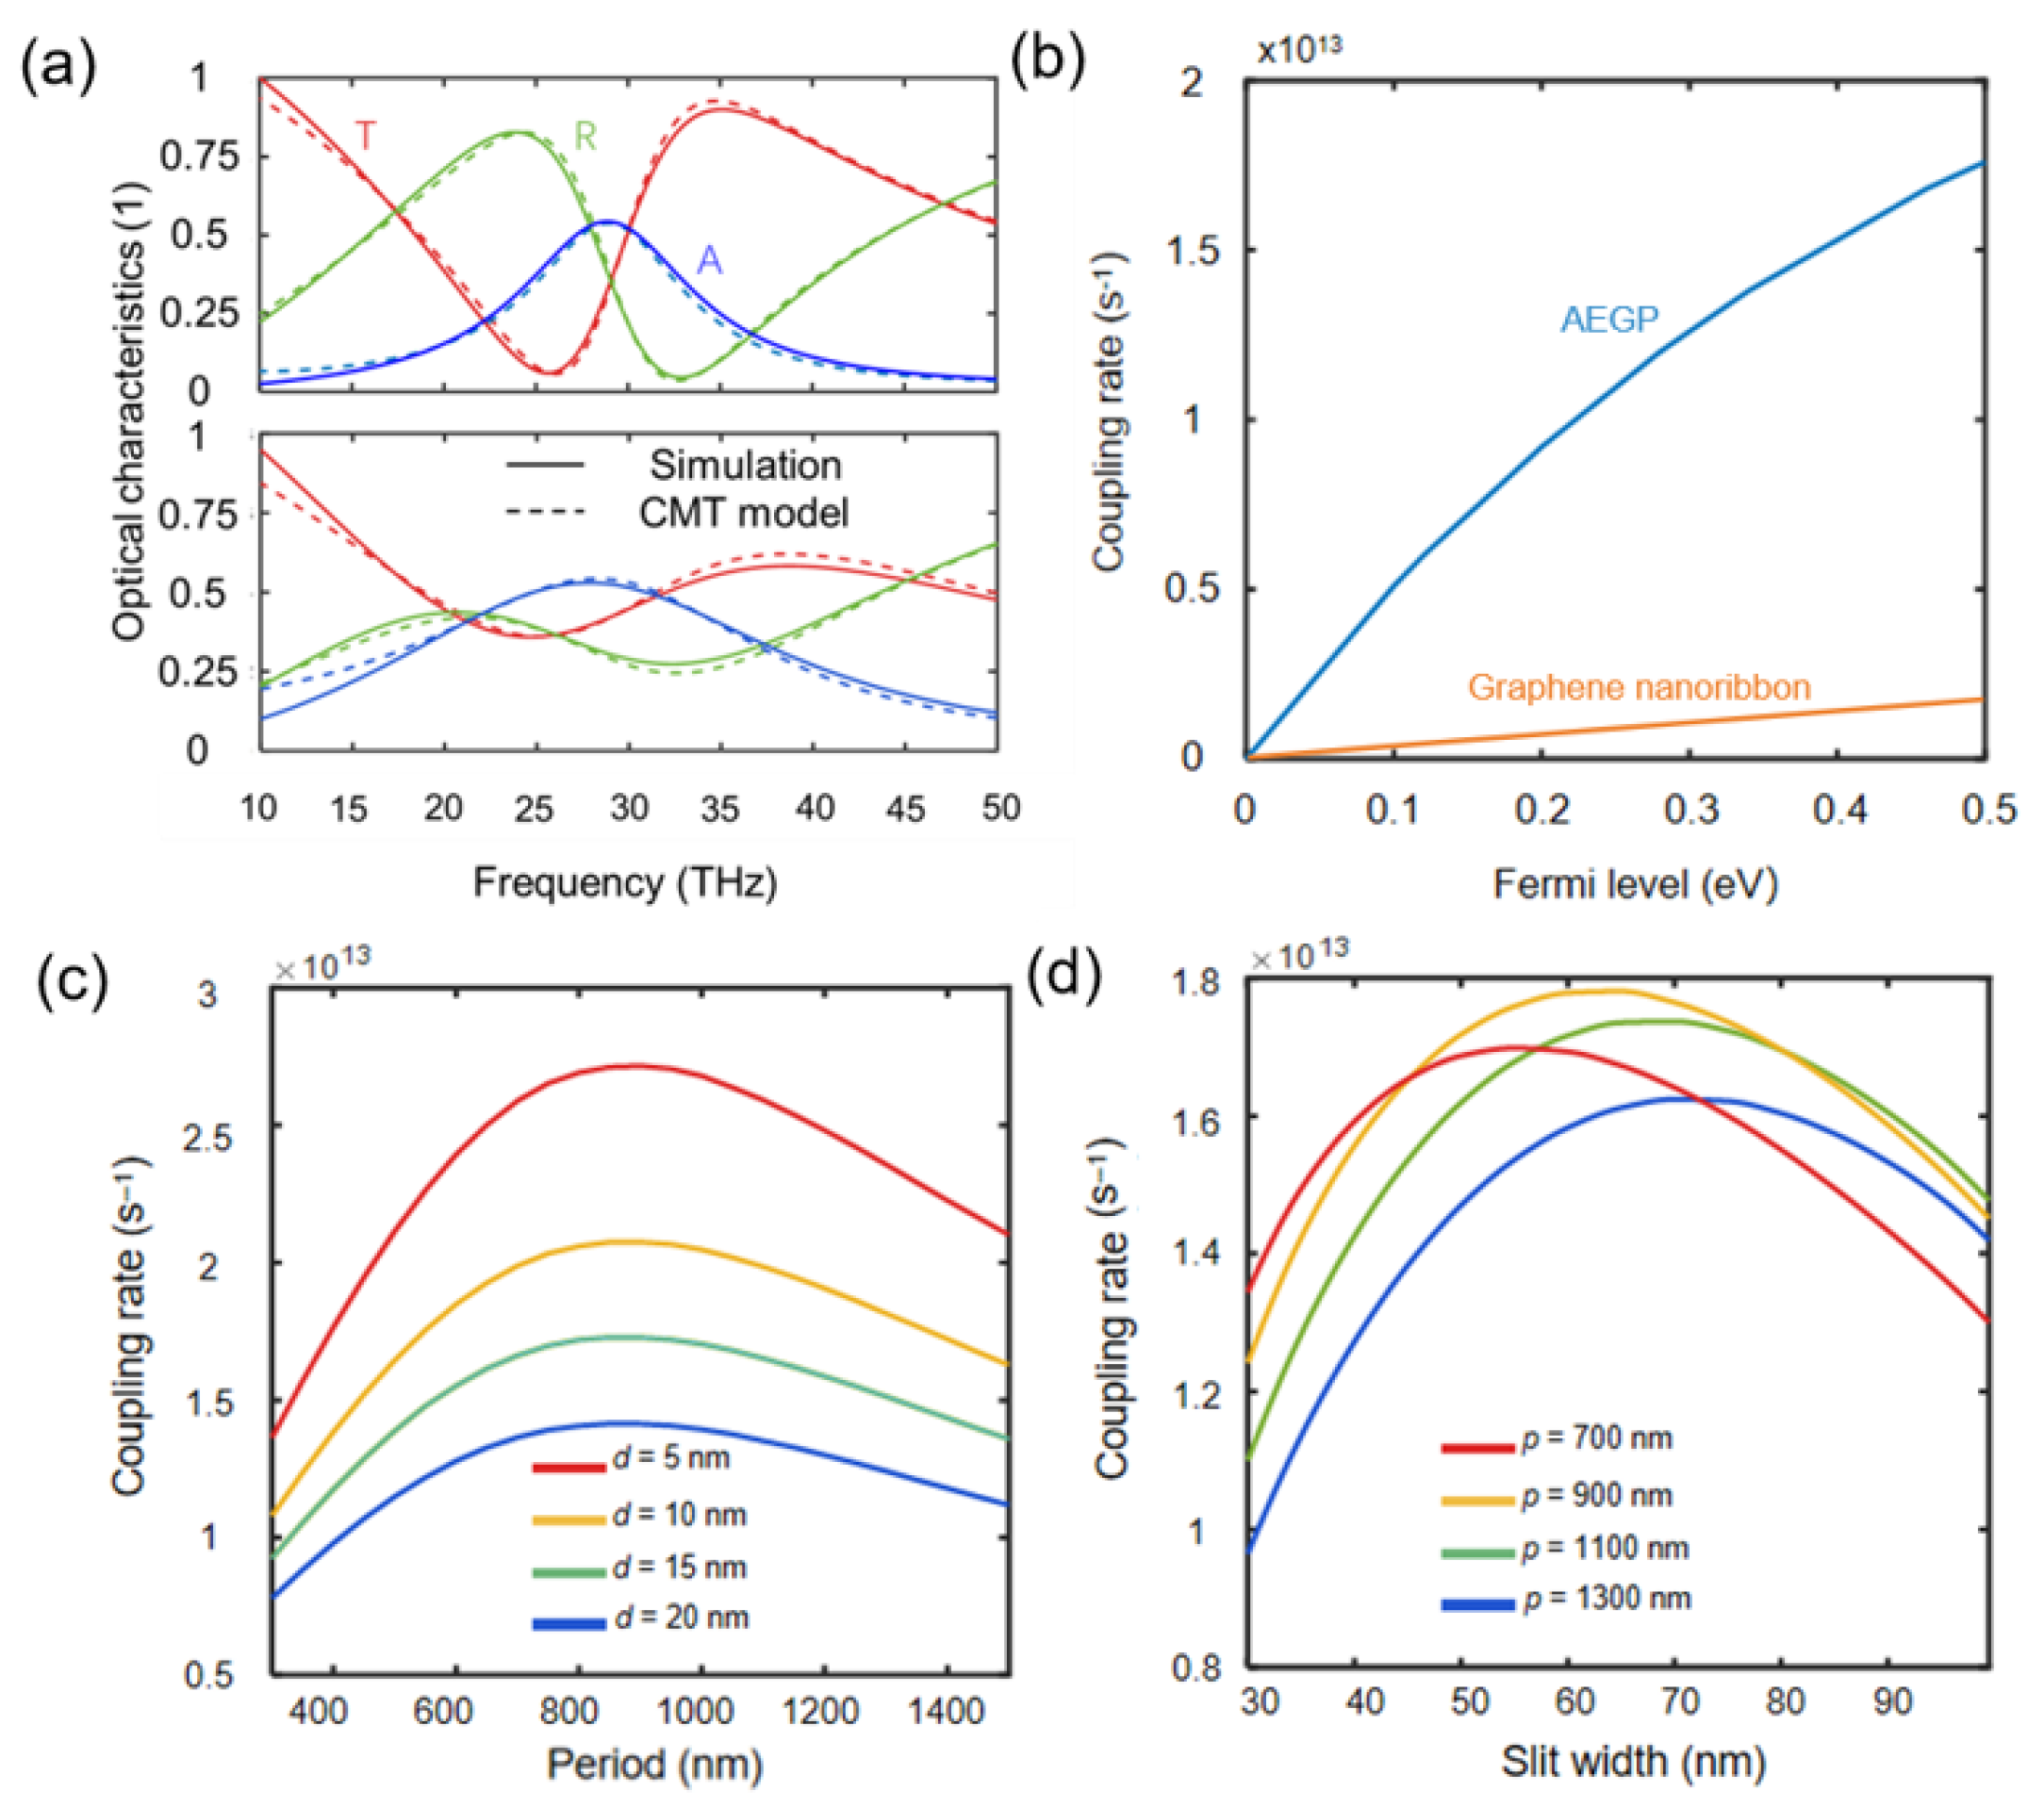
To validate the reliability of the temporal coupled-mode theory (TCMT) model for the optical properties of the AEGP structure, a comparison is made with electromagnetic finite element simulation results. A representative device encapsulated in calcium fluoride, with a period of 900 nm, a dielectric thickness of 10 nm, a Fermi level of 0.5 eV, and a nanoribbon width of 88 nm, is used as an example. Simulated transmittance, reflectance, and absorptance at carrier relaxation times of 50 fs and 10 fs are presented as solid lines in Figure 4a. TCMT fitting results, obtained by incorporating the relevant device parameters and setting the mode coupling rate γ1 to 2 × 10¹³ s−1, are shown as dashed lines. The close agreement between the TCMT fits and finite element simulations in Figure 4a confirms the effectiveness of the model for such devices.
The interaction strength between graphene plasmons and incident light is quantitatively characterized by the coupling rate γ1 in the TCMT model. As shown in Figure 3c, γ1 increases from 1.9 × 10¹² s−1 in the GNR structure to 1.8 × 10¹³ s−1 in the AEGP structure, representing an approximately one-order-of-magnitude enhancement. Furthermore, the mode coupling rate for both the AEGP and GNR structures exhibits a positive correlation with the Fermi level and can be approximately expressed as γ1 = ξEf,, as illustrated in Figure 4b.
The period of the metallic slit antenna and the dielectric layer thickness in the AEGP structure significantly affect the coupling rate γ1. As shown in Figure 4c, with a fixed slit width of 60 nm and nanoribbon widths adjusted to maintain a resonance frequency of 28.3 THz (74 nm, 88 nm, 96 nm, and 101 nm for dielectric thicknesses of 5, 10, 15, and 20 nm, respectively), the coupling efficiency markedly increases as the dielectric layer thickness decreases. Thus, reducing dielectric thickness is the primary method to enhance resonance intensity. However, extremely thin dielectric layers lead to sharp increases in plasmon wavevector and interfacial phase mutation, requiring nanoribbon widths on the order of tens of nanometers to maintain mid-infrared resonance, which presents fabrication challenges. Consequently, a moderate dielectric thickness of 15 nm was selected for the device. Moreover, the coupling rate reaches a maximum at a period of 900 nm regardless of dielectric thickness, indicating that this period is optimal for a 60 nm slit width at 28.3 THz.
The metal slit width also influences γ1, as shown in Figure 4d. For each period, the coupling rate first increases then decreases with slit width. At a period of 900 nm, the maximum coupling rate of 1.76 × 10¹³ s−1 occurs at a slit width of 60 nm. As the period increases from 700 nm to 1300 nm, the slit width corresponding to the maximum coupling rate also increases, demonstrating a positive correlation. This trend aligns with the near-field enhancement effects discussed in Figure 2, further confirming that the near-field enhancement characteristic of the metallic slit antenna plays a role in enhancing the optical resonance intensity of graphene nanoribbons.
Furthermore, systematic variation in the period reveals a non-monotonic trend in the maximum coupling rate achievable via slit width optimization: the coupling rate first increases and then decreases as the period increases continuously. Within the period range of 700 nm to 1100 nm, the peak coupling rate is attained at a period of 900 nm. This observation confirms that for a given incident wavelength, an optimal pairing of period and slit width exists to maximize the coupling rate.

2.3. Design of the Photonic Crystal Cavity

Building on the analysis of the AEGP structure, this section focuses on the second component of the proposed infrared modulator: the photonic crystal (PC) cavity. For a one-dimensional PC, its dispersion relation is expressed as follows [35]:
k = 1 h 1 + h 2 arccos cos k 1 h 1 cos k 2 h 2 1 2 n 1 2 + n 2 2 n 1 n 2 sin k 1 h 1 sin k 2 h 2     = 1 h 1 + h 2 arccos Θ
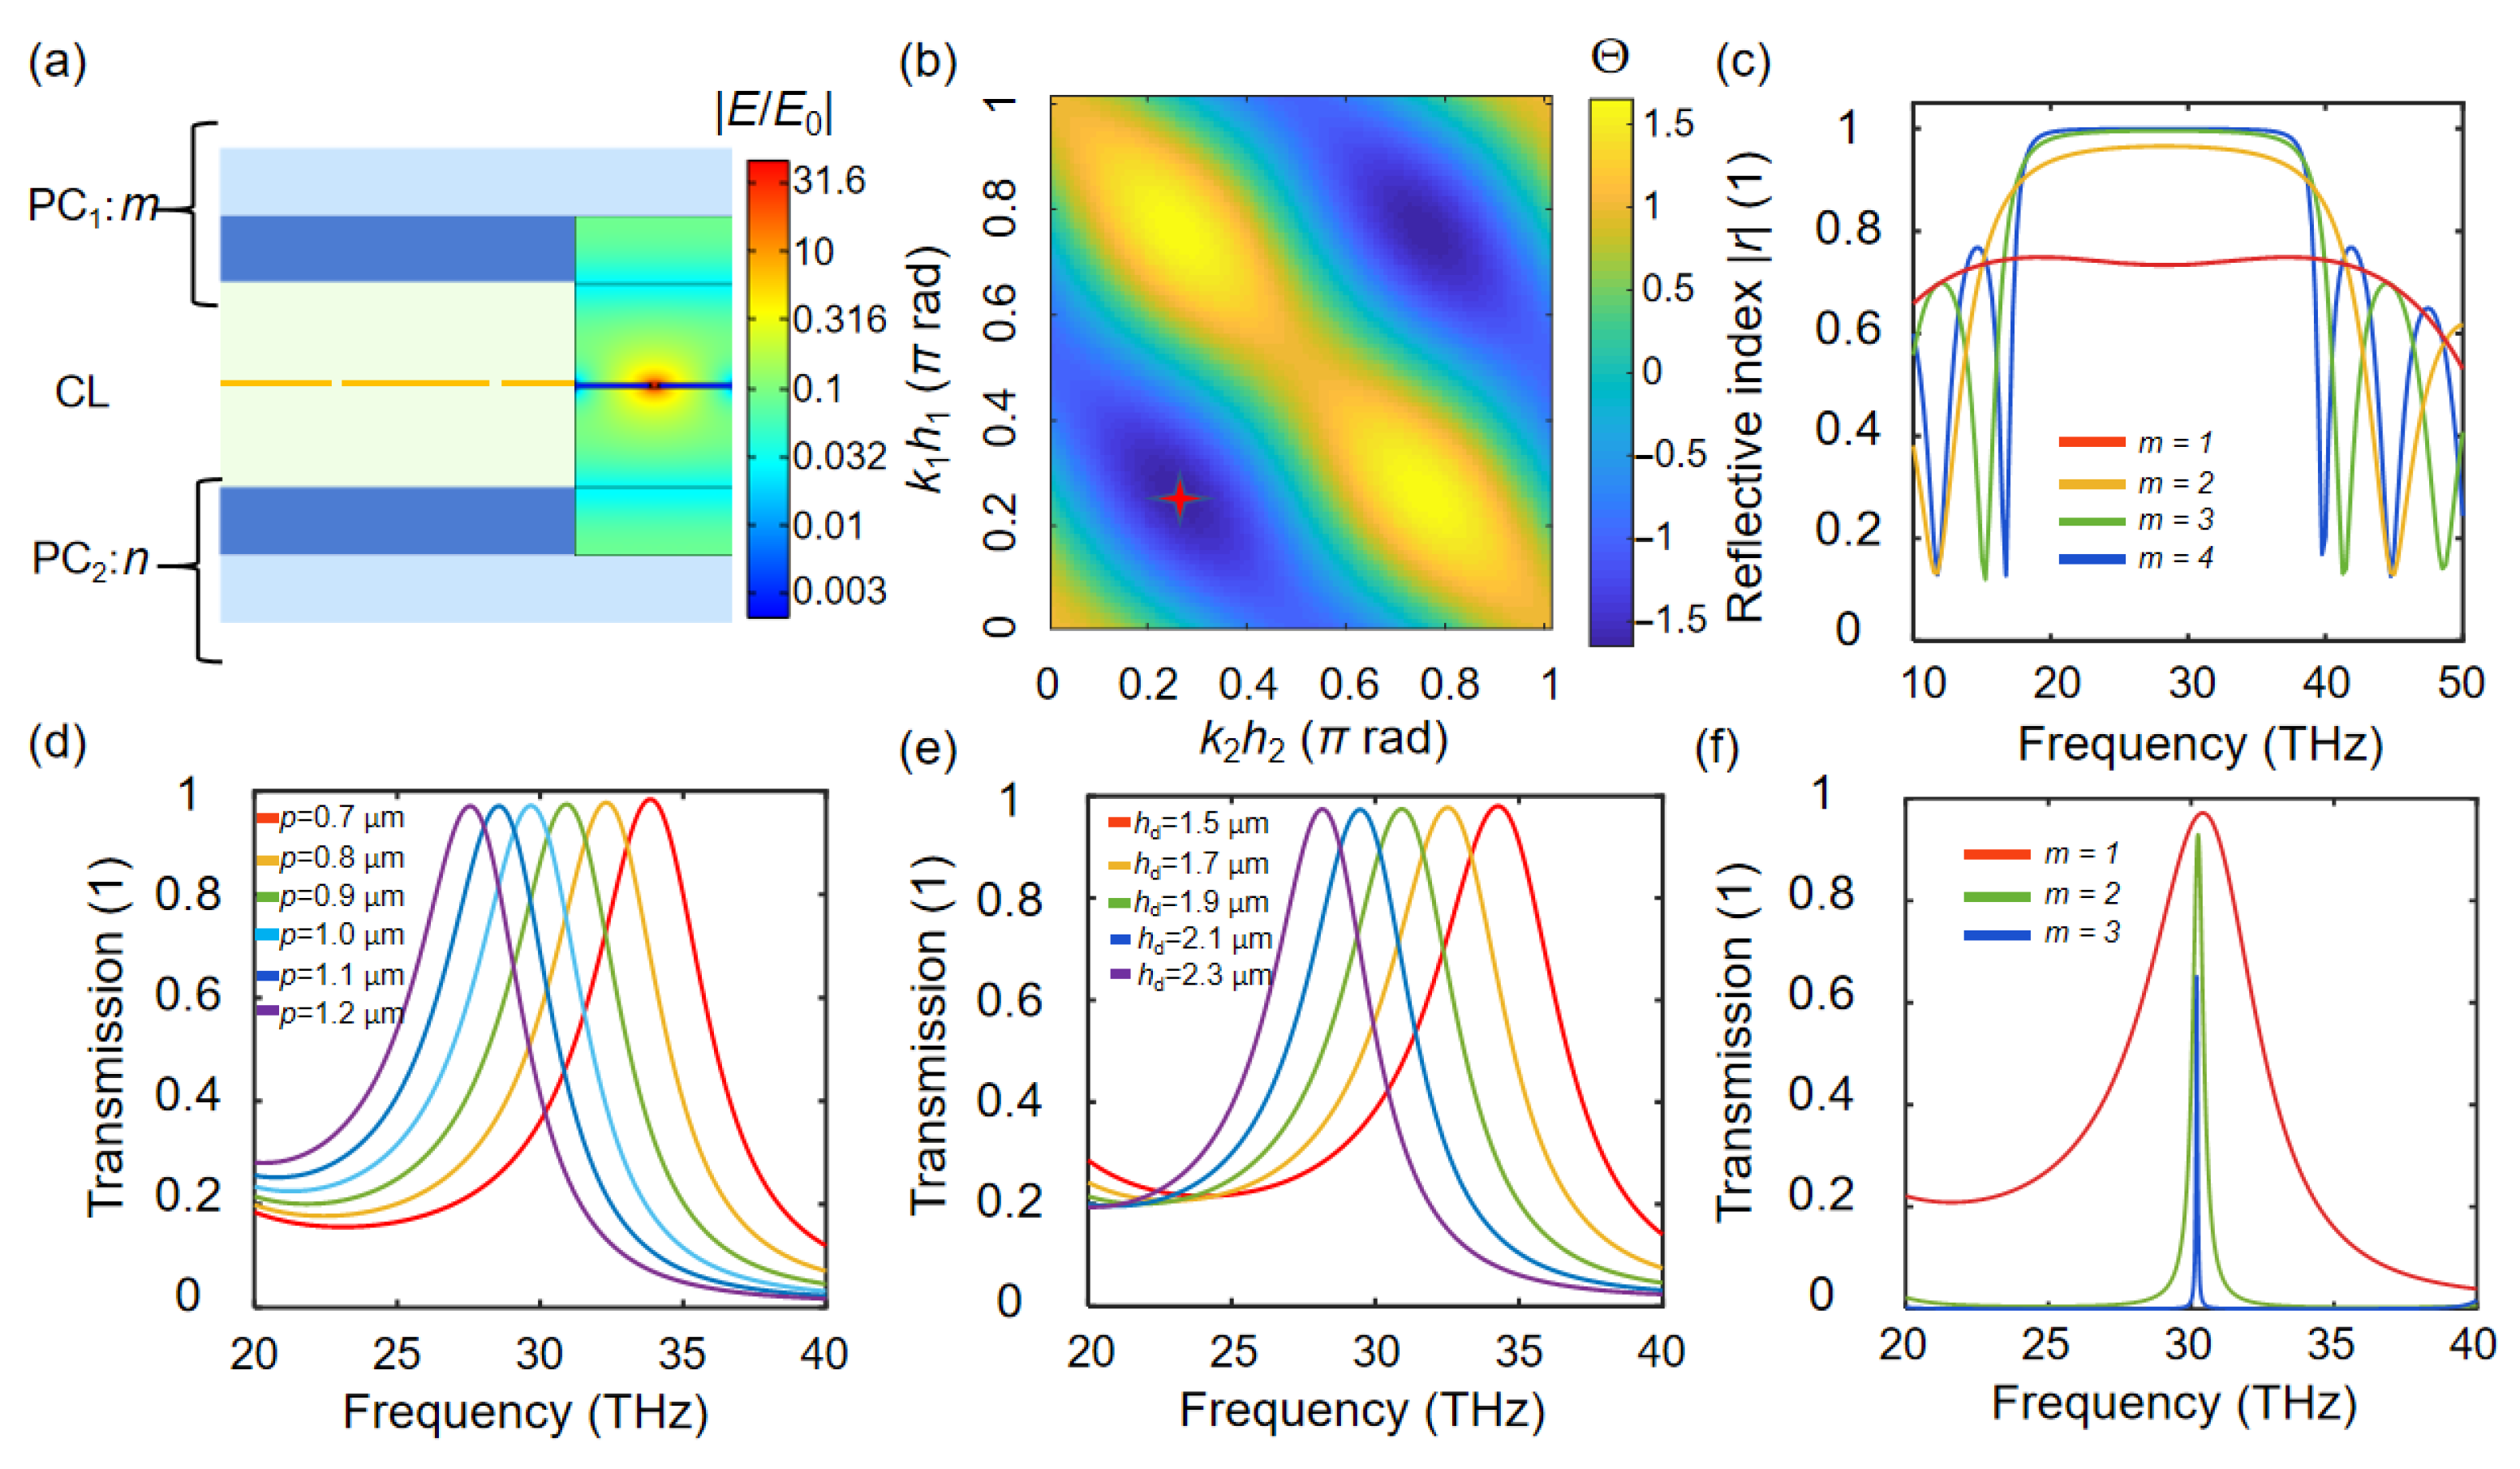
When |Θ| > 1, the Bloch wave will experience losses, which means that it hinders the incident light from passing through the PC, forming a bandgap region. When |Θ| reaches an extreme value, the single-period loss will reach its maximum, and the incident frequency at this time is the center of the bandgap. Under these conditions, the transmission is suppressed while the reflection is significantly enhanced. As shown in Figure 5b, by simulating the function with different values of k1h1 and k2h2, |Θ| reaches an extreme point when k1h1 and k2h2 equal π/2 ± π/4. Accordingly, k1h1 = k2h2 = π/4 (corresponding to the red star in the figure) is selected to achieve a thinner and lighter device. Based on this relation, at the resonance frequency of 28.3 THz, the thicknesses of the germanium layer and calcium fluoride layer are determined to be 0.6625 μm and 1.963 μm, respectively. Figure 5c presents reflection spectra of the PC with 1 to 4 Bragg periods calculated via the transfer matrix method. Within the frequency band centered at 28.3 THz, the absolute value of reflection coefficient is extremely high and rapidly approaches 1 as the number of Bragg periods increases, confirming that the selected layer thicknesses function effectively as a reflective mirror. Incorporating the AEGP structure, characterized by a 900 nm period and 60 nm slit width, into the PC resonator with one Bragg period on each side generates a defect state at 28.3 THz with a cavity thickness of 2.3 μm. At this frequency, the light intensity concentrates strongly within the metasurface slit, enhancing graphene plasmon resonance.
After determining the reflection and transmission coefficients for both the PC cavity and the AEGP structure, these values can be substituted into Equation (1) to calculate the overall transmission spectrum of the modulator. Figure 5d presents the transmission spectra for a slit width of 60 nm and a dielectric cavity thickness of 1.9 μm with PC layers m = n = 1, while the Fermi level of graphene is set to 0 eV. The results reveal that, due to the CL and the antenna breaking the periodicity of the PC, a defect state transmission peak higher than 95% is formed within the original bandgap range of 20~40 THz. As the antenna period continuously increases, the defect state transmission peak moves continuously towards the low-frequency region. Figure 5e shows the variation in the defect state frequency under different dielectric cavity thicknesses when the metallic slit antenna period is fixed at 900 nm. As the cavity thickness increases, the defect state frequency continuously decreases. These findings demonstrate that the defect state frequency of the modulator can be effectively tuned by adjusting the metallic slit antenna period and the dielectric cavity thickness.
The quantitative relationship between the defect state frequency and the thickness of the dielectric cavity or the period of the metallic antenna can be explicitly derived from Equation (1). Specifically, when the graphene Fermi level is 0 eV, Equation (1) simplifies to
T = n 1 n 0 t A t t B e i θ r Ai + r B r e i θ + ψ r Ai r B e i 2 θ + 2 ψ 1 2
where Ψ is the reflection phase of the metallic slit antenna. This phase can be fitted as Ψ = κ1ω + δ1ω2 + φ1 with κ1, δ1, and φ1 dependent on the antenna period and slit width. The transmittance of the device reaches its maximum when the absolute value of the denominator of Equation (6), denoted as Ω, attains its minimum. Therefore, the defect state frequency of the modulator can be determined by minimizing Ω. The terms rAi and rB in the denominator can also be simplified: their magnitudes are approximated by 1 and their phases can be fitted as π + κ2(2πc/ω −c/ω0), where κ2 is a fitting parameter related to the PC layers. In this study, κ2 is found to be −1.5 × 10⁵ m−1. Under these approximations, the denominator reduces to
Ω 2 r e i θ + κ 1 ω + δ 1 ω 2 + φ 1 + κ 2 2 π c / ω 2 π c / ω 2     e i 2 θ + κ 1 ω + δ 1 ω 2 + φ 1 + κ 2 2 π c / ω 2 π c / ω 2     1         = 2 r e i Φ e i 2 Φ 1
The minimum of Ω occurs when the following condition is satisfied:
cos Φ =   r  
Using Equation (8), the simulated defect state frequencies presented in Figure 5d,e were fitted, showing strong agreement and thereby validating the equation. Notably, if the defect state frequency is required to lie exactly at the center of the bandgap, Equation (8) further simplifies to the cos(θ + Ψ) = −|r|. Based on this relation, the corresponding thickness of the dielectric cavity layer is determined to be 2.3 μm.
This validated relationship, in turn, creates conditions for flexibly designing modulators to meet the requirements of different operating wavebands. Specifically, by adjusting the thickness of CL, as well as the period and slit width of the metal device, the defect state can be tuned to the target frequency. On this basis, the further modification of the nanoribbon width and spacer layer thickness of the AEGP structure, aimed at matching the plasmon resonance frequency at the maximum Fermi level with the target frequency, enables the device to achieve efficient modulation performance within the corresponding frequency band.
Furthermore, the quality factor (Q) of the defect state can be tuned by varying the number of periods of PCA and PCB, thereby enhancing the light intensity at the location of the AEGP structure and improving the transmission modulation depth. Figure 5f presents the transmission spectra of the device defect state for m = n = 1, 2, 3. As the number of periods increases, the defect state frequency remains essentially constant, while the linewidth decreases exponentially from 5 THz for one layer to 0.8 THz for two layers and 0.01 THz for three layers. In practical applications, both the operating bandwidth and modulation depth requirements must be balanced, necessitating a reasonable selection of the number of layers.

3. Results and Discussion

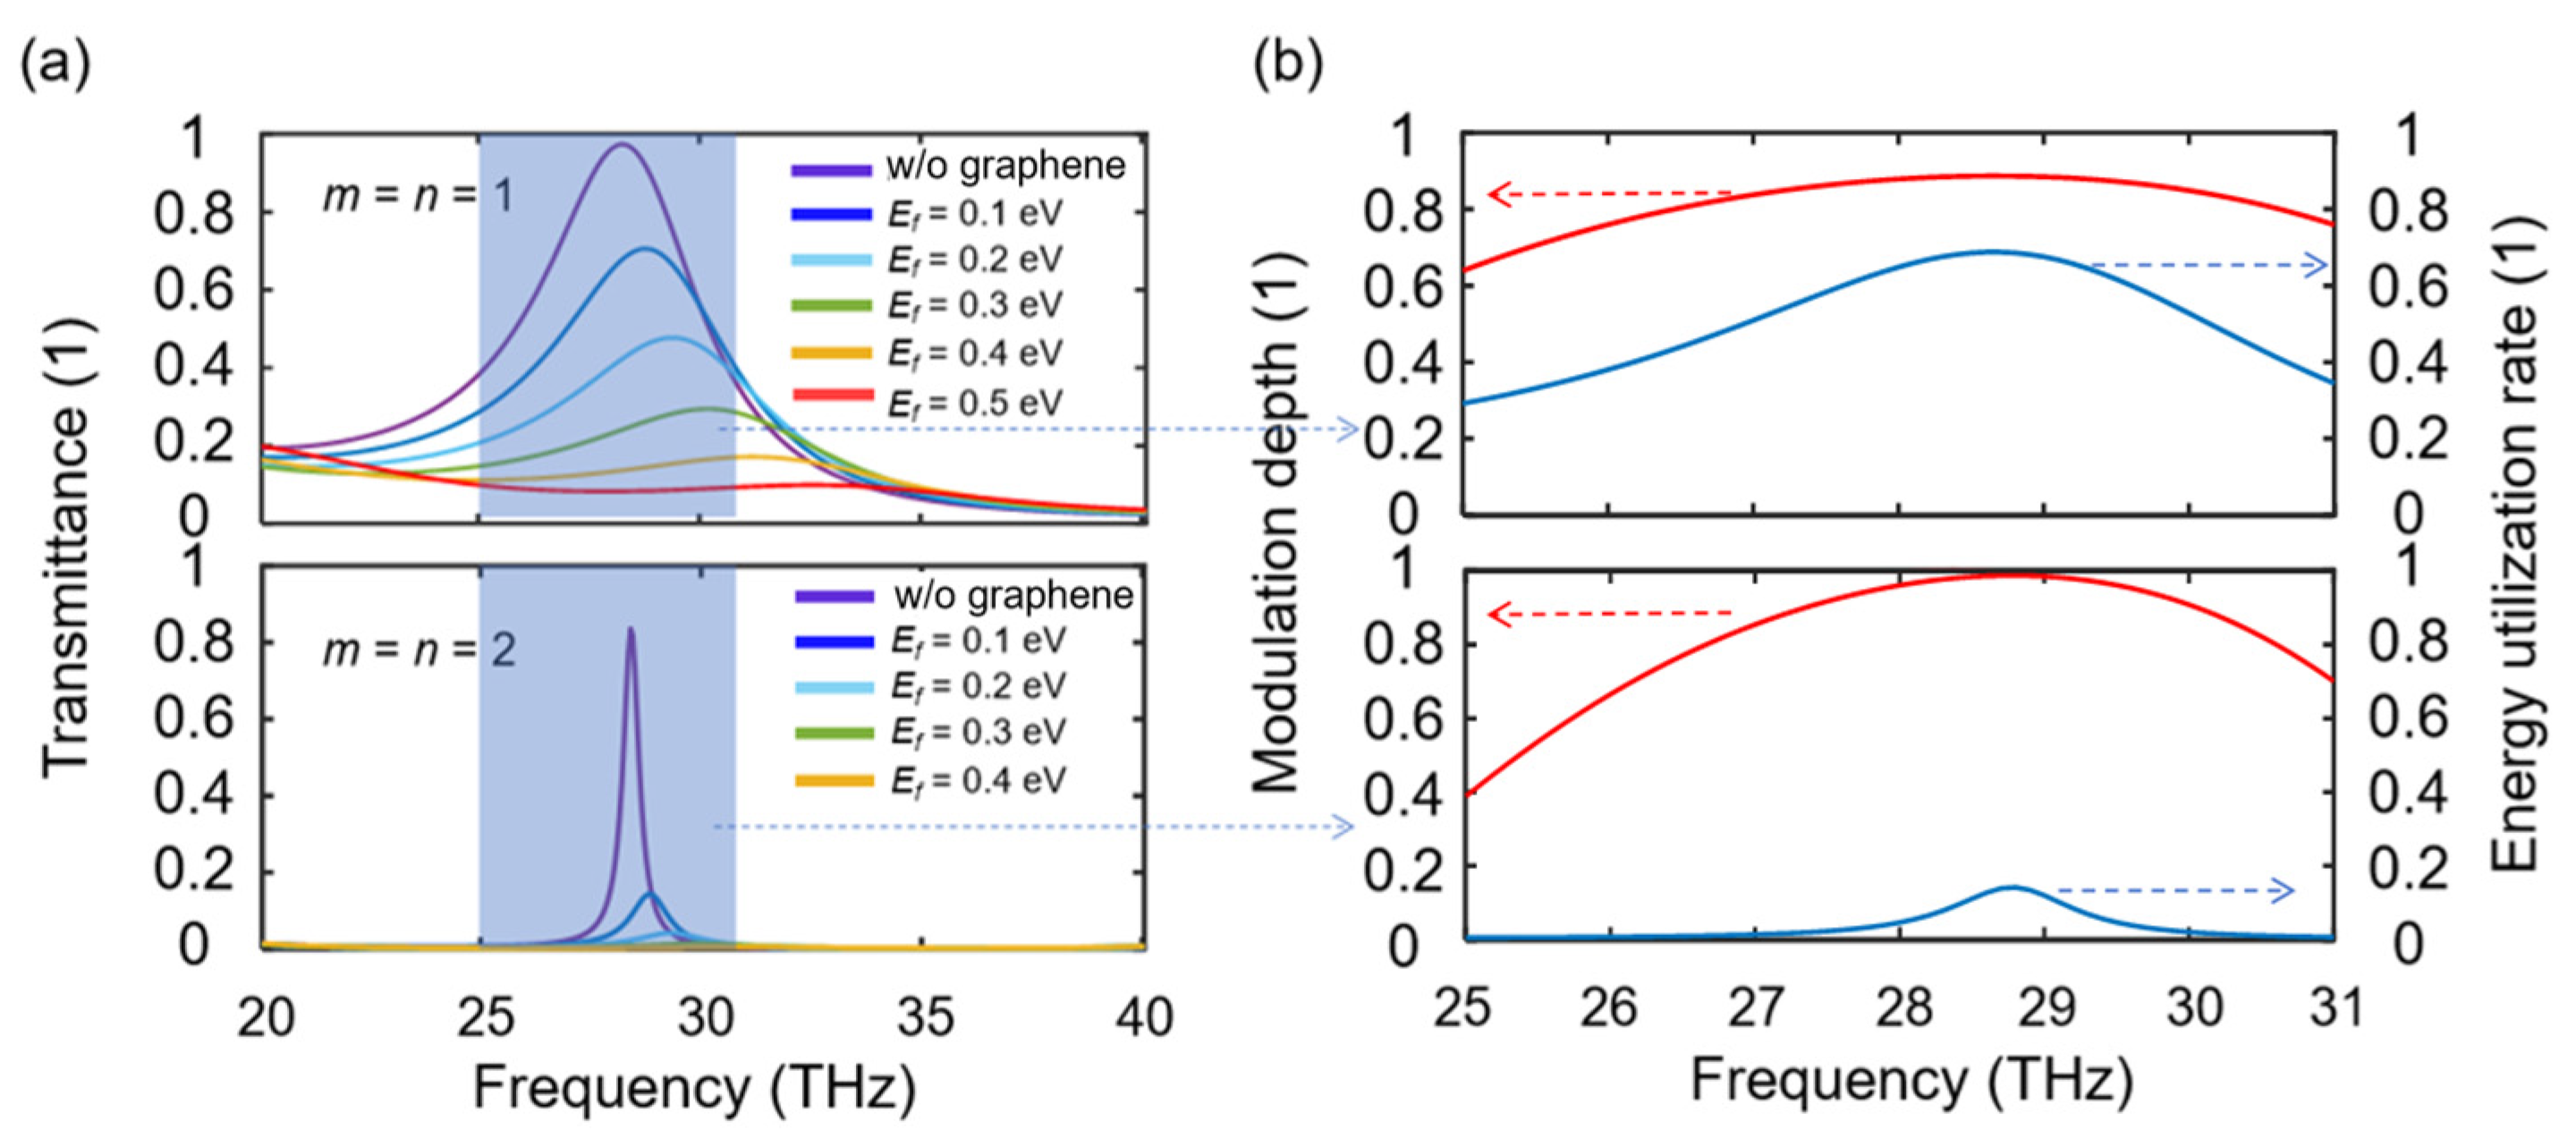
Next, we analyze the performance of the infrared modulator by tuning the Fermi energy of graphene (Ef) from 0.1 eV to 0.5 eV. In this article, the transmittances of the device at 0.1 eV and 0.5 eV are taken as the transmittance of the light-transmitting state (Tmax) and the transmittance of the light-blocking state (Tmin), respectively. The corresponding spectra, calculated using Equation (1) with m = n = 1 for PCA and PCB, are shown in the upper panel of Figure 6a. At Ef = 0.1 eV, the transmittance shows a relatively high value of 67.6% at 28.3 THz. As Ef increases, the transmittance gradually decreases, accompanied by a blue shift in the defect state frequency. The modulation depth η, defined as 1 − Tmin/Tmax, reaches 88.5% at 28.3 THz and exceeds 80% in the frequency range of 26.5–30.5 THz. Besides modulation depth, light energy utilization efficiency, denoted by Tmax, is an important parameter for characterizing the performance of the modulator. The light energy utilization efficiency in the range of 27–30 THz exceeds 50%, indicating that the device exhibits both high energy utilization efficiency and significant modulation depth in this frequency band. Compared with some previous experimental studies on mid-infrared graphene transmission modulators, the device in this work exhibits a significantly higher modulation depth along with favorable light energy utilization efficiency, as shown in Table 1. Since issues such as low carrier mobility and the limited tuning range of the Fermi level in practical devices have been taken into account during the simulation, the simulated performance indicates that it possesses favorable application potential.
As m and n of the PC layers are increased, the Q factor of the cavity is increased. The lower panel of Figure 6a shows the modulation spectra when m = n = 2. The maximum modulation depth at the defect state frequency further increases to 99%. However, in this case, since graphene still exhibits a certain degree of conductivity at 0.1 eV, the light energy utilization efficiency is only 14% at extremely high Q values. In practical applications, the m = n > 1 scheme can be adopted when the refractive index difference between high- and low-refractive-index materials is relatively small. For example, by replacing the high-refractive-index material with zinc selenide (n1 = 2.4), the Q factor of the device can be controlled more flexibly through adjusting m and n, which helps in achieving a better balance between energy utilization efficiency and modulation depth.
The sensitivity of the device to errors in structural parameters directly dictates the stringency of requirements for practical fabrication precision. Although we can regulate the coating thickness of each photonic crystal layer via the quartz crystal microbalance (QCM) method and characterize structural parameters using a scanning electron microscope (SEM) to maximize fabrication precision and achieve target defect states, such measures inevitably elevate production costs. Conversely, if the device exhibits low sensitivity to structural parameters, the necessity for these control procedures can be alleviated.
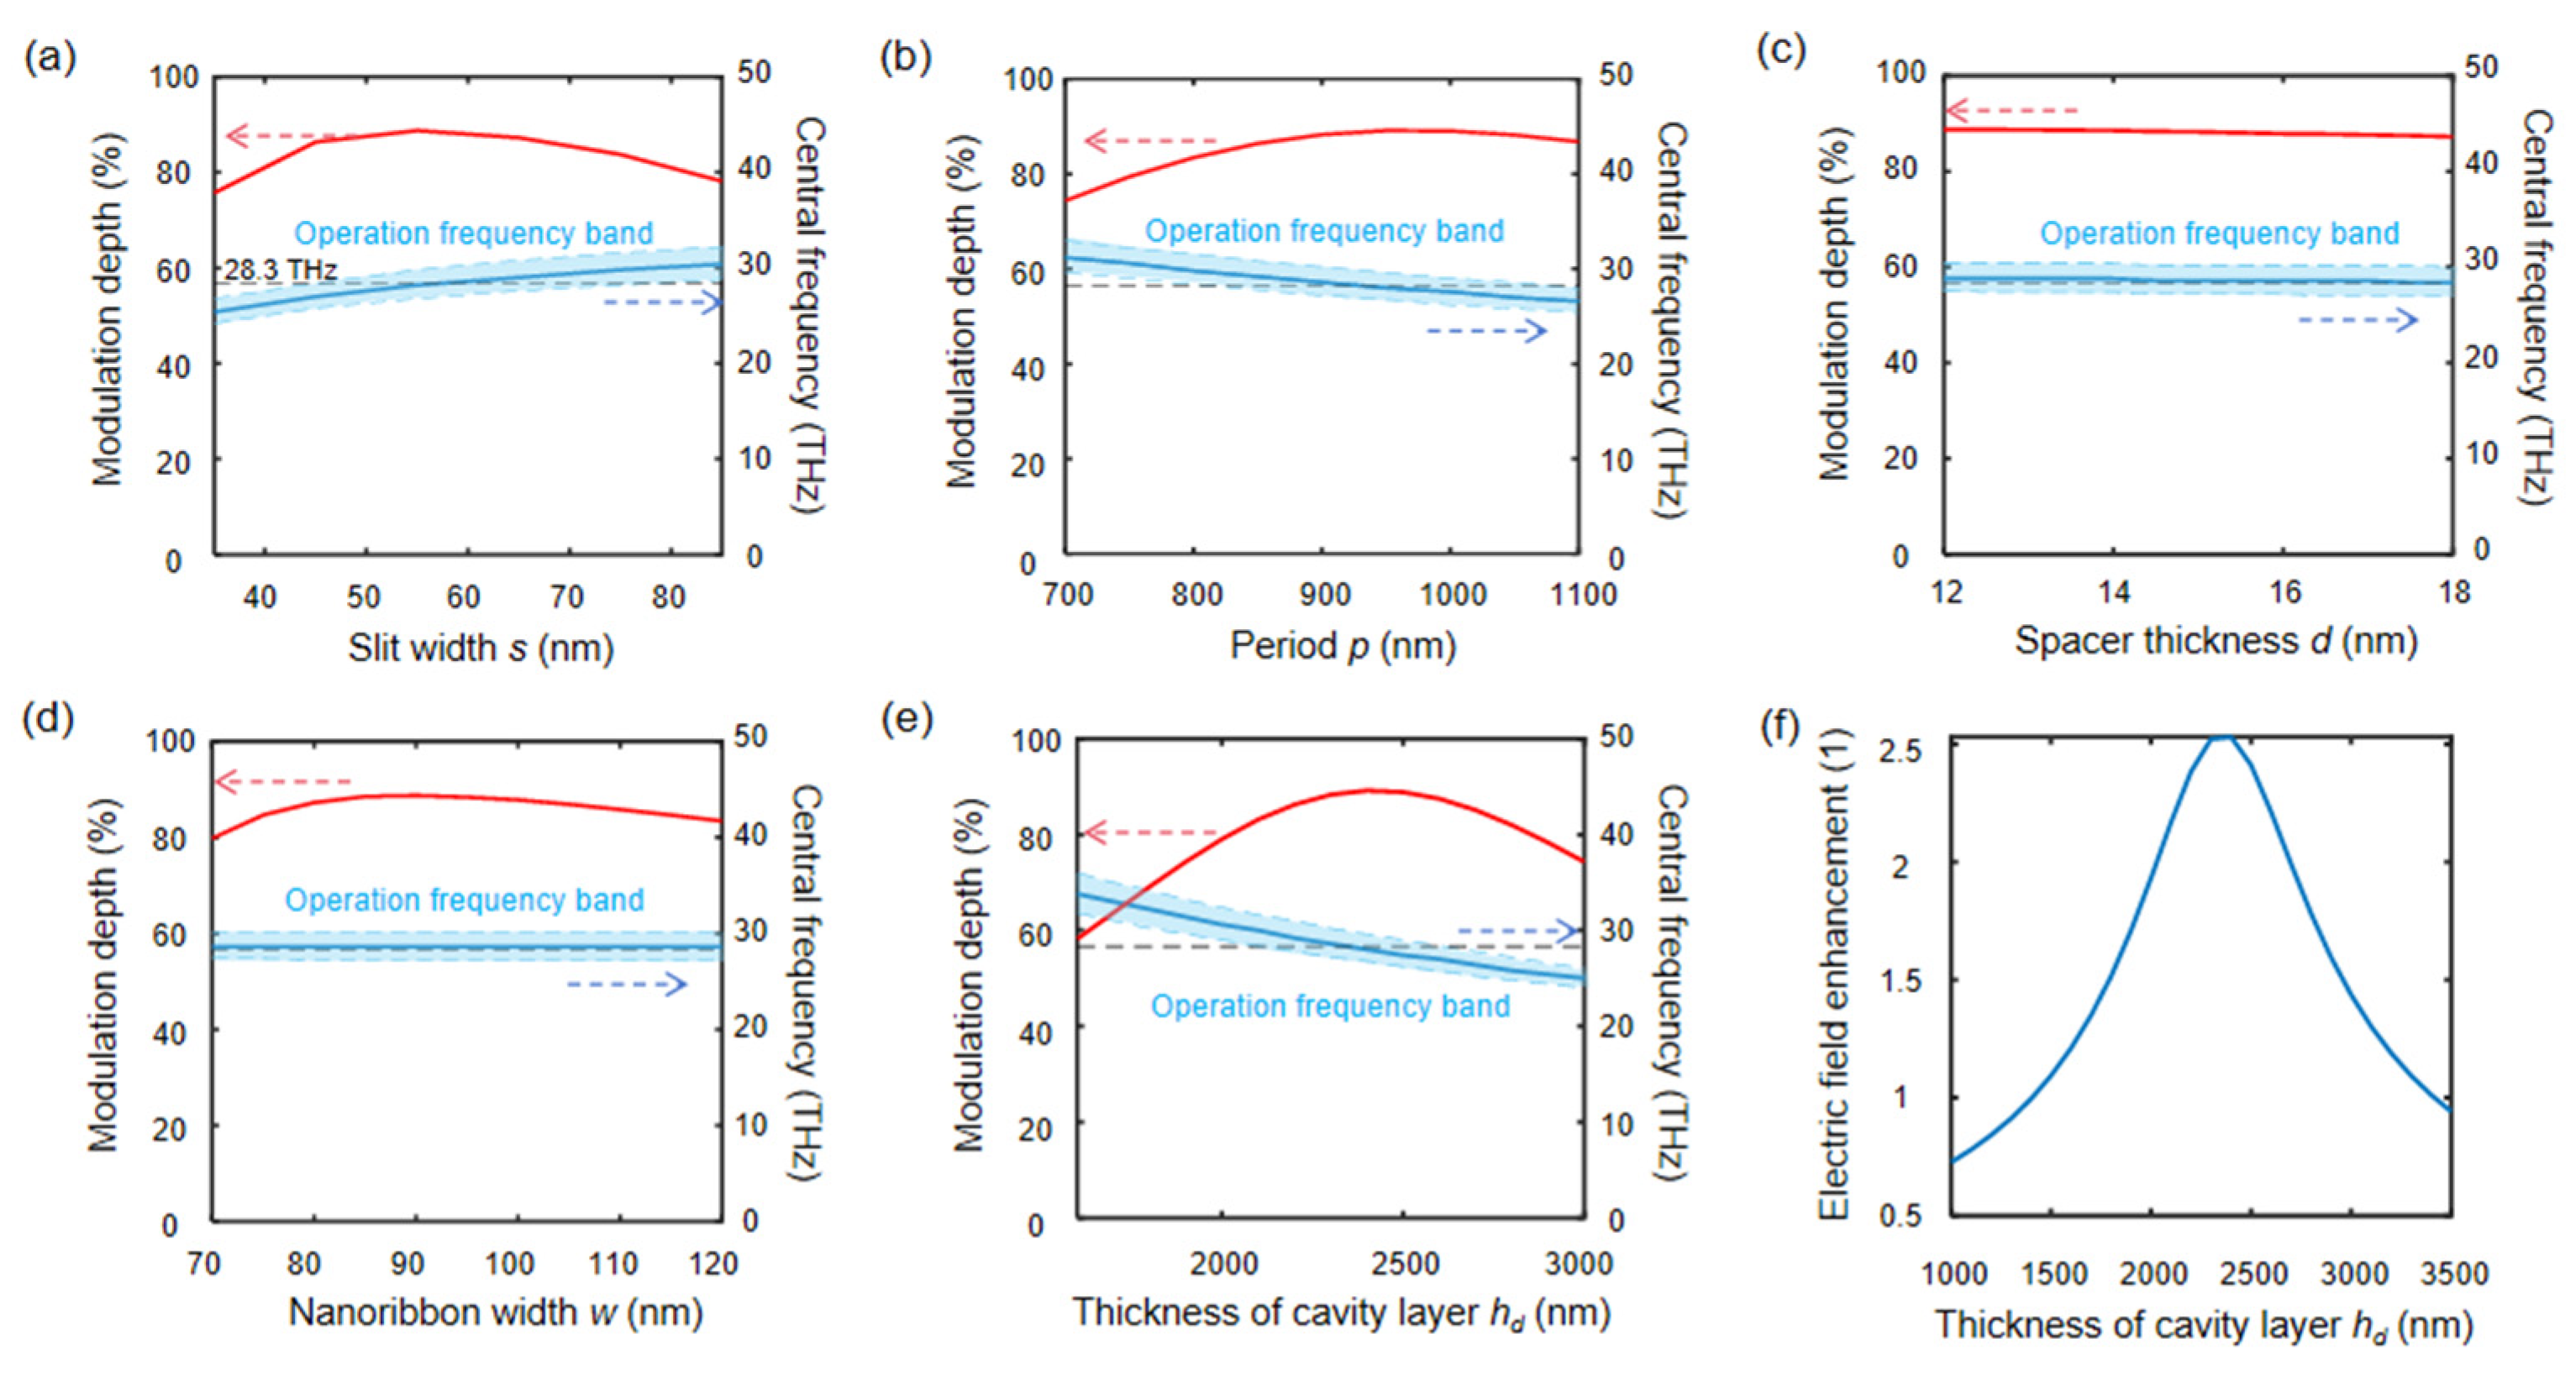
To investigate this aspect, we systematically analyzed parameter sensitivity using the m = n = 1 device as a baseline, individually varying the period, slit width, spacer layer thickness, nanoribbon width, and CL thickness. Our simulations tracked changes in modulation depth at 28.3 THz and central frequency shifts, and we marked frequency bands with Tmax exceeding 50%. As revealed in Figure 7a–e, three parameters (slit width, period, and CL thickness) predominantly affect the central frequency of the device, consequently altering modulation depth. In contrast, the spacer layer thickness and graphene nanoribbon width mainly influence modulation depth through the modulation of AEGP resonance strength without significantly shifting the operational frequency band.
The further sensitivity analysis of modulation depth and energy utilization efficiency reveals remarkable fabrication tolerance: the device maintains a Tmax of >50% and a modulation depth of >80% within −27% to +25% slit width variation (44–75 nm for a 60 nm target; Figure 7a); −8% to +21% period variation (830–1090 nm for a 900 nm target; Figure 7b); and −8% to +14% CL thickness variation (2100–2620 nm for a 2300 nm target, Figure 7e). Notably, modulation characteristics exhibit higher sensitivity to CL thickness variations, as this parameter controls the cavity interference strength and thereby the electric field enhancement factor at the AEGP structure, as shown in Figure 7f. The photonic crystal defect state provides high field enhancement, such that once the AEGP structure reaches a threshold coupling rate, the device sustains a relatively high modulation depth. Owing to the targeted structural optimization for AEGP coupling rate during the initial design phase, the actual coupling rate is significantly higher than this threshold. This explains why spacer thickness and nanoribbon width can tolerate ±25% variations while preserving >80% modulation depth. Additionally, thermal analysis (Section S2 of the Supplementary Materials) confirms excellent environmental stability across 220–350 K. Thermally induced dimensional changes remain below 0.3%, and graphene conductivity [36] varies by less than 2%, both well within the tolerance ranges identified in our error analysis, greatly enhancing the practical applicability of the device under real-world conditions.
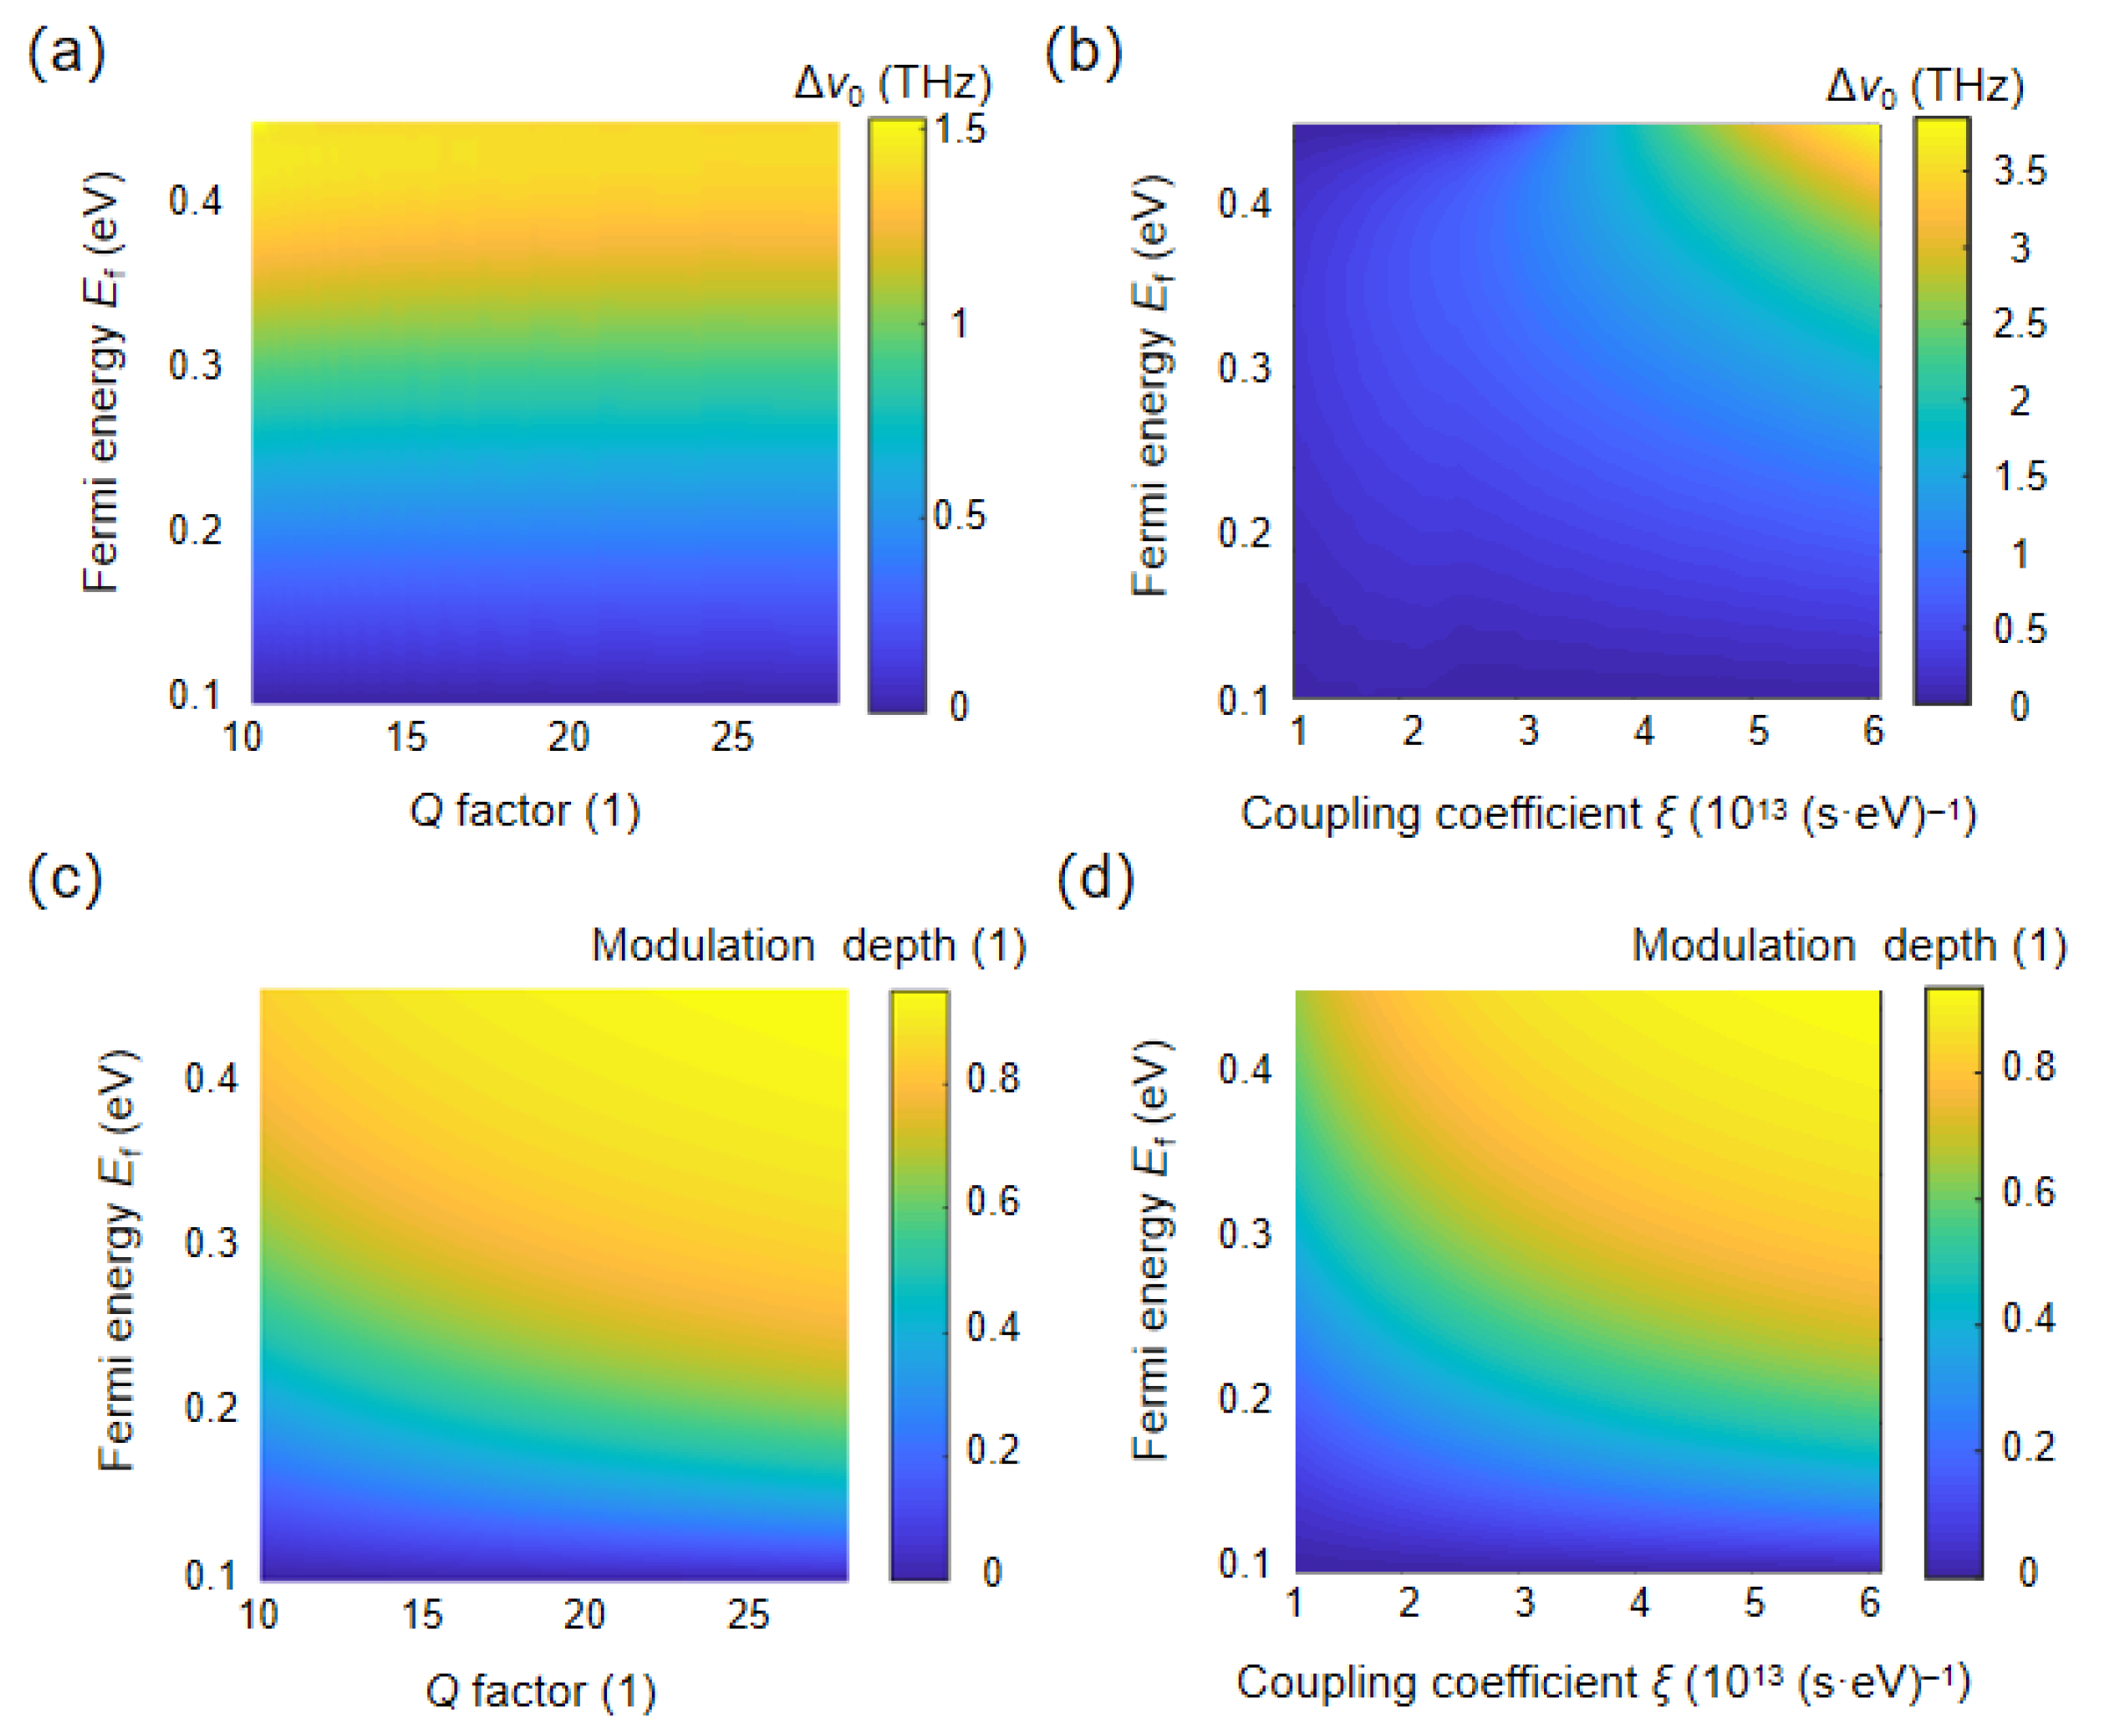
The exceptionally high modulation depth of the infrared modulator is attributed to the significantly enhanced coupling between graphene plasmons and infrared light, facilitated by metallic slit antennas and PC defect states. To substantiate this, a quantitative analysis of the effects of the coupling rate and the quality factor of photonic crystal defect states on modulation depth is conducted. Figure 8b depict the variations in the operational frequency ω0 and modulation depth η as functions of the coupling coefficient ξ, which relates to the coupling rate through γ1 = ξEf As the coupling coefficient increases, the frequency of the defect state shifts progressively toward higher values (Figure 8a), and the modulation depth increases due to the concurrent rise in Ef and ξ (i.e., γ1 increases). This finding demonstrates that a higher coupling rate leads to a greater modulation depth.
The exceptionally high modulation depth of the infrared modulator is attributed to the significantly enhanced coupling between graphene plasmons and infrared light, facilitated by metallic slit antennas and PC defect states. To substantiate this, a quantitative analysis of the effects of the coupling rate and the quality factor of photonic crystal defect states on modulation depth is conducted. Figure 8a,b depict the variations in the operational frequency ν0 = ω0/(2π) and modulation depth η as functions of the coupling coefficient ξ, which relates to the coupling rate through γ1 = ξEf As the coupling coefficient increases, the frequency of the defect state shifts progressively toward higher values (Figure 6a), and the modulation depth increases due to the concurrent rise in Ef and ξ (i.e., γ1 increases). This finding demonstrates that a higher coupling rate leads to a greater modulation depth.
Figure 8c,d illustrate the dependence of the operational frequency ω0 and modulation depth η on the Q factor of the PC defect states. While the operation frequency remains nearly constant with varying Q factors, the modulation depth increases as the Q factor rises. Notably, when the Q factor reaches 28, a modulation depth exceeding 80% can be achieved despite a very low Fermi level of below 0.25 eV.
These findings indicate that by enhancing the coupling between graphene plasmons and light, a high modulation depth can be attained even with graphene of low quality. Moreover, by optimizing the structural parameters of the device, the operating frequency, bandwidth, and modulation depth can be flexibly tuned to meet the requirements of various optical communication applications.

4. Conclusions

This article presents a novel graphene free-space infrared transmission modulator exhibiting high modulation depth, achieved through significantly enhanced coupling between graphene plasmons and infrared light via two mechanisms. First, the resonance intensity of graphene plasmons is amplified by utilizing the light funneling effect of metallic slit antennas, which increases the mode coupling rate at 0.5 eV from 1.9 × 10¹² s−1 to over 1 × 10¹³ s−1. Second, the device leverages the high photon density associated with photonic crystal defect states to enhance the light intensity at the graphene modulator, thereby improving the efficiency of graphene plasmon excitation. Considering experimentally attainable graphene quality, characterized by a typical relaxation time of 10 fs and a Fermi level tuning range below 0.5 eV, the device achieves a high-speed transmission modulation depth exceeding 80% within an operating bandwidth of 4 THz in the mid-infrared region. This capability offers a promising solution for modulation of infrared free-space optical communication signals. Moreover, the operational bandwidth of the device can be extended to the far-infrared and terahertz regimes, providing a foundation for the advancement of terahertz and infrared signal modulation technologies.

Supplementary Materials

The following supporting information can be downloaded at: https://www.mdpi.com/article/10.3390/photonics12080800/s1. Figure S1: Thermal analysis of the device.

Author Contributions

Conceptualization, J.D. and L.T.; methodology, Q.Z.; software, J.D.; validation, X.B., H.Z., B.W., and H.S. (Hongyan Shi): formal analysis, J.D.; investigation, Q.Z.; resources, C.L. and Y.L. (Yang Liu); data curation, J.D.; writing—original draft preparation, J.D.; writing—review and editing, L.T. and B.W.; visualization, J.D.; supervision, H.S. (Haofei Shi) and Y.L. (Yang Liu); project administration, Y.L. (Yueguang Lu); funding acquisition, Q.Z. and L.T. All authors have read and agreed to the published version of the manuscript.

Funding

This research was funded by National Natural Science Foundation of China, grant numbers 62101586 and 62005281.

Data Availability Statement

Data are contained within the article.

Conflicts of Interest

The authors declare no conflicts of interest.

References

  1. Chen, F.S. Modulators for Optical Communications. Proc. IEEE 1970, 58, 1440–1457. [Google Scholar] [CrossRef]
  2. Thylén, L.; Westergren, U.; Holmström, P.; Schatz, R.; Jänes, P. Recent Developments in High-Speed Optical Modulators. In Optical Fiber Telecommunications V A; Kaminow, I.P., Li, T., Willner, A.E., Eds.; Academic Press: San Diego, CA, USA, 2008; pp. 183–220. [Google Scholar]
  3. Xu, M.; He, M.; Zhang, H.; Jian, J.; Pan, Y.; Liu, X.; Chen, L.; Meng, X.; Chen, H.; Li, Z.; et al. High-Performance Coherent Optical Modulators Based on Thin-Film Lithium Niobate Platform. Nat. Commun. 2020, 11, 3911. [Google Scholar] [CrossRef] [PubMed]
  4. Liu, L.; Liu, N.; Zhang, J.; Zhu, Z.; Liu, K. High Performance Electro-Optic Modulator Based on Thin-Film Lithium Niobate. Optoelectron. Lett. 2022, 18, 583–587. [Google Scholar] [CrossRef]
  5. Hou, S.; Hu, H.; Liu, Z.; Xing, W.; Zhang, J.; Hao, Y. High-Speed Electro-Optic Modulators Based on Thin-Film Lithium Niobate. Nanomaterials 2024, 14, 867. [Google Scholar] [CrossRef] [PubMed]
  6. Hou, S.; Hu, H.; Xing, W.; Liu, Z.; Zhang, J.; Hao, Y. Improving Linewidth and Extinction Ratio Performances of Lithium Niobate Ring Modulator Using Ring-Pair Structure. Adv. Photonics Res. 2023, 4, 2300169. [Google Scholar] [CrossRef]
  7. Liu, J.J.; Stann, B.L.; Klett, K.K.; Cho, P.S.; Pellegrino, P.M. Mid and Long-Wave Infrared Free-Space Optical communication. In Laser Communication and Propagation Through the Atmosphere and Oceans VIII; SPIE: Washington, DC, USA, 2019; pp. 1–18. [Google Scholar]
  8. Grillot, F.; Poletti, T.; Pes, S. Progress in Mid-Infrared Optoelectronics for High-Speed Free-Space Data Throughput. APL Photonics 2025, 10, 010905. [Google Scholar] [CrossRef]
  9. Dong, W.; Qiu, Y.; Zhou, X.; Banas, A.; Banas, K.; Breese, M.B.; Cao, T.; Simpson, R.E. Tunable mid-infrared phase-change metasurface. Adv. Opt. Mater. 2018, 6, 1701346. [Google Scholar] [CrossRef]
  10. Guo, K.; Li, X.; Ai, H.; Ding, X.; Wang, L.; Wang, W.; Guo, Z. Tunable oriented mid-infrared wave based on metasurface with phase change material of GST. Results Phys. 2022, 34, 105269. [Google Scholar] [CrossRef]
  11. Dawood, N.Y.M.; Younis, B.M.; Areed, N.F.F.; Hameed, M.F.O.; Obayya, S.S.A. Mid-infrared optical modulator based on silicon D-shaped photonic crystal fiber with VO2 material. Appl. Opt. 2021, 60, 9488–9496. [Google Scholar] [CrossRef]
  12. Sun, R.; Zhou, P.; Ai, W.; Liu, Y.; Li, Y.; Jiang, R.; Li, W.; Weng, X.; Bi, L.; Deng, L. Broadband switching of mid-infrared atmospheric windows by VO2-based thermal emitter. Opt. Express 2019, 27, 11537–11546. [Google Scholar] [CrossRef]
  13. Chen, J.H.; Jang, C.; Xiao, S.; Ishigami, M.; Fuhrer, M.S. Intrinsic and Extrinsic Performance Limits of Graphene Devices on SiO2. Nat. Nanotechnol. 2008, 3, 206–209. [Google Scholar] [CrossRef]
  14. Liu, M.; Yin, X.; Ulin-Avila, E.; Geng, B.; Zentgraf, T.; Ju, L.; Wang, F.; Zhang, X. A Graphene-Based Broadband Optical Modulator. Nature 2011, 474, 64–67. [Google Scholar] [CrossRef] [PubMed]
  15. Qu, S.; Ma, C.; Wang, S.; Liu, H.; Dong, L. Modulation Speed Limits of a Graphene-Based Modulator. Opt. Quantum Electron. 2018, 50, 105. [Google Scholar] [CrossRef]
  16. Fang, Z.; Wang, Y.; Schlather, A.E.; Liu, Z.; Ajayan, P.M.; García de Abajo, F.J.; Nordlander, P.; Zhu, X.; Halas, N.J. Active tunable absorption enhancement with graphene nanodisk arrays. Nano Lett. 2014, 14, 299–304. [Google Scholar] [CrossRef] [PubMed]
  17. Mousavi, S.H.; Kholmanov, I.; Alici, K.B.; Purtseladze, D.; Arju, N.; Tatar, K.; Fozdar, D.Y.; Suk, J.W.; Hao, Y.; Khanikaev, A.B.; et al. Inductive tuning of Fano-resonant metasurfaces using plasmonic response of graphene in the mid-infrared. Nano Lett. 2013, 13, 1111–1117. [Google Scholar] [CrossRef]
  18. Nong, J.; Tang, L.; Lan, G.; Luo, P.; Li, Z.; Huang, D.; Yi, J.; Shi, H.; Wei, W. Enhanced graphene plasmonic mode energy for highly sensitive molecular fingerprint retrieval. Laser Photonics Rev. 2021, 15, 2000300. [Google Scholar] [CrossRef]
  19. Lan, G.; Tang, L.; Dong, J.; Nong, J.; Luo, P.; Li, X.; Li, Z.; Zhang, Y.; Dai, Y.; Wang, W.; et al. Enhanced asymmetric light-plasmon coupling in graphene nanoribbons for high-efficiency transmissive infrared modulation. Laser Photonics Rev. 2024, 18, 2300469. [Google Scholar] [CrossRef]
  20. Fallahi, A.; Perruisseau-Carrier, J. Design of tunable biperiodic graphene metasurfaces. Phys. Rev. B 2012, 86, 195408. [Google Scholar] [CrossRef]
  21. Zhang, Y.; Feng, Y.; Zhu, B.; Zhao, J.; Jiang, T. Graphene based tunable metamaterial absorber and polarization modulation in terahertz frequency. Opt. Express 2014, 22, 22743–22752. [Google Scholar] [CrossRef]
  22. Tang, B.; Jia, Z.; Huang, L.; Su, J.; Jiang, C. Polarization-controlled dynamically tunable electromagnetically induced transparency-like effect based on graphene metasurfaces. IEEE J. Sel. Top. Quantum Electron. 2020, 27, 1–6. [Google Scholar] [CrossRef]
  23. Hwang, E.H.; Das Sarma, S. Dielectric function, screening, and plasmons in two-dimensional graphene. Phys. Rev. B 2007, 75, 205418. [Google Scholar] [CrossRef]
  24. Kanayama, K.; Nagashio, K.; Nishimura, T.; Toriumi, A. Large Fermi Energy Modulation in Graphene Transistors with High-Pressure O2-Annealed Y2O3 Topgate Insulators. Appl. Phys. Lett. 2014, 104, 2024–2490. [Google Scholar] [CrossRef]
  25. Xia, Y.; Wang, J.; Zhang, Y.; Shan, Y.; Dai, Y.; Chen, A.; Shen, T.; Wu, S.; Liu, X.; Shi, L.; et al. Transmission-type optical modulator based on graphene plasmonic resonator integrated with off-resonant Au structure. Adv. Opt. Mater. 2020, 8, 2000264. [Google Scholar] [CrossRef]
  26. Kim, S.; Jang, M.S.; Brar, V.W.; Tolstova, Y.; Mauser, K.W.; Atwater, H.A. Electronically tunable extraordinary optical transmission in graphene plasmonic ribbons coupled to subwavelength metallic slit arrays. Nat. Commun. 2016, 7, 12323. [Google Scholar] [CrossRef] [PubMed]
  27. Ramanujam, N.R.; Amiri, I.S.; Taya, S.A.; Olyaee, S.; Udaiyakumar, R.; Pasumpon Pandian, A.; Joseph Wilson, K.S.; Mahalakshmi, P.; Yupapin, P.P. Enhanced sensitivity of cancer cell using one dimensional nano composite material coated photonic crystal. Microsyst. Technol. 2019, 25, 189–196. [Google Scholar] [CrossRef]
  28. van der Mee, C.; Contu, P.; Pintus, P. One-dimensional photonic crystal design. J. Quant. Spectrosc. Radiat. Trans. 2010, 111, 214–225. [Google Scholar] [CrossRef]
  29. Yue, Y.; Gong, J.P. Tunable one-dimensional photonic crystals from soft materials. J. Photochem. Photobiol. C 2015, 23, 45–67. [Google Scholar] [CrossRef]
  30. Fei, Z.; Goldflam, M.D.; Wu, J.S.; Dai, S.; Wagner, M.; McLeod, A.S.; Liu, M.K.; Post, K.W.; Zhu, S.; Janssen, G.C.A.M.; et al. Edge and Surface Plasmons in Graphene Nanoribbons. Nano Lett. 2015, 15, 8271–8276. [Google Scholar] [CrossRef]
  31. Lee, I.H.; Yoo, D.; Avouris, P.; Low, T.; Oh, S.H. Graphene acoustic plasmon resonator for ultrasensitive infrared spectroscopy. Nat. Nanotechnol. 2019, 14, 313–319. [Google Scholar] [CrossRef]
  32. Fan, S.; Suh, W.; Joannopoulos, J.D. Temporal coupled-mode theory for the Fano resonance in optical resonators. J. Opt. Soc. Am. A 2003, 20, 569–572. [Google Scholar] [CrossRef]
  33. Suh, W.; Wang, Z.; Fan, S. Temporal coupled-mode theory and the presence of non-orthogonal modes in lossless multimode cavities. IEEE J. Quantum Electron. 2004, 40, 1511–1518. [Google Scholar]
  34. Tang, L.L.; Nong, J.P.; Wei, W.; Zhang, S.; Zhu, Y.H.; Shang, Z.G.; Yi, J.M.; Wang, W. Mode Energy of Graphene Plasmons and Its Role in Determining The Local Field Magnitudes. Opt. Express 2018, 26, 6214–6221. [Google Scholar] [CrossRef]
  35. Russel, P.S.J.; Birks, T.A.; Lloyd-Lucas, F.D. Photonic bloch waves and photonic band gaps. In Confined Electrons and Photons; Burstein, E., Weisbuch, C., Eds.; Plenum: New York, NY, USA, 1995; pp. 585–633. [Google Scholar]
  36. Falkovsky, L.A.; Pershoguba, S.S. Optical Far-Infrared Properties of a Graphene Monolayer and Multilayer. Phys. Rev. B 2007, 76, 153410. [Google Scholar] [CrossRef]
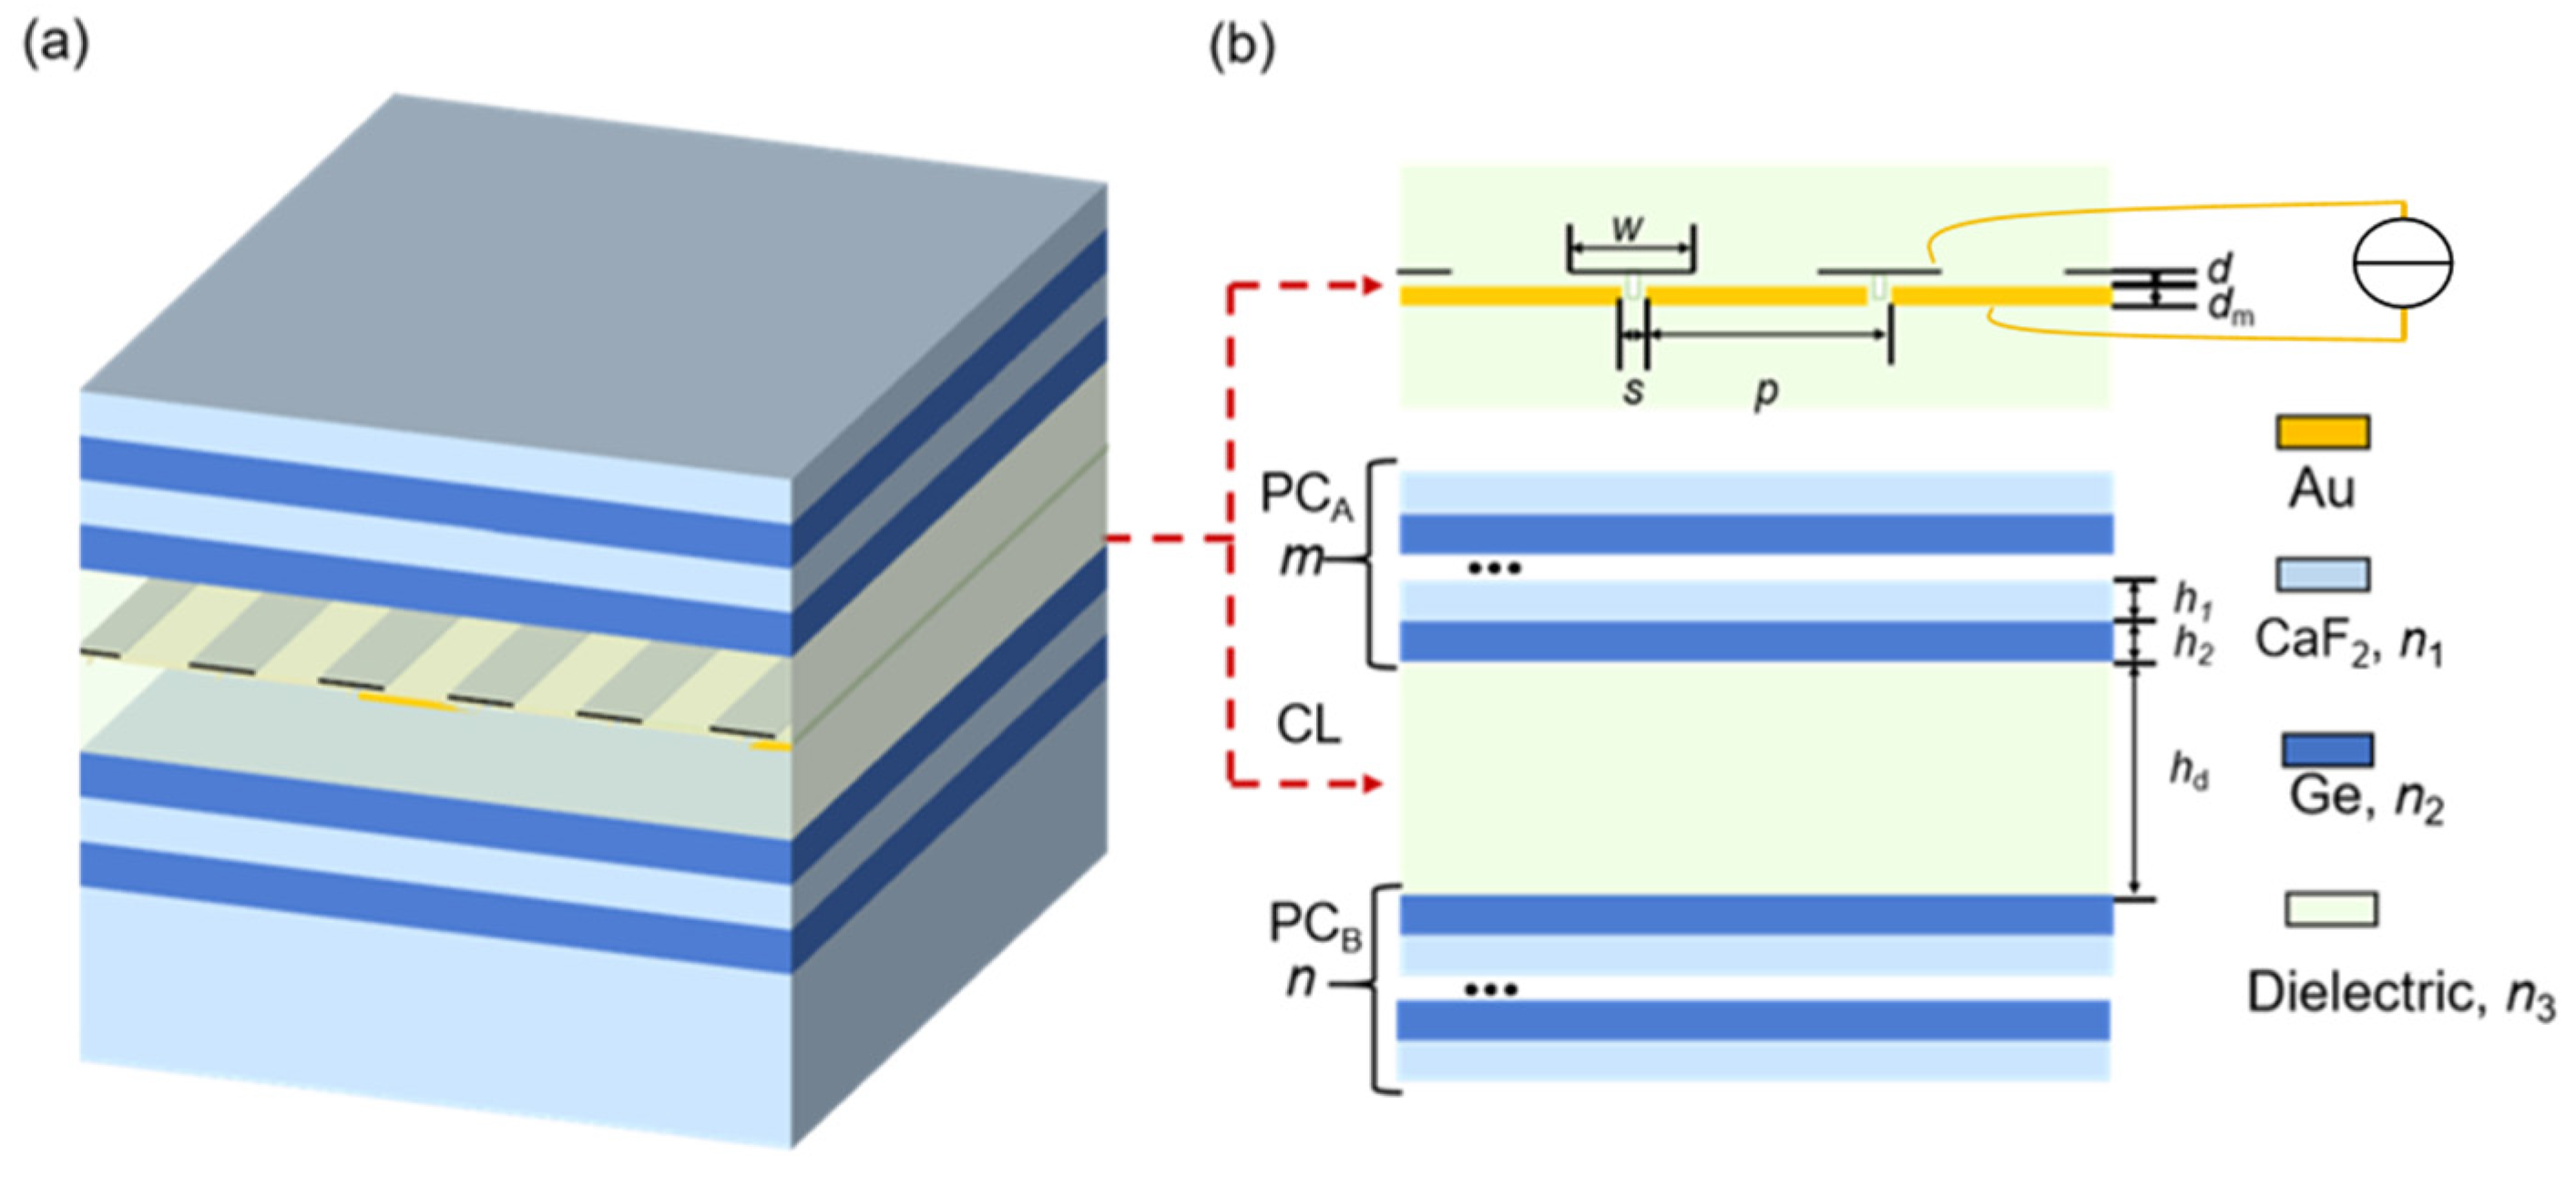
Figure 1. Graphene metasurface enhancement scheme via metallic slit antennas and photonic crystal defect states. (a) Schematic of the device integrating graphene plasmonic metasurface into a 1D photonic crystal (PC) cavity. (b) Top: Detailed view of the graphene plasmonic metasurface with suspended graphene nanoribbons (width w) over gold slits (width s) at period p. Bottom: Structure of the 1D PC cavity with low/high refractive index layers of thicknesses h1 and h2, cavity thickness hd, and PC periods m and n on either side.
Photonics 12 00800 g001
Figure 2. Mechanism analysis of the light funnel effect of the large-period metallic slit antenna. (a) The concentration schematic diagram of the large-period metallic slit antenna, where the dashed line represents the integration plane of the field enhancement coefficient; (b) the field enhancement coefficient of different metallic slit antennas with varying periods and slit widths; (c) the transmittance of different metallic slit antenna structures.
Photonics 12 00800 g002
Figure 3. Analysis of the optical characteristics of graphene plasmon modes in AEGP structures. (a) Energy flow diagram of the AEGP structure, where the length of red arrows denotes the logarithmic magnitude of the Poynting vector and the direction indicates its orientation, with the following parameters: period, p = 900 nm; slit width, s = 60 nm; dielectric layer thickness, d = 15 nm; nanoribbon width, w = 96 nm; calcium fluoride-encapsulated metasurface; Fermi level, Ef = 0.5 eV; and carrier relaxation time, τ = 10 fs. (b) Energy flow diagram of graphene nanoribbon arrays with period 234 nm and nanoribbon width 117 nm. (c) Local structures of the AEGP structure and nanoribbon arrays. (d) Electric field distributions of the AEGP structure and nanoribbon arrays at 28.3 THz. (e) Absorption rates of the graphene nanoribbon array (dashed lines) and the proposed structure (solid lines) at varying Fermi levels. (f) Fitting results for the resonance frequency of the AEGP structure at Ef = 0.5 eV with period p = 800 nm and slit width s = 60 nm.
Photonics 12 00800 g003
Figure 4. TCMT analysis results for the AEGP structure. (a) Comparison of optical spectra from TCMT and finite element simulations; (b) variation in coupling rate with Fermi level for AEGP and GNR structures at a fixed slit width of 60 nm; (c) dependence of coupling rate on dielectric layer thickness and metallic slit antenna period; (d) dependence of coupling rate on slit width and metallic slit antenna period with dielectric layer thickness and nanoribbon width fixed at 15 nm and 100 nm, respectively.
Photonics 12 00800 g004
Figure 5. Analysis of the defect modes of PC resonators loaded with AEGP metasurface. (a) Structural diagram and resonant electric field gain diagram; (b) dissipation analysis of Bloch waves of the PC; (c) the reflection spectrum of the PC with different layers; (d) the frequency between the defect state and the period of the metallic slit antenna; (e) the relationship between the defect frequency and the thickness of the dielectric cavity; (f) the defects of the PC cavity with different layers.
Photonics 12 00800 g005
Figure 6. Analysis of modulation characteristics of the device. (a) Transmission spectra of the devices at varying Fermi levels, with the device architecture comprising photonic crystals of alternating 1.963 μm thick calcium fluoride layers and 0.6625 μm thick germanium layers sandwiching a central 2.3 μm thick calcium fluoride cavity layer, where a plasmonic metasurface with 900 nm periodicity, 60 nm slits, 15 nm spacers, and 96 nm graphene nanoribbons is centrally embedded; (b) modulation depth and light energy utilization of the devices.
Photonics 12 00800 g006
Figure 7. Analysis of the sensitivity of modulator performance to structural parameters. (a) Variations in modulation depth and operating frequency band with slit width; (b) variations in modulation depth and operating frequency band with period; (c) variations in modulation depth and operating frequency band with spacer layer thickness; (d) variations in modulation depth and operating frequency band with nanoribbon width; (e) variations in modulation depth and operating frequency band with CL thickness; (f) average electric field gain factor at the AEGP structure under 28.3 THz after introducing photonic crystals with different CL thicknesses.
Photonics 12 00800 g007
Figure 8. The modulation characteristics of the improved device vary with the coupling coefficient of the metasurface mode. (a) Variation in the transmission peak with Fermi level and Q factor when ξ = 3.52 × 10¹³ (s·eV)−1; (b) variation in the transmission peak with Fermi level and metasurface coupling rate when Q = 14; (c) variation in modulation depth with Fermi level and Q factor when ξ = 3.52 × 10¹³ (s·eV)−1; (d) variation in modulation depth with Fermi level and metasurface coupling rate when Q = 14.
Photonics 12 00800 g008
Table 1. Comparison of the performance metrics between the present work and existing experimental studies.
StructureCentral WavelengthTmaxModulation DepthReference
Graphene nanoribbons and off-resonant Au structure12.5 μm95%
(estimated)
24%[25]
Graphene nanoribbons and metallic slit arrays7.1 μm11%28.6%[26]
Graphene nanoribbons and dielectric layer6.7 μm65%
(estimated)
41%[19]
AEGP and PC10.6 μm67.6%88.5%this work
Disclaimer/Publisher’s Note: The statements, opinions and data contained in all publications are solely those of the individual author(s) and contributor(s) and not of MDPI and/or the editor(s). MDPI and/or the editor(s) disclaim responsibility for any injury to people or property resulting from any ideas, methods, instructions or products referred to in the content.