1. Introduction
Laser fuzes are critical components in precision-guided weapon systems, offering high accuracy, strong anti-interference capability, and adaptability to complex environments. To enhance their performance, recent studies have explored advanced target recognition methods and environmental adaptability [
1,
2,
3].
The laser fuze operates as an active detection device utilizing the fundamental principle of laser emission and echo reception. It propagates high-energy, highly directional pulsed laser beams towards the target area. The echo signals reflected or scattered from the target surface are then captured, enabling an analysis of their temporal and intensity characteristics. From this analysis, critical target parameters—including range, relative velocity, azimuth angle, geometric profile, and surface scattering characteristics—can be derived [
4,
5].
In laser fuze research and applications, traditional physically acquired database construction faces significant challenges, exhibiting pronounced limitations in missile-borne high-speed rendezvous scenarios. Destructive testing necessitates cost-prohibitive expenditures of missiles, target platforms, and testing infrastructure. Furthermore, precise replication of complex ballistic conditions—such as variable altitudes, velocities, and approach angles—proves exceptionally difficult, resulting in exorbitant data acquisition costs and critically insufficient sampling [
6]. Concurrently, target motion, environmental interference (e.g., smoke and clutter), and platform vibrations introduce motion blur and deformation artifacts, substantially compromising point cloud reliability [
7]. These constraints severely impede target recognition accuracy and practical deployment of laser fuzes in complex battlefield environments.
To enhance the scanning range and speed of laser fuzes, rotating double prisms (Risley prisms) offer an effective solution for beam steering and target identification. The coaxial independent rotation of two prisms enables rapid, large-angle laser beam deflection, significantly expanding the scanning coverage while maintaining target identification accuracy. Compared to conventional galvanometer or mirror-based scanning systems, the rotating double prism configuration demonstrates superior performance with its compact structure, low moment of inertia, and high angular resolution [
8], making it particularly suitable for laser fuzing applications requiring both high-speed operation and wide-angle deflection. The effectiveness of this approach has been experimentally validated through systematic studies, including the reverse scanning algorithm verification conducted by the Institute of Optoelectronics and Photonics, Chinese Academy of Sciences (IOPE, CAS) [
9]. Furthermore, Li et al. [
10] successfully implemented rotating biprisms in imaging systems and developed an equivalent camera calibration method that achieved measurable improvements in calibration accuracy, further demonstrating the technical advantages of this beam steering approach for photonic applications.
Rotating biprism systems have emerged as a novel opto-mechanical technology, with Europe and the United States pioneering early research into their beam steering characteristics. These systems have yielded mature products successfully implemented in optical scanning systems, infrared countermeasures, and space communications [
11,
12,
13,
14]. A significant advancement occurred in 2022 when Xing Zhenchong’s team developed a compact laser communication optic employing rotating dual wedge prisms and four-quadrant detector multiplexing technology, achieving breakthroughs in structural optimization and functional integration while addressing the size and power consumption limitations of conventional systems [
15].
Recent progress in biprism-generated point cloud simulation has focused on three critical areas: optical system modeling, dynamic error compensation, and multi-scenario adaptation. Sun et al. [
16,
17,
18] employed vector refraction theory to analyze laser beam aberrations during wide-angle scanning, establishing that beam distortion vanishes when the prism angular difference reaches 180°. Addressing servo errors from abrupt prism speed changes, Qin [
19] developed an innovative trajectory optimization method combining filtering and interpolation techniques, substantially enhancing point cloud smoothness and accuracy. Li Zhilin [
20] advanced the field through a robust optimization algorithm incorporating an anti-differential nonlinear Gauss–Helmert model, enabling effective point cloud reconstruction in high-noise environments. Complementing these efforts, Jin-Ying Li [
21] formulated an inverse scanning algorithm based on vector optics and first-order approximation, validated through comprehensive simulation studies.
Point cloud processing serves as a critical post-processing component following laser fuze-based scanning imaging, enabling accurate target reconstruction, classification, and recognition [
22,
23,
24,
25]. Li et al. [
26] proposed a neighborhood feature-enhanced point cloud semantic segmentation framework based on PointNet++, which addresses the limitations of local geometric representation in complex scenes. Point cloud data is inevitably affected by noise during acquisition due to sensor limitations, environmental interference, and surface properties. To enhance data quality, various noise preprocessing methods have been developed [
27,
28,
29,
30].
Despite these advancements, implementing rotating biprism scanning for laser fuze target recognition presents persistent engineering challenges [
31,
32]. While technology offers inherent advantages in pointing accuracy and miniaturization [
33], making it particularly suitable for the spatial constraints and dynamic detection requirements of laser fuzes, fundamental limitations remain. The field currently lacks a comprehensive mathematical framework describing the nonlinear coupling between prism parameters and scanning performance. Furthermore, the dynamic scanning environment of laser fuzes introduces unresolved theoretical gaps regarding parameter effects on point cloud quality. The inherent conflict between the time-varying nature of beam propagation paths and existing static coordinate-based control algorithms directly impacts the reliability of destructive element initiation decisions.
To address these critical issues, this paper presents a novel biprism scanning method featuring multi-parameter optimization. Our approach systematically examines light tracing fundamentals, establishes parameter influence mechanisms, and determines optimal scanning parameters through iterative simulation and experimental validation. Results demonstrate that our optimized parameter set yields point clouds with superior density, uniformity, and target feature integrity—key metrics for laser fuze applications.
2. Analytical Modeling of Beam Pointing with Rotating Dual Prisms
As illustrated in
Figure 1, the dual-prism beam-steering system employs two coaxially aligned refractive prisms arranged in close proximity. Each prism is mounted on precision bearings and independently driven by a dedicated motor, enabling rotation about the shared optical axis.
The incident laser beam is collimated along the optical axis of the prism system. Through successive refractions at the two prism interfaces, the beam direction is systematically steered. The output beam’s azimuth (
Θ) and deflection angle (
Φ) are dynamically controlled by varying the rotational positions (
θ1,
θ2) of the prisms. As illustrated in
Figure 1, the azimuth
Θ is defined as the angle between the +
X-axis and the projection of the output beam vector onto the XY plane (positive counterclockwise), while the deflection angle
Φ represents the angular deviation between the output beam and the optical axis (
Z-axis).
For precise determination of the azimuth (
Θ) and deflection (
Φ) angles, this study employs a forward non-paraxial ray tracing algorithm. The system is parameterized by: Prism refractive indices:
n1 and
n2 (default
n1 =
n2); Optical wedge angles:
α1 and
α2; and Initial rotation angles:
θ1 and
θ2. The beam propagation path is characterized by unit direction vectors (
S1,
S2,
S3,
S4) (
S1 = (0, 0, −1)), with interface normal vectors (
N1,
N2,
N3,
N4) at each refraction plane. Initially, both prisms are coplanar in horizontal alignment (see
Figure 2).
Applying the vector form of Snell’s law to the first prism (Π
1), the normal vector at the left interface is derived as:
where
α1 denotes the wedge angle and
θ1 represents the rotation angle of Π
1. According to the vector form of Snell’s law, the light refraction at the prism interface satisfies:
In this configuration, the right interface of prism Π
1 and the left interface of prism Π
2 are mutually parallel. This geometric arrangement preserves the beam propagation direction, yielding:
S3 =
S2. Where
S3 denotes the incident ray vector at Π
2 and
S2 represents the exit ray vector from Π
1. The unit normal vector at the exit interface of prism Π
2 is given by:
Applying Snell’s law at the second prism (Π
2), we derive the output ray vector:
Through synthesis of the preceding formulations, the directional cosines of the output ray along the three coordinate axes in the non-paraxial ray tracing framework are derived as:
System Parameters: n1, n2: Refractive indices of Π1 and Π2; α1, α2: Wedge angles; θ1, θ2: Rotation angles (θ ∈ [0, 2π] rad); Δθ ≡ θ1 − θ2: Relative angular displacement.
The elevation (
Φ) and azimuth (
Θ) angles are:
3. Parameter Effects and Optimization
For optimizing the performance of rotating biprism scanning systems, this study conducts a systematic analysis of the critical parameter coupling mechanisms that govern scanning performance. The system’s core performance metrics—including azimuth control precision and effective scanning range—are predominantly determined by nonlinear interactions among key parameters: The optical wedge angle pair (α1, α2); The prism material refractive index (n); The relative deflection angle between prisms (Δθ = θ1 − θ2).
Additionally, the spatial configuration of the prism assembly significantly influences the incident beam’s refraction path. The parametric relationships governing azimuth (
Θ) and deflection (
Φ) angles can be mathematically expressed as:
where
represents the coupling constraint of the optical wedge angle on the deflection angle
Φ;
denotes the coupling constraint of the refractive index on the deflection angle
Φ;
corresponds to the coupling constraint of the relative rotation angle on the deflection angle Φ;
represents the coupling constraint of the optical wedge angle on the azimuthal angle
Θ;
denotes the coupling constraint of the refractive index on the azimuthal angle
Θ; and
corresponds to the coupling constraint of the relative rotation angle on the azimuthal angle
Θ.
3.1. Effect of the Optical Wedge Angle on the Deflection and Azimuthal Angles
The optical wedge angle α was varied in increments of 1°, ranging from 1° to 15°. Meanwhile, the rotation angles of the prisms (
θ1 and
θ2) were swept from 0° to 360° in 1° steps. The beam deflection angle (
Φ) and azimuthal angle (
Θ) corresponding to different combinations of wedge angles and rotation angles were computed using the non-paraxial ray tracing method. The results are presented in
Figure 3.
Numerical simulations reveal that the optical wedge angle (
α) significantly influences the beam deflection angle (
Θ), whereas its impact on the azimuth angle (
Φ) is negligible. Through multiple binomial fittings, we derive the analytical expressions for these relationships:
and
:
where
is the optical wedge angle and takes the value in the range of [0, 15].
3.2. Effect of the Refractive Index on the Deflection and Azimuthal Angles
The refractive index of the prism is a key parameter that critically influences the beam deflection characteristics. To evaluate its impact, we examine how variations in the refractive index of the two prisms affect both the deflection angle (Φ) and the azimuthal angle (Θ). Under the condition of on-axis illumination—i.e., with the incident light aligned along the central optical axis of the prism—the refractive index n is varied from 1.2 to 1.7 in increments of 0.1, while keeping the optical wedge angle fixed at 15°. The resulting variations in the maximum deflection angle (Φmax) and maximum azimuthal angle (Θmax) as functions of n are computed, plotted, and analyzed.
As shown in the
Figure 4, the maximum deflection angle increases with the refractive index, while the maximum azimuthal angle remains nearly constant at 360°. The analytical expressions of the two curves,
and
, are derived using multiple binomial fitting, where
is the refractive index and takes the value in the range [1.2, 1.7].
3.3. Effect of the Relative Rotation Angle on the Deflection and Azimuthal Angles
In a biprism beam deflection system, the relative rotation angle between the two prisms is a critical parameter for beam steering control. Under experimental conditions with incident light aligned along the system’s central optical axis, we fixed Prism 1 at 0° while rotating Prism 2 from 0° to 360° in 1° increments. This configuration allows the relative rotation angle (Δ
θ) to be solely determined by Prism 2’s orientation. As shown in
Figure 5, we systematically analyzed how Δ
θ influences both the beam deflection angle (
Φ) and azimuthal angle (
Θ). Key findings from this investigation include:
The experimental results indicate that the deflection angle exhibits a trend of first increasing and then decreasing as the rotation angle of Prism 2 varies. Notably, the deflection angle reaches its minimum value of 0° when the rotation angle is 180°, revealing a singularity in the operation of the rotating biprism system. This singularity arises when the bevel faces of the two prisms become parallel. Therefore, in practical applications, a relative rotation angle of 180° between the two prisms should be avoided to prevent such singularities.
The analytical expression for the deflection angle,
, is obtained through multiple binomial fittings. Meanwhile, the solution for the azimuthal angle,
, is derived using a two-segment least squares fitting approach:
where
is the relative turning angle, the value range is [0, 360].
3.4. Effect of Placement on the Deflection and Azimuthal Angles
The effects of four different positional configurations of the rotating biprism system are analyzed. In these configurations, the flat surface of the prism is denoted as “1”, while the sloped (beveled) surface is denoted as “2”. The four representative arrangements under investigation are “2112”, “1212”, “2121”, and “1221”, as illustrated in
Figure 6:
To compare the performance of the four aforementioned prism configurations, simulations were conducted using a fixed wedge angle of 15° and a refractive index of
n = 1.7. Under identical incidence conditions—where the incoming beam is aligned with the central optical axis of the prism—the azimuthal and deflection angles of the outgoing beam were computed and plotted. In the simulation, both the incident and exit wedges were rotated through 360° in steps of 1°. The resulting azimuthal angles for each of the four placement configurations are presented in
Figure 7, while the deflection angles are shown in
Figure 8.
As shown in the figure, all four prism configurations exhibit a maximum azimuthal angle of 360°, indicating that the placement method has minimal impact on the maximum azimuthal angle. Similarly, under identical input conditions, the variation in deflection angle across the four configurations is relatively small. Among them, the “1212” configuration yields the highest deflection angle, indicating a slightly superior beam steering performance.
The beam deflection capabilities of the four configurations are summarized in the
Table 1 below. Overall, the results suggest that the four placement methods offer comparable beam deflection performance, with only minor differences.
3.5. Effect of Rotation Speed on Beam Deflection and Azimuthal Angles
When the geometric parameters and relative configuration of the optical wedges are held constant, the rotational speed ratio between the two prisms emerges as the primary controllable variable for trajectory modulation. Systematic adjustment of this ratio enables the generation of diverse scanning patterns, as demonstrated in
Figure 9 (
):
The experimental results demonstrate that non-integer rotational speed ratios produce substantially larger scanning ranges compared to integer ratios. Furthermore, increasing the decimal precision of the speed ratio leads to: (1) higher trajectory point density, and (2) a near-exponential growth in scanning duration.
The permissible range for the speed ratio within the system is defined as r ∈ [0.1, 10] ().
When r < 0.1, inadequate system coverage occurs, manifesting as a significant expansion in the proportion of scanning blind zones, which fails to satisfy the real-time processing demands inherent to high-speed encounter scenarios. This condition fails to meet the real-time processing requirements inherent to high-speed encounter scenarios.
Conversely, at r > 10, increased scanning density is achievable; however, this regime is constrained by the inherent rotational speed limit of the drive motor (typically capped at 360°/s). Under this constraint, sustaining stable rotational speeds at ω2 < 0.1°/s becomes exceptionally challenging, ultimately inducing loss of rotational control stability and trajectory distortions.
The optimal range for the rotation speed ratio of the system is identified as 0.5 < r < 5. Operation within this range enables efficient and comprehensive scanning coverage across the target field of view.
Within this interval, simple rational ratios (e.g., 1:1, 1:2) are not recommended due to their significantly restricted scanning coverage, as demonstrated experimentally (refer to
Figure 9). To balance scanning efficiency and scanning coverage, the decimal precision of the speed ratio should be constrained to no more than three decimal places.
Furthermore, if the rotation speed ratio falls below the lower limit (r < 0.5), the rotational speed of Prism 2 will be reduced, compromising its dynamic responsiveness. Conversely, exceeding the upper limit (r > 5) results in prohibitively extended scanning cycles, thereby adversely affecting overall scanning efficiency.
3.6. Selection of System Parameters
Based on the above analysis, the fitting equations for the azimuth and deflection angles of the biprism system are derived as follows:
In summary, the individual parameters governing the scanning behavior of the rotating biprism system are summarized in the
Table 2 below:
A refractive index of 1.7 combined with an optical wedge angle of 15° enables the scanning system to achieve both a large maximum deflection angle and a wide azimuthal range. Setting the relative rotation angle to 0° prevents beam steering singularities. When the rotational speed ratio is a non-integer (with the prism speeds denoted as ω1 and ω2), the biprism system scans a broader area, enhancing target recognition performance. Additionally, by constraining the decimal precision of the speed ratio, the system maintains reasonable scan durations, avoiding excessive time consumption.
4. Point Cloud Generation and the Influence of System Parameters
This section primarily investigates target recognition and the generation of non-redundant scanning point clouds during the fuse’s low-altitude traversal, aiming to achieve efficient and accurate 3D reconstruction. On this basis, the influence of various system parameters on point cloud generation is further analyzed.
The experimental scene comprises several representative objects, including trees, pickup trucks, cars, and tanks, as illustrated in
Figure 10:
Let the time step be denoted as
(
). At each time step, the rotation angles of the two prisms can be calculated using the following equation:
where
θ1,
θ2 ∈ [0°, 360°) are the instantaneous angular positions of Prism 1 and Prism 2;
t is the elapsed flight time since fuzing activation.
The origin of the laser beam is determined by the fuse’s flight speed, flight time, and altitude. In this study, the laser proximity fuse is assumed to travel at a constant speed of 100 m/s at a fixed altitude of 25 m.
When obtaining the origin and outgoing direction of the incident beam at a given time step, it is necessary to determine whether the beam intersects the 3D target model. To perform this detection, the Möller–Trumbore algorithm is employed for ray–triangle intersection testing.
Triangles are the simplest and most stable surface elements in 3D space; therefore, the surface of a 3D model is typically represented as a mesh composed of triangular facets. A 3D model can thus be described by two components: a vertex set and a face set. The vertex set stores the 3D coordinates of each vertex, while each triangular facet is defined by three vertices, specified by their indices in the vertex set. The complete set of facet definitions constitutes the face set.
The Möller–Trumbore algorithm is an efficient method for determining whether a ray intersects a triangular facet. In this algorithm, the ray is expressed in a parametric form as:
where
O is the ray origin vector, fully determined by the fuze’s kinematic state; D is the unit direction vector obtained from the non-paraxial optical solution of the rotating biprism system; t is the scalar propagation distance to the intersection point.
For any triangular facet of the target model, let the three vertices be denoted as
,
and
. The barycentric coordinates of a point P on the triangle are represented by (u, v) (
). Any point M located within the triangle can be expressed as:
If the incident ray intersects the triangle, then a solution exists for the system of equations formed by equating the parametric ray expression and the barycentric representation of the triangle:
The values of u and v can be determined using Cramer’s Rule. If the system of equations does not yield a valid solution, it indicates that the ray does not intersect the triangular facet and thus does not intersect the target model.
In point cloud data acquisition and processing, the optimization of system parameters plays a critical role in determining the quality of the resulting point cloud. The following analysis explores the influence mechanisms of key parameters on point cloud characteristics.
As established in parameter analysis, the prism placement method exhibits negligible effects on both maximum deflection angle and azimuth angle, warranting its exclusion from detailed examination. Concerning the relative rotation angle, the known singularity at 180° necessitates the adoption of 0° in our experimental configuration, thereby eliminating this parameter from further consideration. Additionally, the flight speed parameter was maintained at a constant 100 m/s throughout all experiments, precluding its inclusion in the current analysis.
Consequently, this study focuses on three primary optimization parameters: flight altitude, refractive index, and prism wedge angle. Point cloud quality assessment is conducted through quantitative evaluation of three critical metrics: point density, spatial distribution uniformity, and target feature reconstruction fidelity.
In this study, the number of point clouds detected on the tank’s gun barrel is used as a metric to evaluate point cloud uniformity and target-specific integrity. Although the point cloud density of a single geometric feature cannot fully represent overall scan quality, there is solid justification for selecting the tank barrel region as a key evaluation metric. The barrel presents an elongated cylindrical surface with pronounced curvature and a relatively small cross-sectional area, rendering it especially susceptible to scan blind spots, occlusion, and optical distortion. Successfully generating a high-density point cloud in this region not only validates the system’s deflection capability and beam coverage but also demonstrates its capacity to capture fine structural details. While barrel point cloud density reflects a single point evaluation, it nonetheless functions as a robust indicator of overall scan quality.
4.1. Influence of Refractive Index on Point Cloud Characteristics
The maximum deflection angle of the rotating biprism increases with the refractive index, whereas the refractive index has minimal influence on the maximum azimuth angle, which remains constant at 360° as the refractive index varies. In this study, several commonly used refractive index values are selected to investigate their effect on point cloud density, while all other system parameters are held constant.
The following
Figure 11 illustrates the relationship between the number of acquired point cloud points and the refractive index.
Within the refractive index range of 0.7 to 1.7, the variation can be divided into three stages for analysis: low refractive indices (0.7–1.3), moderate refractive indices (1.3–1.4), and high refractive indices (1.4–1.7).
Experimental results show that in the low refractive index range, the point cloud density exhibits a nonlinear trend—first decreasing and then increasing—with a minimum observed at n = 0.9. This behavior is attributed to the weak refractive capability of the optical wedge element at low indices, which limits the beam deflection angle and results in inadequate scanning coverage. This limitation is particularly pronounced on complex surface geometries, where effective coverage becomes challenging.
In the moderate refractive index range, increased refractive indices lead to greater beam deflection, enabling the scanning path to reach previously unscanned regions. Experimental results indicate that the point cloud count peaked at 51,419 points when the refractive index was set to 1.4.
As the refractive index exceeds 1.4, the total point cloud density begins to decline, dropping to 44,524 points at n = 1.7, representing a 13.4% decrease. This reduction is attributed to the increased refractive power and the resulting excessive deflection angle at the prism exit. Consequently, some rays deviate from the target model, failing to strike the object’s surface, and thus do not contribute to the point cloud. Furthermore, a higher refractive index exacerbates edge distortion and optical aberrations, leading to a lower signal-to-noise ratio. As a result, some points are either filtered out or lost during processing.
In this study, the number of point clouds detected on the tank’s gun barrel is used as a metric to evaluate point cloud uniformity and target-specific integrity. The number of points captured on the gun barrel at different refractive indices is shown in
Figure 12. As observed, when the refractive index is low (
n = 0.7 to
n = 1.3), the overall point cloud count remains above
, but the gun barrel points are absent, indicating that the system is in a state of ineffective recognition.
In the moderate refractive index range, the number of gun barrel points peaks at 3458 when n = 1.4, accompanied by a synchronous increase in the total point count to 5.14 × 10⁴ at n = 1.4. This demonstrates that enhancing the refractive index within this range significantly improves the spatial distribution and coverage of the scanning beam.
However, at high refractive indices (n > 1.4), a notable attenuation effect occurs. Excessive beam contraction and divergence reduce the system’s ability to effectively scan the gun barrel, leading to diminished target recognition performance.
Although increasing the refractive index enhances the beam deflection capability, the actual point cloud count may decrease or exhibit minimal change. This is due to a combination of factors, including variations in scanning range and coverage, increased optical aberrations, target occlusions, and reflective losses. These results suggest that optimizing an optical scanning system requires more than maximizing the deflection angle—it also necessitates careful consideration of beam uniformity and the target hit rate.
Based on the above analysis, a refractive index of 1.4 is selected in this study.
Figure 13 shows the 3D point cloud of the tank, including (a) the complete scanned point cloud and (b) a magnified view highlighting the gun barrel region (n = 1.4).
4.2. Influence of Prism Wedge Angle on Point Cloud Characteristics
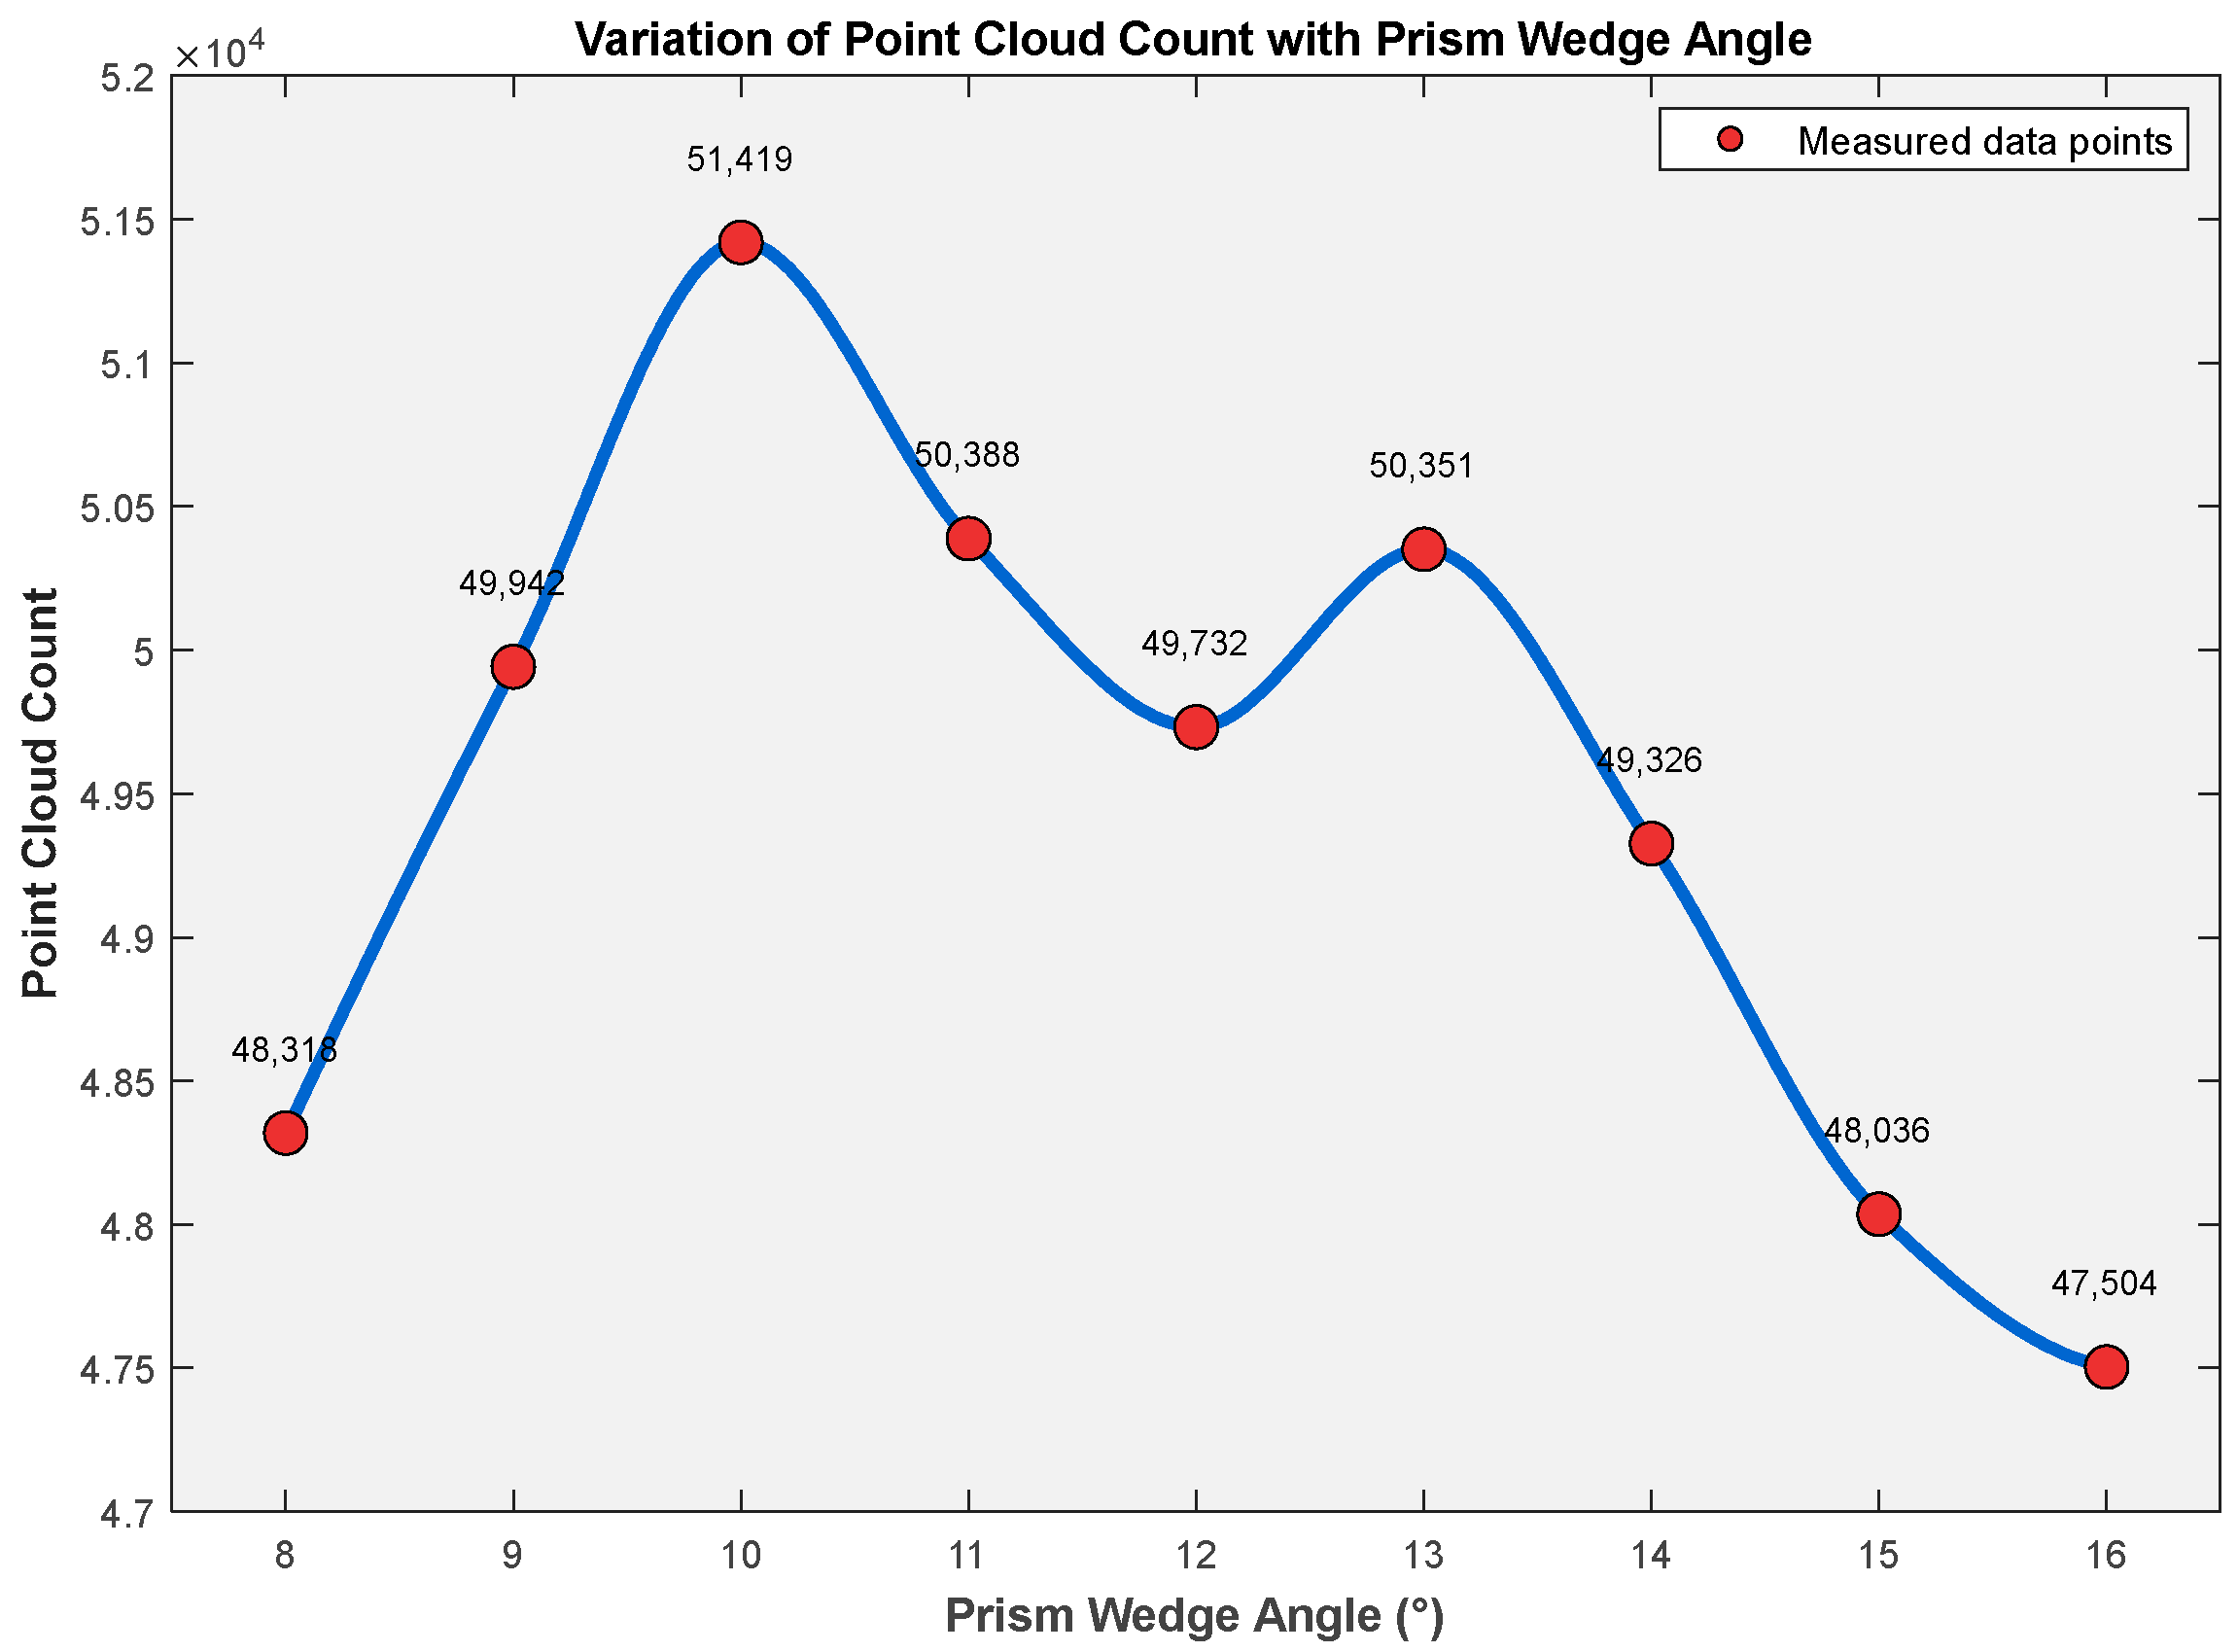
Figure 14 illustrates the relationship between the optical wedge angle and the total number of point clouds.
Numerical simulations reveal that the optical wedge angle significantly influences the deflection angle of the outgoing beam in a rotating biprism system, thereby affecting both the scanned area’s distribution range and the point cloud density.
As the wedge angle increases from 8° to 16°, the point cloud count initially rises and then declines (peaking at 10°), indicating that the wedge angle not only modulates the deflection angle but also alters the light distribution pattern on the target.
Specifically, from 8° to 10 °, the point cloud count increases from 48,318 to 51,419, reaching its maximum at 10°. This trend arises because a larger wedge angle enhances the scanning field coverage, improving point cloud density. However, beyond 10°, Fresnel reflection-induced energy decay dominates, causing a non-monotonic decline in point cloud count. At higher wedge angles, the laser beam strikes the object more obliquely, and according to Fresnel’s law, the reflected light intensity weakens with increasing incidence angle, reducing detectable points.
An anomalous rebound at 13° was observed, but error analysis confirmed that the fluctuation (±2.1%) falls within the system’s expected noise range.
In this study, the uniformity and target-specific integrity of a tank gun barrel are evaluated based on the number of point clouds generated on its surface. The
Figure 15 below illustrates the relationship between the point cloud count on the gun barrel and the optical wedge angle.
When the wedge angle is below 10°, the system’s deflection capability is insufficient, causing the laser beam to strike the barrel’s curved surface at a high incidence angle, which significantly reduces detectable point clouds.
At wedge angles between 10° and 13°, the deflection capability improves, leading to a higher point cloud count—peaking at 10°. However, for wedge angles from 14° to 16°, excessive deflection causes the beam to overshoot the barrel’s top surface, resulting in a decline in point cloud density.
The wedge angle (
) chosen for this system ensures the number of point clouds, as well as the quality of the point clouds.
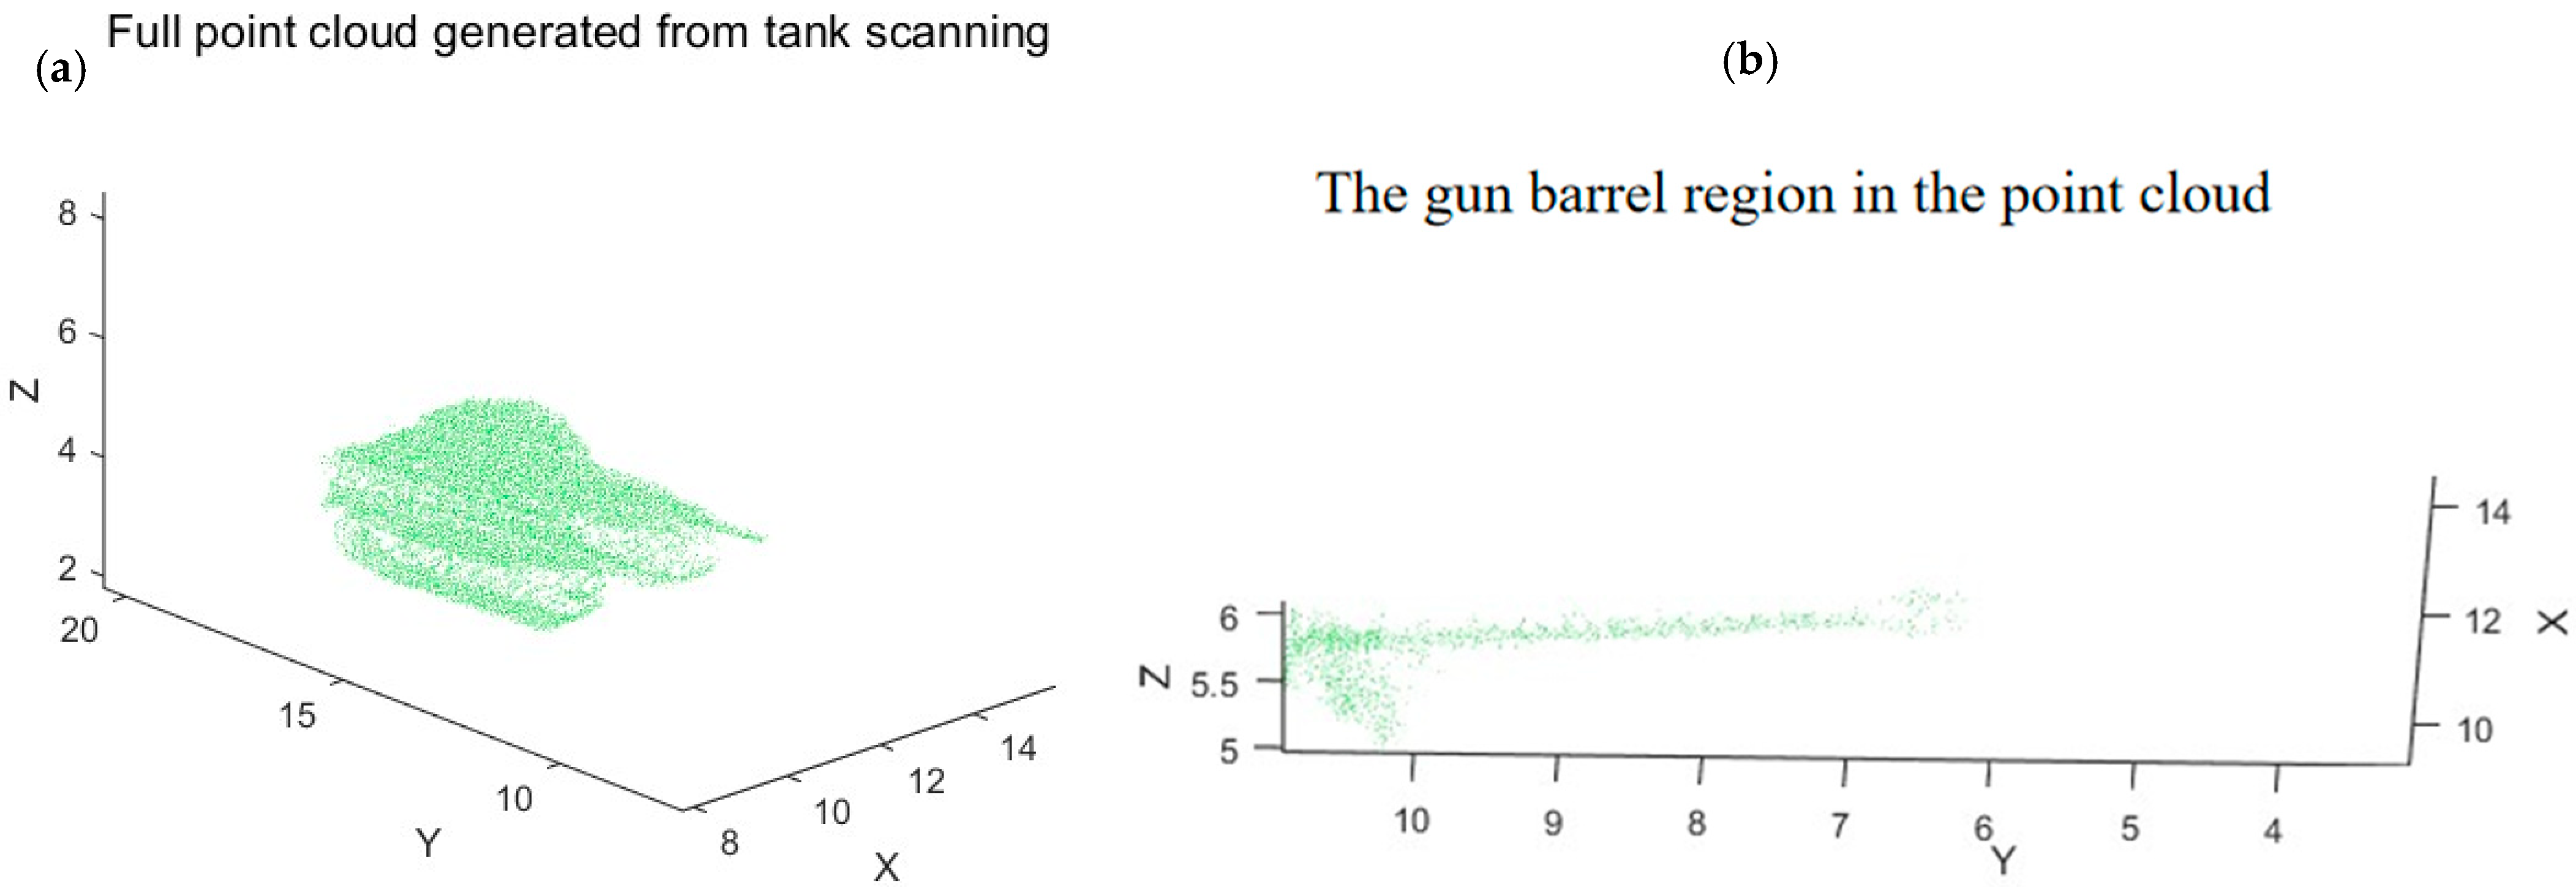
Figure 16 shows the 3D point cloud of the tank, including (a) Full point cloud generated from tank scanning; (b) Enlarged view highlighting the gun barrel region in the point cloud (
= 10°).
4.3. Influence of Flight Altitude on Point Cloud Characteristics
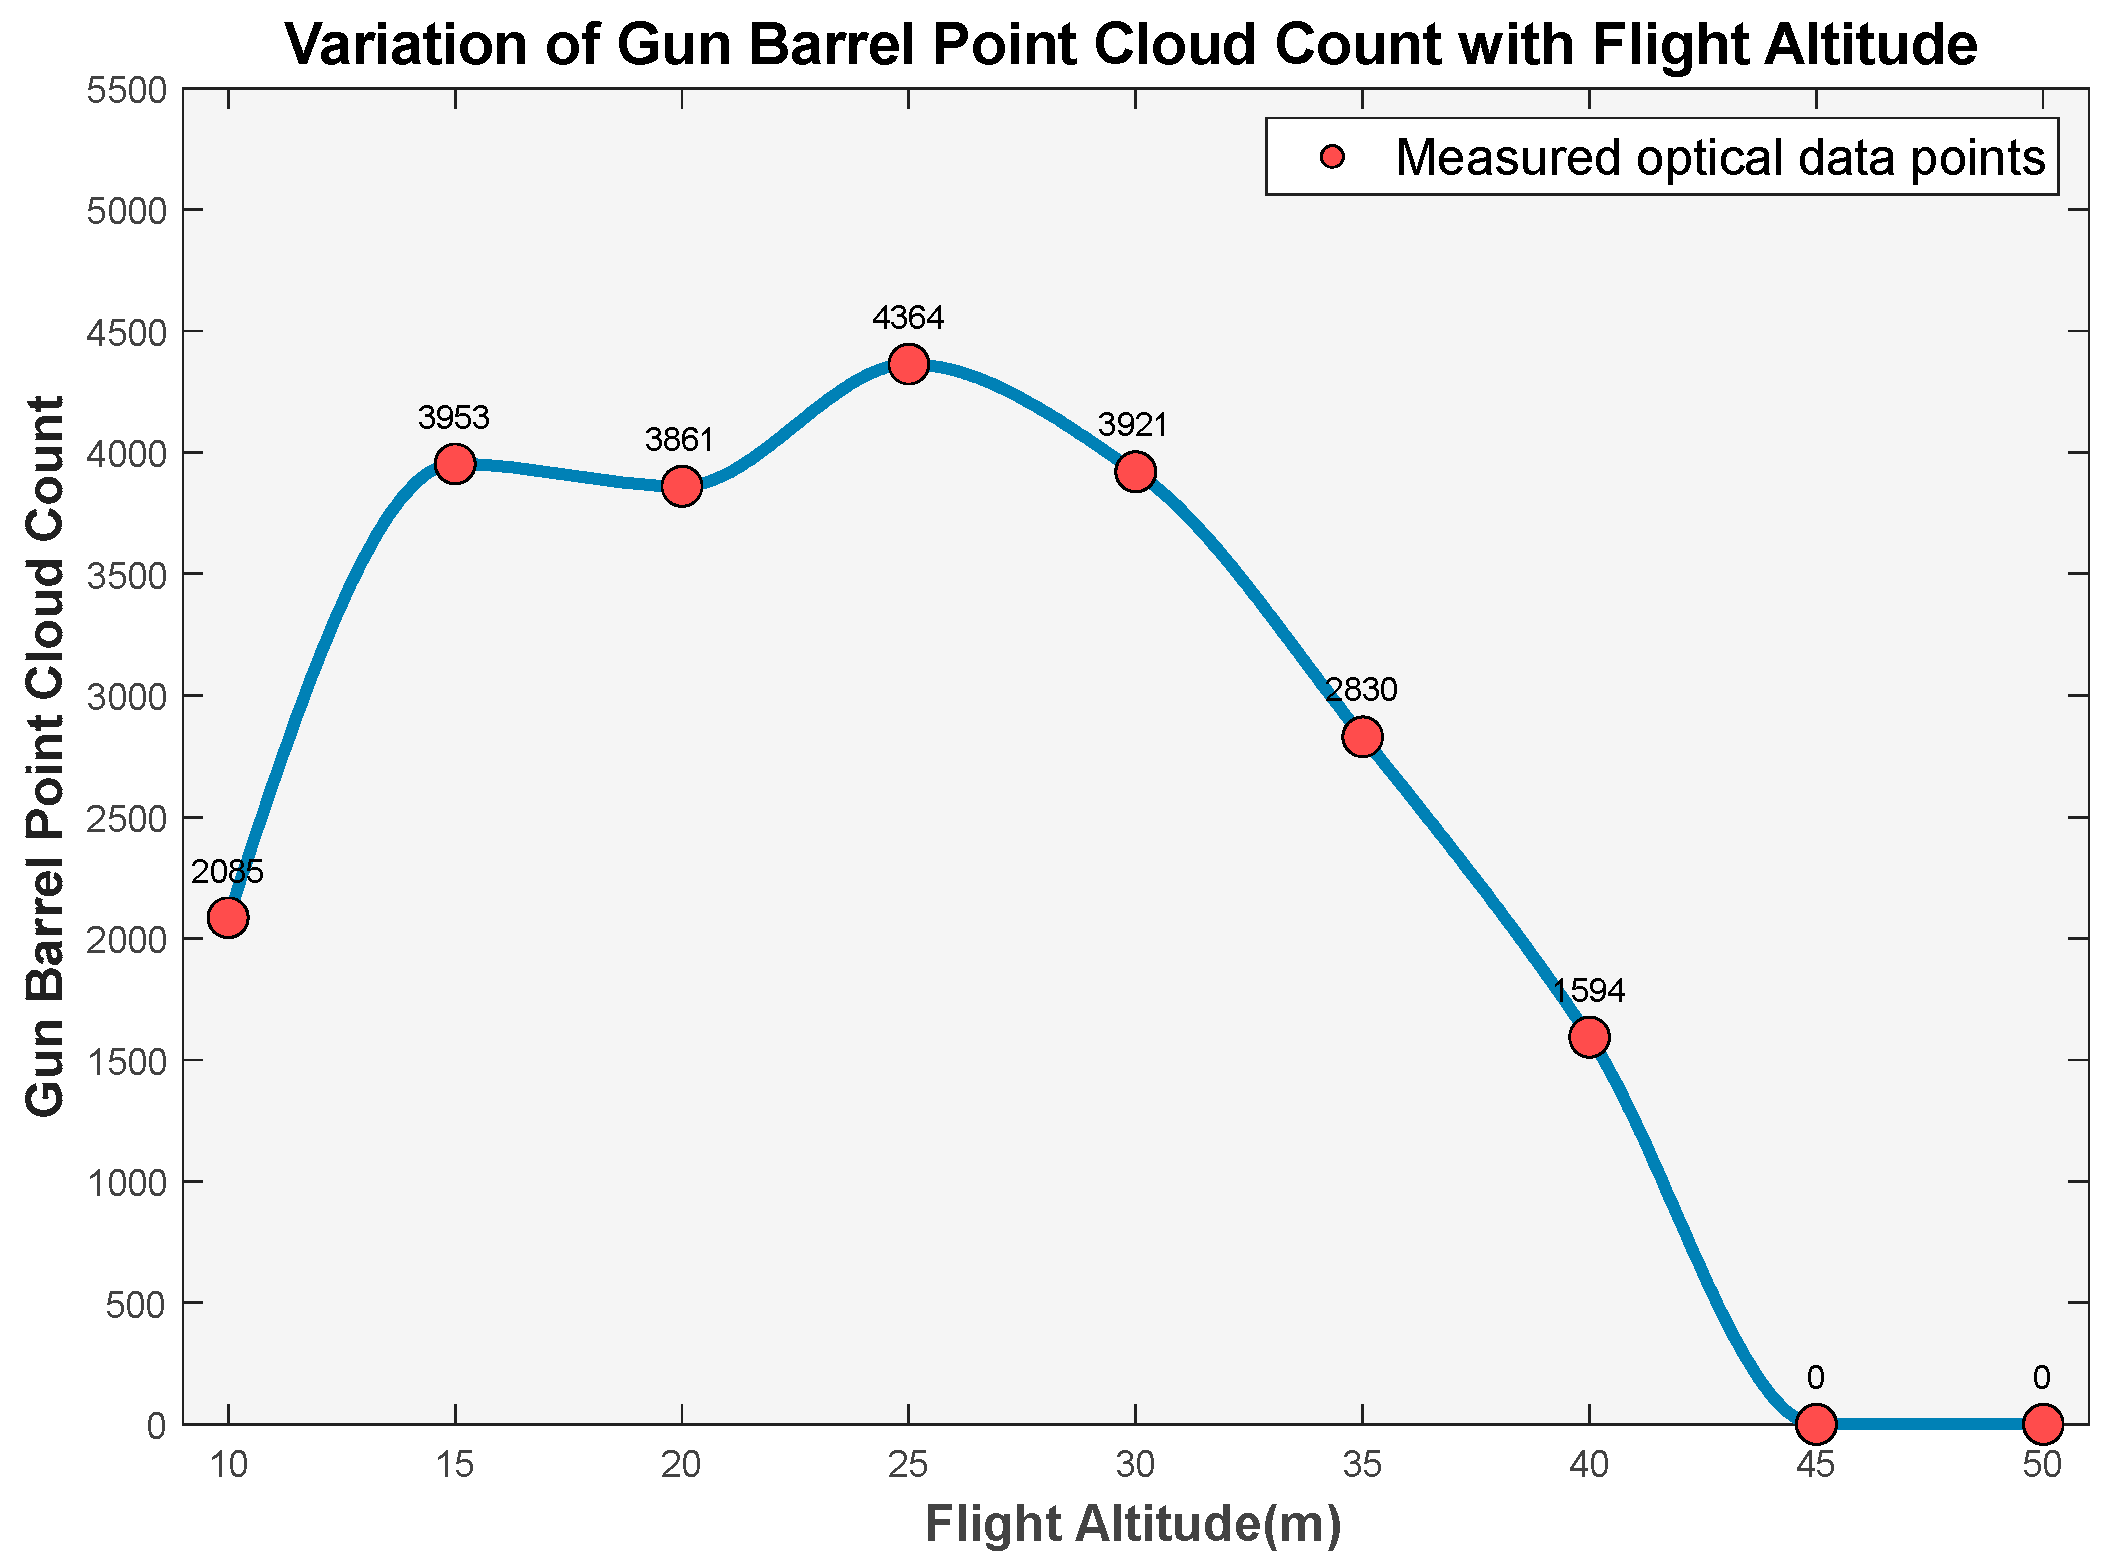
The relationship between flight altitude and point cloud density is presented in
Figure 17. The uniformity of point cloud distribution and integrity of target features are still evaluated based on the point cloud density obtained from scanning the tank barrel region. The relationship between flight altitude and point cloud quantity at the barrel location is illustrated in
Figure 18.
Our flight parameter optimization study demonstrates a nonlinear relationship between altitude and point cloud density in the scanning system. As altitude increases from 10 m to 20 m, the point cloud count rises from 4.6 × 10⁴ to 4.8 × 10⁴ (a 4.3% increase), while being constrained by field-of-view limitations and high single-frame overlap rates. The system achieves optimal performance within the 20–30 m altitude range, where point cloud counts consistently exceed 4.8 × 10⁴—significantly higher than lower altitude scans. Peak performance occurs at 25 m with 51,419-point clouds. Beyond 35 m, the density decreases sharply, failing to meet operational requirements. Through multi-objective optimization, we identify 25 m as the ideal altitude for reliable target reconnaissance in complex battlefield environments.
The assessment of point cloud uniformity and target feature integrity was performed through analysis of point cloud density on the tank gun barrel. As illustrated in the figure, the relationship between flight altitude and gun barrel point cloud density reveals three distinct operational regimes:
Low-altitude regime (10–20 m): Constrained by limited field of view and high single-frame overlap rates, preprocessing algorithms eliminate redundant points, resulting in reduced point cloud density.
Optimal regime (20–30 m): Expanded field of view and increased ground coverage maximize the effective sampling area per frame, yielding peak point cloud density at 25 m altitude.
High-altitude regime (>30 m): Excessive scanning range degrades target recognition capability, with only coarse target identification possible. Point cloud density on the gun barrel decreases significantly, with complete loss of gun barrel detection occurring above 45 m.
Through analysis, H = 25 m was selected as the optimal parameter configuration.
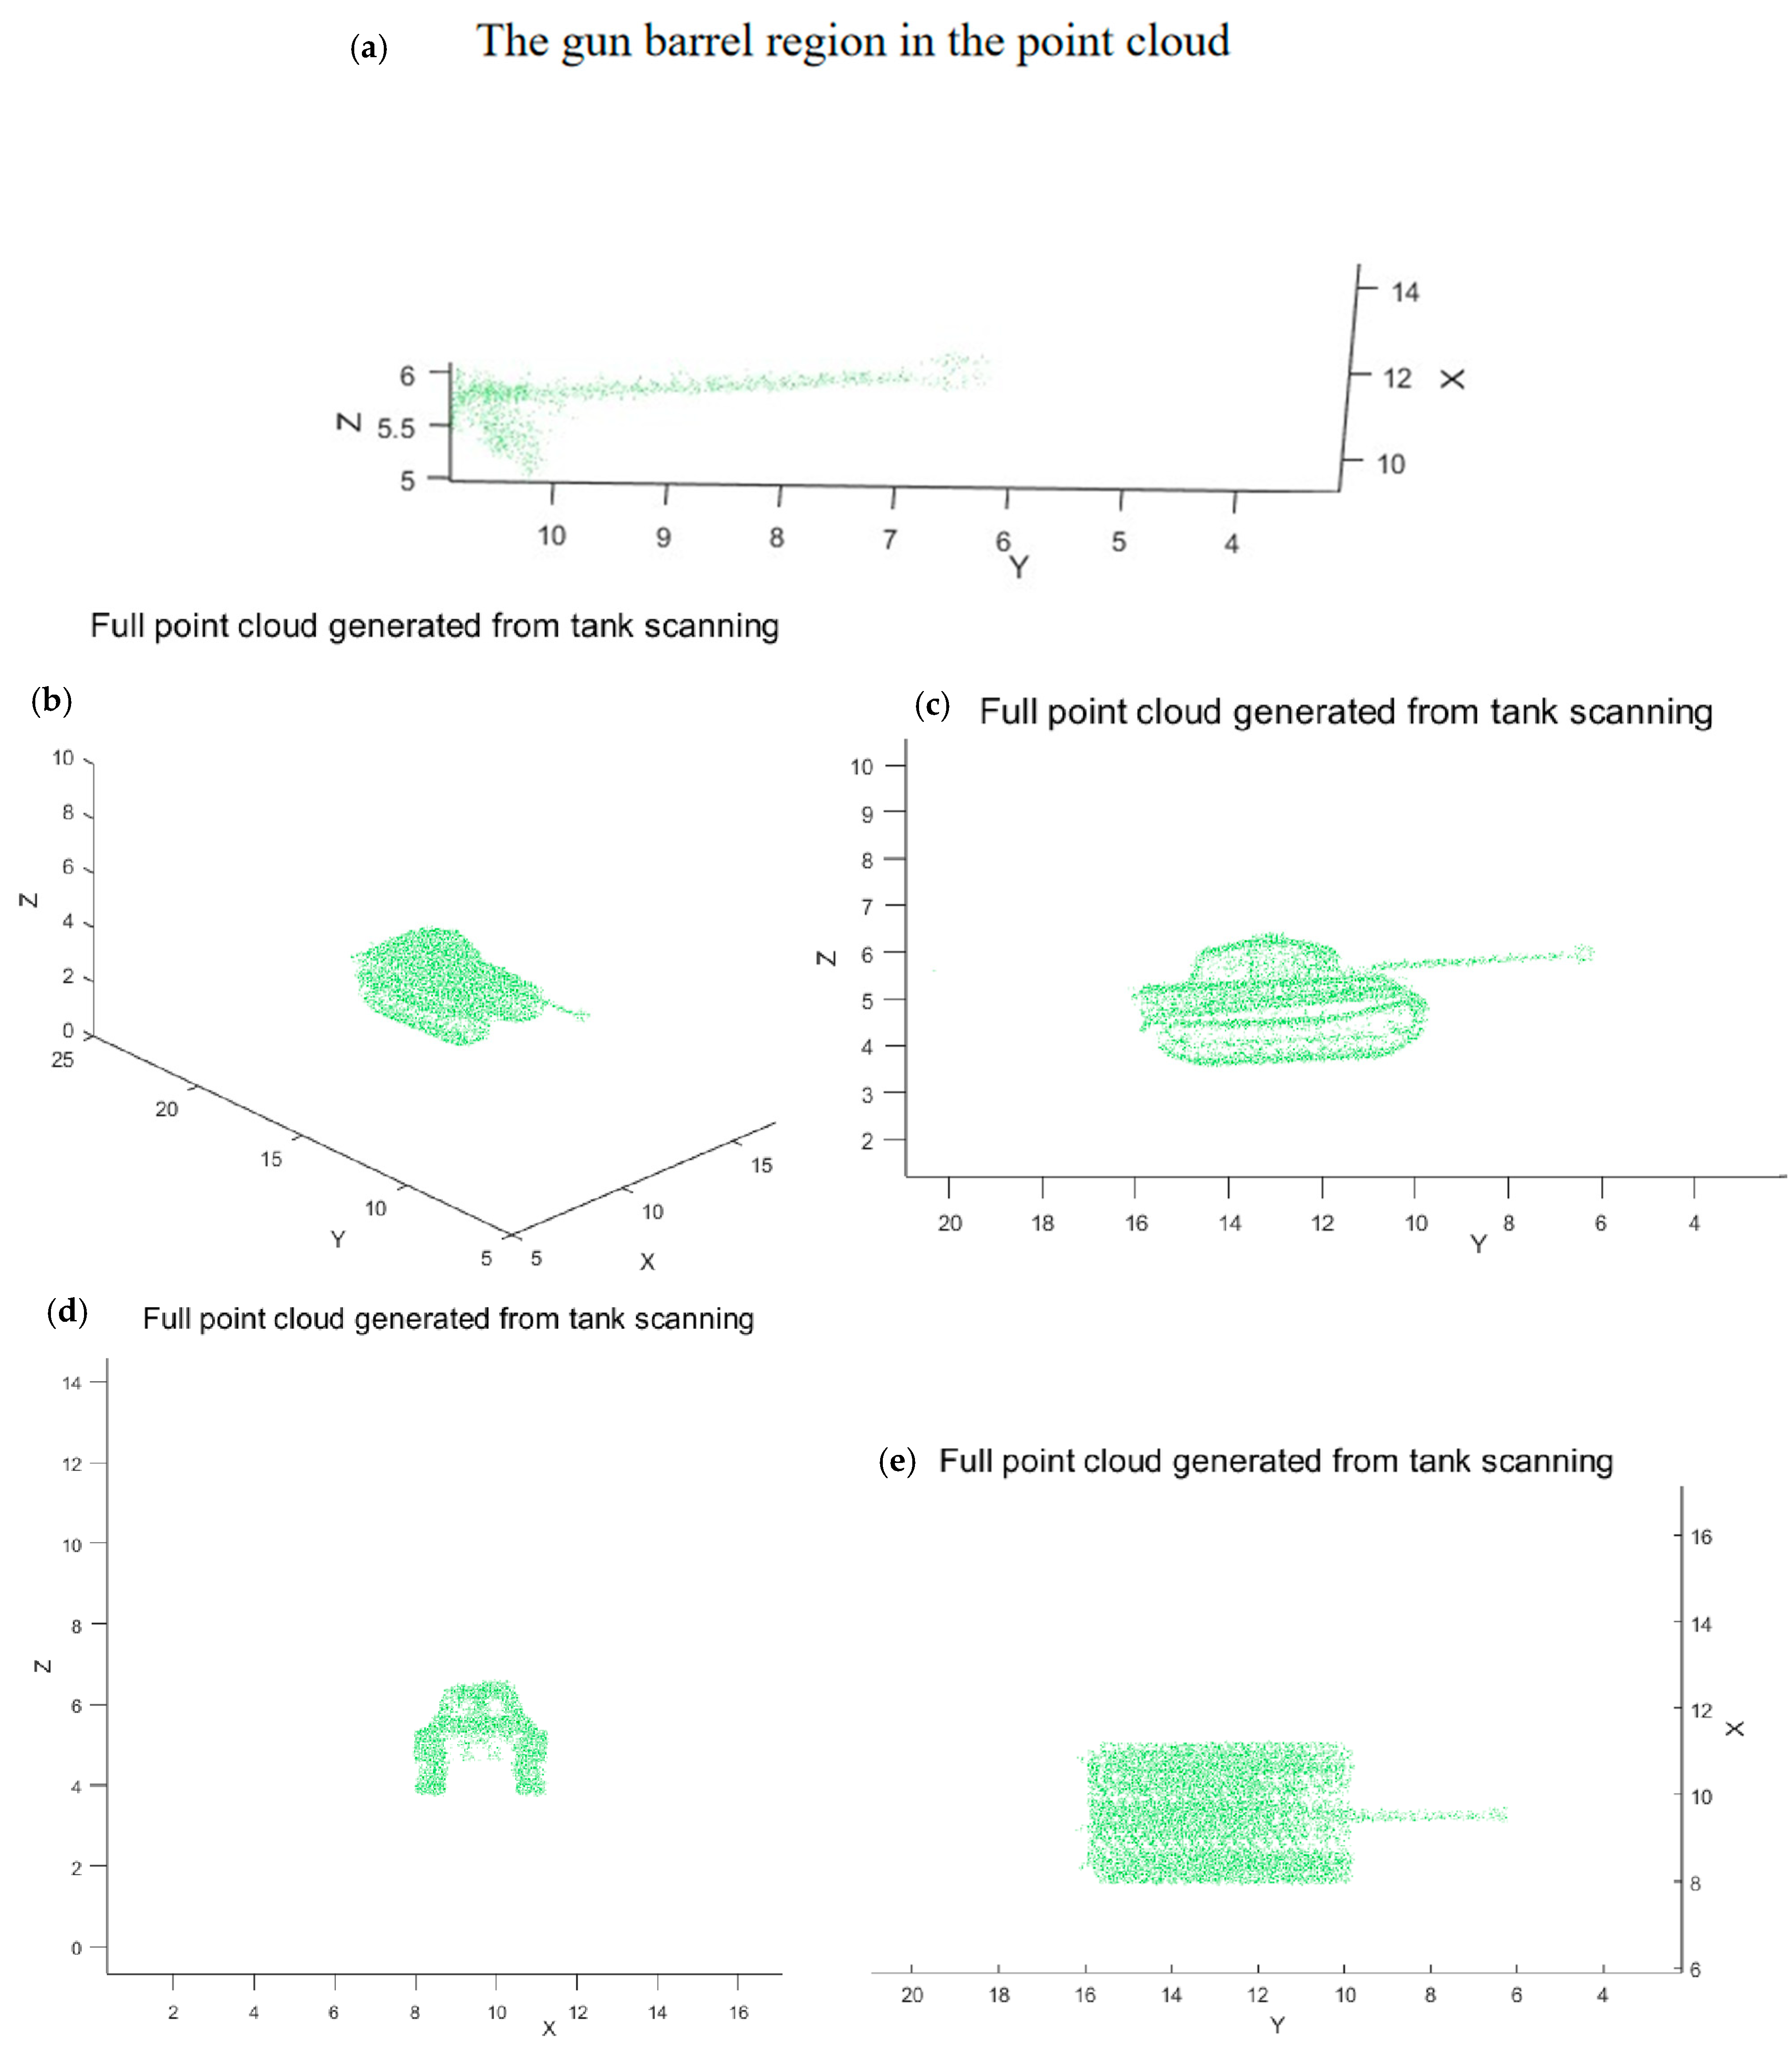
Figure 19 shows the 3D point cloud of the tank, including (a) Enlarged view highlighting the gun barrel region in the point cloud (h = 25 m); (b) Full point cloud generated from tank scanning; (c) Front view of the tank point cloud; (d) Left view of the tank point cloud; (e) Top view of the tank point cloud.
4.4. Optimal System Parameterization
Through comprehensive parameter optimization and experimental validation, we have established the following optimal configuration for the rotating biprism laser imaging system
Table 3:
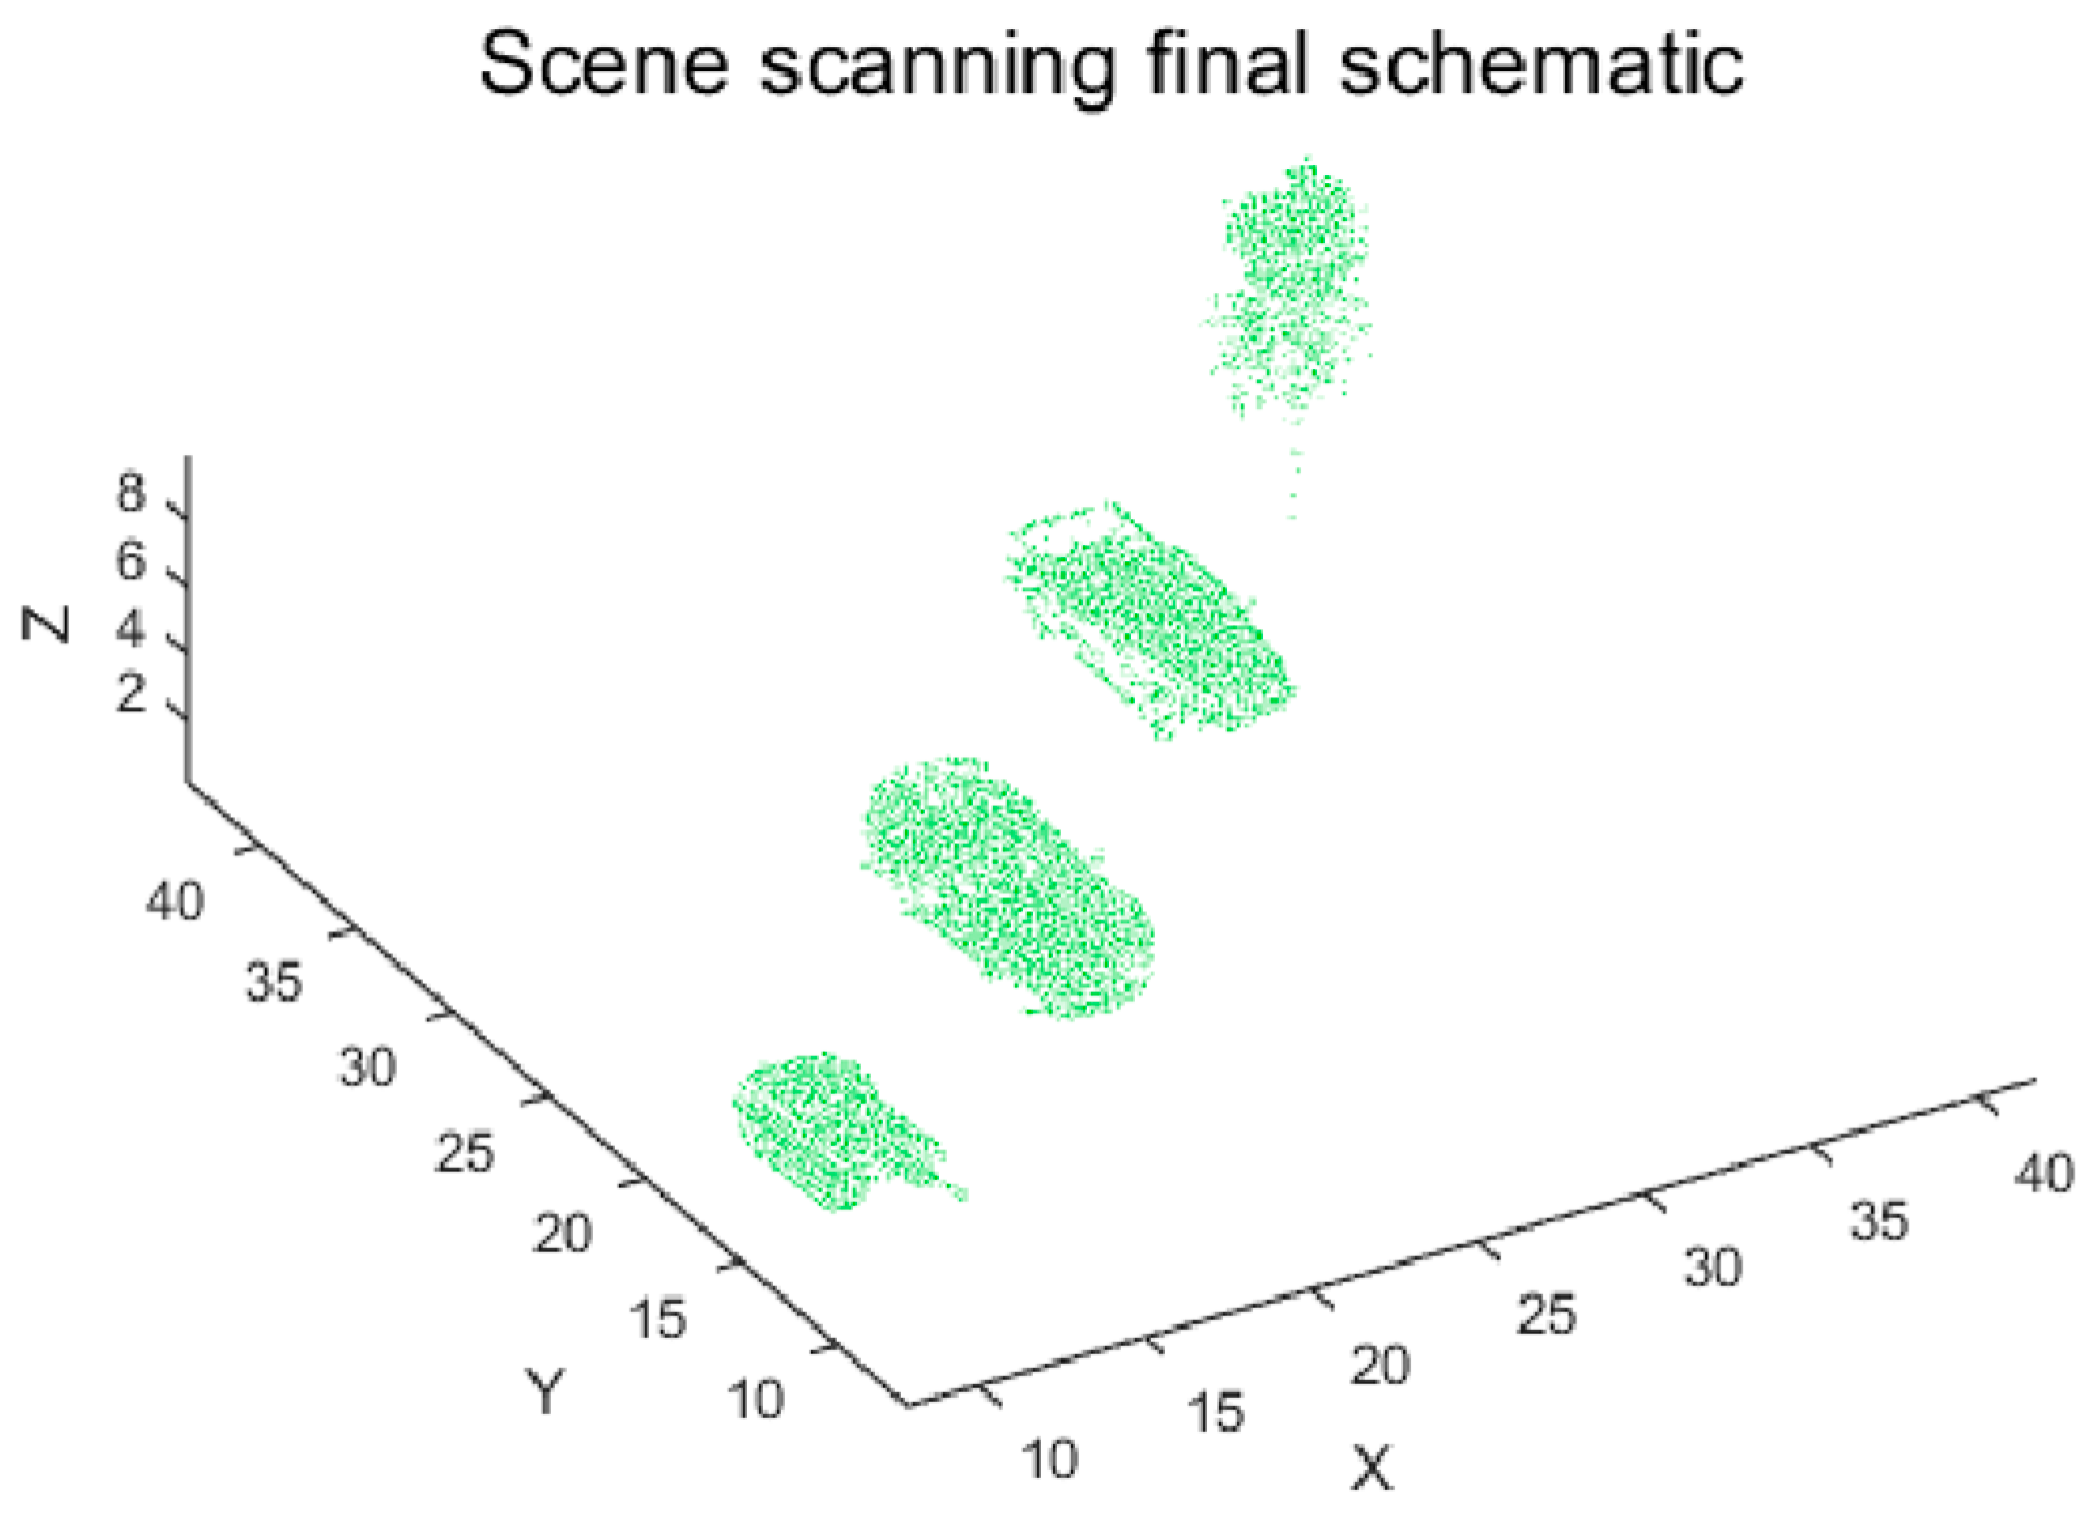
The proposed method achieves superior point cloud quality, scanning efficiency, and feature recognition performance. As demonstrated in
Figure 20, the final point cloud reaches a peak density of 51,419 points while maintaining blind spot-free coverage with edge aberration below 2%. The scanning process achieves 100% target area coverage at 25 m altitude through an optimized velocity ratio (1:0.618) that prevents duplicate coverage and zero phase difference, enabling symmetric initialization. Notably, the system demonstrates the ability to reconstruct key geometric features of the gun barrel with high contour fidelity and dense point coverage at 25 m altitude. While an exact geometric resolution cannot be asserted, the observed point cloud density and distribution suggest that the system achieves fine-structure recognition capability sufficient for target identification.
This configuration satisfies all requirements for high-precision laser imaging fuzes, particularly in battlefield target identification, real-time 3D reconstruction, and critical component analysis.
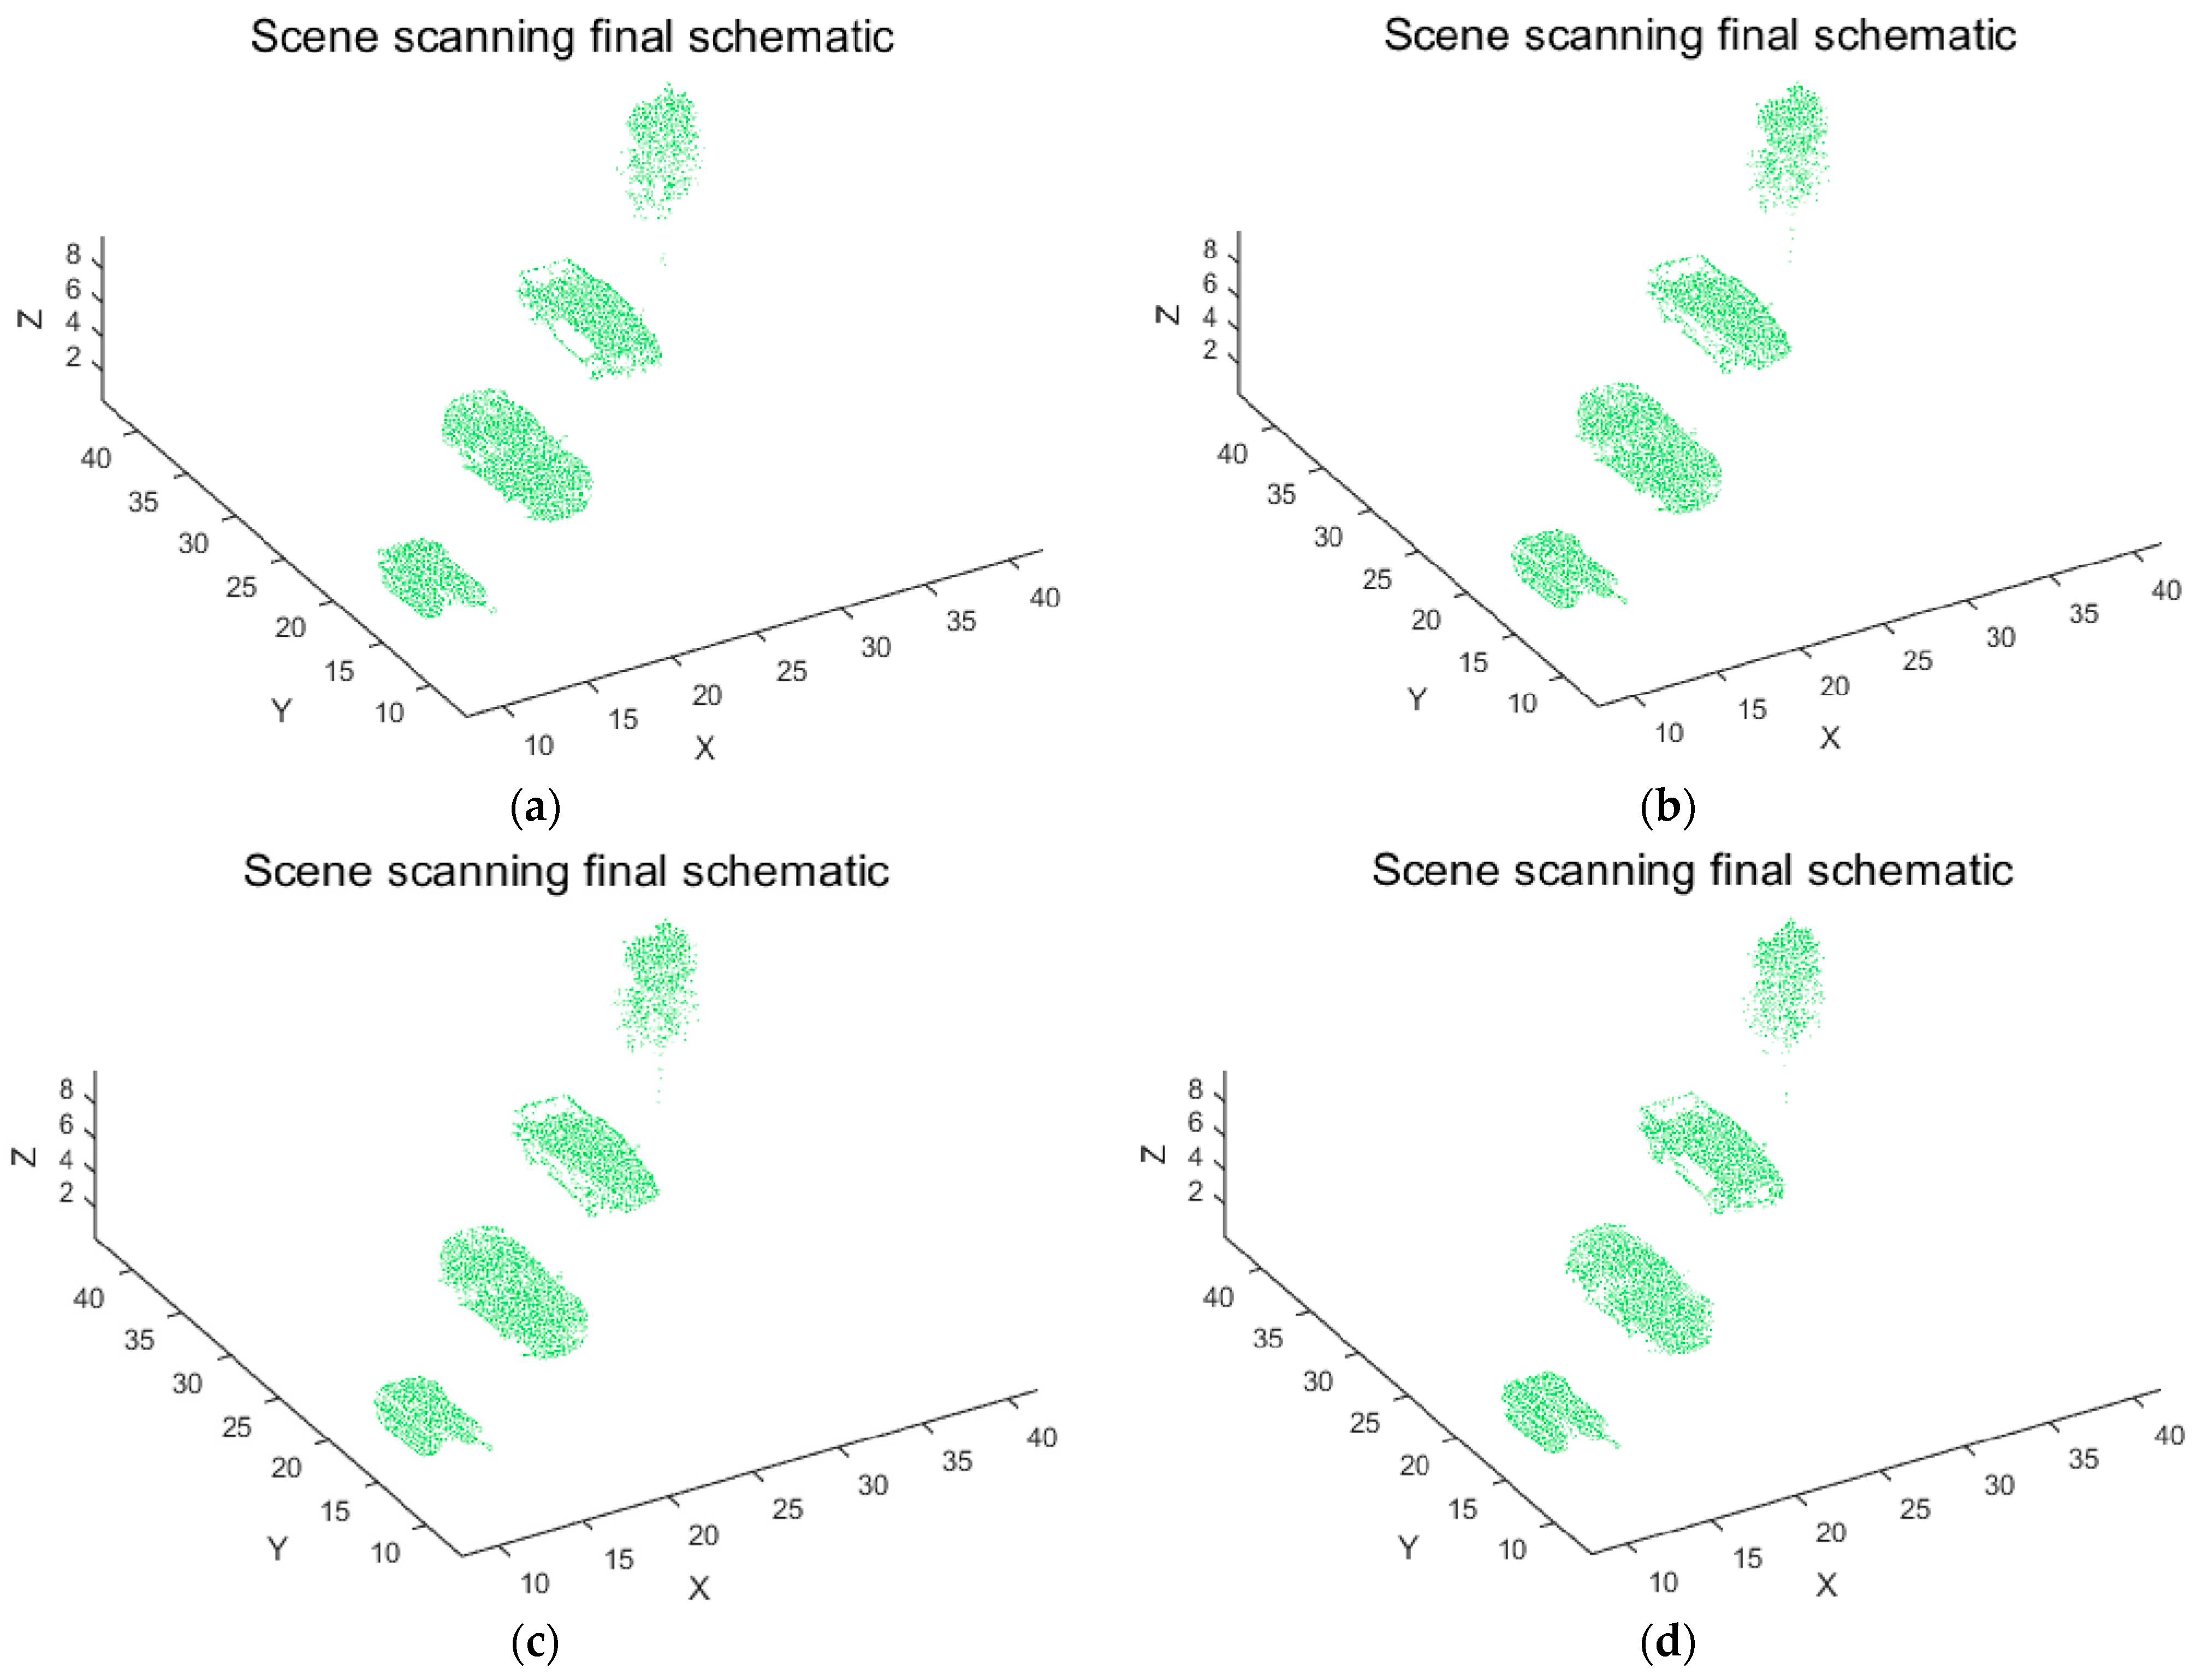
Having determined the optimal system parameters through comprehensive analysis, we now examine whether this parameter combination remains valid across other flight velocities.
Figure 21 illustrates the distribution patterns of target point cloud counts under the optimized parameters across the evaluated flight velocities.
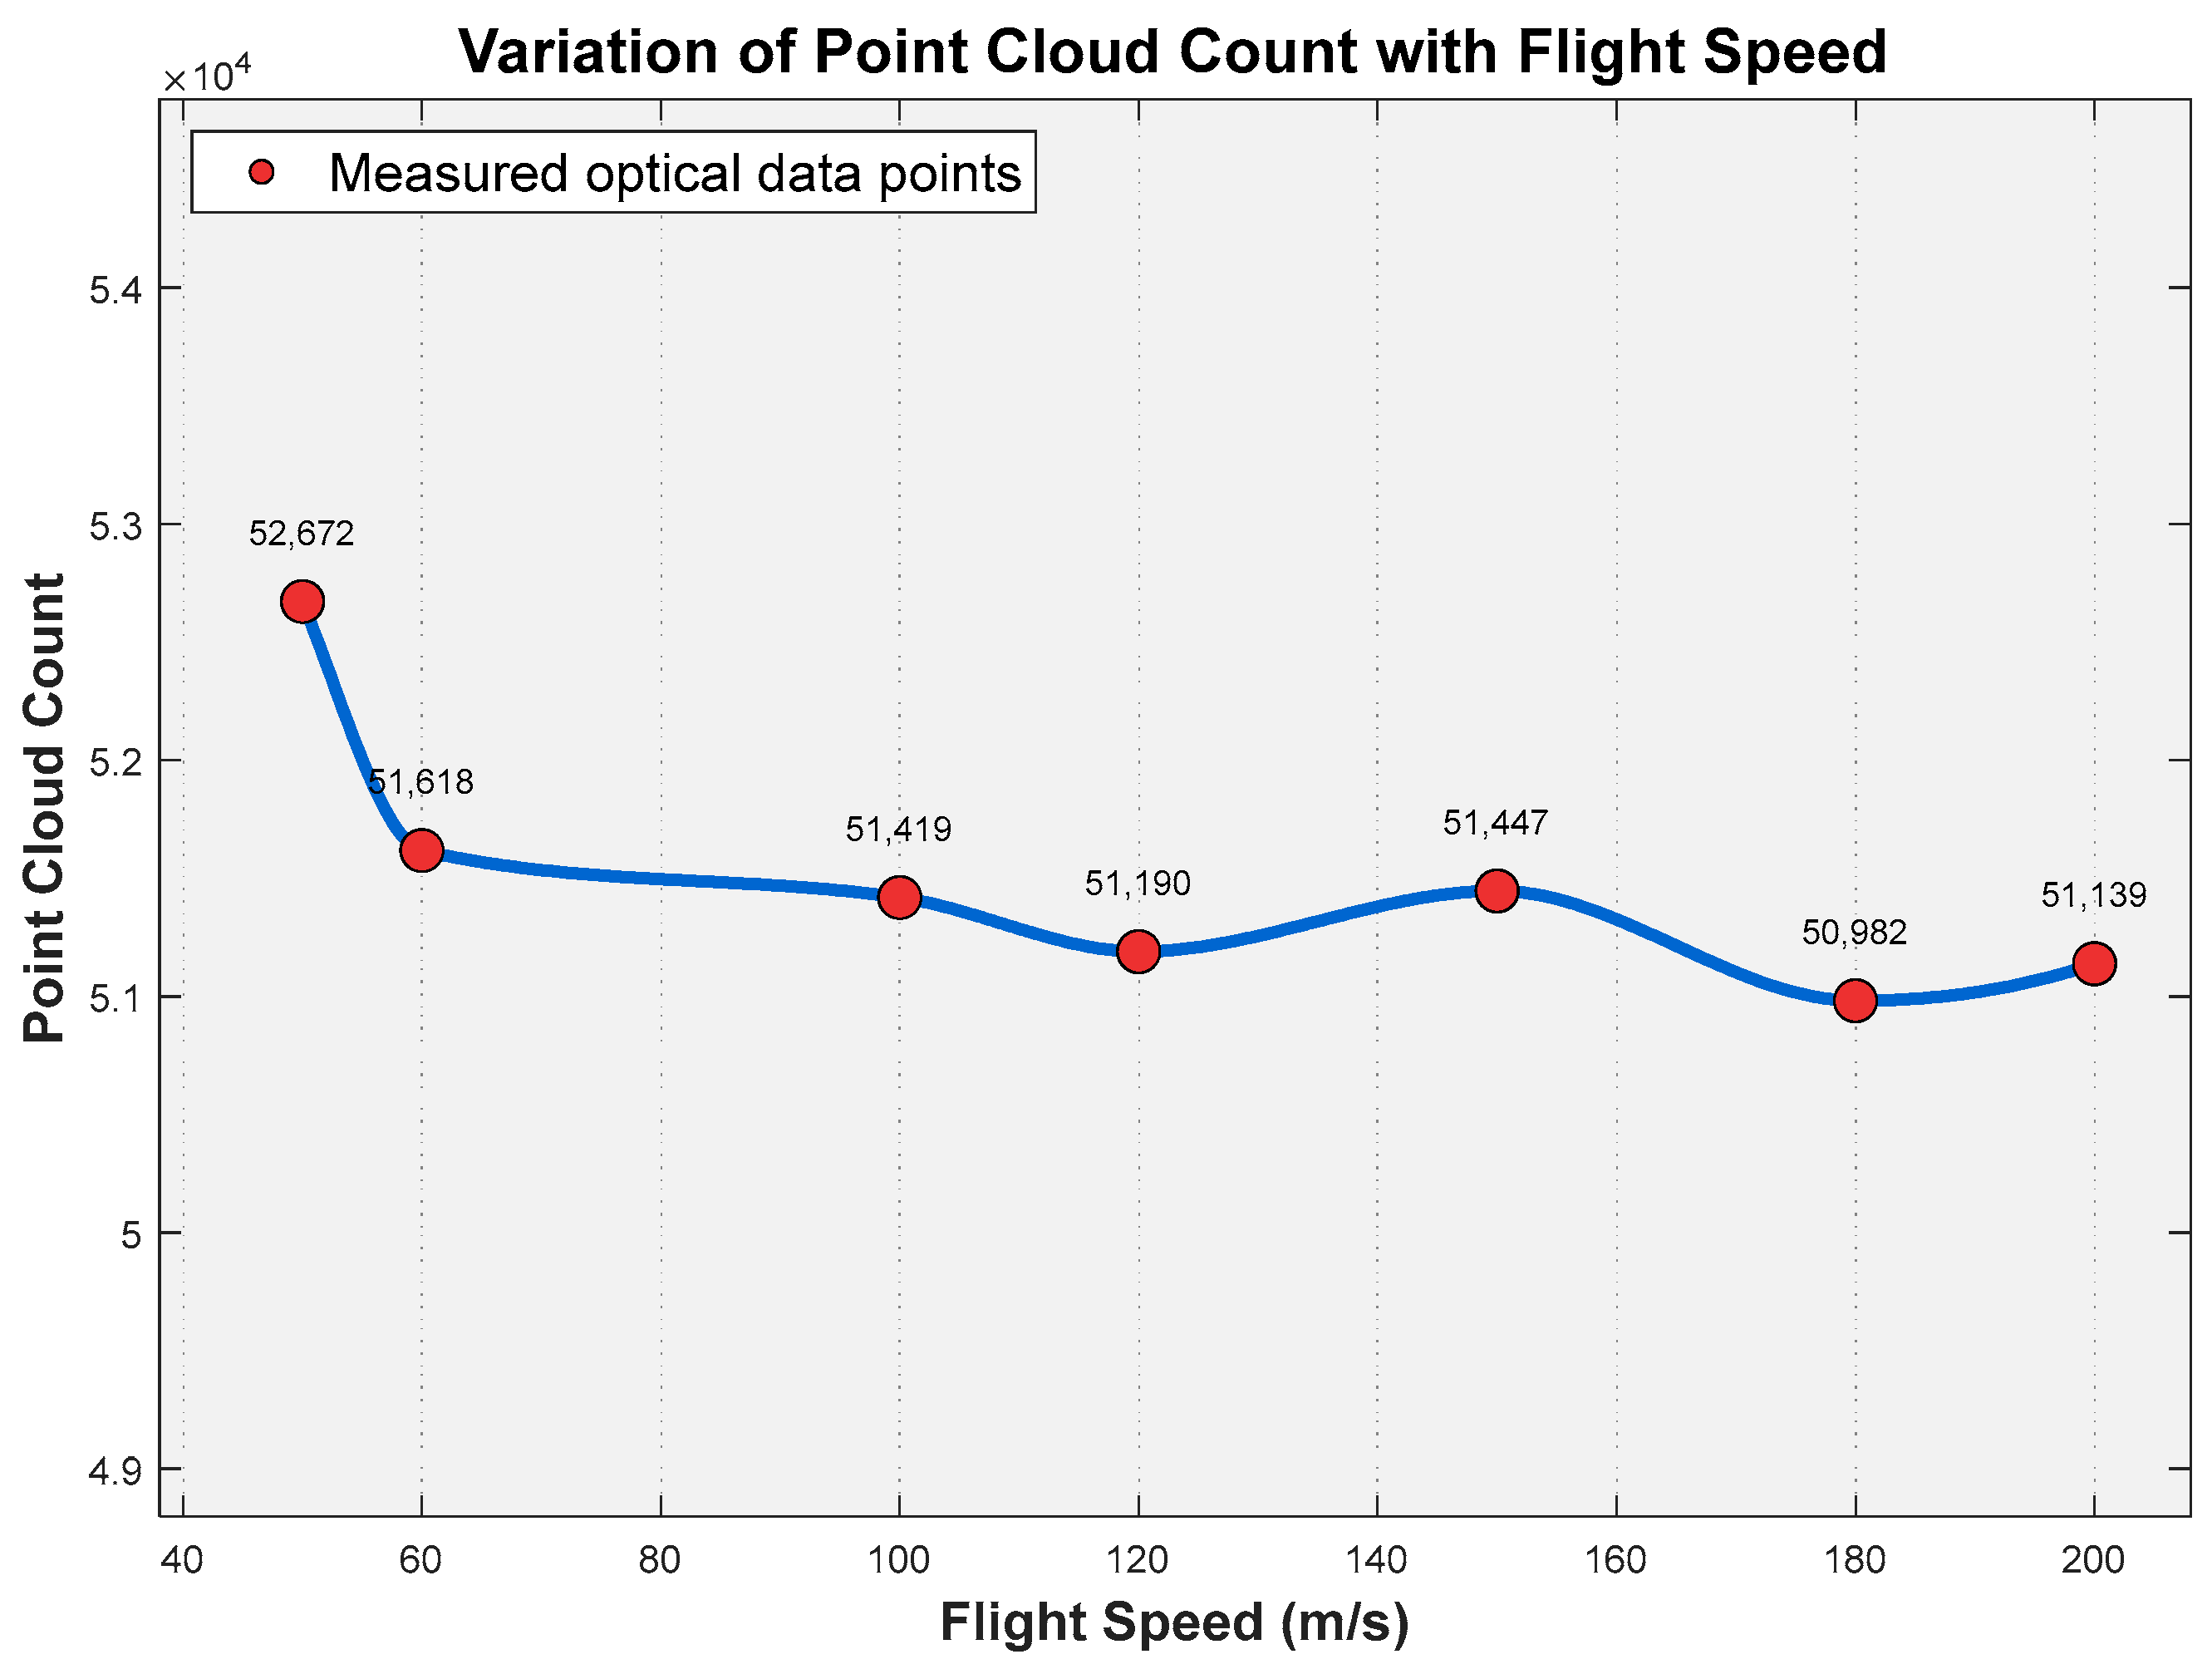
Figure 22 presents the point cloud counts corresponding to different flight velocities within the 50–200 m/s range. Computational results obtained using the Möller–Trumbore algorithm demonstrate that the system maintains excellent point cloud stability across this flight velocity range:
At the baseline velocity of 100 m/s, the point cloud count was 51,419.
Point cloud counts peaked at 52,672 and 50,982 at the lower velocity of 50 m/s and the higher velocity of 200 m/s, respectively.
Relative to the 100 m/s baseline, the overall fluctuation in point cloud count was only 3.3%.
In high-speed flight scenarios, the relative motion between the projectile and the target during the round-trip travel time of a light beam introduces a time delay displacement error. This study, however, effectively mitigates the accumulated errors inherent in conventional Time-of-Flight (TOF) ranging by employing the Möller–Trumbore ray–triangle intersection algorithm (as implemented by Equations (19)–(21)) to compute the spatial intersection point between the beam and the target’s triangular face elements in real time.
It is critical to emphasize that this system is specifically designed for fuzing applications. Its primary objective is the real-time identification of targets and actuation during high-speed engagements, rather than achieving absolute ranging accuracy. As demonstrated in
Figure 20, the system successfully reconstructs the curved surface of the barrel with sufficient clarity at a relative velocity of 100 m/s. This validates that the system meets the core requirement for relative position identification accuracy within the fuze operational context.
We are committed to establishing a comprehensive, wide-ranging accuracy evaluation framework and to further investigating high-speed dynamic error compensation mechanisms in subsequent research.


