Article

Quantitative Evaluation of Optical Clearing Agent Performance Based on Multilayer Monte Carlo and Diffusion Modeling

by
Lu Fu
1,2,
Changlun Hou
1,2,*,
Dongbiao Zhang
3,
Zhen Shi
1,2,
Jufeng Zhao
1,2 and
Guangmang Cui
1,2
1
School of Electronics and Information, Hangzhou Dianzi University, Hangzhou 310018, China
2
Zhejiang Key Laboratory of Optoelectronic Intelligent Imaging and Aerospace Sensing, Hangzhou Dianzi University, Hangzhou 310018, China
3
Hangzhou Photographic Machinery Research Institute Co., Ltd., Hangzhou 310013, China
*
Author to whom correspondence should be addressed.
Photonics 2025, 12(8), 751; https://doi.org/10.3390/photonics12080751
Submission received: 14 June 2025 / Revised: 13 July 2025 / Accepted: 22 July 2025 / Published: 25 July 2025
(This article belongs to the Section Biophotonics and Biomedical Optics)

Abstract

Optical clearing agents (OCAs) offer a promising approach to enhance skin transparency by reducing scattering and improving photon transmission, which is critical for non-invasive optical diagnostics such as glucose sensing and vascular imaging. However, the complex multilayered structure of skin and anatomical variability across different regions pose challenges for accurately evaluating OCA performance. In this study, we developed a multilayer Monte Carlo (MC) simulation model integrated with a depth- and time-resolved diffusion model based on Fick’s law to quantitatively assess the combined effects of OCA penetration depth and refractive index change on optical clearing. The model incorporates realistic skin parameters, including variable stratum corneum thicknesses, and was validated through in vivo experiments using glycerol and glucose at different concentrations. Both the simulation and experimental results demonstrate that increased stratum corneum thickness significantly reduces blood absorption of light and lowers the clearing efficiency of OCAs. The primary influence of stratum corneum thickness lies in requiring a greater degree of refractive index matching rather than necessitating a deeper OCA penetration depth to achieve effective optical clearing. These findings underscore the importance of considering regional skin differences when selecting OCAs and designing treatment protocols. This work provides quantitative insights into the interaction between tissue structure and optical response, supporting improved application strategies in clinical diagnostics.

1. Introduction

There are hundreds of millions of diabetes patients in the world who endure the daily challenges of their condition while also needing to regularly draw blood to monitor glucose levels; this routine significantly affects their quality of life [1]. With advancements in modern medicine and biology, non-invasive optical detection techniques have been increasingly applied in medical diagnostics [2,3,4,5,6]. These techniques leverage the interaction between light and biological tissues to extract optical and physiological information, such as glucose concentration, oxygen saturation, and blood flow. However, the highly scattering and multilayered nature of skin tissue complicates light propagation, and the presence of tissue auto-fluorescence further limits the sensitivity and accuracy of detection [7]. Recent studies have explored novel strategies for deep tissue imaging using long-wavelength emissive metallacycles, which offer an enhanced penetration depth and therapeutic potential in biomedical applications [8,9,10].
Professor Valery V. Tuchin [11] was the first to propose that light penetration depth and resolution can be significantly improved by reducing tissue scattering coefficients through refractive index matching with optical clearing agents (OCAs). This approach shows great potential in optimizing optical detection performance [12,13]. While numerous studies have investigated the effectiveness of OCAs, most of them assume homogeneous tissue properties and overlook both the multilayered structure of human skin and the anatomical variability across different skin regions. Moreover, the relationship between OCA diffusion dynamics, refractive index matching, and optical clearing efficiency remains poorly quantified.
The skin is the largest organ of the human body and can be roughly divided into three parts: the outermost epidermis, the vascularized dermis, and the subcutaneous tissue. The outermost layer of the epidermis is the stratum corneum, composed of keratinocytes that lack cellular activity. These keratinocytes are tightly packed, forming a dense barrier that prevents water loss and blocks harmful external substances. The stratum corneum, as the thinnest layer, serves as the primary obstacle to the penetration of OCAs into the skin. Beneath the epidermis lies the dermis, which contains a network of capillaries and serves as a critical target for biological detection due to its reflection of physiological and pathological states. Focusing detection light on this layer could greatly enhance detection accuracy. In 2007, Vellekoop et al. [14] introduced wavefront shaping technology, which employs a spatial light modulator (SLM) to precisely manipulate light wavefronts. By combining feedback signals with optimization algorithms, this technique can overcome scattering effects and focus light on specific target regions. Below the dermis, the subcutaneous tissue forms the deepest and thickest layer, consisting primarily of adipose tissue, connective tissue, nerves, and a small number of blood vessels. For non-invasive detection, blood is the primary target material, containing key biomarkers such as glucose concentration [15], oxygen saturation [16], and blood flow [17]. However, due to the uneven distribution of capillaries within the dermis, a simplified three-layer skin model cannot accurately reflect the spatial variations in the blood content. To address this limitation, Meglinski [18] proposed a more detailed seven-layer skin model. In this model, the epidermis is subdivided into the stratum corneum and the viable epidermis based on cellular activity, while the dermis is divided into four layers according to blood content: the papillary dermis, upper blood net dermis, reticular dermis, and deep blood net dermis.
In this study, we developed a simulation model for evaluating OCA penetration and its influence on photon transport by integrating a diffusion model based on Fick’s law with the multilayer Monte Carlo (MC) skin model previously proposed by Meglinski [18]. To better reflect anatomical variability, the model incorporated different stratum corneum thicknesses, recognizing its critical role as a diffusion barrier with high scattering and low permeability. Experimental validation was performed using in vivo measurements with different OCA types and concentrations. Our goal was to quantify the relationships among OCA penetration depth, refractive index matching, and optical clearing performance under anatomically realistic conditions. By integrating numerical modeling with experimental data, this study aims to contribute to a better understanding of how OCA selection and application strategies can be refined for non-invasive optical diagnostics and therapeutic use.

2. Materials and Methods

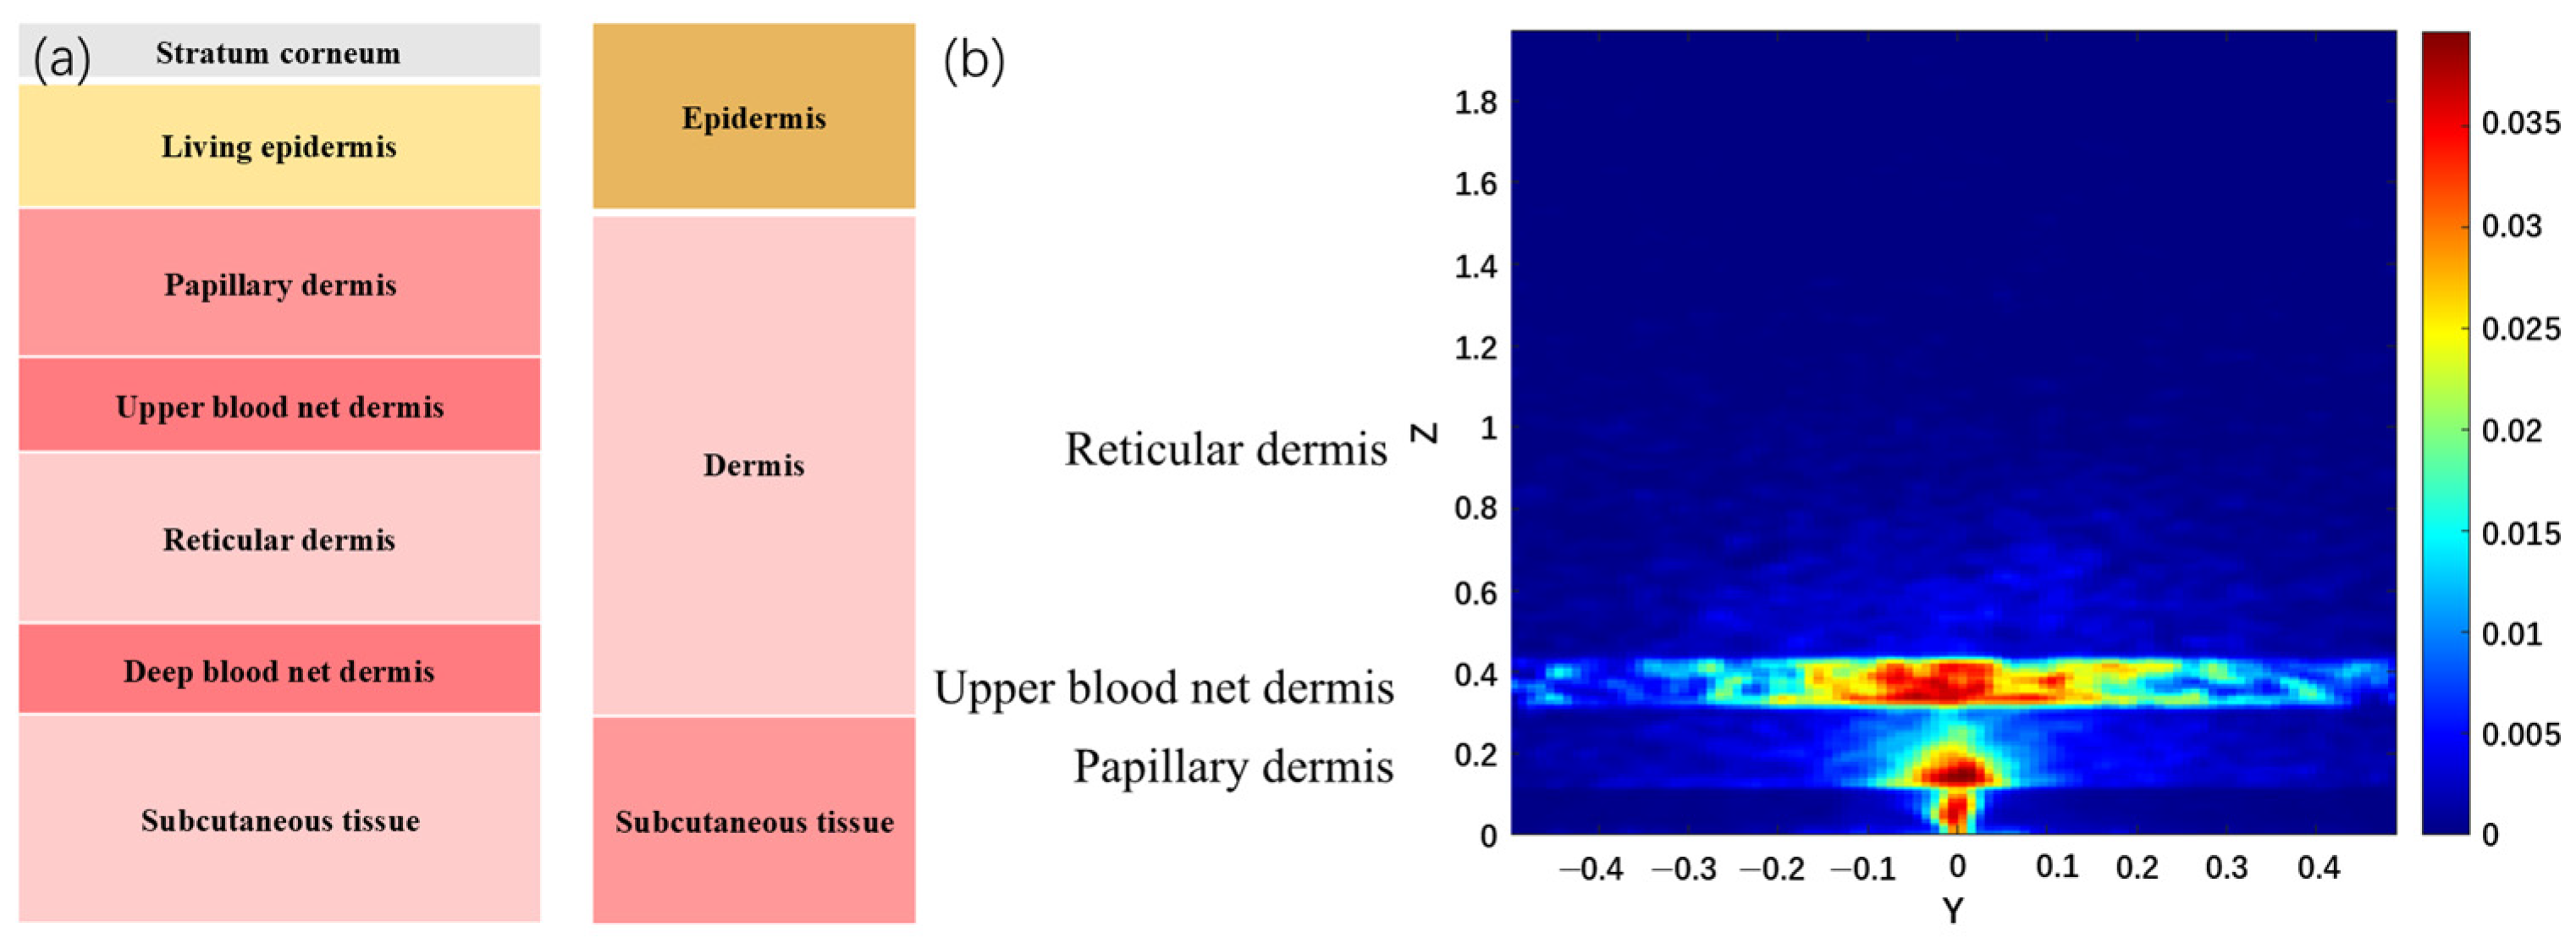
2.1. MC Simulation of Optical Ray Transmission Property in Skin Tissue

Skin is a highly scattering biological medium with a complex structure encompassing various scattering mechanisms. Traditional analytical methods often fail to accurately describe light propagation in such multilayered media. The MC method, implemented in this study using MATLAB, R2021a, simulates the trajectories of numerous photons through random sampling and achieves high-precision results without requiring analytical solutions to complex equations [19].
MC simulations for skin involve five key parameters: the absorption coefficient μa, scattering coefficient μs, refractive index n, anisotropy factor g, and thickness z. Photons are initialized with specific position, direction, and weight based on incident light conditions. The step size of photon propagation is determined randomly, and both scattering and absorption are calculated based on the medium’s coefficients. At each step, the photon’s weight is reduced according to the absorption formula ω = ω μ s μ a + μ s , and its direction is adjusted randomly based on the phase function. The photon propagation ends when its weight falls below a preset threshold or when it exits the medium. The absorption rate of each layer is quantified by the total absorbed photon weight. The optical parameters at a wavelength of 632.8 nm and the blood content of each skin layer are summarized in Table 1.
Blood content refers to the proportion of blood volume to the total volume of the layer. In our simulation model, the three blood-rich layers (layers 4–6) were defined as the primary absorptive regions and were used as the basis for evaluating blood absorption. Figure 1a shows the skin models, namely the seven-layer model on the left and the three-layer model on the right, and the MC simulation was conducted using the seven-layer skin model. The results, obtained with ten million photons, are presented in Figure 1b. To ensure a conservative estimation of photon propagation and OCA effectiveness, the thicknesses of the skin layers were selected from the upper bound of the ranges reported in the literature.
The figure only displays light propagation up to a depth of 2.0 mm as absorption beyond this depth becomes negligible. The figure clearly illustrates that the skin’s layered structure results in a correspondingly layered distribution of light absorption. Moreover, pronounced scattering is observed, with light spreading in an approximately fan-shaped pattern within the tissue. Primary absorption occurs within the dermis layer of the skin, particularly in the papillary dermis (Layer 3), the upper blood net dermis (Layer 4), and the reticular dermis (Layer 5). In addition to the data shown in Table 2, there is a 4% specular reflectance at the skin surface, which was set during the model’s construction. This reflected light is directly reflected and does not enter the skin.
The laser used in our experimental setup was a DH-HN250 model, with an output power of approximately 1.8 mW. To minimize the influence of ambient light, all experiments were conducted within a light-shielding enclosure, which created a localized darkroom environment around the experimental setup. As shown in Figure 2a, the enclosure is displayed in its open state. During the measurements, it was placed over the setup, with the subject’s arm inserted through the designated opening and positioned on the platform, as illustrated in Figure 2b. A schematic diagram of the detection setup is provided in Figure 2c. The rotation stage was rotated at a rate of 1° every 1 s, with the detector recording a measurement at each step. Since the laser power exceeded the detection threshold, the detector was unable to measure the total energy directly. As a result, the total energy was determined indirectly by integrating the diffuse reflectance from a barium sulfate reference. Measurements were taken separately with barium sulfate and with the skin sample, and the ratio of the two values was used to calculate the diffuse reflectance of the skin.
In a previous study [21], the stratum corneum thickness was reported to be approximately 20 μm for the forearm and up to 173 μm for the palm. These values were adopted in our simulation models to represent anatomical differences across body sites. For the forearm model, the simulated diffuse reflectance was 62.31%. After adding 4% specular reflection, the total reflectance was 66.31%, with a relative error of 5.3% compared to the experimental value of 70%. For the palm, the simulation gave a diffuse reflectance of 87.55%, and the total reflectance including the specular component was 91.55%, which slightly overestimated the measured value of 87%, resulting in a relative error of 5.2%.

2.2. Effect of OCAs

2.2.1. Mie Scattering Theory for OCAs

Due to the significant scattering of light by skin, the performance of in vivo optical detection is significantly limited. To address this limitation, OCAs have been widely used to enhance tissue transparency prior to optical detection [22,23]. A variety of substances have been identified as effective OCAs, including alcohols, sugars, organic acids, and other organic solvents [24,25,26,27,28]. Optical clearing relies on three main theoretical approaches: tissue refractive index matching, dehydration, and collagen fiber dissociation. Among these, refractive index matching is widely recognized as the fundamental principle in skin optical clearing technology [29,30]. In this study, the impact of refractive index matching on the transparency effect was analyzed.
As the diameter of skin cells typically ranges from 0.4 to 20 µm [31], similar to the infrared wavelength, the Mie scattering theory, which can provide an accurate mathematical description of particle scattering behavior and is applicable when the particle size is comparable to the wavelength [32], is applicable for solving optical characteristics. According to the theory of refractive index matching, scattering primarily arises from differences in refractive indices between the scattering medium in skin tissue and the surrounding background medium [33], and optical transparency can be achieved by reducing the refractive index mismatch between them. Based on refractive index values, skin tissue components can be categorized into scattering media and background media. Cytoplasm and intercellular fluid, which have similar and relatively low refractive indices, are considered the background medium with nbkg ≈ 1.35 [34], while connective fibers, cell nuclei, and organelles are regarded as scattering media with higher refractive indices nbkg ≈ 1.46 [35].
For a monodisperse scattering system, the reduced scattering coefficient is approximately calculated using Equation (1) [36]:
μ s = μ s 1 g = 3.28 π r 2 ρ s 2 π r / λ 0.37 n s c a t n b k g 1 2.09
where is μ s , is the reduced scattering coefficient, g is the anisotropy factor, r is the radius of the scattering particle, ρs is the particle concentration, and λ is the wavelength. From this equation, it can be observed that μs is proportional to n s c a t n b k g 1 2.09 , where the refractive index ratio n s c a t / n b k g is calculated to be 1.08148. Accordingly, the scattering coefficient can be expressed as Equation (2):
μ s = k n s c a t n b k g 1 2.09
It is evident that the scattering coefficient is positively correlated with the difference in the refractive index. An increase in the background refractive index leads to a decrease in the scattering coefficient, demonstrating a light-clearing effect. Therefore, when the background refractive index is scaled by a factor of n b k g = a n b k g , a 1.08148 , the new scattering coefficient is expressed as Equation (3):
μ s n e w = 1.08148 a 0.08148 a 2.09 μ s
It can be observed that when the background refractive index increases by 1%, the scattering coefficient rapidly decreases to 74% of its original value, indicating that the refractive index has a significant impact on the scattering coefficient. As shown in Figure 3, the optical energy distributions in the skin with varying background refractive indices across different layers were simulated using the MC method.
As shown in Figure 4, increasing the background refractive index significantly reduces scattering, resulting in enhanced absorption in blood-containing layers and a more concentrated energy distribution. Figure 3 illustrates how the absorption rate, diffuse reflectance, and penetration depth vary with the refractive index of each skin background layer.
As the change in the refractive index increases, the scattering coefficient decreases, leading to fewer backscattered photons and a gradual decline in diffuse reflectance. The penetration depth reaches its maximum when the refractive index change is approximately 0.07 and then rapidly decreases. This behavior is explained by the weight change formula ω = ω μ s μ a + μ s . Generally, μs is several orders of magnitude larger than μa. However, when μs becomes comparable to μa, photons travel only a few steps before dissipating, sharply reducing the penetration depth. The trend in absorption rate changes is more complex, with two peaks visible in Figure 4. The decline in the first peak is primarily attributed to the increase in the photon penetration depth, and most photons pass through the blood-containing layers and are absorbed by the subcutaneous tissue, leading to a decrease in the absorption rate. The second peak’s decline is due to the sharp drop in the photon penetration depth, causing absorption at the skin’s surface; the increase results from the combined effects of the changing penetration depth and the reduced scattering coefficient.
Fat emulsion solution is an intravenous fat emulsion composed of refined soybean oil and lecithin. The high-refractive-index soybean oil is encapsulated by lecithin into microspheres that are uniformly suspended in the aqueous solution, giving the emulsion stable scattering properties similar to those of biological tissues [37,38]. Therefore, fat emulsion is widely used as a common tissue phantom in biomedical photonics research, particularly in studies related to tissue scattering and the development of new techniques [39]. Although the lipid emulsion solution does not possess stratification characteristics, it remains effective for evaluating the optical clearing performance of the agent, providing support for subsequent in vivo skin experiments with topical application. A 5% fat emulsion solution was used as a substitute for human skin, various OCAs were added in a 1:1 ratio [29], and the mixture was placed in a cuvette. The results of direct visual observation are shown in Figure 5.
Figure 5a shows the clearest image, with Figure 5b displaying moderate clarity. In contrast, the remaining images are significantly blurred and difficult to distinguish. To facilitate a more intuitive comparison of the light transmittance effects of different types and concentrations of OCAs, an integrating sphere was employed to measure their light transmittance, as shown in Figure 6.
Both direct observation and spectral transmittance analysis reveal that in a 5% fat emulsion solution, glycerol exhibits superior optical clearing effects compared to glucose, while glucose outperforms tartrazine. Furthermore, glycerol’s good water compatibility removes solubility constraints, allowing for higher concentrations and significantly improving its optical clearing performance.

2.2.2. Penetration of OCAs in Skin

OCAs can modify the refractive index of the region into which they diffuse. OCAs gradually permeate through the skin, and the refractive index changes in each layer are not uniform, as previously discussed. Therefore, the diffusion process of OCAs within the skin plays a crucial role in improving optical clearing. Shariati et al. [40] used ultrasound to enhance the penetration of OCAs and integrated three optical clearing techniques (OCAs, ultrasound, and time-based optical clearing) to improve the optical penetration depth in biological tissues. In chicken breast tissue, they achieved an enhancement in the optical penetration depth by a factor of ten (from 0.67 cm to 6.7 cm), setting a new record in the literature.
The diffusion behavior of OCAs within the skin can be described by Fick’s law of diffusion, which characterizes the process through the diffusion coefficient and the concentration gradient [35]. A diffusion model for OCAs in the skin was established based on Fick’s law, which was divided into steady-state and transient components for analysis. These components are applicable to different time scales and experimental conditions, respectively.
In the early stages of diffusion, when penetration is shallow, the process can be approximated using a semi-infinite medium model, as described by the one-dimensional transient form of Fick’s law given in Equation (4).
C x , t t = D 2 C x , t x 2
The concentration of the OCA, C (x, t), depends on the position, x; time, t; and diffusion coefficient, D. In fact, the diffusion coefficients vary across different skin layers, with the stratum corneum typically exhibiting a significantly lower D compared to other layers. However, in the subsequent simulations, we used penetration depth as the primary parameter and did not compute the diffusion time for specific OCAs. Therefore, these differences were not distinguished in our model. The initial and boundary conditions are as follows: at the initial time (t = 0), no solute has diffused into the skin (C(x, 0) = 0); at the skin surface (x = 0), the concentration is maintained at C0 (C (0, t) = C0); and at the deep layers of the skin (x→∞), the concentration remains at 0 (C(x→∞, t) = 0).
The concentration solution to the diffusion equation is given as Equation (5):
C x , t = C 0 e r f c x 2 D t
where erfc is the complementary error function, and it is commonly approximated that erfc(3) ≈ 0, indicating negligible diffusion beyond this point.
The transient penetration depth of the OCAs, xp, can be calculated using Equation (6):
x p = 6 D t
From Equation (6), it can be observed that the concentration distribution during the early diffusion stage is related not only to time but also to the diffusion coefficient of the substance within the skin. OCAs with a higher diffusion coefficient exhibit superior diffusion performance during the initial diffusion stage. For glycerol (with a diffusion coefficient in the skin of about 0.84 μm2/s [41]), it takes approximately 90 min to penetrate the stratum corneum. In contrast, small-molecule organic solvents such as DMSO can penetrate the stratum corneum in approximately 10 min. However, due to the potential cytotoxicity and irritancy of DMSO, it should be used with caution, especially under high concentrations or prolonged exposure, which limits its practicality in real-world applications. Wang et al. [42] effectively mitigated DMSO-induced skin damage by combining DMSO with fructose.
At the later stage of diffusion, the substance reaches a steady-state distribution in the skin, where the concentration gradient becomes time-invariant, so the second derivative of the concentration with respect to position is equal to zero, expressed as 2 C x , t x 2 = 0 .
Under these conditions, Fick’s law can be simplified to Equation (7):
C x = C 0 1 x / L , C 0 C max
where C 0 is the concentration of the OCA at the skin’s surface, L is the thickness of the skin, and Cmax is the saturation concentration of the OCA on the skin’s surface. It can be observed that at the diffusion stage’s end, the concentration distribution of the OCA in the skin is primarily dependent on C0. Thus, OCAs with higher saturation concentrations in the skin are more effective in achieving optical clearing.
Under transient conditions, light absorption by blood is influenced by the D, t, and the change in the background refractive index. The product D*t determines the penetration depth of the OCA. In our simulation, we assumed that the refractive index change is linearly proportional to the OCA concentration. Figure 7 presents the relationship among blood absorption, refractive index change, and penetration depth. The x-axis indicates the refractive index change at the skin surface (that is, at x equals zero), which corresponds to the maximum index change caused by the initial OCA concentration. The y-axis shows the depth at which the refractive index, or equivalently the OCA concentration, approaches zero.
From Equation (6), the product of the diffusion coefficient and time (D*t) can be calculated using a known penetration depth xp. Given the boundary condition and the erfc distribution pattern, we can compute the OCA concentration in each skin layer and then linearly convert it into the corresponding refractive index change. Since the multilayer MC model is discretized, it cannot precisely describe the continuous gradient of the OCA concentration within each layer. Therefore, Equation (8) was used to estimate the average OCA concentration in each layer. The relationship between the refractive index and the scattering coefficient is described in Equation (3).
C n = d 0 d 1 C 0 e r f c x 2 D t d x d 1 d 0
where D*t is a computed constant, and d0 and d1 denote the starting and ending depths of the layer, respectively.
Steady-state conditions can be regarded as a special case of transient conditions. When the penetration depth exceeds the skin thickness, the system is considered to have reached a steady state. Thus, the image under steady-state conditions can be interpreted as a slice of the transient process at a penetration depth equal to the skin thickness. The saturation concentration of the OCA in the skin determines the maximum refractive index change.
Overall, the absorption rate increases with both penetration depth and refractive index change, consistent with earlier theoretical predictions. However, several peaks are observed in Figure 7, with the most prominent one occurring at (0.6, 1200). These peaks can be attributed to the previously discussed mechanism: as the scattering coefficient of the blood-containing layer decreases, more photons pass through it and are absorbed by the underlying tissue. From the figure, it is evident that when the stratum corneum thickness is 20 μm, achieving an effective optical clearing effect requires a minimum penetration depth of 400 μm and at least a 1% increase in the refractive index.
The penetration behavior of OCAs is influenced not only by their physicochemical properties but also by the structural characteristics of the skin. It has been found that intra-individual differences between skin sites are often greater than inter-individual differences at the same site [43]. The stratum corneum, as the primary barrier against external substances, has both a lower diffusion coefficient and a higher scattering coefficient compared to the underlying skin layers. To further investigate how skin structural variations affect OCA diffusion, we extended the simulation model established earlier by incorporating varying stratum corneum thicknesses to analyze the diffusion process and resulting changes in optical parameters. And we designed a comparative experiment using volar forearm and palm skin samples to compare their optical clearing performance under OCA treatment, aiming to evaluate how structural differences influence OCA penetration and transparency enhancement. Figure 8 shows the simulated absorption distributions under different stratum corneum thicknesses, while Figure 9 presents the corresponding diffuse reflectance results. All subfigures use a unified color scale for consistency and comparison.
To ensure safety, experiments were conducted using widely accepted OCAs: glycerol and glucose [44]. The diffuse reflectance of the palm region and the inner forearm was measured using the setup illustrated in Figure 2. The corresponding skin region was immersed in the designated OCA solution. During the measurement, a cover was used to block external interference. The laser was then directed onto the corresponding skin area, and the device was activated to record experimental data. Reflectance data were collected every 10 min, with each acquisition taking approximately 3 min. Since no OCA was applied during data collection, the acquisition time was not included in the total OCA application duration. The experimental results are shown in Figure 10.
The experimental results show that for both the forearm and the palm, the diffuse reflectance gradually decreased over time with the application of two different concentrations of OCAs. Higher concentrations led to more pronounced reductions, but the difference between 20% and 30% glucose was relatively small. However, regions with a thicker stratum corneum exhibited higher baseline reflectance and weaker clearing effects. This trend is consistent with the simulation results shown in Figure 9, supporting the validity of the absorption distribution illustrated in Figure 8.

3. Results

We implemented a multilayer MC simulation of skin using MATLAB based on previously reported optical parameters of human skin. To better reflect the complexity of real skin tissue, the MC model incorporated a seven-layer skin structure, which more accurately captures the variations in blood content and optical properties across different tissue depths. Since it is not feasible to directly measure the absorption coefficient of each skin layer experimentally, we validated the accuracy of our model by measuring the diffuse reflectance at the skin surface. The model yielded relative errors of 5.3% (forearm) and 5.2% (palm) in total reflectance compared to the experimental values, indicating its reasonable accuracy in reflecting anatomical variability.
Building upon this, we modeled blood absorption using three layers with higher blood content and conducted quantitative simulations to investigate how refractive index matching affects blood absorption, diffuse reflectance, and light penetration depth. The simulation results demonstrated that even slight changes in refractive index could rapidly enhance both blood absorption and photon penetration depth. However, as the degree of refractive index matching continued to increase, a notable decline in both absorption and penetration was observed. As previously discussed, this occurs because when the scattering coefficient decreases to a level comparable to the absorption coefficient, photons are more likely to be absorbed by the superficial layers of the skin. While this scenario represents an extreme case, it is unlikely to occur in practical applications, where refractive index matching remains relatively weak.
To experimentally validate these findings, we prepared several commonly used OCA solutions and employed a 5% intralipid emulsion to mimic skin tissue. An integrating sphere was used to measure the transmittance of these solutions. The results indicated that OCAs can reduce the scattering of 5% intralipid solution, with glycerol demonstrating significantly better optical clearing performance than other agents. Moreover, the clearing effect improved with an increasing concentration. However, the phenomenon where excessive refractive index matching leads to a decrease in optical transparency was not observed. This may be because even with a 75% glycerol concentration, the change in the refractive index remained insignificant.
Nonetheless, the above model assumes uniform refractive index matching across all layers, which does not fully reflect real physiological conditions. Therefore, based on Fick’s law of diffusion, a time- and space-dependent diffusion model was developed to simulate OCA diffusion in skin tissues under varying refractive index conditions. To further investigate the role of anatomical structure, simulations were performed across multiple stratum corneum thicknesses, with each resulting in a distinct relationship between the refractive index and penetration depth, and the results are shown in Figure 9. Simulations also suggested that when the stratum corneum thickness is less than 100 μm, effective optical clearing requires a minimum OCA penetration depth of approximately 400 μm and at least a 1% increase in the background refractive index. As the stratum corneum becomes thicker, both the required refractive index change and the necessary penetration depth increase accordingly. In vivo experiments confirmed the general trend that higher OCA concentrations and longer application durations enhance optical transparency. However, these experiments did not directly validate the specific thresholds predicted by the simulations. We are currently working on developing experimental approaches to quantitatively assess refractive index changes and penetration depth in vivo, aiming to verify the simulation-derived benchmarks more precisely. The determined quantitative thresholds provide valuable benchmarks for the future development of more effective and biocompatible OCAs.

4. Discussion

While it is well known that increasing the background refractive index improves tissue transparency, this study provides a quantitative analysis of how refractive index change and OCA penetration depth jointly affect photon propagation and diffuse reflectance under both transient and steady-state conditions. This perspective has been relatively less emphasized in prior work.
Further analysis of the OCA penetration model revealed that during the transient diffusion phase, the diffusion behavior is primarily governed by the diffusion coefficient. Agents such as DMSO, which possess high diffusion coefficients, rapidly traverse the stratum corneum and penetrate deeper skin layers, resulting in more pronounced optical clearing effects. However, such high diffusivity may also pose risks related to cytotoxicity, which warrants careful consideration. In contrast, during the steady-state phase, the concentration distribution is closely related to the OCA’s saturation concentration. Agents with higher saturation levels offer greater improvements in tissue transparency. In practical applications, higher OCA concentrations and extended application durations tend to enhance optical clarity, provided biocompatibility is maintained. Moreover, under the same concentration and duration, the reduction in diffuse reflectance was significantly lower on the palm than on the forearm, indicating that the anatomical site also affects OCA efficacy. This provides an additional perspective on the effectiveness of OCAs.
Based on this, we further investigated the impact of stratum corneum thickness. Simulation results indicated that a thicker stratum corneum requires a higher degree of refractive index matching to achieve satisfactory optical clearing. However, its impact on the effective penetration depth was not significant. We believe that the influence of the stratum corneum lies primarily in delaying the diffusion process, leading to a longer time required to reach the effective penetration depth rather than substantially altering the depth itself. We show that achieving sufficient light penetration and blood absorption enhancement depends not only on the choice and concentration of the OCA but also on the regional properties of the skin. These results are particularly relevant for non-invasive optical diagnostics, where device performance and measurement repeatability may be influenced by local skin characteristics.
Our work highlights the importance of selecting appropriate skin regions for OCA application and tailoring treatment protocols to maximize optical transparency. These insights can help improve the design and deployment of optical diagnostic systems and enhance their usability in real-world clinical and wearable settings. Nonetheless, certain limitations in the modeling and experimental setup should be acknowledged. In the simulations, changes in the background refractive index were directly predefined without quantitatively linking them to the OCA concentration. In reality, the refractive index response to different OCAs and concentrations may be nonlinear, and saturation effects may occur beyond specific thresholds. This disconnect restricts the direct applicability of the simulation results to real-world scenarios as the optimal concentration range for maximum clearing efficiency remains unclear. Additionally, due to limitations in experimental data acquisition speed, only sparse measurements were available, impeding thorough validation of the simulated predictions. For clinical applications of OCAs, it is necessary to achieve effective optical transparency within a short period of time. This requires OCAs with high diffusion coefficients, which may, however, lead to potential biological toxicity. Therefore, identifying biocompatible OCAs with high permeability is a key challenge for clinical translation in this field. These issues represent important directions for our future research.

Author Contributions

Conceptualization, L.F. and C.H.; software, L.F.; validation, C.H. and D.Z.; resources, Z.S., J.Z. and G.C.; writing—original draft preparation, L.F. and C.H.; writing—review and editing, Z.S., J.Z. and G.C.; project administration, D.Z. All authors have read and agreed to the published version of the manuscript.

Funding

This research received no external funding.

Institutional Review Board Statement

Ethical review and approval were waived for this study because the experiments were non-invasive and conducted on the surface of the skin using only biocompatible substances—glycerol and glucose—which are commonly used in cosmetic and medical products. The procedures involved no penetration of or alteration in body tissues and posed no risk or harm to human participants.

Informed Consent Statement

Informed consent was obtained from all subjects involved in the study.

Data Availability Statement

The data presented in this study are available upon request from the corresponding author.

Acknowledgments

This work is supported by the Zhejiang Province Key Laboratory of Optoelectronic Intelligent Imaging and Aerospace Sensing.

Conflicts of Interest

Author DongBiao Zhang was employed by Hangzhou Photographic Machinery Research Institute Co., Ltd. The remaining authors declare that the research was conducted in the absence of any commercial or financial relationships that could be construed as a potential conflict of interest.

References

  1. Saeedi, P.; Petersohn, I.; Salpea, P.; Salpea, P.; Malanda, B.; Karuranga, S.; Unwin, N.; Colagiuri, S.; Guariguata, L.; Motala, A.; et al. Global and regional diabetes prevalence estimates for 2019 and projections for 2030 and 2045: Results from the International Diabetes Federation Diabetes Atlas. Diabetes Res. Clin. Pract. 2019, 157, 107843. [Google Scholar] [CrossRef]
  2. Villena Gonzales, W.; Mobashsher, A.T.; Abbosh, A. The progress of glucose monitoring—A review of invasive to minimally and non-invasive techniques, devices and sensors. Sensors 2019, 19, 800. [Google Scholar] [CrossRef]
  3. Tomlins, P.H.; Wang, R.K. Theory, developments and applications of optical coherence tomography. J. Phys. D Appl. Phys. 2005, 38, 2519. [Google Scholar] [CrossRef]
  4. Althobaiti, M.; Al-Naib, I. Optimization of dual-channel near-infrared non-invasive glucose level measurement sensors based on Monte-Carlo simulations. IEEE Photonics J. 2021, 13, 1–9. [Google Scholar] [CrossRef]
  5. Joshi, A.M.; Jain, P.; Mohanty, S.P.; Agrawal, N. iGLU 2.0: A new wearable for accurate non-invasive continuous serum glucose measurement in IoMT framework. IEEE Trans. Consum. Electron. 2020, 66, 327–335. [Google Scholar] [CrossRef]
  6. Alsunaidi, B.; Althobaiti, M.; Tamal, M.; Albaker, W.; Al-Naib, I. A review of non-invasive optical systems for continuous blood glucose monitoring. Sensors 2021, 21, 6820. [Google Scholar] [CrossRef] [PubMed]
  7. Yoon, S.; Kim, M.; Jang, M.; Choi, Y.; Choi, W.; Kang, S.; Choi, W. Deep optical imaging within complex scattering media. Nat. Rev. Phys. 2020, 2, 141–158. [Google Scholar] [CrossRef]
  8. Xu, Y.; Li, C.; An, J.; Ma, X.; Yang, J.; Luo, l.; Deng, Y.; Kim, J.S.; Sun, Y. Construction of a 980 nm laser-activated Pt (II) metallacycle nanosystem for efficient and safe photo-induced bacteria sterilization. Sci. China Chem. 2023, 66, 155–163. [Google Scholar] [CrossRef]
  9. Xu, Y.; Li, C.; Lu, S.; Wang, Z.; Liu, S.; Yu, X.; Li, X.; Sun, Y. Construction of emissive ruthenium (II) metallacycle over 1000 nm wavelength for in vivo biomedical applications. Nat. Commun. 2022, 13, 2009. [Google Scholar] [CrossRef]
  10. Xu, Y.; Li, C.; Ma, X.; Tuo, W.; Tu, L.; Li, X.; Sun, Y.; Stang, P.J.; Sun, Y. Long wavelength–emissive Ru (II) metallacycle–based photosensitizer assisting in vivo bacterial diagnosis and antibacterial treatment. Proc. Natl. Acad. Sci. USA 2022, 119, e2209904119. [Google Scholar] [CrossRef]
  11. Tuchin, V.V. Controlling of tissue optical properties. In Tissue Optics; SPIE: Bellingham, WA, USA, 2015; p. 329. [Google Scholar]
  12. Costantini, I.; Cicchi, R.; Silvestri, L.; Vanzi, F.; Pavone, F.S. In-vivo and ex-vivo optical clearing methods for biological tissues. Biomed. Opt. Express 2019, 10, 5251–5267. [Google Scholar] [CrossRef]
  13. Matryba, P.; Kaczmarek, L.; Gołąb, J. Advances in ex situ tissue optical clearing. Laser Photonics Rev. 2019, 13, 1800292. [Google Scholar] [CrossRef]
  14. Vellekoop, I.M.; Mosk, A.P. Focusing coherent light through opaque strongly scattering media. Opt. Lett. 2002, 32, 2309–2311. [Google Scholar] [CrossRef]
  15. Delbeck, S.; Vahlsing, T.; Leonhardt, S.; Steiner, G.; Heise, H.M. Non-invasive monitoring of blood glucose using optical methods for skin spectroscopy—Opportunities and recent advances. Anal. Bioanal. Chem. 2019, 411, 63–77. [Google Scholar] [CrossRef]
  16. Kong, L.; Zhao, Y.; Dong, L.; Jian, Y.; Jin, X.; Li, B.; Feng, Y.; Liu, M.; Liu, X.; Wu, H. Non-contact detection of oxygen saturation based on visible light imaging device using ambient light. Opt. Express 2013, 21, 17464–17471. [Google Scholar] [CrossRef] [PubMed]
  17. Li, Z.; Feng, J.C.; Jia, K.B. Diffusion correlation spectroscopy for tissue blood flow detection and its clinical application. Laser Optoelectron. Prog. 2022, 59, 0617006-14. (In Chinese) [Google Scholar]
  18. Meglinski, I.V.; Matcher, S.J. Quantitative assessment of skin layers absorption and skin reflectance spectra simulation in the visible and near-infrared spectral regions. Physiol. Meas. 2002, 23, 741. [Google Scholar] [CrossRef]
  19. Ren, N.; Liang, J.; Qu, X.; Li, J.; Lu, B.; Tian, J. GPU-based Monte Carlo simulation for light propagation in complex heterogeneous tissues. Opt. Express 2010, 18, 6811–6823. [Google Scholar] [CrossRef] [PubMed]
  20. Maeda, T.; Arakawa, N.; Takahashi, M.; et Aizu, Y. Monte Carlo simulation of spectral reflectance using a multilayered skin tissue model. Opt. Rev. 2010, 17, 223–229. [Google Scholar] [CrossRef]
  21. Egawa, M.; Hirao, T.; Takahashi, M. In vivo estimation of stratum corneum thickness from water concentration profiles obtained with Raman spectroscopy. Acta Derm.-Venereol. 2007, 87, 4–8. [Google Scholar] [CrossRef]
  22. Sheet, A.H.; Hamdy, O.; Abdel-Salam, Z.; Abdel-Harith, M. Combining laser-irradiation and glycerol immersion of skeletal muscles to improve their optical transparency. Opt. Laser Technol. 2022, 148, 107760. [Google Scholar] [CrossRef]
  23. Zhao, H.; Xu, J.; Wan, J.; Huang, W.; Zhao, Y.; Yang, X. A versatile strategy for improving phototherapeutic efficacy on deep-sited tumor by tissue optical clearing technique. Nano Today 2021, 36, 101058. [Google Scholar] [CrossRef]
  24. Tuchina, D.K.; Genin, V.D.; Bashkatov, A.N.; Genina, E.A.; Tuchin, V.V. Optical clearing of skin tissue ex vivo with polyethylene glycol. Opt. Spectrosc. 2016, 120, 28–37. [Google Scholar] [CrossRef]
  25. Jaafar, A.; Mahmood, M.H.; Holomb, R.; Himics, L.; Váczi, T.; Sdobnov, A.Y.; Tuchin, V.V.; Veres, M. Ex-vivo confocal Raman microspectroscopy of porcine skin with 633/785-NM laser excitation and optical clearing with glycerol/water/DMSO solution. J. Innov. Opt. Health Sci. 2021, 14, 2142003. [Google Scholar] [CrossRef]
  26. Genina, E.A.; Bashkatov, A.N.; Kozintseva, M.D.; Tuchin, V.V. OCT study of optical clearing of muscle tissue in vitro with 40% glucose solution. Opt. Spectrosc. 2016, 120, 20–27. [Google Scholar] [CrossRef]
  27. Liopo, A.; Su, R.; Tsyboulski, D.A.; Oraevsky, A.A. Optical clearing of skin enhanced with hyaluronic acid for increased contrast of optoacoustic imaging. J. Biomed. Opt. 2016, 21, 081208. [Google Scholar] [CrossRef] [PubMed]
  28. Liu, X.; Chen, B. In vivo experimental study on the enhancement of optical clearing effect by laser irradiation in conjunction with a chemical penetration enhancer. Appl. Sci. 2019, 9, 542. [Google Scholar] [CrossRef]
  29. Wen, X. Research on the Physical and Physiologyical Mechanisms of Skin Transparency; Huazhong University of Science and Technology: Wuhan, China, 2012. (In Chinese) [Google Scholar]
  30. Ueda, H.R.; Ertürk, A.; Chung, K.; Gradinaru, V.; Chédotal, A.; Tomancak, P.; Keller, P.J. Tissue clearing and its applications in neuroscience. Nat. Rev. Neurosci. 2020, 21, 61–79. [Google Scholar] [CrossRef]
  31. Mourant, J.R.; Freyer, J.P.; Hielscher, A.H.; Eick, A.A.; Shen, D.; Johnson, T.M. Mechanisms of light scattering from biological cells relevant to noninvasive optical-tissue diagnostics. Appl. Opt. 1998, 37, 3586–3593. [Google Scholar] [CrossRef] [PubMed]
  32. Bhandari, A.; Hamre, B.; Frette, Ø.; Stamnes, K.; Stamnes, J.J. Modeling optical properties of human skin using Mie theory for particles with different size distributions and refractive indices. Opt. Express 2011, 19, 14549–14567. [Google Scholar] [CrossRef]
  33. Tuchin, V.V. Tissue and blood optical immersion by exogenous chemical agents. Opt. Clear. Tissues Blood 2006, 2, 1–19. [Google Scholar]
  34. Sokolov, K.; Drezek, R.; Gossage, K.; Richards-Kortum, R. Reflectance spectroscopy with polarized light: Is it sensitive to cellular and nuclear morphology. Opt. Express 1999, 5, 302–317. [Google Scholar] [CrossRef] [PubMed]
  35. Tuchin, V.V.; Maksimova, I.L.; Zimnyakov, D.A.; Kon, I.L.; Mavlutov, A.H.; Mishin, A.A. Light propagation in tissues with controlled optical properties. J. Biomed. Opt. 1997, 2, 401–417. [Google Scholar] [CrossRef]
  36. Graaff, R.; Aarnoudse, J.G.; Zijp, J.R.; Sloot, P.M.A.; De Mul, F.F.M.; Greve, J.; Koelink, M.H. Reduced light-scattering properties for mixtures of spherical particles: A simple approximation derived from Mie calculations. Appl. Opt. 1992, 31, 1370–1376. [Google Scholar] [CrossRef]
  37. Flock, S.T.; Jacques, S.L.; Wilson, B.C.; Star, W.M.; van Gemert, M.J.C. Optical properties of Intralipid: A phantom medium for light propagation studies. Lasers Surg. Med. 1992, 12, 510–519. [Google Scholar] [CrossRef]
  38. Martelli, F.; Zaccanti, G. Calibration of scattering and absorption properties of a liquid diffusive medium at NIR wavelengths. CW method. Opt. Express 2007, 15, 486–500. [Google Scholar] [CrossRef]
  39. Jeon, K.J.; Hwang, I.D.; Hahn, S.; eYoon, G. Comparison between transmittance and reflectance measurements in glucose determination using near infrared spectroscopy. J. Biomed. Opt. 2006, 11, 014022-7. [Google Scholar] [CrossRef] [PubMed]
  40. Shariati BK, B.; Ansari, M.A.; Khatami, S.S.; Tuchin, V.V. Multimodal optical clearing to minimize light attenuation in biological tissues. Sci. Rep. 2023, 13, 21509. [Google Scholar] [CrossRef] [PubMed]
  41. Gavrilova, A.A.; Pravdin, A.B.; Tuchin, V.V.; Altshuler, G.B.; Yaroslavsky, I.V. Assessment of diffusion coefficient of glycerol into the skin ex vivo. In Proceedings of the Fifth International Conference on Photonics and Imaging in Biology and Medicine, Wuhan, China, 1–3 September 2006; SPIE: Bellingham, WA, USA, 2007; Volume 6534, pp. 918–926. [Google Scholar] [CrossRef]
  42. Wang, Y.; Fang, W.; Zhang, K.; Men, Z. DMSO synergized with sugars: Optical clearing agent modulation of optical coherence tomography of skin tissues. Appl. Opt. 2024, 63, 2279–2285. [Google Scholar] [CrossRef]
  43. Sandby-Møller, J.; Poulsen, T.; Wulf, H.C. Epidermal thickness at different body sites: Relationship to age, gender, pigmentation, blood content, skin type and smoking habits. Acta Derm.-Venereol. 2003, 83, 410–413. [Google Scholar] [CrossRef]
  44. Zhu, D.; Zhang, J.; Cui, H.; Mao, Z.; Li, P.; Luo, Q. Short-term and long-term effects of optical clearing agents on blood vessels in chick chorioallantoic membrane. J. Biomed. Opt. 2008, 13, 021106-8. [Google Scholar] [CrossRef] [PubMed]
Figure 1. (a) Model of skin. (b) Optical MC simulation results of skin.
Photonics 12 00751 g001
Figure 2. The experimental setup. (a) The enclosure in its open state. (b) The actual experimental setup in use. (c) A schematic diagram of the detection setup.
Photonics 12 00751 g002
Figure 3. MC simulation results after background refractive index change. (a) No change in background refractive index. (b) Background refractive index increased by 1%. (c) Background refractive index increased by 2%.
Photonics 12 00751 g003
Figure 4. Absorption rate, diffuse reflectance, and penetration depth with changes in background refractive index of skin layers.
Photonics 12 00751 g004
Figure 5. Intuitive diagram of 5% fat emulsion solution of 1:1 mixture of OCAs: (a) 75% glycerol, (b) 50% glycerol, (c) 25% glycerol, (d) 30% glucose, (e) 20% glucose, (f) 0.6 M tartrazine, and (g) water. (h) Original image.
Photonics 12 00751 g005
Figure 6. Transmittance with different OCAs.
Photonics 12 00751 g006
Figure 7. Effect of OCA penetration depth and background refractive index change on absorption rate of blood-containing layer. (a) Steady state; (b) transient (penetration depth = 2 mm).
Photonics 12 00751 g007
Figure 8. Absorption distributions under different stratum corneum thicknesses: (a) 20 μm, (b) 50 μm, (c) 100 μm, (d) 200 μm, (e) 400 μm, (f) 600 μm.
Photonics 12 00751 g008
Figure 9. Reflectance distributions under different stratum corneum thicknesses: (a) 20 μm, (b) 50 μm, (c) 100 μm, (d) 200 μm, (e) 400 μm, (f) 600 μm.
Photonics 12 00751 g009
Figure 10. Diffuse reflectance of palm and forearm during OCA penetration over time.
Photonics 12 00751 g010
Table 1. Optical parameters and blood content of skin layers [18,20].
NO.LayerBlood Contentμa (mm−1)μs (mm−1)gnt (mm)
1Stratum corneum00.005861000.861.50.02
2Living epidermis00.00482450.801.340.08–0.1
3Papillary dermis0.040.03341300.901.400.15–0.2
4Upper blood net dermis0.30.24130350.951.390.08–0.1
5Reticular dermis0.040.03341250.801.401.4–1.6
6Deep blood net dermis0.10.08078300.951.380.08–0.12
7Subcutaneous tissue0.050.0412750.751.446.0–6.5
Table 2. Diffuse reflectance and absorption rates of skin layers.
SkinDiffuseStratum CorneumLiving EpidermisPapillary DermisUpper Blood Net DermisReticular DermisDeep Blood Net DermisSubcutaneous Tissue
Forearm62.31%0.32%0.90%6.87%16.96%8.34%0.03%0.34%
Palm87.55%2.19%0.01%1.11%3.58%1.51%0.01%0.01%
Disclaimer/Publisher’s Note: The statements, opinions and data contained in all publications are solely those of the individual author(s) and contributor(s) and not of MDPI and/or the editor(s). MDPI and/or the editor(s) disclaim responsibility for any injury to people or property resulting from any ideas, methods, instructions or products referred to in the content.

