Article

Dual-Component Beat-Frequency Quartz-Enhanced Photoacoustic Spectroscopy Gas Detection System

1
School of Information Science and Engineering, Shandong University, Qingdao 266237, China
2
Key Laboratory of Education Ministry for Laser and Infrared System Integration Technology, Shandong University, Qingdao 266237, China
3
Institute of Novel Semiconductors, State Key Laboratory of Crystal Materials, Shandong University, Jinan 250100, China
4
School of Mathematics, Shandong University, Qingdao 266237, China
*
Authors to whom correspondence should be addressed.
Photonics 2025, 12(8), 747; https://doi.org/10.3390/photonics12080747
Submission received: 1 July 2025 / Revised: 22 July 2025 / Accepted: 23 July 2025 / Published: 24 July 2025
(This article belongs to the Special Issue Advances in Optical Fiber Sensing Technology)

Abstract

This study designed and validated a dual-component beat-frequency quartz-enhanced photoacoustic spectroscopy (BF-QEPAS) gas detection system utilizing time-division multiplexing (TDM). By applying TDM to drive distributed feedback lasers, the system achieved the simultaneous detection of acetylene and methane. Its key innovation lies in exploiting the transient response of the quartz tuning fork (QTF) to acquire gas concentrations while concurrently capturing the QTF resonant frequency and quality factor in real-time. Owing to the short beat period and rapid system response, this approach significantly reduces time-delay constraints in time-division measurements, eliminating the need for periodic calibration inherent in conventional methods and preventing detection interruptions. The experimental results demonstrate minimum detection limits of 5.69 ppm for methane and 0.60 ppm for acetylene. Both gases exhibited excellent linear responses over the concentration range of 200 ppm to 4000 ppm, with the R2 value for methane being 0.996 and for acetylene being 0.997. The system presents a viable solution for the real-time, calibration-free monitoring of dissolved gases in transformer oil.

1. Introduction

Gas detection, as a continuously evolving technology, has found extensive applications across diverse fields, including petrochemicals, biomedicine, food safety, and environmental monitoring [1,2,3,4,5]. Among various optical sensing-based detection techniques, photoacoustic spectroscopy (PAS) stands out due to its high sensitivity, rapid response, and wide dynamic range [6]. Building upon PAS, quartz-enhanced photoacoustic spectroscopy (QEPAS) has been developed as an alternative method for trace gas photoacoustic detection, with its core concept being the accumulation of acoustic energy within a resonant quartz tuning fork (QTF) transducer. This approach avoids the need for traditional gas-filled photoacoustic cells, thereby eliminating constraints on chamber design imposed by acoustic resonance conditions [7].
Despite the widespread use of QEPAS-based gas sensors, a significant challenge persists. Due to the susceptibility of the QTF’s characteristics to change during actual measurements, periodic calibration of the QTF’s resonant frequency and quality factor is required during gas detection to avoid accuracy degradation caused by resonant frequency and quality factor fluctuations [8,9,10,11,12]. This necessity interrupts continuous, long-term gas monitoring. In 2017, a novel technique termed beat-frequency quartz-enhanced photoacoustic spectroscopy (BF-QEPAS) was introduced for rapid, calibration-free continuous trace gas monitoring. Unlike conventional QEPAS, BF-QEPAS exploits the transient response of the QTF. This generates an electrical signal characterized by an exponentially decaying envelope, enabling the simultaneous determination of both the QTF parameters and the gas concentration [13,14]. This technique has seen widespread application in recent years. In 2022, Li. et al. proposed a calibration-free mid-infrared exhaled breath sensor based on BF-QEPAS for real-time ammonia measurements at the ppb level [15]. In 2024, Ye. et al. developed an optomechanical energy enhanced BF-QEPAS method for fast and sensitive gas sensing [16]. However, existing BF-QEPAS implementations remain primarily limited to single-gas detection, creating a gap for multi-component monitoring applications where time-continuous data is critical.
Gas detection often requires the analysis of gas mixtures, which demands multi-component gas detection techniques capable of distinguishing the concentrations of individual gases. Commonly employed techniques include gas chromatography [17], mass spectrometry [18], electrochemical sensor methods [19], and laser absorption spectroscopy (LAS) [20]. LAS typically utilizes combinations of multiple lasers and detectors to achieve multi-component detection [21,22]. Multi-component sensors often employ multiplexing methods, such as time-division multiplexing (TDM) and frequency-division multiplexing (FDM). In 2018, Zhang et al. proposed a multi-gas QEPAS sensor based on three QTFs with different response frequencies for trace gas detection [23]. This research well demonstrates the gas detection method based on FDM. In 2021, Yu et al. proposed a PAS-based multi-component gas detection system integrating both FDM and TDM, utilizing a resonant photoacoustic cell and a broadband microphone. This system successfully measured the concentrations of four gas components: methane (CH4), water vapor (H2O), carbon dioxide (CO2), and acetylene (C2H2) [24]. More recently, in 2024, Qin et al. developed a dual-component gas sensor based on QEPAS and LITES (laser-induced thermoelastic spectroscopy) combined with TDM technology to measure the concentrations of C2H2 and CH4 mixtures [25]. These applications demonstrate the feasibility and convenience of TDM technology.
The applications of multi-component gas detection span an extensive range of scenarios. For example, CH4 and C2H2 are key dissolved gases in transformer oil. Analyzing their composition and concentration allows for the identification of potential internal insulation faults within transformers and an assessment of their severity. Consequently, the real-time monitoring of dissolved gases in oil is crucial for ensuring the reliable operation of power grids [26,27]. In this regard, considerable work and research have recently been conducted. In 2023, Ye et al. proposed a dual-channel off-beam quartz-enhanced photoacoustic spectroscopy sensor system combined with time-division multiplexing technology for detecting methane and acetylene, highlighting the significance of these gas detections. In 2025, Li et al. employed a frequency-division multiplexed fiber-optic photoacoustic sensor to detect dissolved methane and acetylene gases, achieving minimum detectable concentrations of approximately 0.1 μL·L−1 (parts per million) for both gases [28,29]. Therefore, CH4 and C2H2 were selected as the target gases for the system, and corresponding experiments were designed to optimize detection performance.
This paper reports a dual-component BF-QEPAS gas detection system based on TDM technology. The system employs TDM in a BF-QEPAS sensor to simultaneously detect CH4 and C2H2 concentrations under distributed feedback (DFB) laser driver current modulation. Leveraging the BF-QEPAS technique, the system achieves rapid gas concentration measurement while concurrently acquiring the parameter of the QTF, thereby eliminating the need for periodic QTF parameter measurement and calibration inherent in conventional photoacoustic spectroscopy methods, preventing interruptions in gas detection. In terms of measurement speed, the BF-QEPAS method significantly reduces measurement time compared to conventional approaches (e.g., standard QEPAS), owing to its short beat period and rapid system response. The implementation of dual-component gas sensing via TDM of the laser drive signal offers greater operational convenience compared to traditional optical switching control, as it requires no additional control equipment. Furthermore, the system architecture is significantly simplified by utilizing only a single lock-in amplifier. Experimentally, the system successfully detected the concentration of CH4 and C2H2. The minimum detection limits achieved were 5.69 ppm for CH4 and 0.60 ppm for C2H2, with both gases exhibiting excellent linear responses within the concentration range of 200 ppm to 4000 ppm (CH4:R2 = 0.996; C2H2:R2 = 0.997), validating the superior performance of the system.

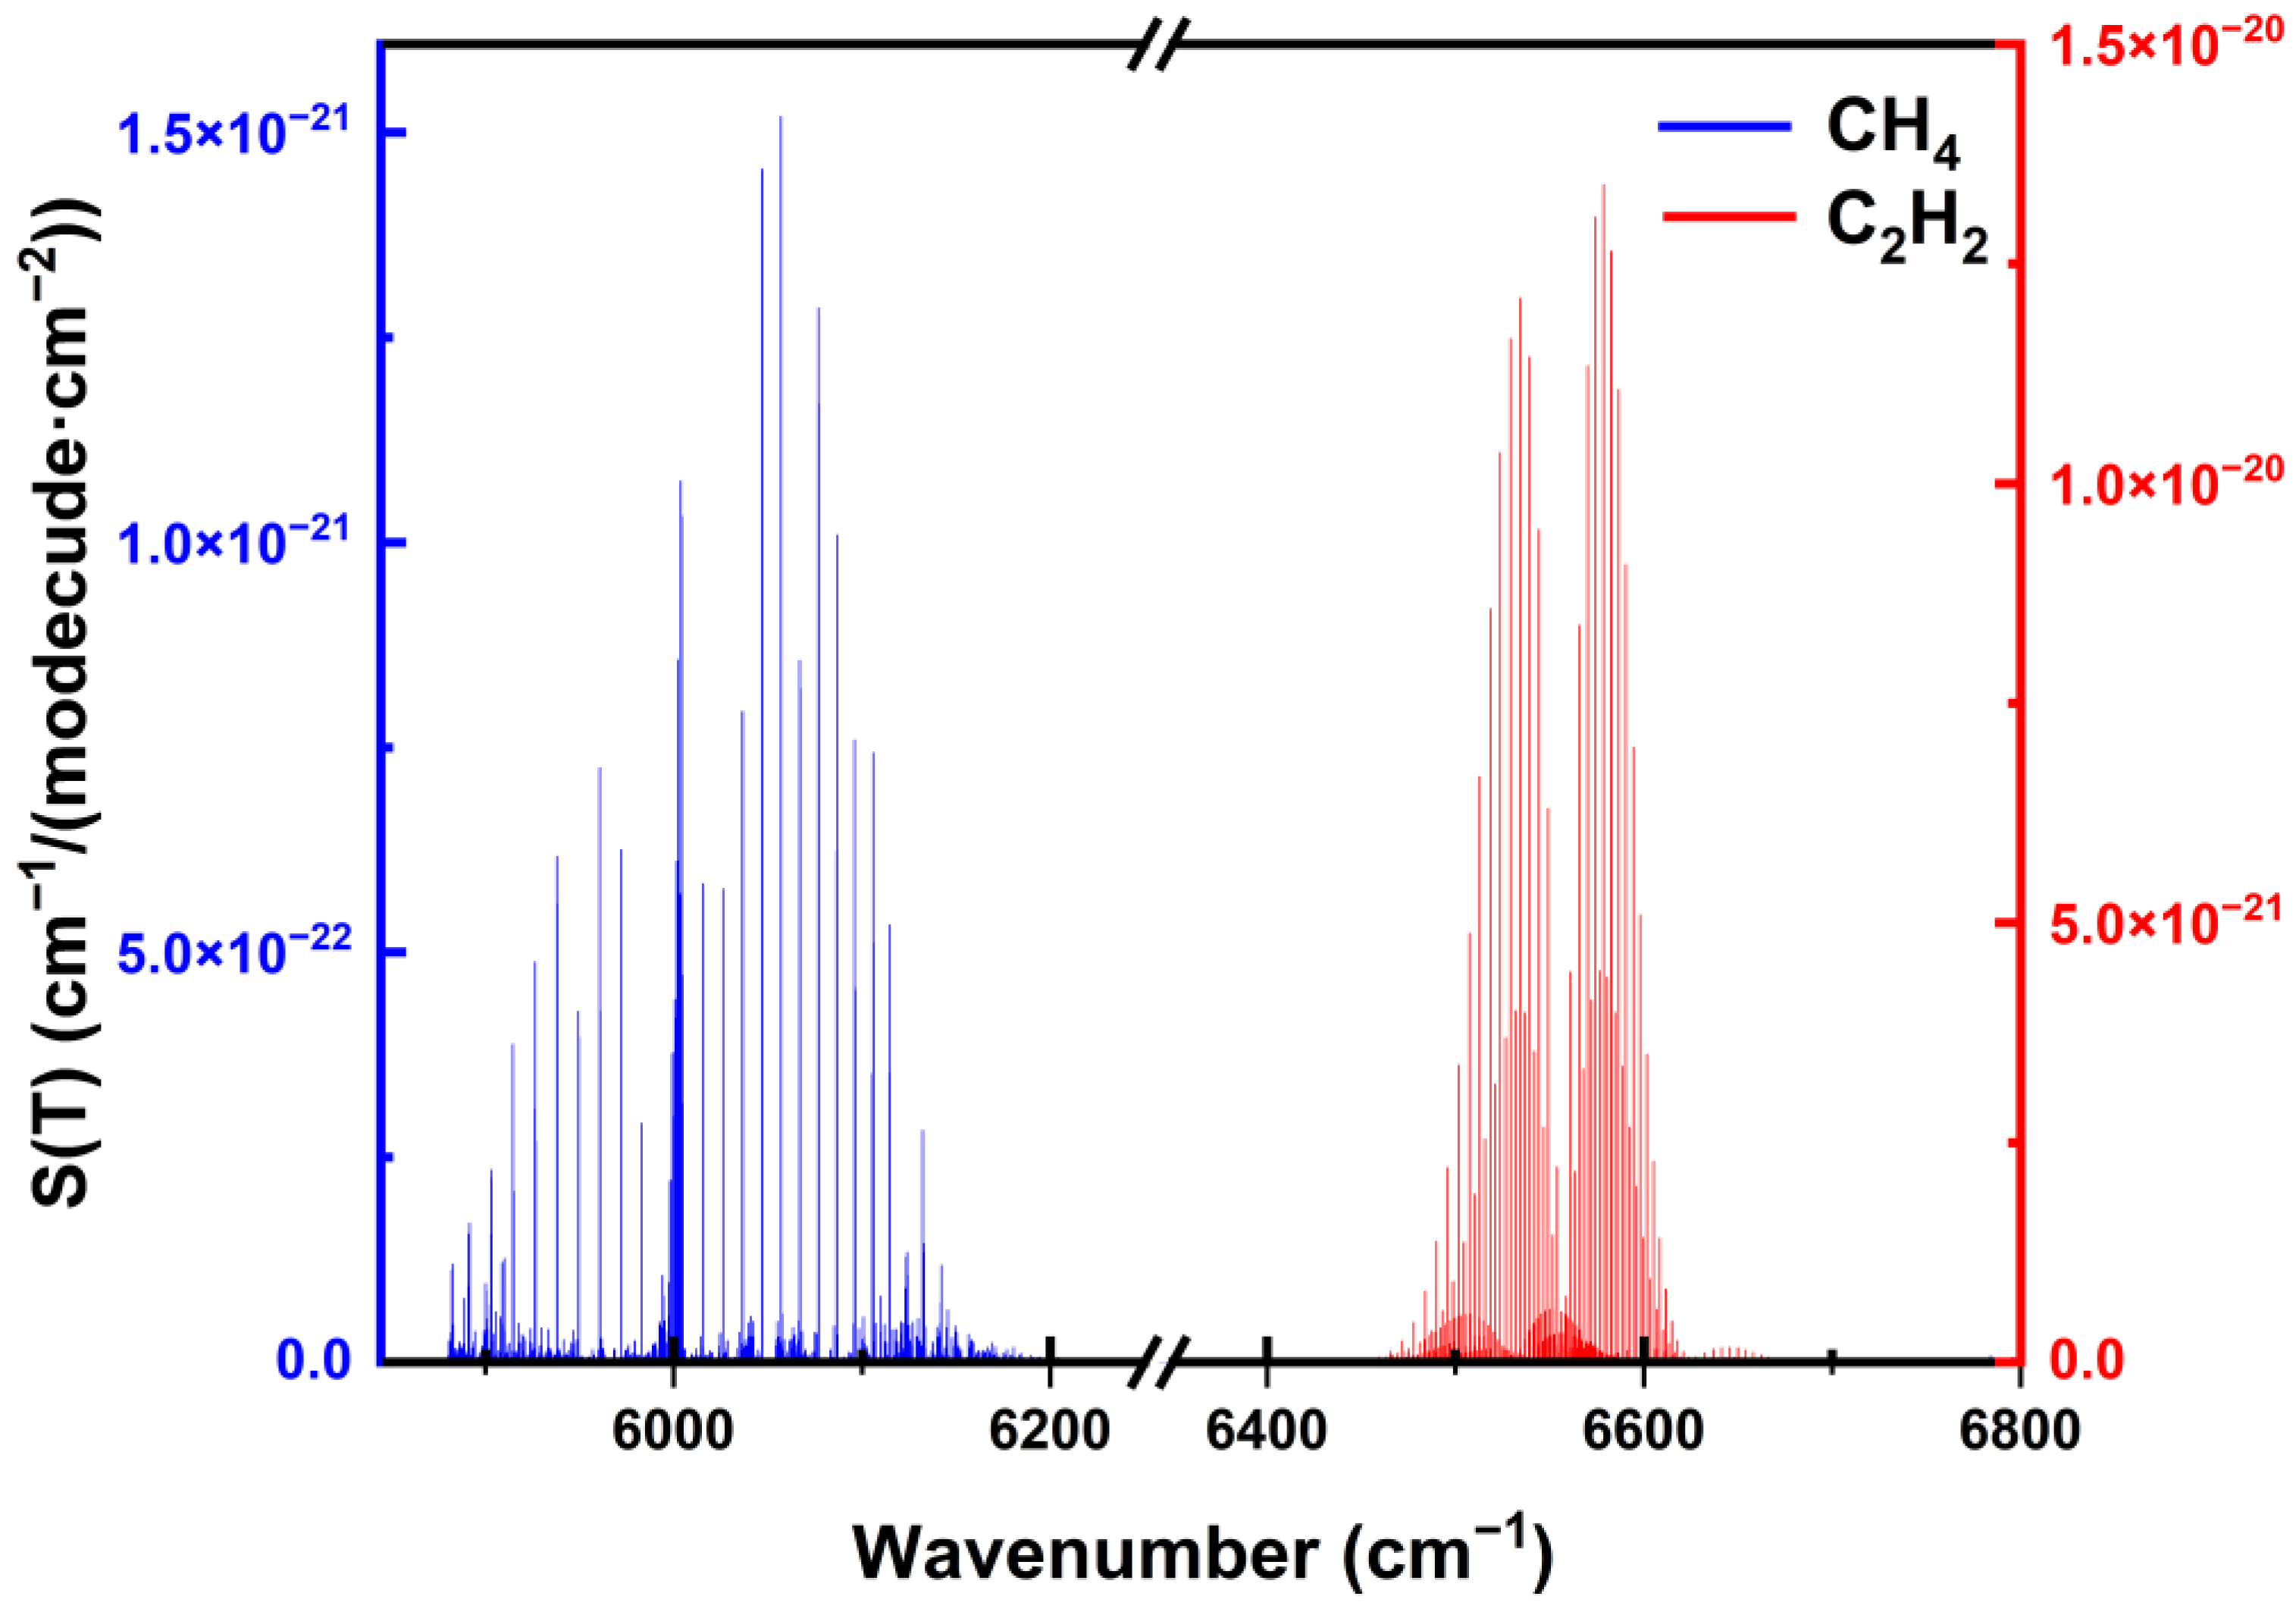
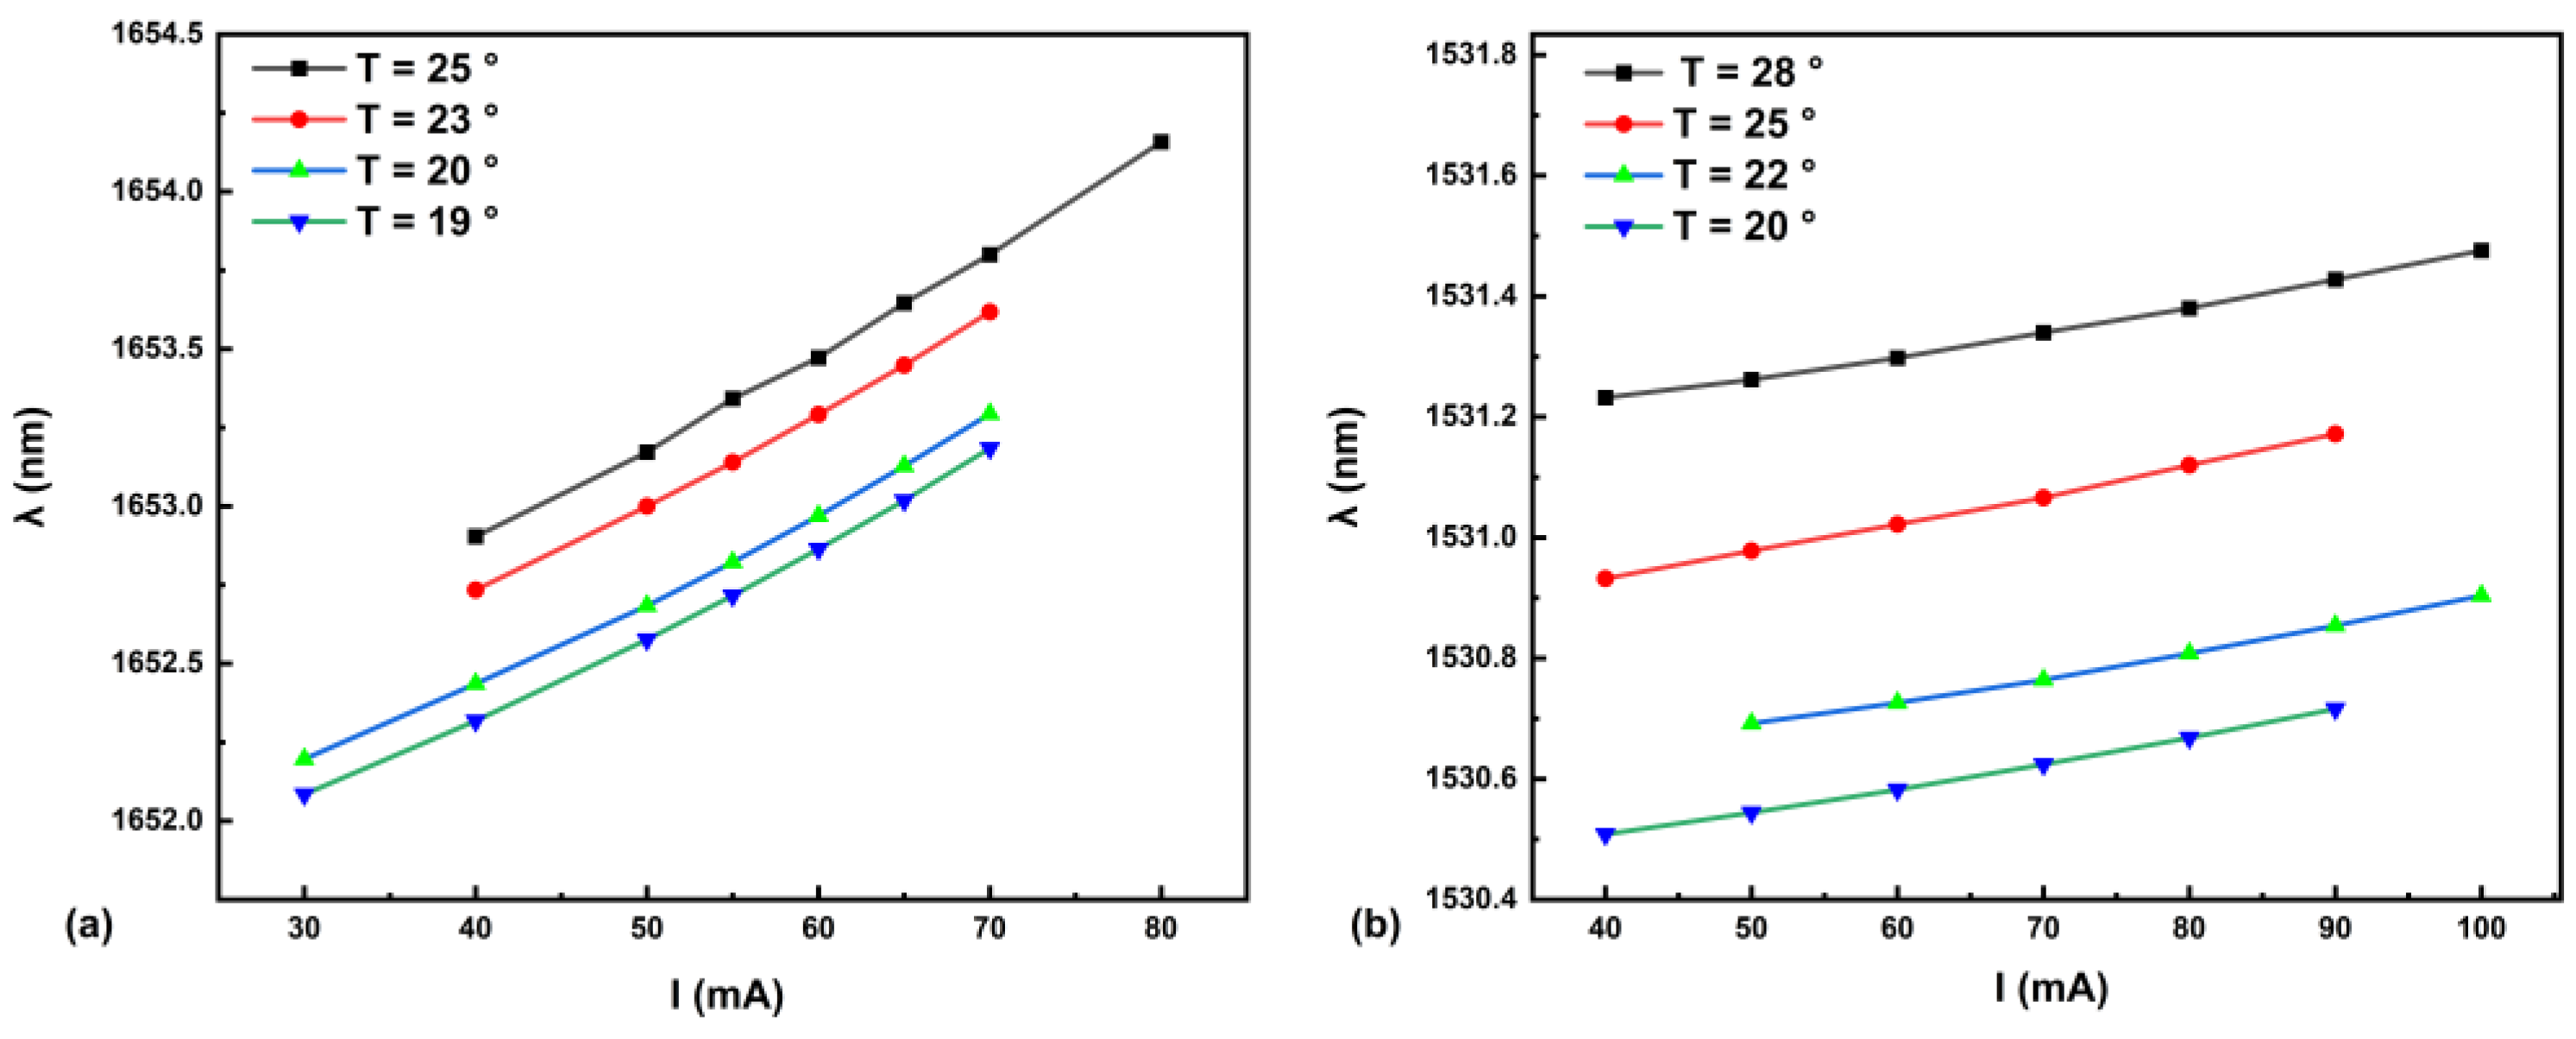
2. Selection of Absorption Lines

For multi-component gas detection, it is essential to select appropriate strong absorption lines to avoid cross-interference between the gases. According to the 2020 HITRAN database, the absorption lines of CH4 and C2H2 gases within the wavenumber range of 5800 cm−1 to 6800 cm−1 were simulated, as shown in Figure 1. Through observation and unit conversion, we identified strong, distinct, and non-overlapping absorption lines for C2H2 at 1531.59 nm and for CH4 at 1653.72 nm. These wavelengths were accordingly selected for the lasers.

3. Principle of BF-QEPAS

In photoacoustic gas detection, the QTF exhibits two dynamic response modes. One is the steady-state response, where the QTF is driven by a continuous external force (such as a continuously modulated laser), producing stable vibrations synchronized with the excitation frequency. The other is the transient response, where the QTF is excited by a short-duration external force (such as a pulsed acoustic wave). After the force is removed, the QTF enters a state of free-decay vibration.
The steady-state detection method of traditional QEPAS drives the laser current by superimposing a low-frequency scanning signal (slowly sweeping across the gas absorption peak) and a high-frequency modulation signal. When the QTF output frequency matches the laser modulation frequency, a lock-in amplifier (LIA) is used to demodulate the signal at twice the modulation frequency (2f). The peak amplitude of the demodulated signal corresponds to the gas concentration.
In contrast, the innovative detection method based on the transient response employs a laser scanning waveform with a steep rising edge. This waveform rapidly sweeps to the gas absorption peak, generating a short acoustic pulse that forces the QTF to vibrate at the laser modulation frequency (the transient response phase). After the wavelength moves away from the absorption peak, the acoustic pulse terminates, and the QTF transitions to free vibration (the free-decay phase), oscillating at its inherent resonant frequency f0.
In the transient response mode of the QTF, driven by the external force, it vibrates at a frequency identical to the modulation frequency. Upon entering the free-decay phase, the QTF vibrates at its own resonant frequency. The frequency of the QTF output signal during the free-decay phase corresponds to the QTF’s resonant frequency, denoted as f0. The frequency of the input signal f1 equals f0. If the frequency of the reference signal is set to f, the beat frequency fbeat of the LIA output signal is the difference between f0 and f, expressed as
f beat = f 0 f = Δ f .
By measuring the time interval Δt between two peaks of the beat-frequency signal, Δf can be determined by taking the reciprocal (Δf = 1/Δt). The QTF’s resonant frequency f0 is then obtained using Equation (3).
Δ f = 1 Δ t
f 0 = f ± 1 Δ t
In addition, the Q value of the QTF can also be calculated using the beat frequency signal, and the calculation formula is as follows:
Q = π f 0 τ
where τ is the response time of the system.

4. Design of Sensor System

The schematic diagram of the experimental setup is shown in Figure 2. The system was designed to operate at standard atmospheric pressure (1 atm) and a constant temperature of 296 K. Two distributed feedback laser diodes DFB-LD-1 (10.63 mW, Wchip) and DFB-LD-2 (10.12 mW, Wuhan 69 Sensing Technology Co., Ltd., Wuhan, China) with 14-pin butterfly packages were employed. Their center wavelengths were 1531.1 nm and 1653.7 nm, respectively. The specific characteristics of the DFB lasers used are detailed in Figure 3. A function generator supplied a composite waveform—comprising a fast sawtooth wave superimposed on a DC signal—to the laser diode controller (Stanford, Santa Clara, CA, USA, LDC501). Simultaneously, it provided the high-frequency sine wave used for modulation and demodulation. The frequency of this sine wave could be adjusted within a range close to the QTF’s resonant frequency. An optical isolator placed after each DFB laser ensured unidirectional laser propagation and prevented optical feedback damage. Standard C2H2 gas and CH4 gas (both balanced in N2), along with high-purity N2, were introduced into a gas dilution system (GDS) (Beijing Jinxun Electronics Co., Beijing, China RCS2000-A) via three separate gas channels. This enabled the preparation of various concentration mixtures of C2H2 and CH4. The resulting gas mixture was then flowed through the acoustic detection module (ADM) (Thorlabs, Newton, NJ, USA, model ADM01), which housed the QTF. The laser beam was directed into the ADM. The beat-frequency current signal generated by the photoacoustic excitation from C2H2 and CH4 absorption was subsequently detected using a lock-in amplifier (Zurich Instruments, Zurich, Switzerland H2FLI-50 MHz). Finally, the beat-frequency signal was acquired and transmitted to a computer for data processing and analysis.

5. Experimental Results and Discussion

As mentioned previously, variations in the parameter of the QTF can impact the accuracy of detection data. Therefore, determining the parameter of the QTF is essential. In the experiment, the resonant frequency of the QTF was determined using the heterodyne demodulation method and the Q-factor was obtained through exponential (e-based) fitting. Subsequently, the amplitude of the system output signal was measured at various modulation frequencies near the resonant frequency to identify the modulation frequency yielding the maximum signal amplitude. Finally, the linearity and minimum detection limit of the system were measured using the previously determined optimal modulation frequency, thereby demonstrating the feasibility of the dual-component BF-QEPAS gas detection system.

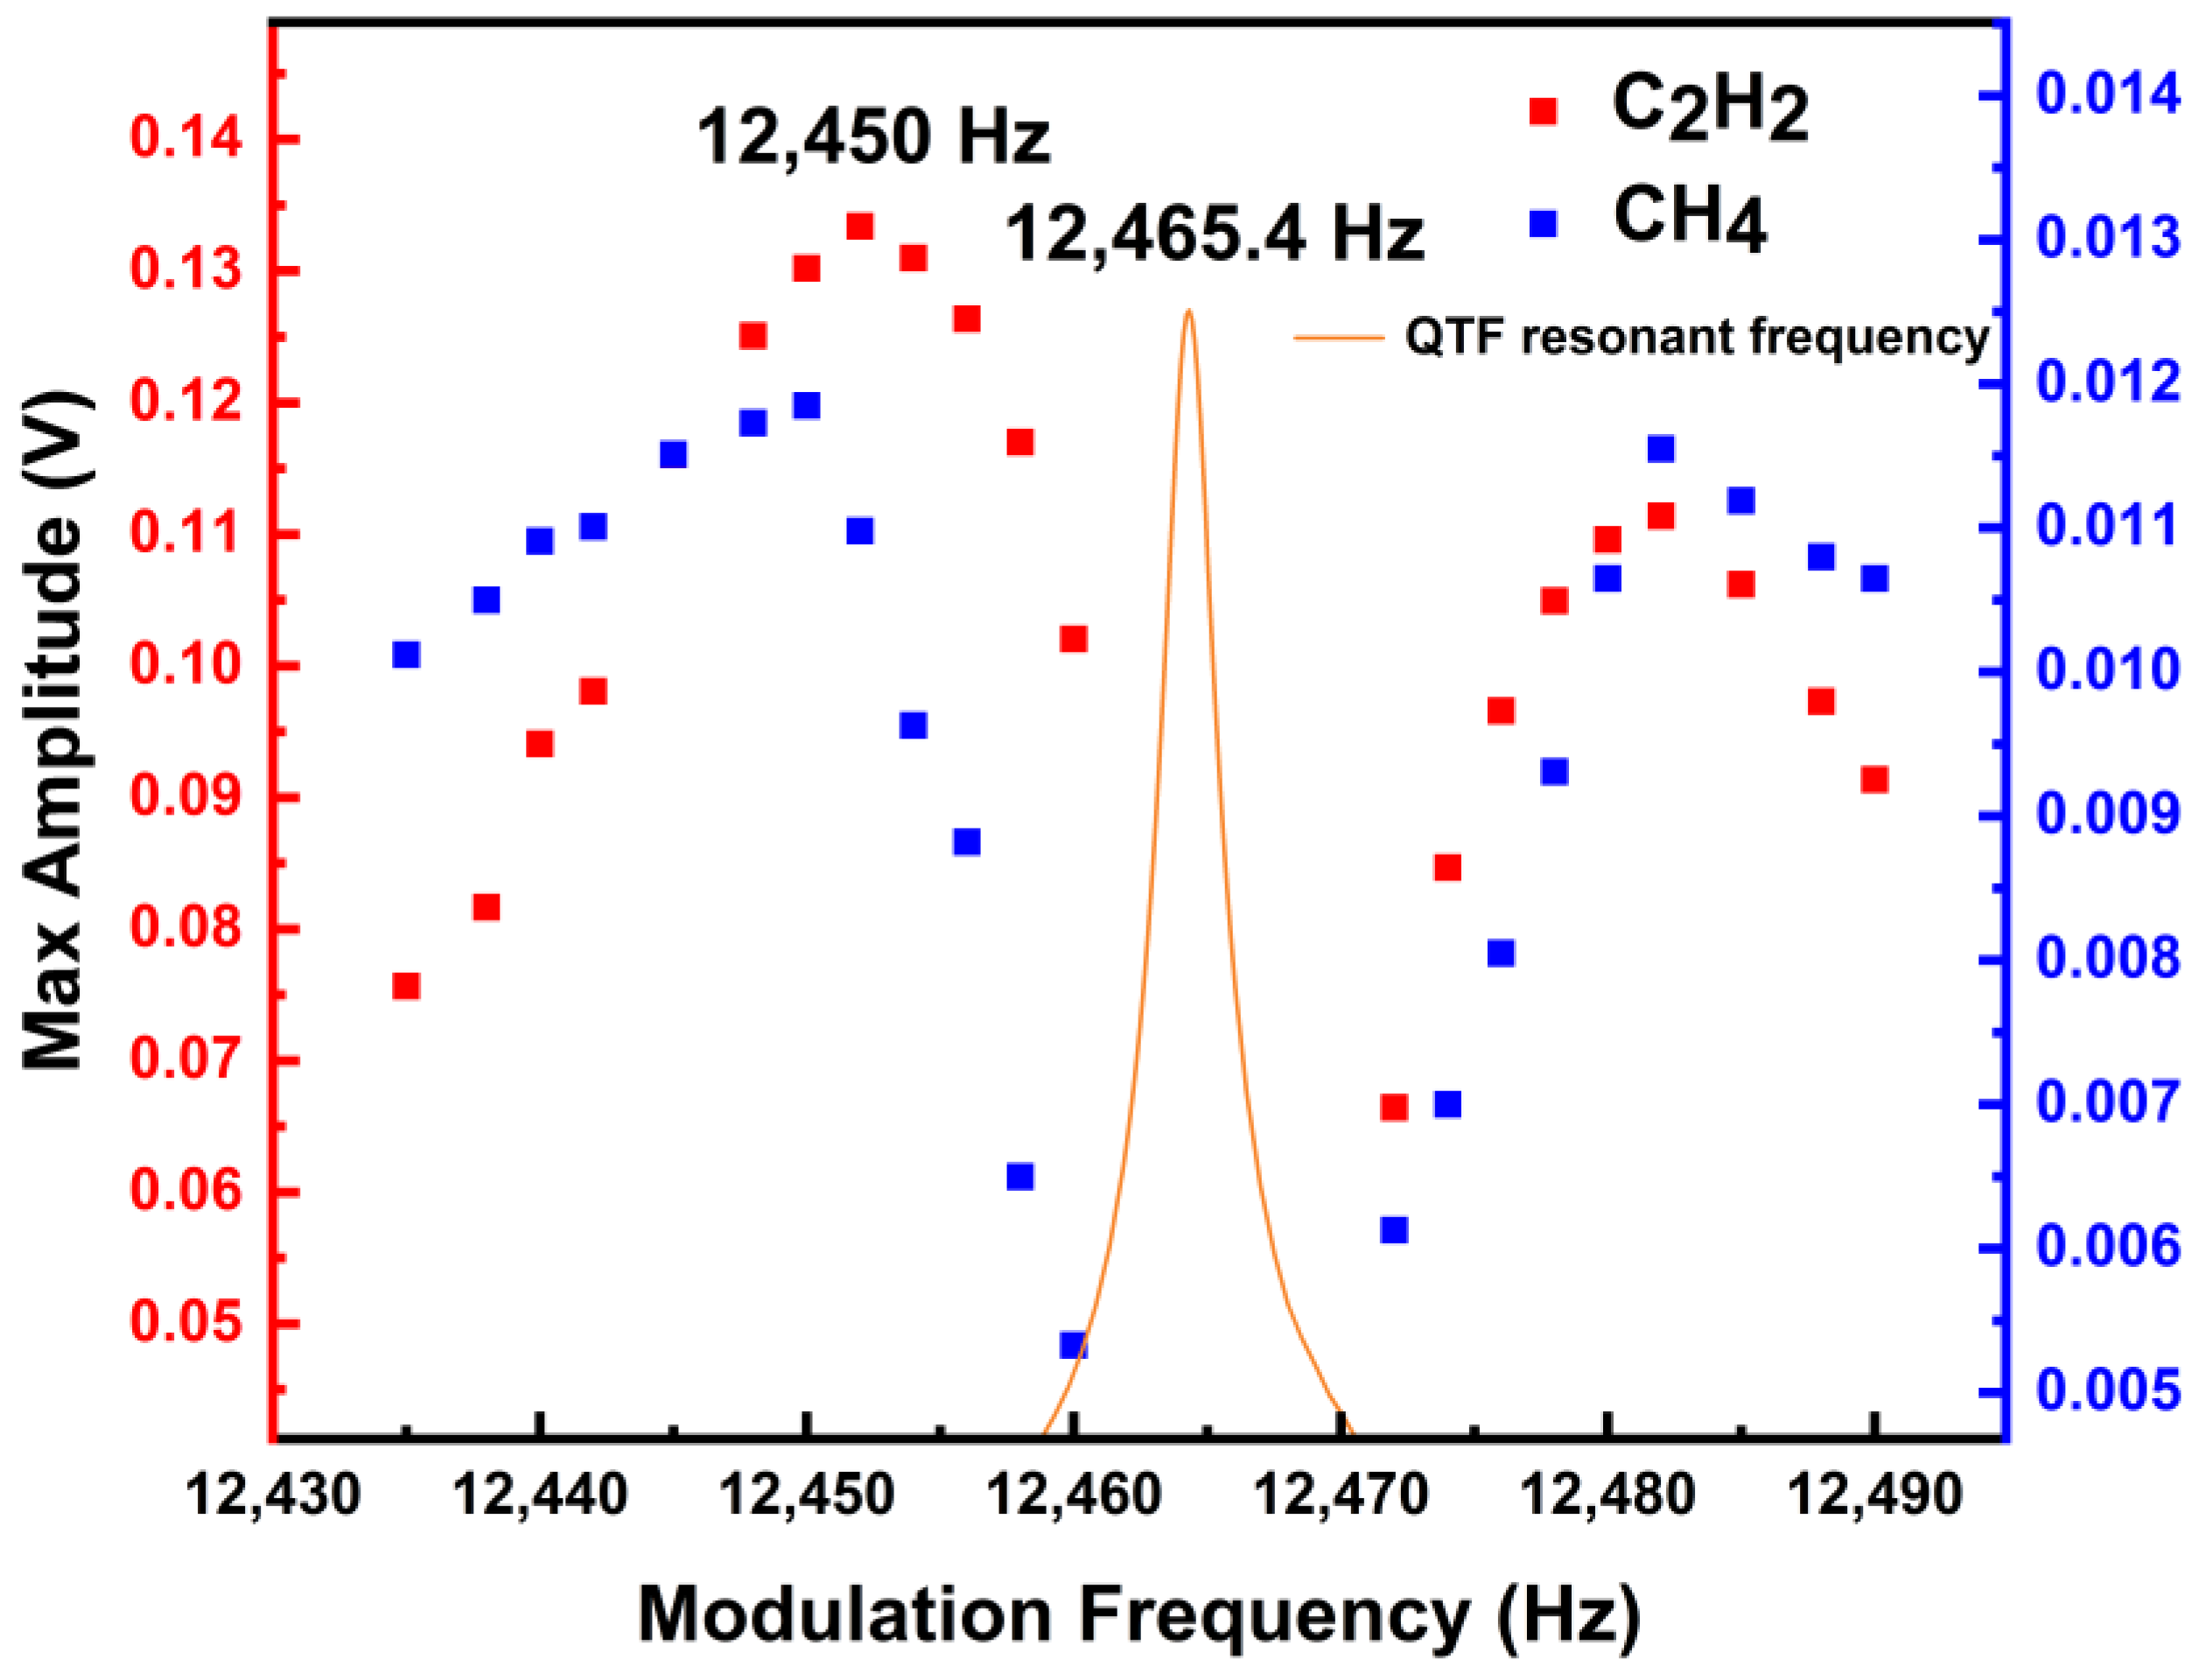
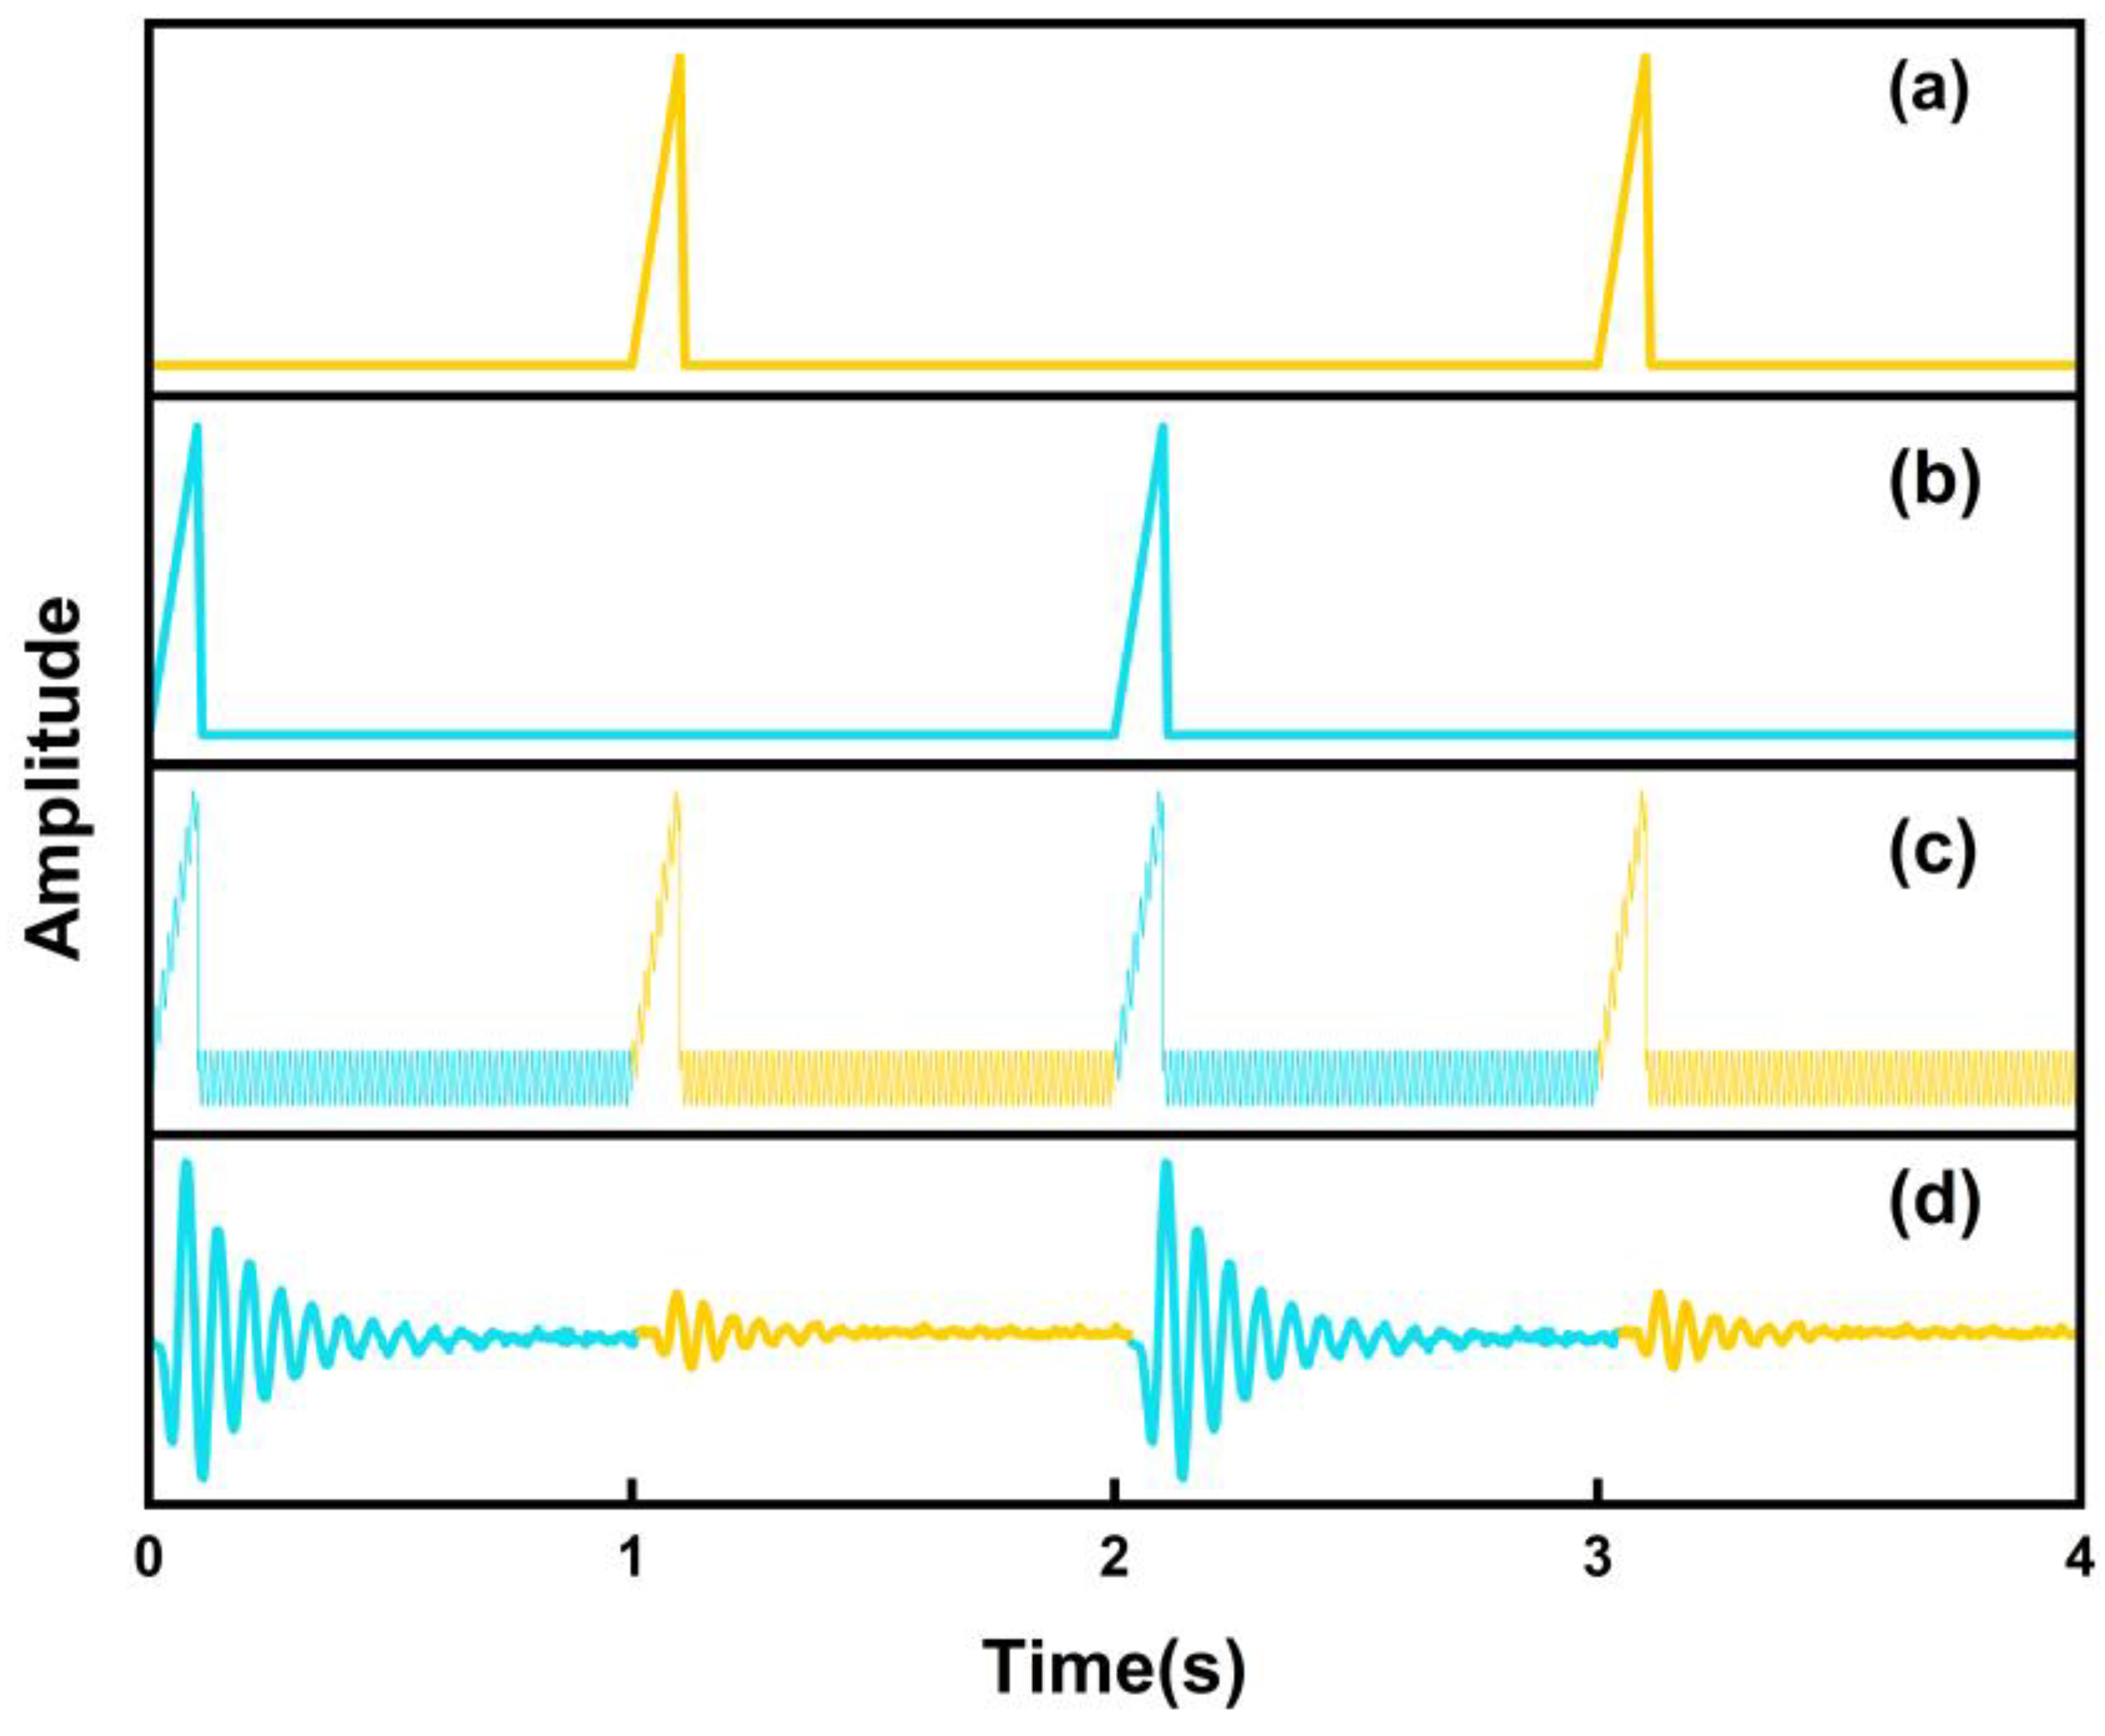
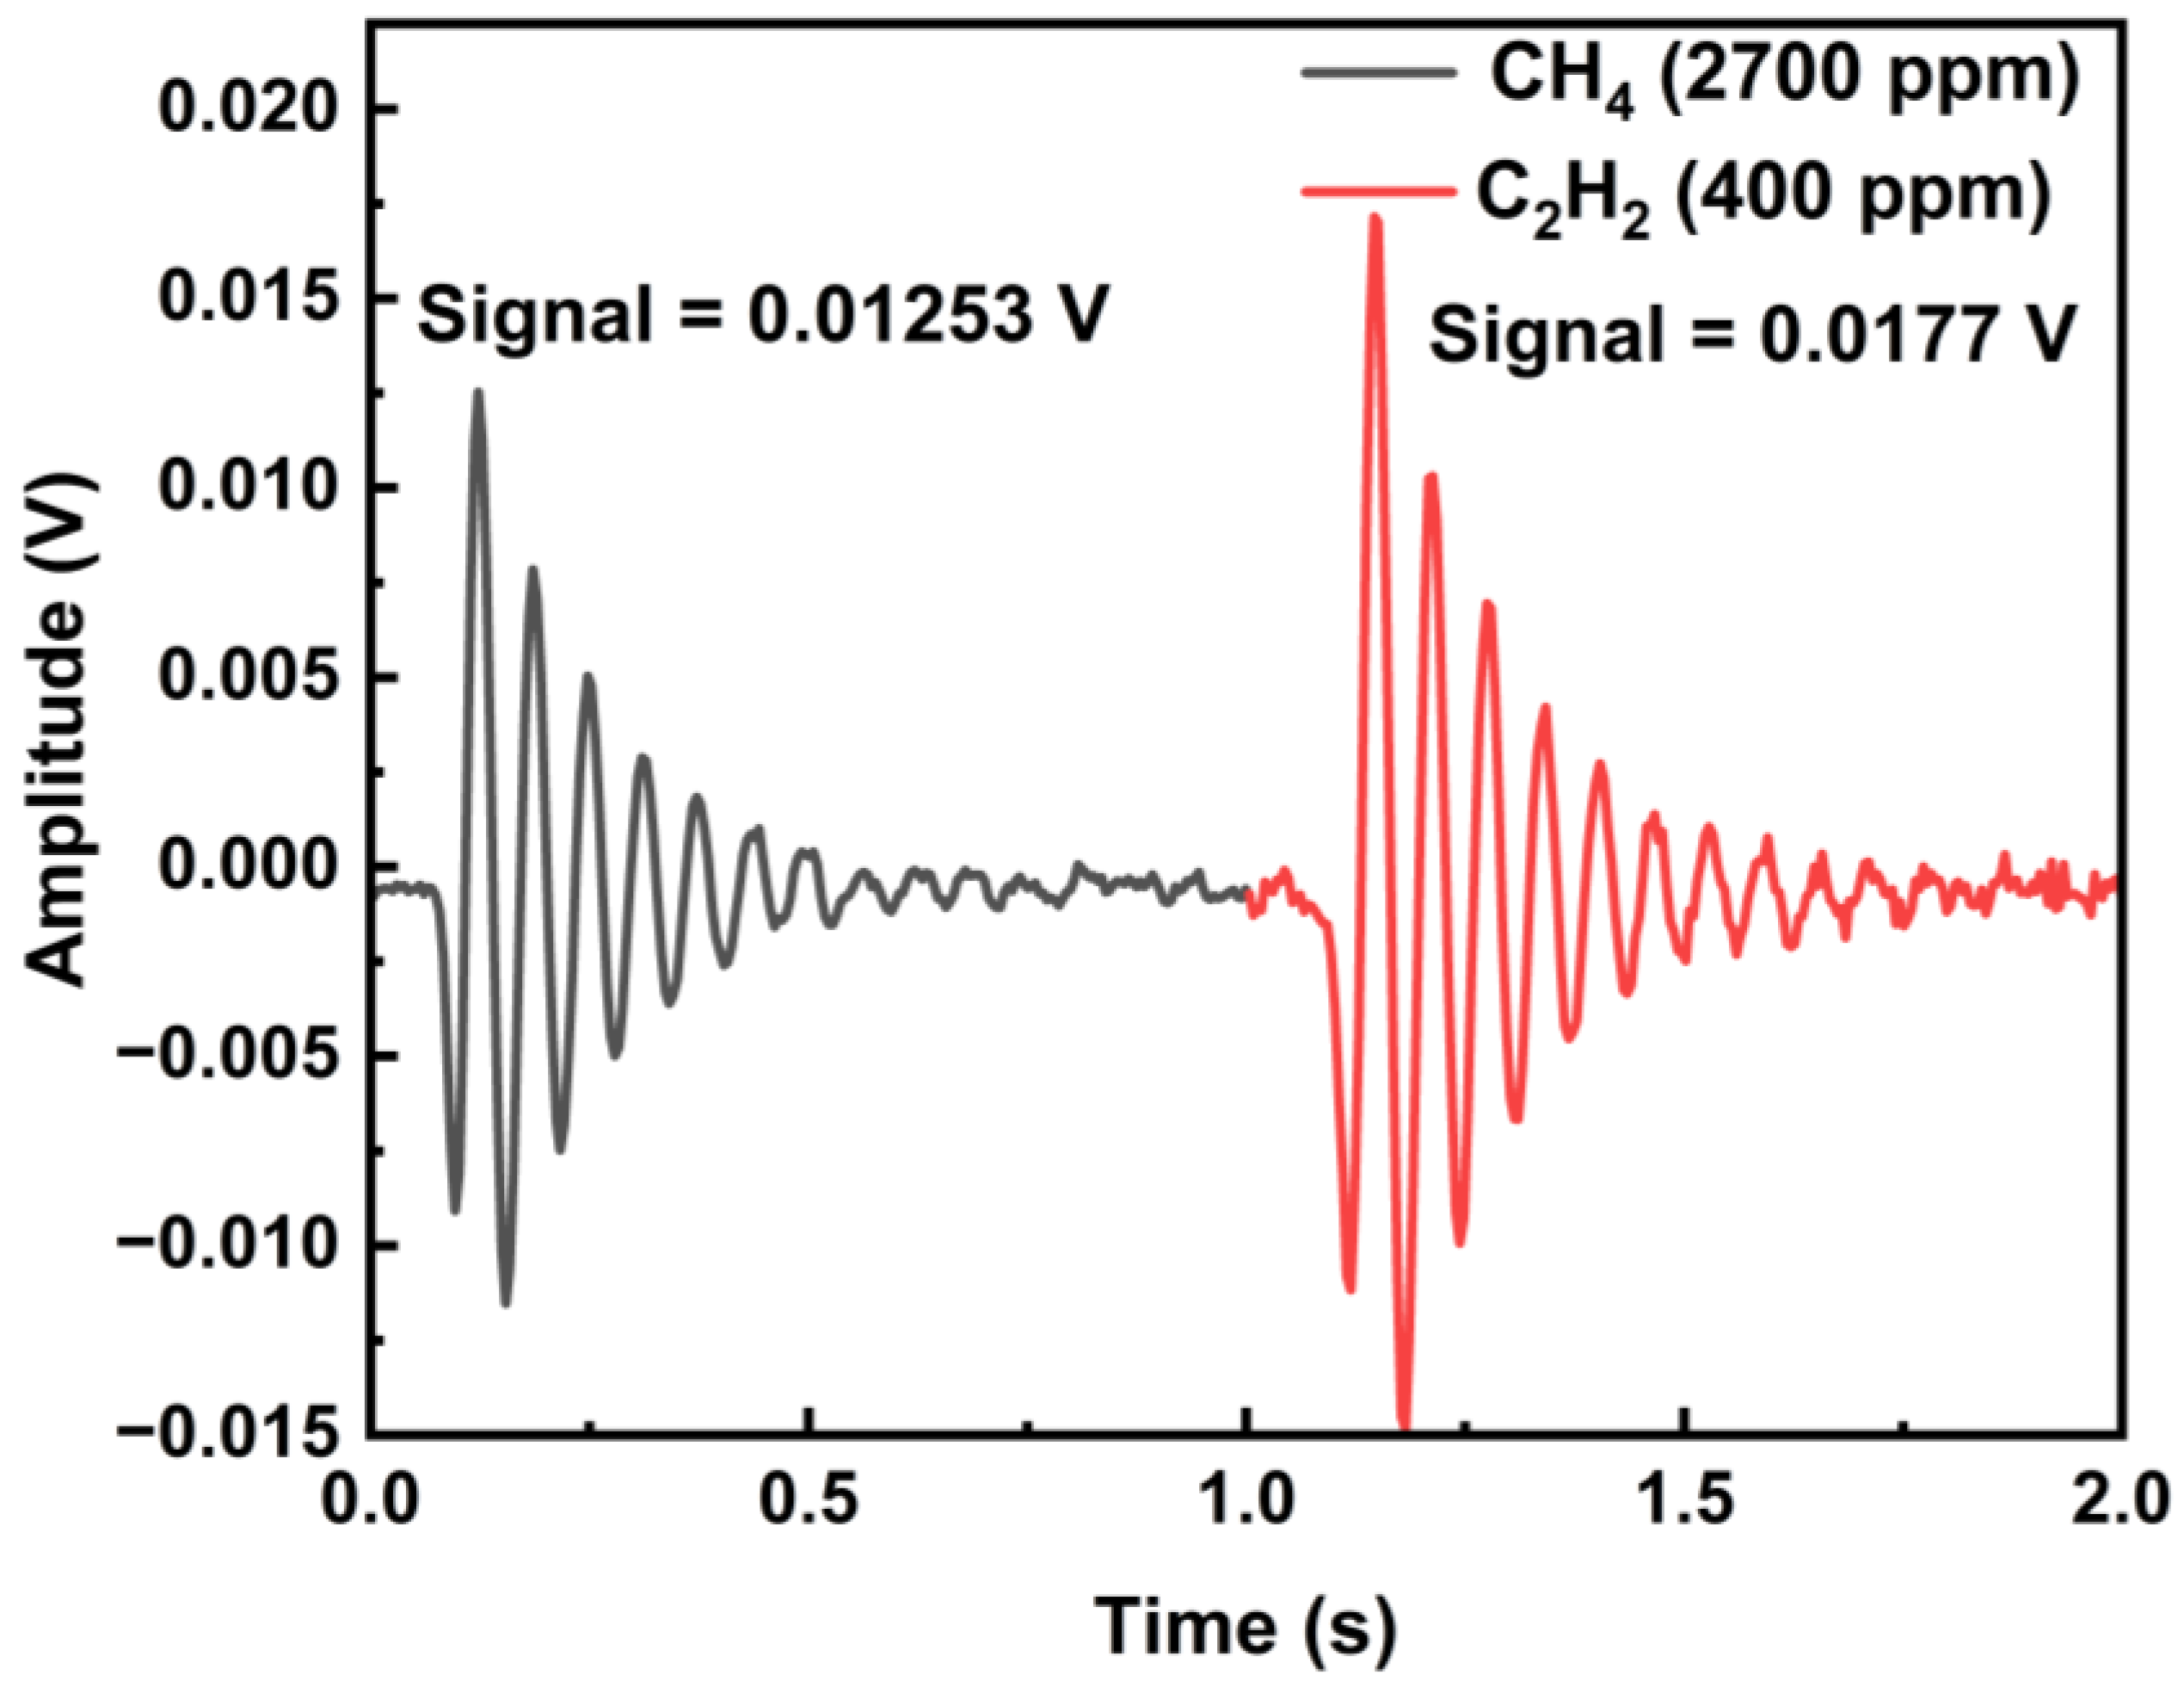
5.1. Determination of QTF Resonant Frequency via Heterodyne Demodulation

The feasibility of detecting resonance frequencies f0 is validated using the experimental setup depicted in Figure 2, with C2H2 gas serving as the sample gas. As depicted in Figure 4a, the beat-frequency signal over one cycle shows a time interval (Δt) of 0.064 s between two consecutive peaks. The beat frequency Δf was determined using Equation (2), enabling calculation of the resonant frequency f0 = 12,465.6 Hz via Equation (3). For comparison, the QTF resonant frequency curve was independently measured using the conventional electrical excitation method as shown in Figure 4b, yielding f0 = 12,465.4 Hz. This traditional approach, however, requires interruption of gas concentration measurements and is time-consuming. Across 10 measurements, we observed that the discrepancy between the two methods was within ±0.5 Hz. The close agreement between the electrically measured f0 and the heterodyne-demodulated f0 confirms the validity and reliability of the BF-QEPAS technique. The peak amplitude of the beat-frequency signal is directly proportional to the gas concentration, a relationship that can be derived from the Beer–Lambert law. Therefore, this method enables simultaneous acquisition of both gas concentration and QTF resonant frequency. Moreover, its applicability extends to all resonant-frequency-based sensing targets. Meanwhile, the resonant frequency response curve of the QTF yielded a Q-factor of 7332, while exponential fitting analysis of the beat frequency signal indicated a response time of 0.1861 s. According to Equation (4), the calculated Q-value is 7287 (error < 1% across 10 measurements). This indicates that the system can simultaneously achieve a reasonably accurate Q-factor measurement.

5.2. Modulation Frequency Optimization

With the modulation amplitude fixed at 0.4 V, we investigated the effect of modulation frequency on the output signal amplitude. As shown in Figure 5, we observe that the signal amplitude initially increases and then decreases as the deviation between the modulation frequency and the resonant frequency of the QTF (f0) widens. This phenomenon can be attributed to two factors governing the amplitude of the BF-QEPAS signal. First, the QTF’s response to the acoustic wave frequency—which equals the laser modulation frequency—is optimal when the laser modulation frequency f approaches the QTF’s resonant frequency f0, making the QTF more easily excited into vibration. Second, Δf plays a critical role: a smaller Δf results in a longer interval between two constructive interferences. The longer this interval, the more vibrational energy the QTF dissipates during this period. These two factors work in concert, leading to a maximum modulation frequency response within a certain range near the QTF’s resonant frequency. Multiple experiments were conducted using C2H2 and CH4 as sample gases. The experimental results demonstrated that both gases exhibited relatively high beat signal amplitudes at a modulation frequency of 12,450 Hz.

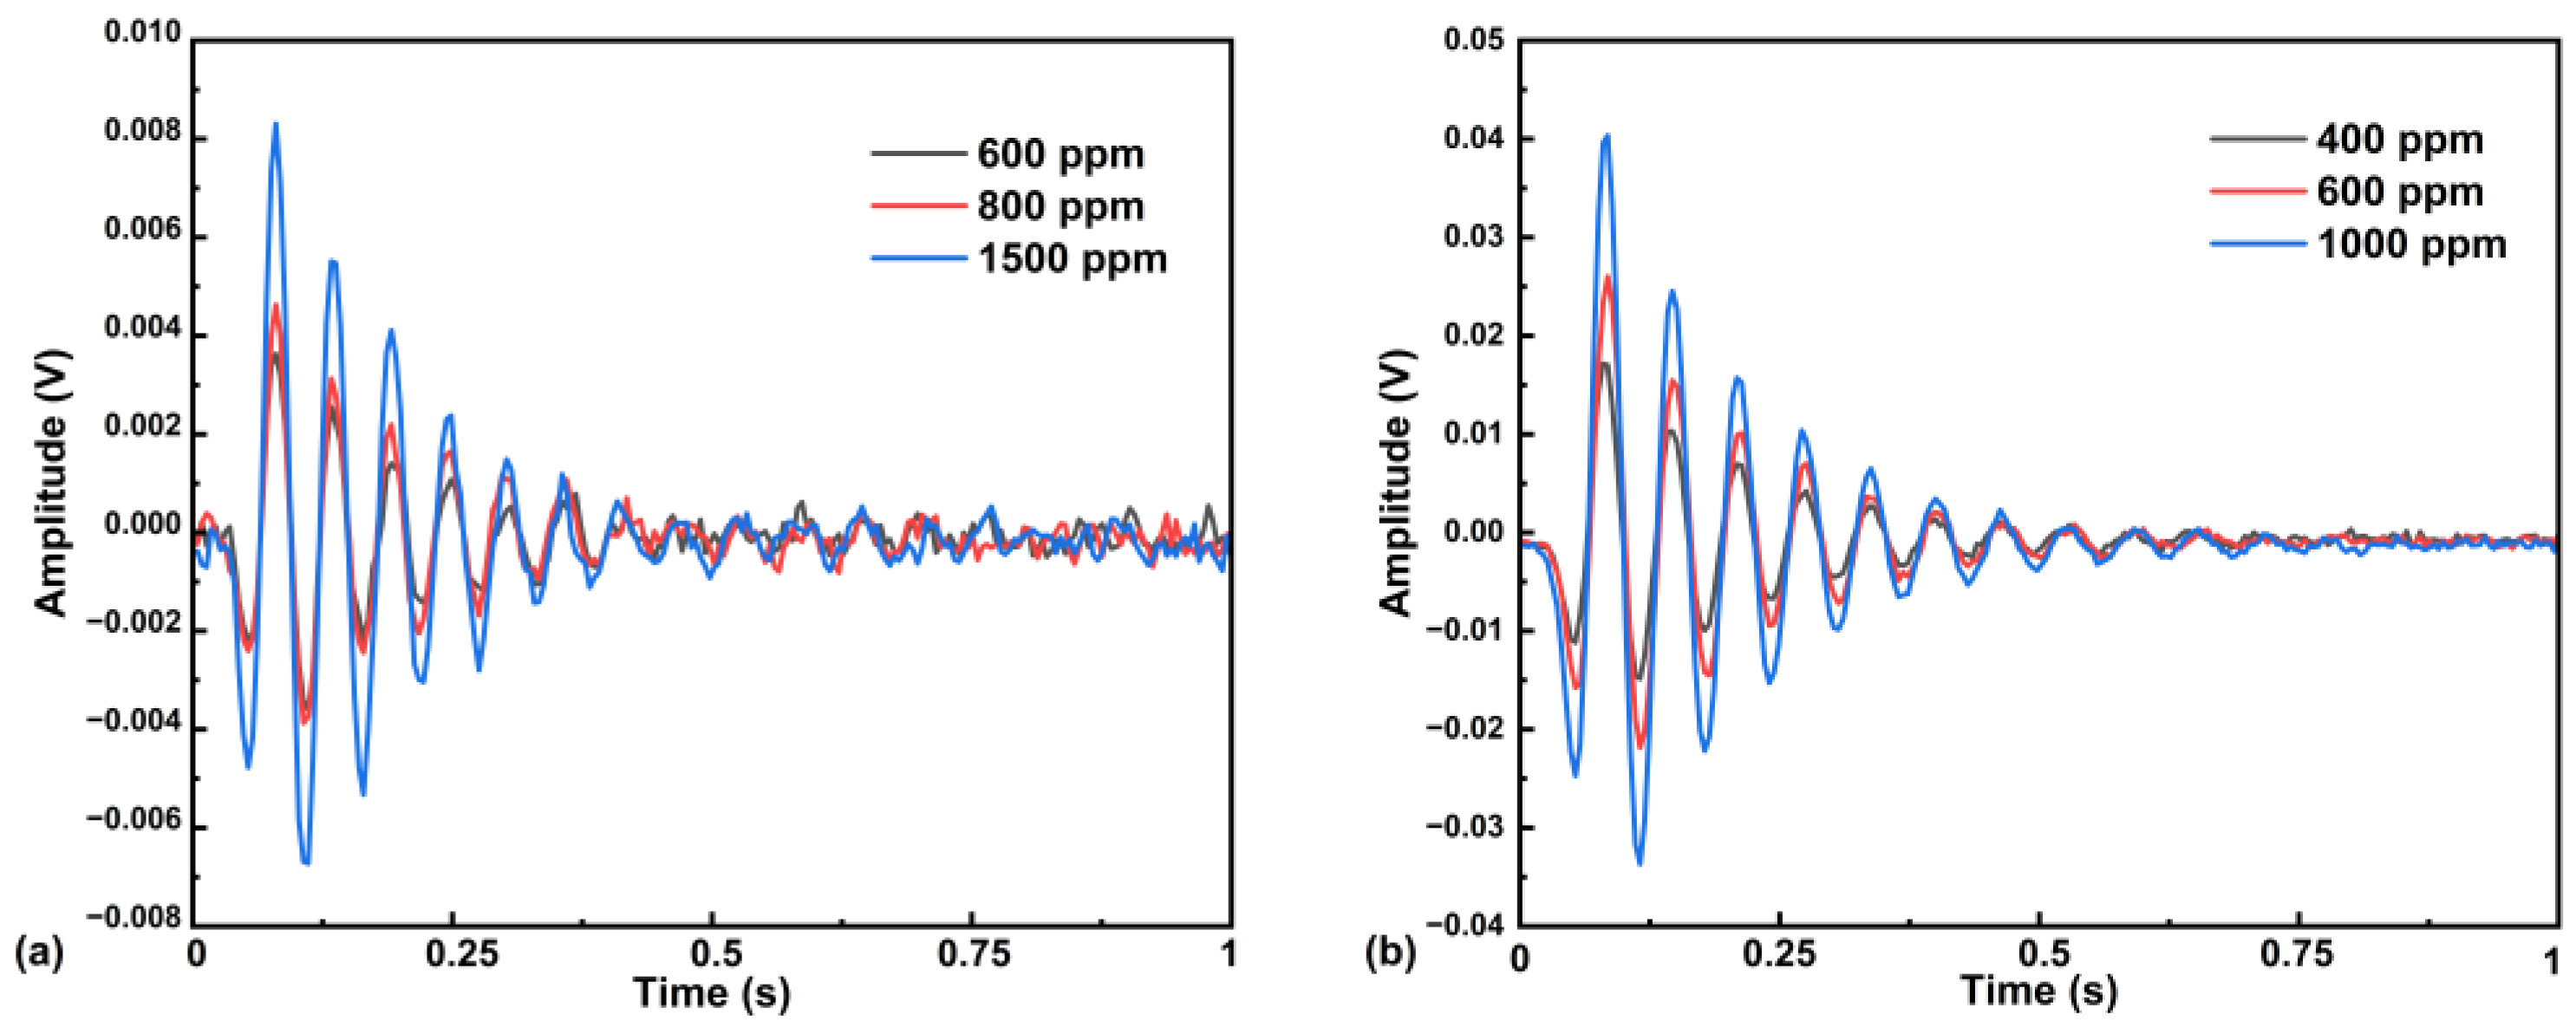
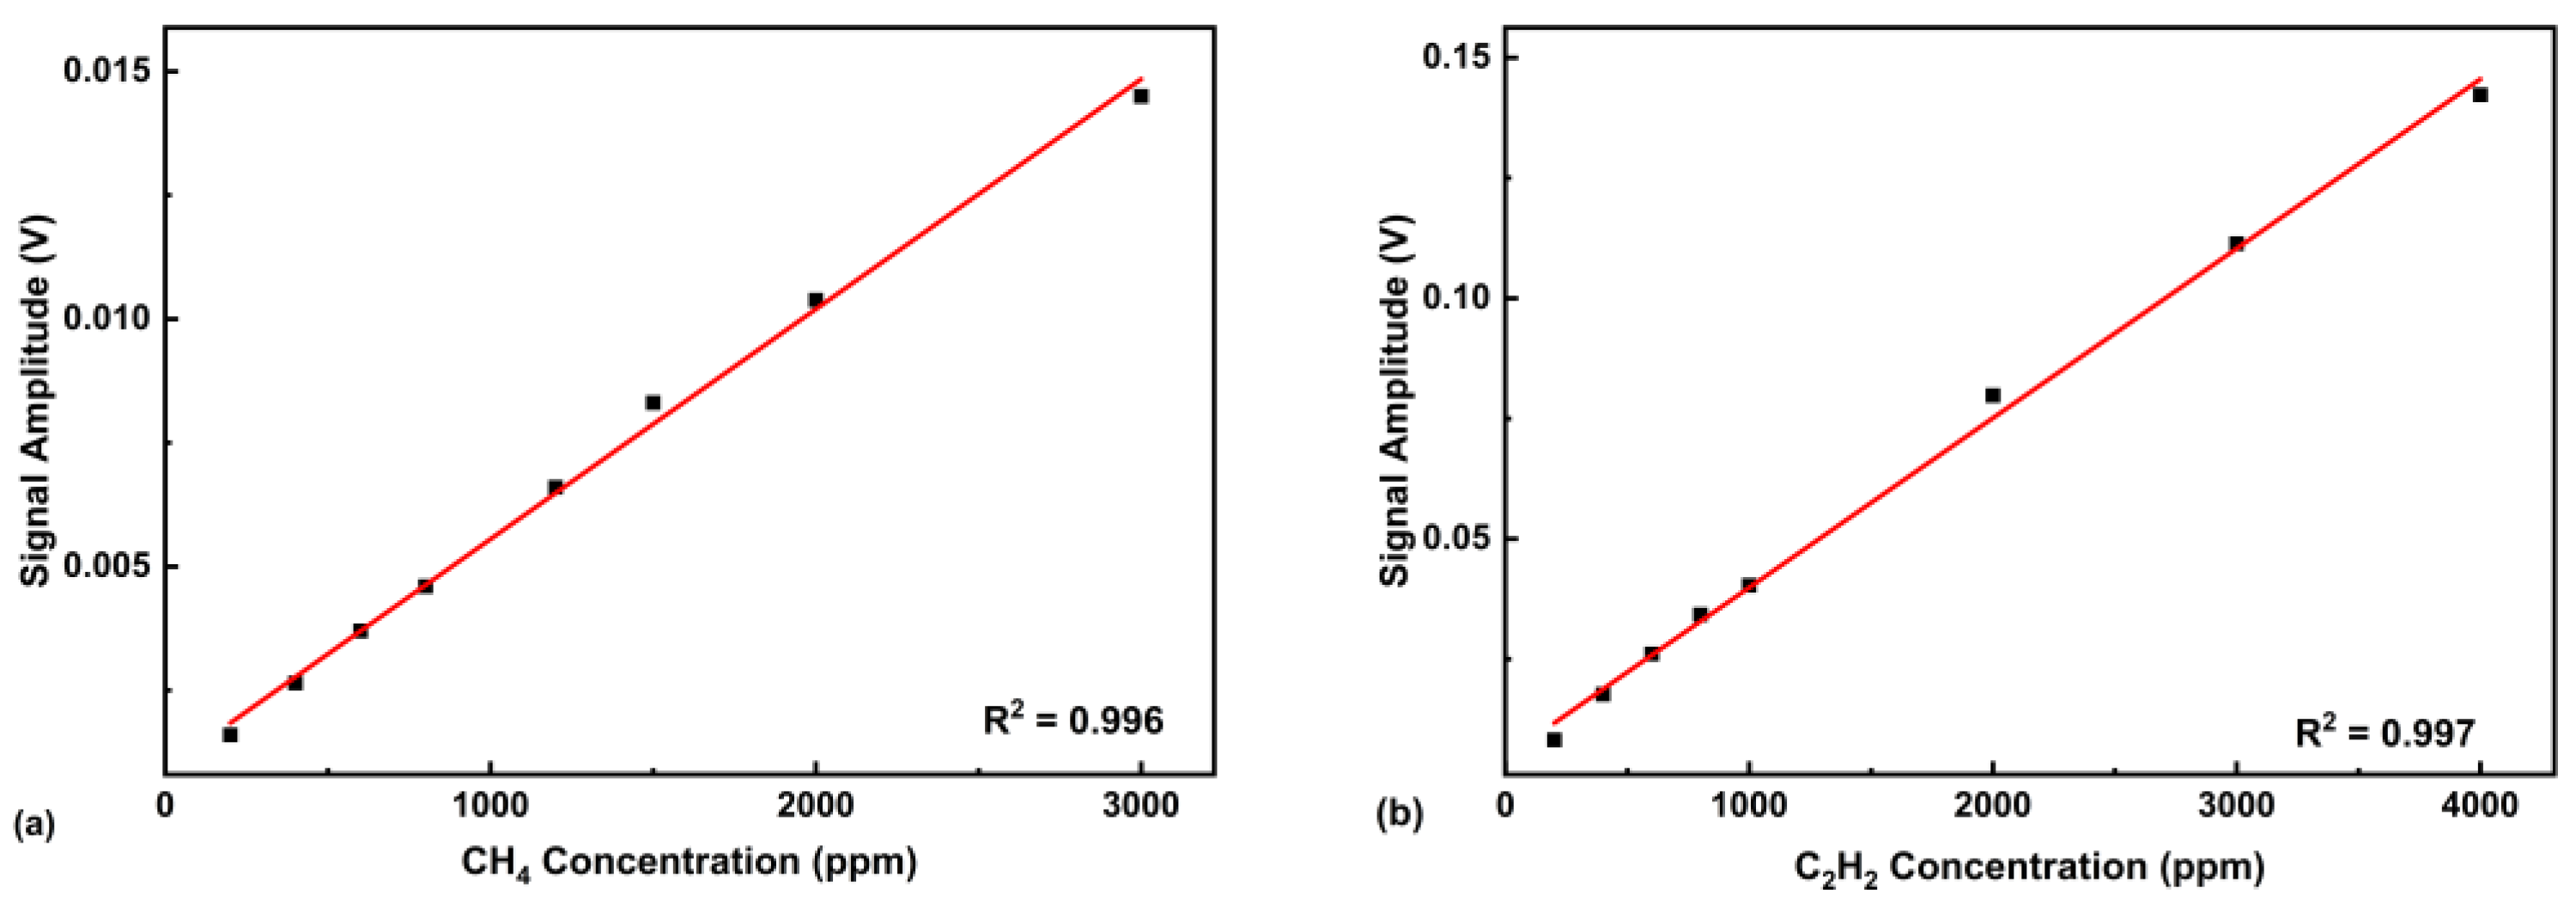
5.3. System Linearity Analysis

Based on prior experiments, the system modulation frequency was fixed at 12,450 Hz with a constant modulation amplitude of 0.4 V. We first configured CH4 gas at concentrations ranging from 200 to 3000 ppm, and a C2H2 gas range from 200 to 4000 ppm using the GDS. These calibrated mixtures were sequentially introduced into the ADM. Beat frequency signals from CH4 and C2H2 at various concentrations were detected individually. Portions of these data are presented in the multi-color curves of Figure 6.
Experimental data confirmed that the beat-frequency signal amplitude is a linear function of gas concentration, exhibiting excellent linearity. Figure 7a displays the linear relationship and corresponding parameters for CH4 gas, yielding a coefficient of determination (R2) of 0.996. Figure 7b shows the linear function for C2H2 gas, with an R2 value of 0.997, indicating outstanding linear responses for both gases.
Following this, simultaneous detection of CH4 and C2H2 was performed using the system. As depicted in Figure 8, the TDM signal waveform features a 1 s composite cycle comprising a 100 ms rapid sawtooth wave followed by a DC segment. Crucially, within each second-long cycle, only one laser emits a pulsed signal to perform gas detection, thereby achieving true time-division multiplexing.
Figure 9 presents the beat-frequency detection signal for a gas mixture containing 2700 ppm CH4 and 400 ppm C2H2. The signal amplitude of CH4 was measured to be 0.01253 V, and the signal amplitude of C2H2 was 0.0177 V. The signal intensities closely align with the linear calibration curves established previously, demonstrating the feasibility and reliability of the TDM system.
Subsequently, pure nitrogen was introduced into the ADM to characterize the noise of the system. The output signal was continuously monitored for minutes under this N2 environment to establish the noise baseline, yielding a 1σ noise level of 0.0264 mV. Figure 10 shows an excerpt of the recorded noise data. Based on this characterization, the system’s minimum detection limits were calculated as 5.69 ppm for CH4 and 0.60 ppm for C2H2.
The conversion of Allan deviation data, calculated for long-term-averaged noise in pure N2, yielded the system’s detection limits. Figure 11 displays the Allan deviation for CH4 and C2H2, from which minimum detection limits of 13.59 ppb (CH4) and 1.425 ppb (C2H2) were determined at an averaging time of 170 s. This analysis validates that the minimum detection limit is proportional to 1/√t (t = lock-in integration time).

6. Conclusions

This study successfully designed and validated a dual-component BF-QEPAS gas detection system based on TDM. By integrating beat-frequency quartz-enhanced photoacoustic spectroscopy technology with the TDM method, the system achieved the highly sensitive and rapid detection of CH4 and C2H2. Owing to its short beat period and fast system response, the BF-QEPAS method significantly reduces the time delay inherent in time-division measurements. Simultaneously, it overcomes the issue of gas detection interruption caused by periodic calibration of the QTF parameter in traditional quartz-enhanced photoacoustic spectroscopy techniques. The experimental results demonstrated excellent linear response across a concentration range of 200 ppm to 4000 ppm, with the R2 value for CH4 being 0.996 and for C2H2 being 0.997. The minimum detection limit for CH4 reached 5.69 ppm and that for C2H2 reached 0.60 ppm.
The successful development of this system provides an effective technical means for the real-time monitoring of dissolved gases in transformer oil, holding significant importance for power grid fault warning and operational reliability. Future research could further optimize system performance, extend it to the detection of more gas components, and explore its application potential in areas such as environmental monitoring and industrial safety.

Author Contributions

Conceptualization, S.Z. and Y.F.; methodology, Y.Z. and H.X.; software, Z.Z. and Y.Z.; validation, H.X., Y.F., and S.Z.; formal analysis, Z.C.; investigation, Z.Z.; resources, J.X.; data curation, H.X.; writing—original draft preparation, H.X.; writing—review and editing, Y.F.; visualization, H.X.; supervision, S.Z.; project administration, S.Z.; funding acquisition, J.X. All authors have read and agreed to the published version of the manuscript.

Funding

This research was funded by the Natural Science Foundation of Shandong Province (ZR2021QF082, ZR2022DKX001) and the Key Research and Development Program of Shandong Province (No.2020CXGC010104, No.2022JMRH0102).

Institutional Review Board Statement

Not applicable.

Informed Consent Statement

Not applicable.

Data Availability Statement

The original contributions presented in this study are included in the article. Further inquiries can be directed at the corresponding authors.

Acknowledgments

Thanks go to the support from the Natural Science Foundation of Shandong Province (ZR2021QF082, ZR2022DKX001) and The Key Research and Development Program of Shandong Province (No. 2020CXGC010104, No. 2022JMRH0102).

Conflicts of Interest

The authors declare no conflicts of interest.

Abbreviations

The following abbreviations are used in this manuscript:
BF-QEPASbeat-frequency quartz-enhanced photoacoustic spectroscopy
TDMtime-division multiplexing
QTFquartz tuning fork
LIAlock-in amplifier
DFBdistributed feedback
GDSgas dilution system
ADMacoustic detection module
R2coefficient of determination

References

  1. Aldhafeeri, T.; Tran, M.-K.; Vrolyk, R.; Pope, M.; Fowler, M. A Review of Methane Gas Detection Sensors: Recent Developments and Future Perspectives. Inventions 2020, 5, 28. [Google Scholar] [CrossRef]
  2. Matindoust, S.; Baghaei-Nejad, M.; Abadi, M.H.S.; Zou, Z.; Zheng, L.-R. Food quality and safety monitoring using gas sensor array in intelligent packaging. Sens. Rev. 2016, 36, 169–183. [Google Scholar] [CrossRef]
  3. Pijolat, C.; Pupier, C.; Sauvan, M.; Tournier, G.; Lalauze, R. Gas detection for automotive pollution control. Sens. Actuators B Chem. 1999, 59, 195–202. [Google Scholar] [CrossRef]
  4. Hall, J.E.; Hooker, P.; Jeffrey, K.E. Gas detection of hydrogen/natural gas blends in the gas industry. Int. J. Hydrogen Energy 2021, 46, 12555–12565. [Google Scholar] [CrossRef]
  5. Cristescu, S.M.; Persijn, S.T.; Hekkert, S.T.L.; Harren, F.J.M. Laser-based systems for trace gas detection in life sciences. Appl. Phys. B 2008, 92, 343. [Google Scholar] [CrossRef]
  6. Schmid, T. Photoacoustic spectroscopy for process analysis. Anal. Bioanal. Chem. 2006, 384, 1071–1086. [Google Scholar] [CrossRef] [PubMed]
  7. Patimisco, P.; Scamarcio, G.; Tittel, F.; Spagnolo, V. Quartz-Enhanced Photoacoustic Spectroscopy: A Review. Sensors 2014, 14, 6165–6206. [Google Scholar] [CrossRef] [PubMed]
  8. Ma, Y. Review of Recent Advances in QEPAS-Based Trace Gas Sensing. Appl. Sci. 2018, 8, 1822. [Google Scholar] [CrossRef]
  9. Kosterev, A.A.; Dong, L.; Thomazy, D.; Tittel, F.K.; Overby, S. QEPAS for chemical analysis of multi-component gas mixtures. Appl. Phys. B 2010, 101, 649–659. [Google Scholar] [CrossRef]
  10. Levy, R.; Duquesnoy, M.; Melkonian, J.-M.; Raybaut, M.; Aoust, G. New Signal Processing for Fast and Precise QEPAS Measurements. IEEE Trans. Ultrason. Ferroelect. Freq. Contr. 2020, 67, 1230–1235. [Google Scholar] [CrossRef] [PubMed]
  11. Bi, S.; Zhang, X.; Zhang, Z.; Liu, X.; Qin, L.; Shi, J.; Zhao, Y.; Wang, Z. A light-induced thermoelastic spectroscopy using surface mounted device quartz tuning fork. Photoacoustics 2025, 42, 100686. [Google Scholar] [CrossRef] [PubMed]
  12. Zhang, T.; Gu, Y.; Zhang, Q.; Wei, Y.; Wang, L.; Li, C.; Wang, W.; Lv, J.; Feng, Y. Performance improvement of quartz-enhanced photoacoustic spectroscopy gas system using ICEEMDAN-PE-WTD. Infrared Phys. Technol. 2025, 145, 105650. [Google Scholar] [CrossRef]
  13. Wu, H.; Dong, L.; Zheng, H.; Yu, Y.; Ma, W.; Zhang, L.; Yin, W.; Xiao, L.; Jia, S.; Tittel, F.K. Beat frequency quartz-enhanced photoacoustic spectroscopy for fast and calibration-free continuous trace-gas monitoring. Nat. Commun. 2017, 8, 15331. [Google Scholar] [CrossRef] [PubMed]
  14. Rousseau, R.; Maurin, N.; Trzpil, W.; Bahriz, M.; Vicet, A. Quartz Tuning Fork Resonance Tracking and application in Quartz Enhanced Photoacoustics Spectroscopy. Sensors 2019, 19, 5565. [Google Scholar] [CrossRef] [PubMed]
  15. Li, B.; Feng, C.; Wu, H.; Jia, S.; Dong, L. Calibration-free mid-infrared exhaled breath sensor based on BF-QEPAS for real-time ammonia measurements at ppb level. Sens. Actuators B Chem. 2022, 358, 131510. [Google Scholar] [CrossRef]
  16. Ye, W.; He, L.; Liu, W.; Yuan, Z.; Zheng, K.; Li, G. Optomechanical energy enhanced BF-QEPAS for fast and sensitive gas sensing. Photoacoustics 2025, 41, 100677. [Google Scholar] [CrossRef] [PubMed]
  17. Aspromonte, J.; Mascrez, S.; Eggermont, D.; Purcaro, G. Solid-phase microextraction coupled to comprehensive multidimensional gas chromatography for food analysis. Anal. Bioanal. Chem. 2024, 416, 2221–2246. [Google Scholar] [CrossRef] [PubMed]
  18. Wan, E.; Zhang, Q.; Li, L.; Xie, Q.; Li, X.; Liu, Y. The online in situ detection of indoor air pollution via laser induced breakdown spectroscopy and single particle aerosol mass spectrometer technology. Opt. Lasers Eng. 2024, 174, 107974. [Google Scholar] [CrossRef]
  19. Singh, R.; Gupta, R.; Bansal, D.; Bhateria, R.; Sharma, M. A Review on Recent Trends and Future Developments in Electrochemical Sensing. ACS Omega 2024, 9, 7336–7356. [Google Scholar] [CrossRef] [PubMed]
  20. Chen, K.; Cui, D.; Qi, H.; Yang, L.; Zhao, X. Multi-component Freon gas detection based on infrared tunable Fabry-Perot detector. Sens. Actuators B Chem. 2024, 420, 136488. [Google Scholar] [CrossRef]
  21. Li, C.; Han, X.; Ma, F.; Zhao, X.; Wang, Z.; Qi, H.; Guo, M.; Chen, K. Multiplexed fiber-optic photoacoustic sensors for simultaneous detection of multi-point gases. Sens. Actuators B Chem. 2024, 399, 134801. [Google Scholar] [CrossRef]
  22. Guo, S.; Li, J.; Wei, Y.; Yang, Y.; Lu, Z.; Xing, X.; Ren, W.; Yao, S. A multi-laser hybrid absorption sensor for simultaneous measurement of NH3, NO, and temperature in denitrification flue gas. Infrared Phys. Technol. 2024, 136, 105034. [Google Scholar] [CrossRef]
  23. Zhang, Q.; Chang, J.; Cong, Z.; Sun, J.; Wang, Z. QEPAS Sensor for Simultaneous Measurements of H2O, CH4, and C2H2 Using Different QTFs. IEEE Photonics J. 2018, 10, 1–8. [Google Scholar] [CrossRef]
  24. Yu, Y.; Tian, C.; Wang, Z.; Qian, S.; Yan, C.; Zhang, H. Multicomponent gas detection technology of FDM and TDM based on photoacoustic spectroscopy. Appl. Opt. 2021, 60, 838. [Google Scholar] [CrossRef] [PubMed]
  25. Qin, L.; Bi, S.; Chen, R.; Zhao, Y.; Shi, J.; Zhang, H.; Wang, Z. Two-Component Gas Sensor of Time-Division Multiplexing Technique Based on QEPAS and LITES. IEEE Photon. Technol. Lett. 2024, 36, 1085–1088. [Google Scholar] [CrossRef]
  26. Chen, K.; Guo, M.; Yang, B.; Jin, F.; Wang, G.; Ma, F.; Li, C.; Zhang, B.; Deng, H.; Gong, Z. Highly Sensitive Optical Fiber Photoacoustic Sensor for In Situ Detection of Dissolved Gas in Oil. IEEE Trans. Instrum. Meas. 2021, 70, 1–8. [Google Scholar] [CrossRef]
  27. He, H.; Xu, X. Study on transformer oil dissolved gas online monitoring and fault diagnosis method. In 2012 IEEE International Conference on Condition Monitoring and Diagnosis; IEEE: New York, NY, USA, 2012; pp. 593–596. [Google Scholar]
  28. Ye, W.; Xia, Z.; Hu, L.; Luo, W.; Liu, W.; Xu, X.; Zheng, C. Infrared dual-gas CH4/C2H2 sensor system based on dual-channel off-beam quartz-enhanced photoacoustic spectroscopy and time-division multiplexing technique. Spectrochim. Acta Part A Mol. Biomol. Spectrosc. 2023, 285, 121908. [Google Scholar] [CrossRef] [PubMed]
  29. Li, C.; Ma, F.; Sun, C.; Qi, H.; Han, X.; Guo, M.; Chen, K. In-situ detection of dissolved C2H2/CH4 with frequency-division-multiplexed fiber-optic photoacoustic sensor. Sens. Actuators B Chem. 2025, 435, 137651. [Google Scholar] [CrossRef]
Figure 1. Absorption lines of CH4 and C2H2 in the wavenumber range of 5800 to 6800 cm−1 obtained from the 2020 HITRAN database.
Photonics 12 00747 g001
Figure 2. Device diagram of dual-component BF-QEPAS gas detection system based on TDM technology (black lines: electrical circuitry; yellow lines: optical path; cyan lines: gas flow channels).
Photonics 12 00747 g002
Figure 3. DFB laser characterization diagrams used in the experiment for measuring (a) CH4 and (b) C2H2.
Photonics 12 00747 g003
Figure 4. (a) The beat-frequency signal from the sensing system. (b) The frequency response curve of the QTF measured by the electrical excitation method.
Photonics 12 00747 g004
Figure 5. Beat-frequency signal amplitude and the conventional QEPAS signal amplitude as a function of modulation frequency.
Photonics 12 00747 g005
Figure 6. Beat-frequency signals for CH4 and C2H2 at different concentrations: (a) CH4 beat-frequency signals; (b) C2H2 beat-frequency signals.
Photonics 12 00747 g006
Figure 7. Beat-frequency signal amplitude as a function of gas concentration. (a) Linearity for CH4; (b) linearity for C2H2.
Photonics 12 00747 g007
Figure 8. Time-division multiplexing of the DFB laser current driver: (a) Sawtooth wave-1 (C2H2). (b) Sawtooth wave-2 (CH4). (c) Diver signal. (d) BF-QEPAS signal. The yellow signal in the figure is used to detect C2H2, and the blue signal is used to detect CH4.
Photonics 12 00747 g008
Figure 9. Dual-gas beat-frequency signals of 2700 ppm CH4 and 400 ppm C2H2 acquired via time-division multiplexing.
Photonics 12 00747 g009
Figure 10. The system output signal when the ADM was filled with pure nitrogen (system noise signal without absorption). The time axis shows the last 30 s of a continuous noise recording under pure N2.
Photonics 12 00747 g010
Figure 11. Analysis of Allan deviation for (a) CH4 and (b) C2H2.
Photonics 12 00747 g011
Disclaimer/Publisher’s Note: The statements, opinions and data contained in all publications are solely those of the individual author(s) and contributor(s) and not of MDPI and/or the editor(s). MDPI and/or the editor(s) disclaim responsibility for any injury to people or property resulting from any ideas, methods, instructions or products referred to in the content.

