Article

RIS-Aided V2I–VLC for the Next-Generation Intelligent Transportation Systems in Mountain Areas

1
Institute of Intelligent Communication and Computing, School of Information and Communication Engineering, Beijing Information Science and Technology University, Beijing 102206, China
2
Institute of Software Chinese Academy of Sciences, Beijing 100190, China
*
Author to whom correspondence should be addressed.
Photonics 2025, 12(7), 664; https://doi.org/10.3390/photonics12070664
Submission received: 30 May 2025 / Revised: 26 June 2025 / Accepted: 30 June 2025 / Published: 1 July 2025
(This article belongs to the Special Issue Emerging Technologies in Visible Light Communication)

Abstract

Visible light communication (VLC) is considered to be one of the key technologies for advancing the next-generation intelligent transportation systems (ITSs). However, in vehicle-to-vehicle (V2V) and vehicle-to-infrastructure (V2I) VLC, the line-of-sight (LOS) link for communication is often obstructed by vehicle mobility. To address this issue and enhance system performance, a novel V2I–VLC system is proposed and analyzed in this study. The system targets mountain road traffic scenarios employing optical reflecting intelligent surfaces (RISs). To emphasize the practicality of the study, the effects of atmospheric turbulence (AT) and weather conditions are also considered in the channel modeling. Further, the closed-form expressions for average path loss, channel capacity, and outage probability are derived. Furthermore, a novel closed-form expression is also derived for the properties of RIS, which can be used to calculate the required number of RIS elements to achieve a target energy efficiency. In the performance analysis, the accuracy of the derived theoretical expression is validated by numerical simulation, and the effectiveness of the RIS-aided V2I–VLC system is evaluated. Moreover, with a reasonable number of required RIS elements, the system performance in terms of path loss is improved by more than 23.5% on average over the existing studies.

1. Introduction

Traffic safety is a critical global issue, with nearly 1.35 million people either dying or becoming disabled due to traffic accidents every year. Additionally, fatal accidents claim around 3700 lives each day [1]. Of the five major landform types of the world’s landmass, non-plain landforms, such as mountains and hills, occupy more than 65% of the world’s land area [2]. The mountain road networks in these areas have special geological and meteorological characteristics. Traffic accidents are highly prone to occur and have a significant impact on the normal operation of the roads [3]. Accidents on mountain roads result in more severe consequences than those on ordinary roads, with prolonged impacts, challenging evacuation and rescue operations, and a heightened risk of triggering environmental chain reactions [4]. Therefore, how to improve transportation, especially the road transportation system in mountain areas, has become the focus of attention of traffic safety scholars around the world.
One of the effective means of addressing traffic safety issues is to promote next-generation intelligent transportation systems (ITSs) [5]. Due to its significant technological advantages in terms of cost and energy efficiency, visible light communication (VLC) is considered a key technology to enable vehicle-to-vehicle (V2V) and vehicle-to-infrastructure (V2I) communication in ITS [6]. Visible light occupies the 380–750 nm wavelength range (corresponding to frequencies of 400–790 THz) within the electromagnetic spectrum. In VLC implementations, light-emitting diodes (LEDs) serve as intensity-modulated transmitters that concurrently deliver illumination and encode information through orthogonal frequency-division multiplexing (OFDM) or pulse-position modulation (PPM) schemes [7]. Owing to the huge available bandwidth of visible light, the data transmission rate of VLC is now capable of reaching tens of Gb/s [8]. The main application scenarios of VLC are indoor and outdoor communication. Indoor VLC systems have gained more popularity and expansion due to the success of light fidelity (Li-Fi), while outdoor VLC systems encounter challenges, including more hostile communication environments [9], line-of-sight (LOS) links blockage, and weather constraints. In light of the aforementioned challenges in outdoor systems, a promising solution that has caught the attention of researchers is optical reflecting intelligent surfaces (RISs) [10].

1.1. Related Works

In [11], a comprehensive overview of VLC technology was given in terms of fundamentals, recent advances, and applications. In addition, several possible application scenarios of VLC were explored. In [12], focusing on the application of indoor VLC technology in 6G networks, a system model integrating illumination, communication, and sensing in VLC was proposed. The research provided new ideas for the development of 6G networks. In [13], a full-duplex communication system model for the indoor VLC system was established. Moreover, in order to analyze the main factors affecting the received optical power of the uplink, a performance analysis method of a single light source and bidirectional visible light communication link was proposed. The study provided theoretical support for indoor VLC system design. In [14], an improved constant modulus algorithm (CMA) was proposed for signal equalization. The algorithm improved the error function and the step size adjustment method and thus enhanced the convergence speed and steady-state error performance of the algorithm. Furthermore, regarding the nonlinear impairment mitigation, channel estimation, modulation format detection, localization, security, and resource management in VLC systems, a comprehensive review of the application of machine learning (ML) algorithms in VLC systems was addressed [15]. And the benefits, challenges, and future research directions of ML in VLC were summarized.
In contrast, for outdoor VLC systems, most of the current research focuses on channel modeling, system performance improvement, and applications in specific environments or scenarios. In terms of channel modeling, a model of visible light transmission in atmospheric channels was proposed and studied in [16], and the accuracy of the model was also verified by experiments. Based on the above atmospheric channel model, the performance of outdoor VLC systems under the influence of daylight noise and smoke was further investigated in [17,18]. The authors in [17] provided measured data of an outdoor VLC system during a day and analyzed the sunlight noise baseline and interference, which provided a basis for the development and optimization of outdoor VLC systems. In [18], the VLC channel was modeled to match the actual effects of smoke, and an enhanced pulse position modulation (E-PPM) was proposed to improve the communication quality. In the context of the Internet of Vehicles (IoV), a self-synchronized VLC system was proposed in [19] to ensure reliable communication within and between vehicles. The system enabled symbol-level and frame-level synchronization using markers, which improved the reliability and stability of V2V–VLC. In addition, there are numerous studies on VLC technologies applied to specific environments or scenarios. For example, in [20], the propagation of visible light in underwater wireless communications was described, with particular attention to vertical links. Considering depth-dependent absorption, scattering, as well as the contribution of bubbles, the power losses suffered by signals under realistic channel conditions were also calculated. The study provided a more accurate performance evaluation for underwater optical communications. Moreover, a light source deployment scheme for underground communication scenarios in long tunnels was proposed in [21]. Furthermore, VLC systems in underground mines were studied in [22,23]. In [22], the focus was on VLC channel modeling, and the complexity of the mine environment, such as high dust concentrations and extreme temperatures and pressures, was taken into account. In [23], a mine communication scheme combining VLC and RF communication technology was proposed to improve the communication quality and stability in the mine.
As a new high-speed data transmission technology that utilizes visible light as information carriers, VLC has many advantages, including:
  • No electromagnetic interference: VLC utilizes visible light bands to avoid spectrum competition with RF devices (e.g., Wi-Fi, Bluetooth), making it suitable for electromagnetically sensitive environments.
  • High security: Visible light cannot penetrate walls, so the communication range is limited, which effectively prevents the signal from being intercepted or interfered with remotely.
  • Green and safe: Existing lighting infrastructures can be retrofitted with both efficient lighting and data transmission capabilities, which saves on deployment costs and energy consumption. Additionally, visible light is not harmful to humans.
Despite the aforementioned advantages of VLC systems, VLC has some significant drawbacks, including:
  • signals are susceptible to masking, resulting in communication breakdowns;
  • limited communication distance;
  • uplinks are more difficult to implement;
  • higher requirements for light source and environment, etc.
To address these challenges, researchers propose to introduce relay and RIS technologies into VLC systems. Amplify-and-forward (AF) and decode-and-forward (DF) are currently the two dominant relay methods [24]. As an active device, the relay can compensate for the loss by means of external power, thereby extending the range of VLC. Meanwhile, it is also possible to bypass specific obstructions by means of multi-hop relaying. However, relay nodes need to be independently powered and maintained, and the deployment cost increases linearly with the number of nodes. Moreover, the AF relay method amplifies the noise while amplifying the signal, and the DF relay method introduces additional delay in the relaying process. Especially, the delay problem is exacerbated in multi-hop scenarios, and error correction coding is required, which further increases the system overhead. In comparison, RIS offers significant advantages in terms of [25,26]:
  • Energy efficiency and cost: The passive nature of RIS makes its energy consumption significantly lower than that of relay, which is especially suitable for large-scale deployment in communication-intensive scenarios such as smart transportation, smart cities, and smart homes.
  • Delay and reliability: The passive reflection mechanism of RIS avoids the signal processing delay required by relay nodes. Therefore, RIS is more advantageous in delay-sensitive communication scenarios such as IoV and industrial automation.
  • Spatial freedom and concealment: RIS can be embedded in the surface of other objects (e.g., mountains, buildings, etc.) without the need for additional physical space. However, relay requires independent deployment of nodes and additional light sources, which may damage the aesthetics of the environment.
  • Mobility: RIS enables low-latency dynamic tracking of mobile transmitters/receivers such as vehicles, while relay is complex for mobility management.
In general, the low complexity, high energy efficiency, and strong flexibility of RIS ensure compatibility with VLC-based systems. Currently, there are two main types of RIS being investigated for application in VLC, which are Intelligent Mesosurface Reflector (IMR) and Intelligent Mirror Array (IMA). For IMR, current researchers mainly focus on liquid crystal-based IMR and graphene-based IMR, etc. In [27], the authors studied the nontrivial infiltration of a nanostructured planar silica metalens with nematic liquid crystals. The results show that the investigated technology could potentially enable dynamic control of the metalens optical response. Moreover, in photonics, the gate-controllable electronic properties of graphene provide a route to efficiently manipulate the interaction of photons with graphene. In [28], the authors demonstrate that substantial gate-induced persistent switching and linear modulation of terahertz waves can be achieved in a two-dimensional metamaterial into which an atomically thin, gated two-dimensional graphene layer is integrated. In addition, IMA is controlled by the generalized Snell refraction and reflection laws and can provide a natural RIS solution for VLC systems. For the applications of optical RIS, in [29], the potential application of RIS in 5G and 6G wireless communications was explored. The application of RIS in combination with various potential technologies was also investigated, such as unmanned aerial vehicles (UAVs), millimeter-wave massive multiple-input multiple-output (MIMO), and VLC systems.
In terms of RIS-aided indoor VLC systems, liquid crystal (LC)-based RIS was studied in [30,31]. In [30], the potential of LC-RIS in improving the VLC data rate and illumination uniformity was verified by simulations. In [31], the impact of LC-RIS parameters (e.g., number of elements and thickness, etc.) on the system performance was studied. To guarantee VLC LOS conditions in mobility, in [32], the authors used RIS as a technological solution. This approach can be utilized to enhance VLC connectivity by exploiting NLOS propagation. To maximize the rate of indoor RIS-aided VLC systems, the works in [33,34,35,36] made different efforts. In [33], the total VLC rate was maximized by jointly optimizing the orientation of the RIS elements, the time allocation of the user terminals, and the transmit power of the LEDs. In contrast, in [34,35,36], novel spatial modulation (SM) schemes for RIS-aided VLC systems were explored. Furthermore, for multiple users, a hybrid non-orthogonal multiple access (NOMA) scheme combining sparse code multiple access (SCMA) and power-domain NOMA (PD-NOMA) was proposed in [37], which ensured user fairness while maximizing communication capacity.
For RIS-aided outdoor VLC systems, the authors discussed the use cases for the RIS-aided VLC in the unmanned aerial vehicle networks, vehicle-to-everything applications, and streetlight-based communication systems in [38]. Additionally, most of the current research focuses on V2V communication, e.g., [39,40,41,42,43,44,45]. Recently, a novel RIS-aided V2V–VLC transmission scheme was proposed in [39]. In this scheme, the LOS link blockage problem was addressed by deploying RIS on intermediate vehicles. In addition, multiple LED headlights were used to enhance the transmission path. In [40], a V2V–VLC system was implemented by deploying the RIS on the transportation infrastructure. In [41,42], the authors investigated the security and communication performance of simultaneously transmitting and reflecting RIS (STAR-RIS)-based V2V–VLC systems. In [43], the LOS link interruption caused by the communicating vehicle turning at the intersection was solved by deploying RIS in the V2V–VLC system. However, to the best of our knowledge, none of the works reported in literature are about V2I–VLC systems for mountain road transportation. In addition, in [44], the simulation of the proposed system and investigation of the system were carried out for two modulation approaches on–off keying and variable pulse code modulation. For the V2V–VLC systems using MIMO techniques, in [45], the authors investigated the fundamental tradeoff between the diversity and multiplexing gains, known as the diversity-multiplexing tradeoff (DMT). In summary, although the above studies are about outdoor VLC systems, the effects of weather factors on the systems are not considered in either the system or the channel models. Furthermore, for RIS-aided V2V–VLC or V2I–VLC systems, vehicle mobility should be emphasized. However, in [40,41,42], the authors only investigated the performance of RIS-aided VLC systems with fixed transmitter and receiver positions.
In summary, the RIS technique is of great practical significance in improving the communication quality of VLC systems, solving the problem of LOS links blockage, and improving the coverage area. It is of high necessity to study the RIS-aided V2I–VLC system for mountain roads and provide design recommendations for the next-generation ITS. It is worth noting that vehicle mobility and real atmospheric conditions should be prioritized.

1.2. Motivation and Contributions

Motivated by the above facts, an RIS-aided V2I–VLC system for mountain road traffic is proposed in this work. Based on the modelling of the system, the system performance is comprehensively analyzed. The contribution of this work is highlighted below:
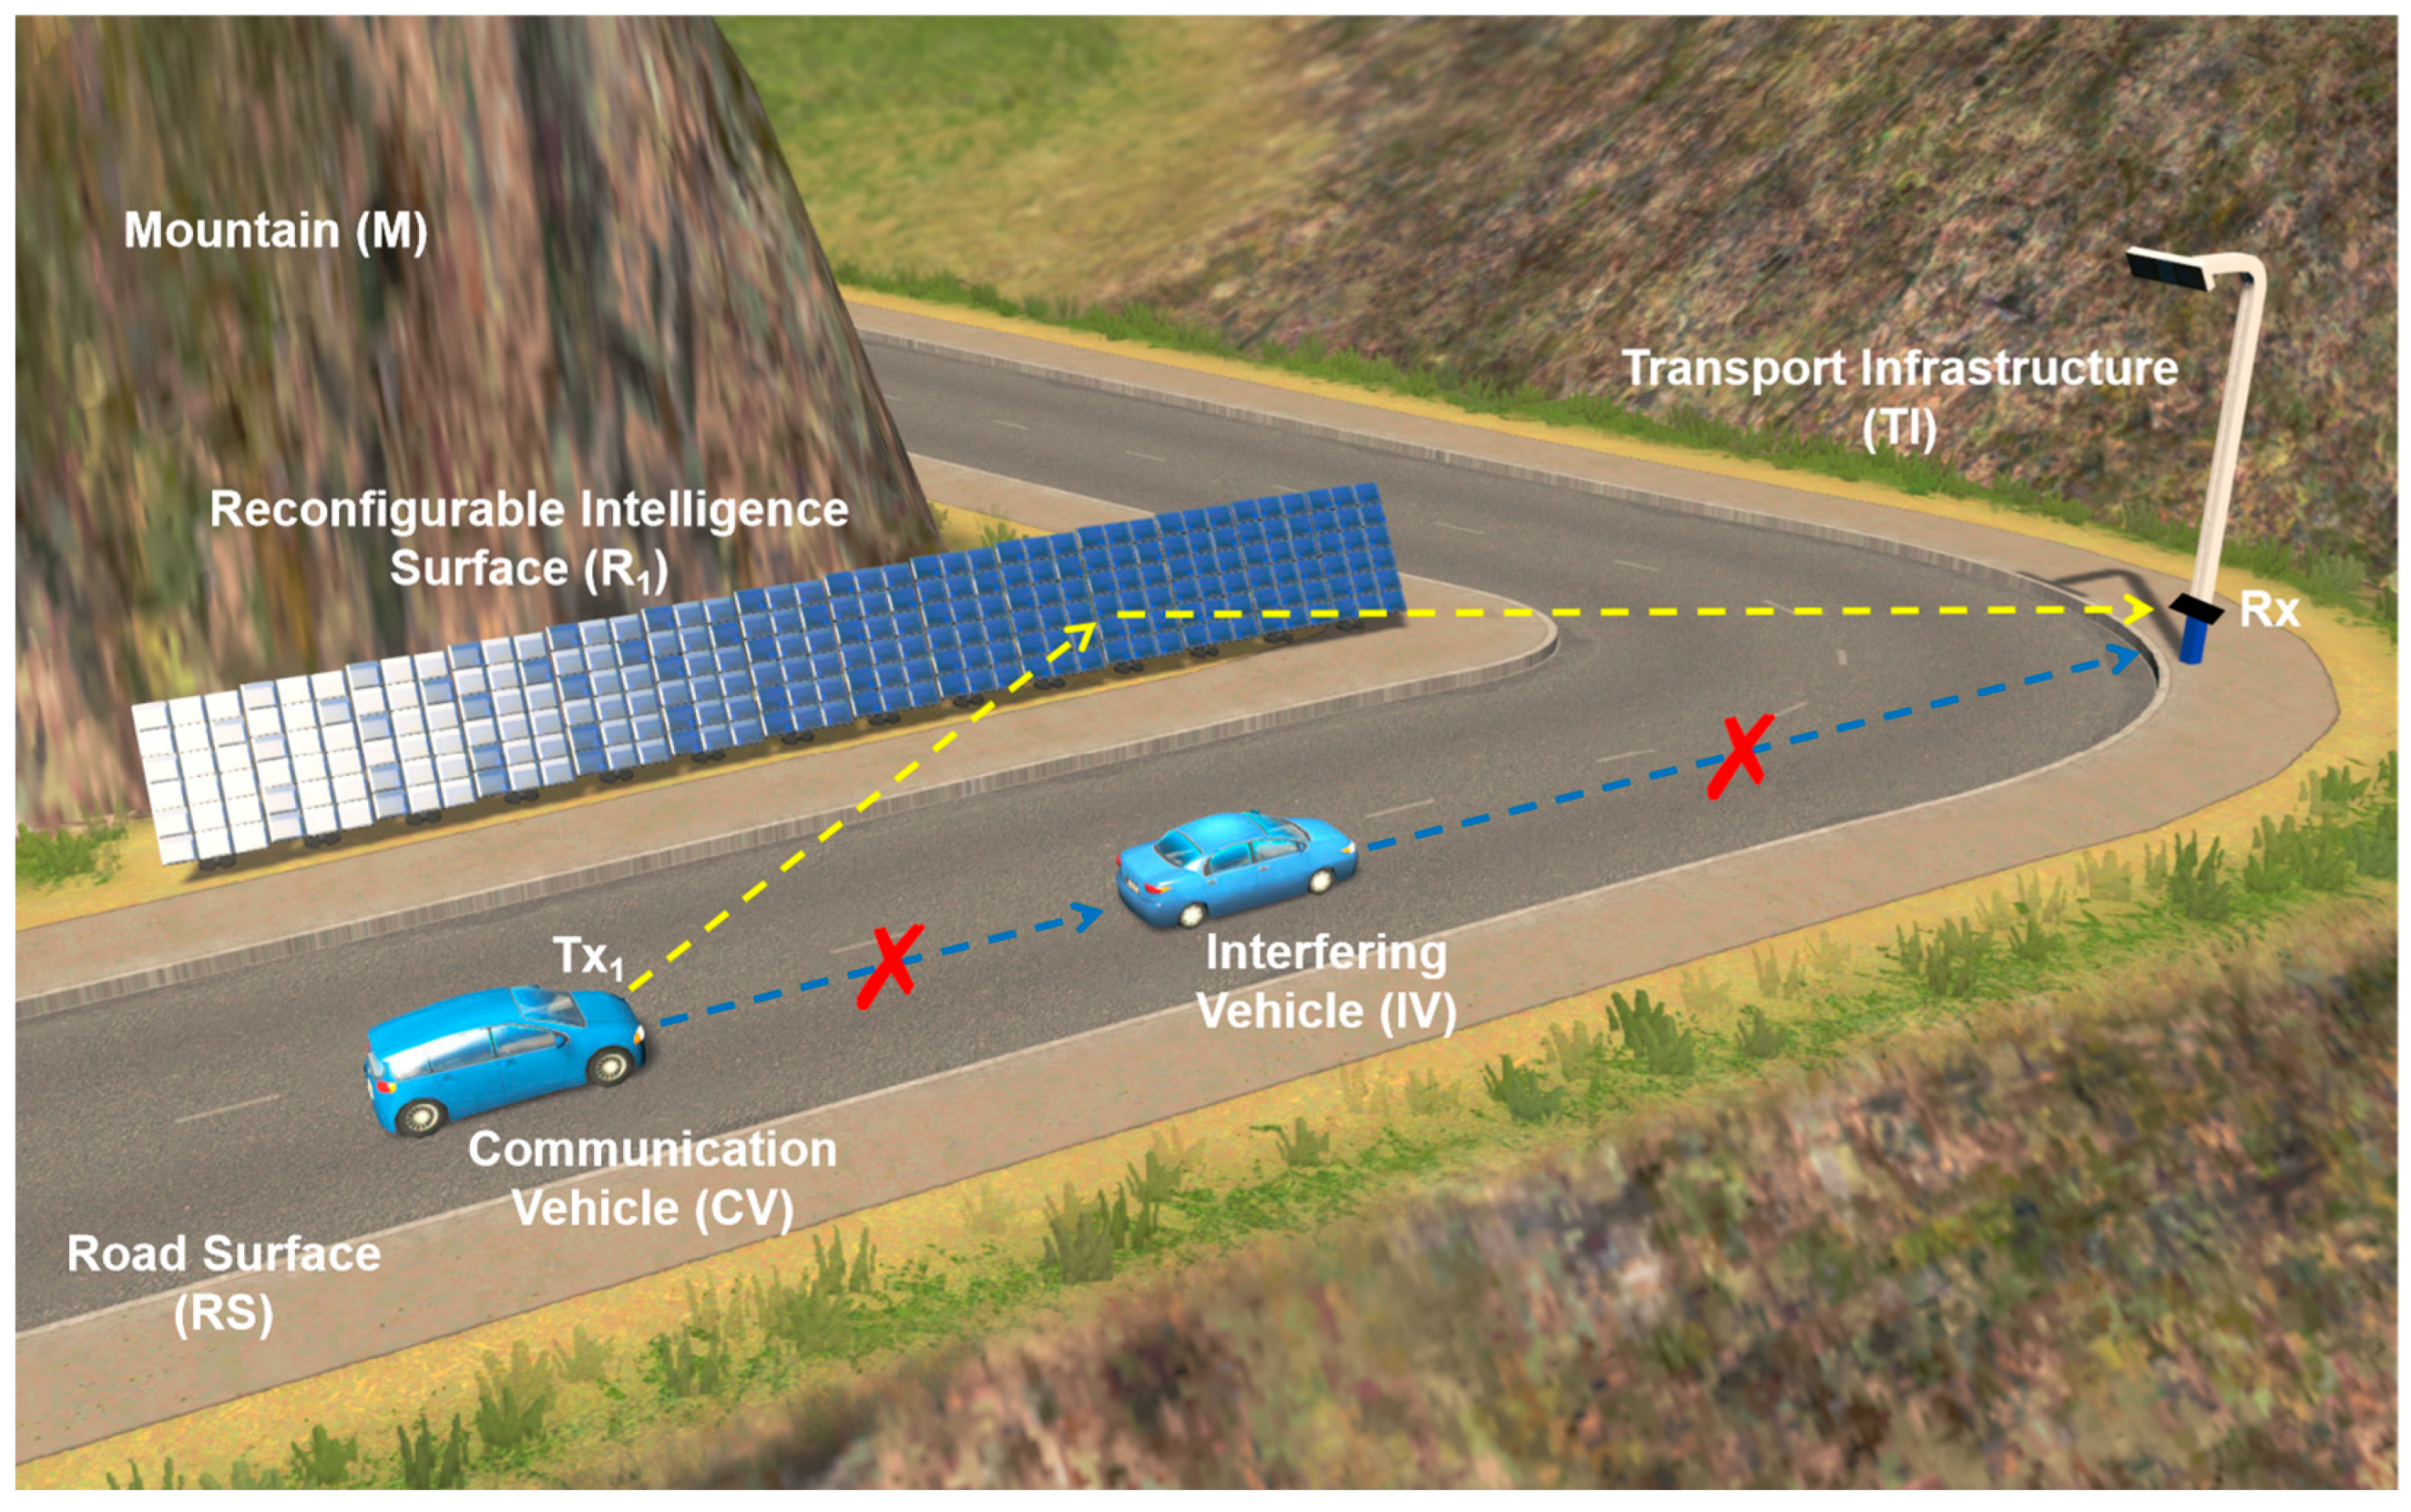
  • In order to solve the problem of the LOS link blockage caused by the mobility of vehicles in V2I–VLC systems, an optical RIS-based V2I–VLC transmission scheme is proposed. It should be noted that the interfering vehicle (IV) is located between the communication vehicle (CV) and the transportation infrastructure (TI).
  • For practical suitability, the effects of atmospheric turbulence (AT) and weather factors are taken into account in the channel modeling.
  • Based on the channel model, the closed-form expressions for the performance metrics, including average path loss, received optical power, channel capacity, and outage probability, are derived in this work.
  • Simulation results verify the accuracy of the derived theoretical expression. In addition, the performance of the system is quantitatively compared against its baseline configuration (without RIS) under identical operating conditions.
  • The results show that the RIS technique can effectively solve the link blockage problem of the V2I–VLC system and improve the system performance.

1.3. Structure

In Section 2, the system and channel model of the proposed RIS-aided V2I–VLC are presented. Section 3 models and calculates the path loss and average path loss of the proposed system. In Section 4, the closed-form expressions for system performance indicators are derived in detail, including received optical power, channel capacity, outage probability, and energy efficiency. In Section 5, the closed-form solutions and simulation results for each performance metric are shown and discussed. Furthermore, in order to analyze the advantages of introducing RIS technique in V2I–VLC systems, the performance of systems incorporating RIS versus RIS-free architectures is evaluated. Finally, Section 6 provides a summary.

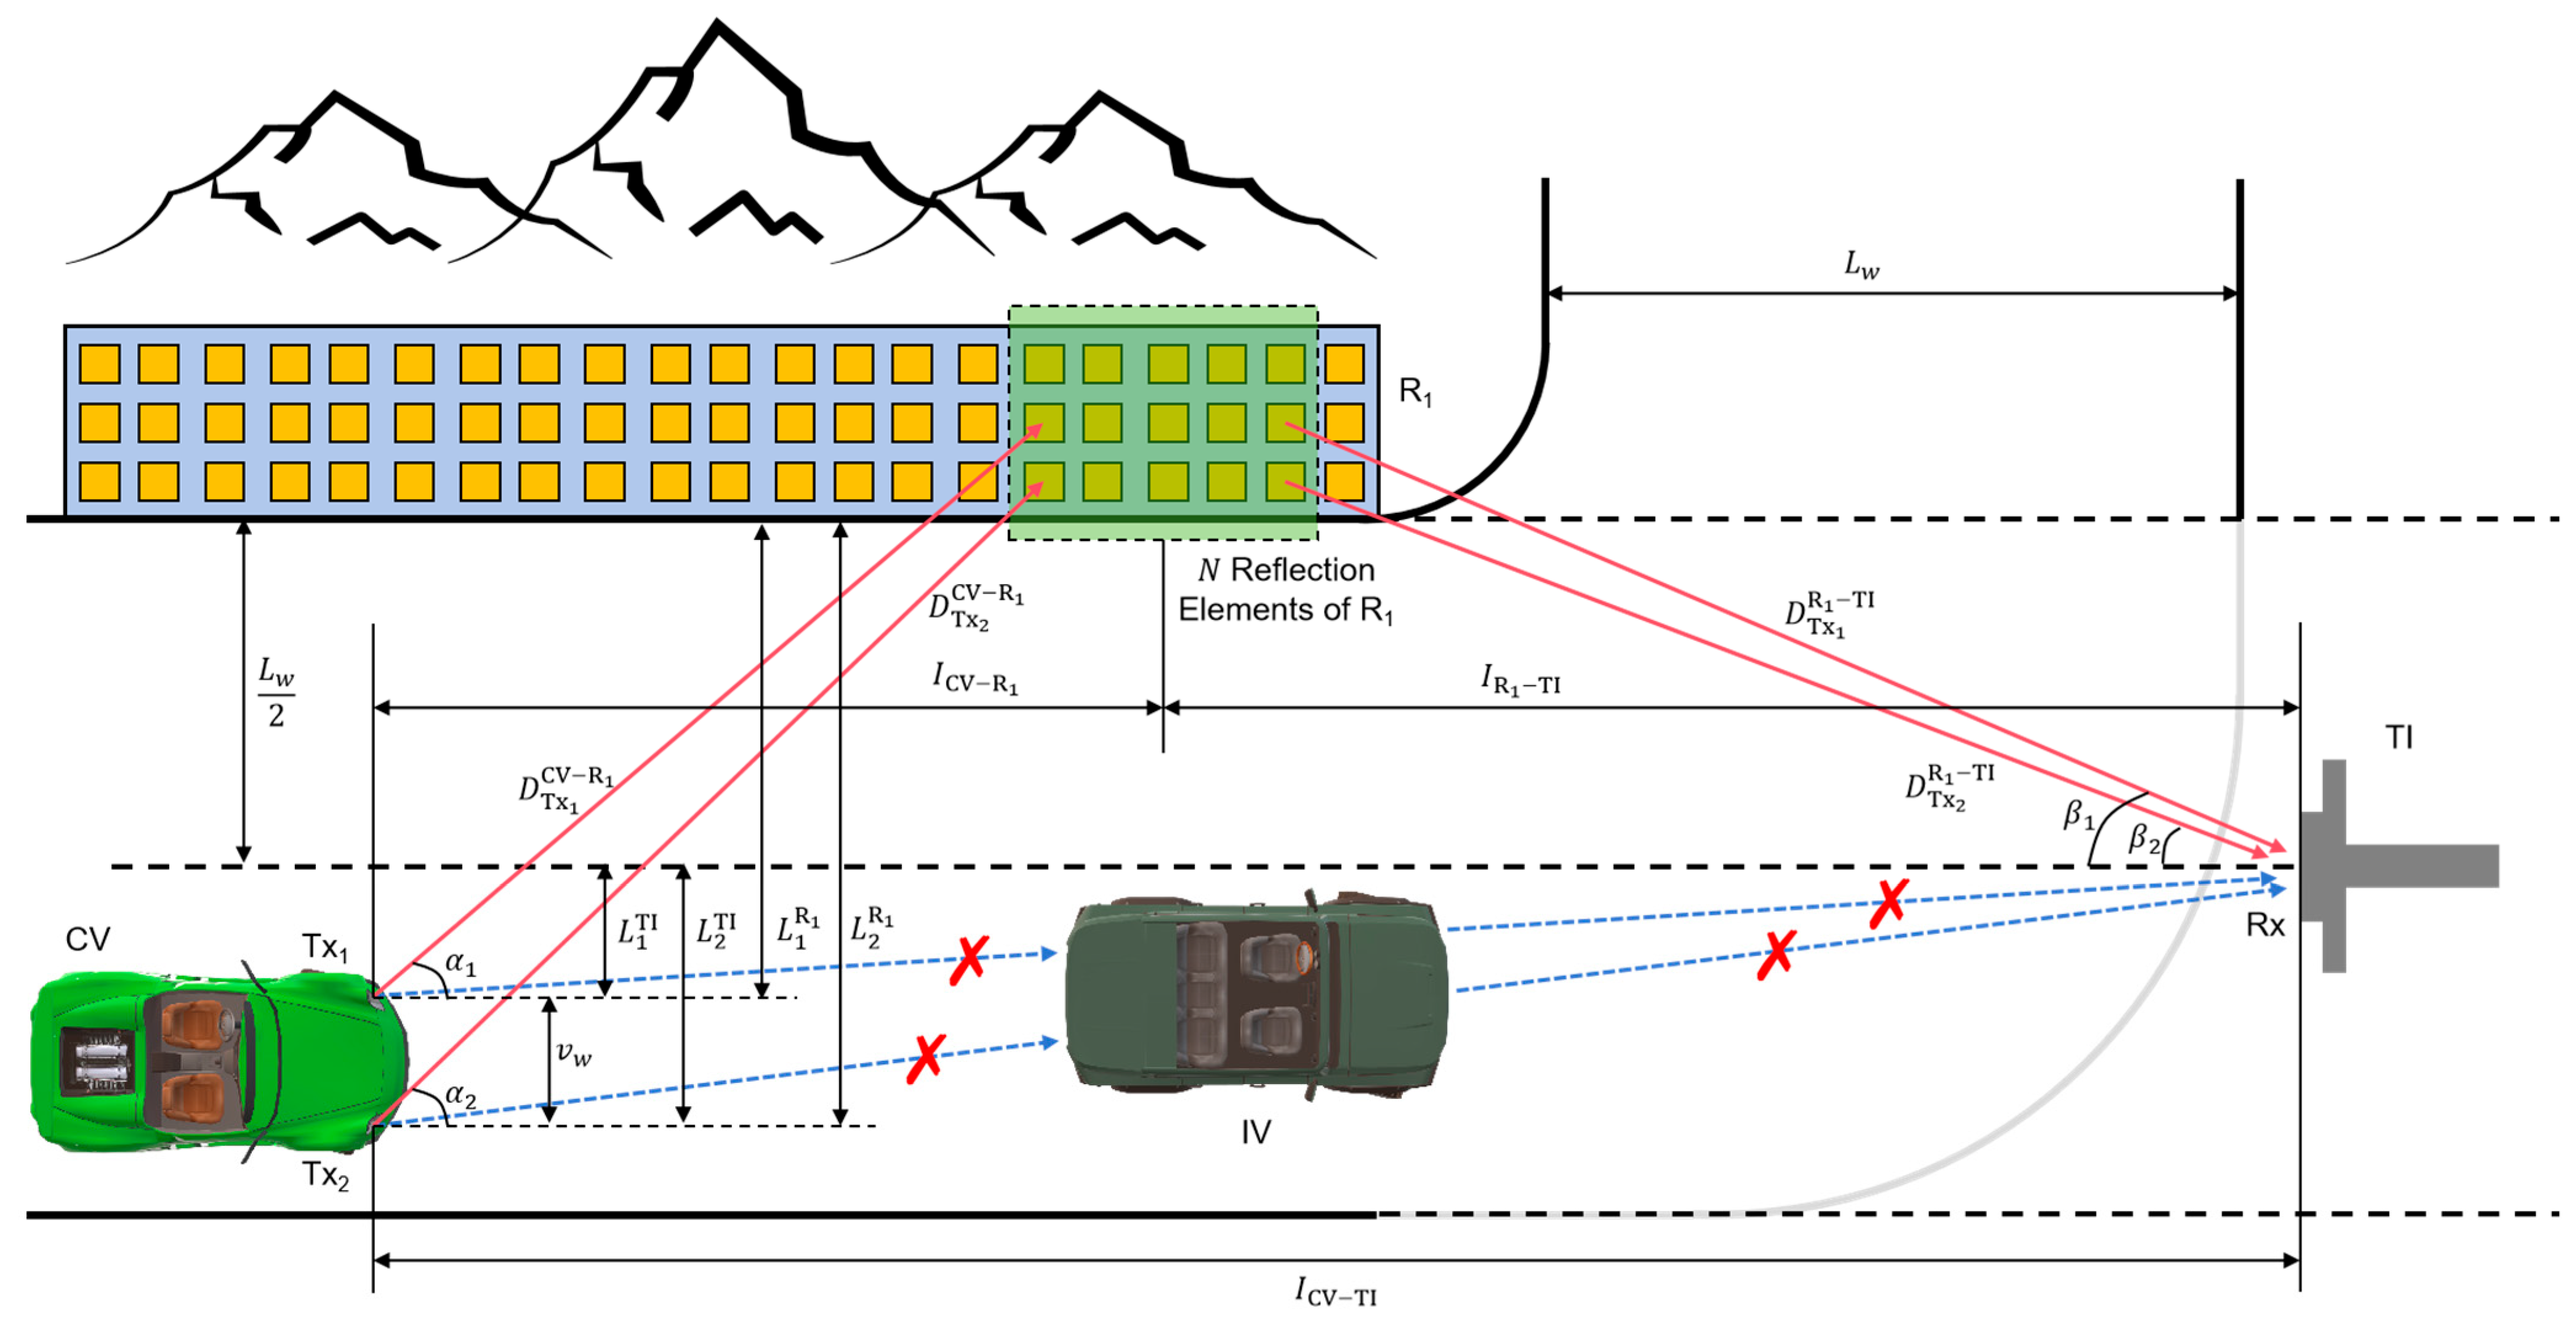
2. System and Channel Model

An RIS-aided V2I–VLC scenario for mountain roads is shown in Figure 1. The system enables communication between CV and TI on a typical mountain road. In this scenario, TI is located on the outside of the turn of the road surface (RS) and aligned with the center axis of RS. On the RS, both CV and IV are driving in the direction of TI. In addition, IV is located between CV and TI, thus blocking the LOS communication link. In order to realize the communication between CV and TI, the RIS ( R 1 ), which consists of multiple reflection elements, is deployed on the side of the RS close to the mountain (M). The two headlights of CV are used as VLC transmitters (Txs), namely Tx 1 and Tx 2 . The photodiode (PD)-based VLC receiver (Rx) deployed on the TI is used to receive optical signals. Its height is the same as Tx 1 and Tx 2 . When communicating, the data to be sent is modulated on the light emitted from Tx 1 and Tx 2 simultaneously, by means of on–off keying (OOK). The light is reflected by R 1 and then illuminates the surface of Rx. Through this process, Rx is enabled to receive the light from Tx 1 and Tx 2 , and thus the problem of the LOS link blockage can be solved.

2.1. System Model

The system model is shown in Figure 2. The figure is based on the case that CV is located on the right side of the center axis of RS (the left or right side is defined by the driver’s perspective, the same below). The vehicle width of CV is denoted as v w and the road width of RS is L w . The PD-based Rx is located outside the RS and aligned with the center axis of the RS. The visible light carrying information is emitted from LED-based Tx 1 and Tx 2 , and the angles of irradiance are denoted by α 1 and α 2 , respectively. The light illuminates R 1 and is reflected in the direction of Rx. Given the properties of RIS, consider that there are always N elements involved in reflection. In addition, R 1 is considered parallel to CV and IV. The reflected light eventually reaches Rx and illuminates the surface of PD, where the angles of incidence are β 1 and β 2 , respectively. Meanwhile, considering the properties of VLC, the light irradiated to Rx must satisfy a certain condition to be received, i.e., cos β j cos Ψ PD , where Ψ PD is the field of view (FOV) of Rx. In addition, the longitudinal distance between CV and TI is I CV TI , and the lateral displacement of the vehicle corresponding to the j t h Tx is L j TI (Take the direction of vehicle travel as the longitudinal direction, the direction of vehicle left and right movement as the lateral direction, the same below). Furthermore, the longitudinal distance between Txs and R 1 is I CV R 1 , and the longitudinal distance between R 1 and TI is I R 1 TI , thus we have I CV TI = I CV R 1 + I R 1 TI . Moreover, the lateral distance between Tx i and R 1 is L i R 1 , and the light propagation distance is D Tx i CV R 1 ( i = { 1 , 2 } ). For the link between R 1 and Rx, the propagation distances of the reflected rays from Tx 1 and Tx 2 are denoted as D Tx 1 R 1 TI and D Tx 2 R 1 TI , respectively. It should be noted that in the proposed V2I–VLC system, the movements of vehicles are considered in order to emphasize the realistic traffic environment.

2.2. Channel Model

Intensity-modulation and direct-detection (IM-DD) is widely used in VLC systems due to its significant advantages in terms of cost and reliability. Therefore, this work investigates the V2I–VLC system based on the IM-DD method. The following parameters are considered, respectively: The electro-optical conversion coefficient of Txs is ρ Tx ; the optical signal reflection coefficient of R 1 is ρ RIS ; the photoelectric conversion coefficient of Rx is ρ Rx ( ρ Tx , ρ RIS and ρ Rx are all in units of W/A). In addition, the gain of the PD-based Rx is μ d , and it is equipped with a filter with a gain of μ f and an optical lens concentrator with a gain of μ c . Unlike indoor VLC systems, outdoor VLC systems are also affected by AT. Considering the short communication distance of VLC systems, without loss of generality, the channel coefficients ( h A T ) due to AT can be modeled as a lognormal distribution [46]:
f h A T h A T = 1 2 h A T 2 π σ y 2 e ln h A T + 2 σ y 2 2 8 σ y 2 , h A T > 0 ,
where the log-intensity variance σ l 2 = 4 σ y 2 . Therefore, if Tx 1 and Tx 2 transmit signals with total electric power P e , then corresponding to the transmitted signal x , the received signal at Rx can be expressed as [40]:
y = λ s y s i = 1 2 h T x i CV R 1 T Θ h T x i R 1 TI h A T P e x + n r ,
where λ s y s is the end-to-end transceiver efficiency. Additionally, Θ = ρ RIS diag e j θ 1 , e j θ 2 , , e j θ N denotes the diagonal phase shift matrix of Rx, where N is the number of RIS elements, θ n 0 , 2 π denotes the phase shift of the n t h element and n 1 , 2 , , N . Let h T x i CV R 1 = h Tx i , 1 CV R 1 , , h Tx i , N CV R 1 and h T x i R 1 TI = h Tx i , 1 R 1 TI , , h Tx i , N R 1 TI represent the channel coefficient vectors for the CV– R 1 and R 1 –TI optical link, respectively. n r N 0 , σ n 2 is the received noise with variance σ n 2 . The noise consists of environmentally induced thermal noise (with variance σ Thermal 2 = 4 K b T F B / R L ) and shot noise (with variance σ Shot 2 = 2 q μ d F B I b ), where the parameters K b , T , F , B , R L , q and I b represent the Boltzmann constant, temperature in Kelvin, detector noise figure, bandwidth, load resistance, electron charge and background solar radiation current, respectively. Furthermore, T denotes the transpose operation of a matrix.
According to Equation (2), the total channel gain of the i t h Tx can be expressed as:
H i , T = h T x i CV R 1 T Θ h T x i R 1 TI h A T = ρ RIS n = 1 N h Tx i , n PL , CV R 1 h Tx i , n PL , R 1 TI h A T e j θ i , n ,
Let h Tx i , n PL , CV R 1 TI = h Tx i , n PL , CV R 1 h Tx i , n PL , R 1 TI represent the path loss of the CV– R 1 –TI communication link corresponding to the i t h Tx and formed by the reflection of the n t h element. Thus, the real-valued channel coefficients of the link can be expressed as h Tx i :
h Tx i = h A T h Tx i , n PL , CV R 1 TI ,
According to Equation (1), the probability density function (PDF) of h Tx i is given by:
f h Tx i h Tx i = 1 2 h Tx i 2 π σ y 2 e ln h Tx i h Tx i , n PL , CV R 1 TI + 2 σ y 2 2 8 σ y 2 , h Tx i > 0 ,

3. Path Loss

In this section, the path loss model of the proposed RIS-aided V2I–VLC system will be derived based on the system and channel model in Section 2. In addition, weather factors and some other propagation characteristics are taken into account in the modelling. Then, based on the path loss model, the closed-form expressions for the average path loss will be derived in this chapter.

3.1. Path Loss Model

The path loss of outdoor VLC systems consists of two main components, i.e., geometric loss and attenuation loss. Geometrical loss is a result of the fact that the transmitted beam spreads to a size larger than the receive aperture of PD. The geometric loss of the LOS link between Tx and Rx can be expressed as:
h g e o PL = D R cos θ 1 / ε ζ L 2 ,
where D R represents the receive aperture; θ is the irradiance angle of Tx; L is the distance between Tx and Rx; ε and ζ are two correction coefficients to take into account weather conditions and asymmetrical pattern of headlamp. In contrast, attenuation loss is a result of scattering and absorption. It is assumed that some of the scattered light may be received by the Rx after reflection. Based on the Beer–Lambert formula and the above assumptions, the attenuation loss can be expressed as:
h a t t PL = exp c L D R ζ L ε / 2 ,
where c stands for the extinction coefficient for a specific weather type; L D R ζ L ε / 2 denotes an additional term proportional to the geometrical propagation of the light source. Thus, the overall path loss of the LOS link between Tx and Rx can be expressed as:
h PL = D R cos θ 1 / ε ζ L 2 exp c L D R ζ L ε / 2 ,
For the proposed system, it can be recognized from the system model shown in Figure 2 (ignoring the dimensions of the reflection elements of RIS, etc.) that:
cos α 1 = I CV R 1 D Tx 1 CV R 1 ,
And
cos α 2 = I CV R 1 D Tx 2 CV R 1 ,
Thus, the path loss of the CV– R 1 link from Tx 1 to the n t h reflection element of R 1 can be expressed as:
h Tx 1 , n PL , CV R 1 = 1 2 A R ζ 2 I CV R 1 2 / ε D Tx 1 CV R 1 2 + 2 / ε exp c D Tx 1 CV R 1 A R ζ D Tx 1 CV R 1 ε / 2 ,
where A R denotes the area of the reflection element of R 1 . Similarly, the path loss from Tx 2 to the n t h element can be expressed as:
h Tx 2 , n PL , CV R 1 = 1 2 A R ζ 2 I CV R 1 2 / ε D Tx 2 CV R 1 2 + 2 / ε exp c D Tx 2 CV R 1 A R ζ D Tx 2 CV R 1 ε / 2 ,
For the R 1 –TI link, the path loss can be expressed as:
h Tx 1 , n PL , R 1 TI = 1 2 D R ζ 2 I R 1 TI 2 / ε D Tx 1 R 1 TI 2 + 2 / ε exp c D Tx 1 R 1 TI D R ζ D Tx 1 R 1 TI ε / 2 ,
And
h Tx 2 , n PL , R 1 TI = 1 2 D R ζ 2 I R 1 TI 2 / ε D Tx 2 R 1 TI 2 + 2 / ε exp c D Tx 2 R 1 TI D R ζ D Tx 2 R 1 TI ε / 2 ,
where h Tx 1 , n PL , R 1 TI and h Tx 2 , n PL , R 1 TI denote the path loss of the R 1 –TI link corresponding to the light emitted from Tx 1 and Tx 2 , respectively.

3.2. Average Path Loss

The path loss model in previous subsection simulates the effect of real outdoor propagation characteristics. On this basis, this subsection will investigate the dynamic V2I–VLC model, i.e., considering the mobility of CV and IV, and derive closed-form expressions for the average path loss. These considerations make the proposed RIS-aided V2I–VLC system more relevant to real traffic situations.

3.2.1. Average Path Loss of the Light Emitted from Tx 1

  • Tx 1 is located on the left side of the center axis of RS
Considering Figure 2, L 1 TI is physically restricted as 0 L 1 TI L w 2 . Since L w and v w are fixed, the lateral movement of CV cannot have instant variation within this small range. Therefore, L 1 TI can be modeled with a uniform distribution, i.e., L 1 TI u 0 , L w 2 . Further, according to L 1 R 1 = L w 2 L 1 TI , we have L 1 R 1 u 0 , L w 2 . In addition, it can be recognized from the geometrical relations shown in Figure 2 that:
D Tx 1 CV R 1 = I CV R 1 2 + L 1 R 1 2 ,
Firstly, denote the random variable D Tx 1 CV R 1 in Equation (15) by Y . Then, according to the variable transformation method, the PDF of Y can be calculated as:
Y f Y y = 2 y L w y 2 I CV R 1 2 ,
where a 1 = I CV R 1 < y b 1 = I CV R 1 2 + L w 2 4 .
Therefore, when Tx 1 is located on the left side of the center axis of RS, the average value of the path loss from Tx 1 to the n t h element of R 1 can be calculated as:
h Tx 1 , n PL , CV R 1 l e f t a v g = a 1 b 1 h Tx 1 , n PL , CV R 1 f Y y d y = A R 2 I CV R 1 2 / ε L w ζ 2 a 1 b 1 1 y 1 + 2 / ε y 2 I CV R 1 2 e c y A R ζ y ε / 2 d y
Here, since the value of ε is sufficiently small, it can be assumed that A R ζ y ε / 2 A R ζ y . Thus, Equation (17) can be calculated as:
h Tx 1 , n PL , CV R 1 l e f t a v g A R 2 I CV R 1 2 / ε L w ζ 2 e c A R ζ a 1 b 1 1 y 1 + 2 / ε y 2 I CV R 1 2 d y   = A R 2 e c A R ζ 2 L w ζ 2 I CV R 1 π Gamma 1 2 + 1 ε Beta 4 I CV R 1 2 4 I CV R 1 2 + L w 2 , 1 2 + 1 ε , 1 2 Gamma 1 + 1 ε Gamma 1 + 1 ε
where the gamma function Gamma z is defined as Γ z = 0 t z 1 e t d t . In addition, the incomplete beta function Beta z , a , b is defined as B z a , b = 0 z t a 1 1 t b 1 d t .
2.
Tx 1 is located on the right side of the center axis of RS
Similarly, L 1 TI is modeled with a uniform distribution, i.e., L 1 TI u 0 , L w 2 v w . At this point, L 1 R 1 u L w 2 , L w v w , according to L 1 R 1 = L w 2 + L 1 TI . Therefore, the PDF of random variable D Tx 1 CV R 1 can be calculated according to the variable transformation method as:
Y f Y y = 2 y L w 2 v w y 2 I CV R 1 2 ,
where a 2 = I CV R 1 2 + L w 2 4 y b 2 = I CV R 1 2 + L w v w 2 .
Therefore, when Tx 1 is located on the right side of the center axis of RS, the average value of the path loss from Tx 1 to the n t h element of R 1 can be calculated as:
h Tx 1 , n PL , CV R 1 r i g h t a v g = a 2 b 2 h Tx 1 , n PL , CV R 1 f Y y d y   = A R 2 e c A R ζ 2 L w 2 v w ζ 2 I CV R 1   π Gamma 1 2 + 1 ε Beta 4 I CV R 1 2 + L w 2 4 I CV R 1 2 + L w v w 2 , 1 2 + 1 ε , 1 2 Gamma 1 + 1 ε Gamma 1 + 1 ε
Finally, according to Equations (18) and (20), a closed-form expression for the average path loss of the CV– R 1 link corresponding to Tx 1 can be obtained as:
h Tx 1 , n PL , CV R 1 a v g = p l e f t Tx 1 h Tx 1 , n PL , CV R 1 l e f t a v g + p r i g h t Tx 1 h Tx 1 , n PL , CV R 1 r i g h t a v g   = A R 2 e c A R ζ 4 L w v w ζ 2 I CV R 1 Gamma 1 + 1 ε   2 π Gamma 1 2 + 1 ε Gamma 1 + 1 ε Beta 4 I CV R 1 2 4 I CV R 1 2 + L w 2 , 1 2 + 1 ε , 1 2   + Beta 4 I CV R 1 2 + L w 2 4 I CV R 1 2 + L w v w 2 , 1 2 + 1 ε , 1 2
where p l e f t Tx 1 and p r i g h t Tx 1 denote the probability that Tx 1 is located on the left and right side of the center axis of RS, respectively.
Then, for the average path loss of the R 1 –TI link corresponding to Tx 1 , since D Tx 1 R 1 TI = I R 1 TI 2 + L w 2 2 , a closed-form expression can be obtained from Equation (13) as:
h Tx 1 , n PL , R 1 TI a v g = D R 2 I R 1 TI 2 / ε e c D R ζ 2 ζ 2 I R 1 TI 2 + L w 2 4 1 + 1 / ε ,

3.2.2. Average Path Loss of the Light Emitted from Tx 2

In the following, the average path loss of the light emitted from Tx 2 is calculated through a similar approach as described above.
  • Tx 2 is located on the left side of the center axis of RS
In this case, L 2 R 1 u v w , L w 2 .Using Z to denote the random variable D Tx 2 CV R 1 , the PDF of Z can be calculated according to the variable transformation method as:
Z f Z z = 2 z L w 2 v w z 2 I CV R 1 2 ,
where a 3 = I CV R 1 2 + v w 2 z b 3 = I CV R 1 2 + L w 2 4 .
Thus, when Tx 2 is located on the left side of the center axis of RS, the average value of the path loss from Tx 2 to the n t h element of R 1 can be calculated as:
h Tx 2 , n PL , CV R 1 l e f t a v g = a 3 b 3 h Tx 2 , n PL , CV R 1 f Z z d z   = A R 2 e c A R ζ 2 L w 2 v w ζ 2 I CV R 1   π Gamma 1 2 + 1 ε Beta 4 I CV R 1 2 + v w 2 4 I CV R 1 2 + L w 2 , 1 2 + 1 ε , 1 2 Gamma 1 + 1 ε Gamma 1 + 1 ε
2.
Tx 2 is located on the right side of the center axis of RS
Similarly, in this case, L 2 R 1 u L w 2 , L w . Thus, the average value of the path loss from Tx 2 to the n t h element of R 1 can be calculated as:
h Tx 2 , n PL , CV R 1 r i g h t a v g = a 4 b 4 h Tx 2 , n PL , CV R 1 f Z z d z   = A R 2 e c A R ζ 2 L w ζ 2 I CV R 1   π Gamma 1 2 + 1 ε Beta 4 I CV R 1 2 + L w 2 4 I CV R 1 2 + L w 2 , 1 2 + 1 ε , 1 2 Gamma 1 + 1 ε Gamma 1 + 1 ε
where a 4 = I CV R 1 2 + L w 2 4 z b 4 = I CV R 1 2 + L w 2 .
Finally, based on Equations (24) and (25), a closed-form expression for the average path loss of the CV– R 1 link corresponding to Tx 2 can be obtained as:
h Tx 2 , n PL , CV R 1 a v g = p l e f t Tx 2 h Tx 2 , n PL , CV R 1 l e f t a v g + p r i g h t Tx 2 h Tx 2 , n PL , CV R 1 r i g h t a v g   = A R 2 e c A R ζ 4 L w v w ζ 2 I CV R 1 Gamma 1 + 1 ε   2 π Gamma 1 2 + 1 ε Gamma 1 + 1 ε Beta 4 I CV R 1 2 + v w 2 4 I CV R 1 2 + L w 2 , 1 2 + 1 ε , 1 2   + Beta 4 I CV R 1 2 + L w 2 4 I CV R 1 2 + L w 2 , 1 2 + 1 ε , 1 2
where p l e f t Tx 2 and p r i g h t Tx 2 denote the probability that Tx 2 is located on the left and right side of the center axis of RS, respectively.
Then, for the average path loss of the R 1 –TI link corresponding to Tx 2 , since D Tx 2 R 1 TI = I R 1 TI 2 + L w 2 2 , a closed-form expression for the average path loss can be obtained from Equation (14) as:
h Tx 2 , n PL , R 1 TI a v g = D R 2 I R 1 TI 2 / ε e c D R ζ 2 ζ 2 I R 1 TI 2 + L w 2 4 1 + 1 / ε ,
Thus, according to Equations (22) and (27), define h n PL , R 1 TI a v g as:
h n PL , R 1 TI a v g h Tx 1 , n PL , R 1 TI a v g = h Tx 2 , n PL , R 1 TI a v g = D R 2 I R 1 TI 2 / ε e c D R ζ 2 ζ 2 I R 1 TI 2 + L w 2 4 1 + 1 / ε ,
In summary, for the overall CV– R 1 –TI link, since h Tx i , n PL , CV R 1 TI = h Tx i , n PL , CV R 1 h Tx i , n PL , R 1 TI , a closed-form expression for the average path loss of the proposed RIS-aided V2I–VLC system can be calculated as:
h PL CV R 1 TI a v g = N h Tx 1 , n PL , CV R 1 a v g + h Tx 2 , n PL , CV R 1 a v g h n PL , R 1 TI a v g ,

4. Performance Indicators

4.1. Received Optical Power

In VLC systems, received optical power plays an important role in system performance. For the proposed VLC system, the received optical power is the power of the light from Txs received by the PD-based Rx. Considering Equation (2), x denotes the transmitted OOK symbol in the IM-DD method and y is the received signal at Rx. Therefore, the received optical power via the CV– R 1 –TI link can be expressed as:
P r = i = 1 2 H i , T P t , i + P L , i = ρ RIS P e + P L h PL CV R 1 TI a v g h A T ,
where P e is the total power of the transmitted information signal, and P L denotes the direct-current (DC) power required for the lighting.

4.2. Signal-to-Noise Ratio and Channel Capacity

Signal-to-noise ratio (SNR) is an important indicator for evaluating the performance of VLC systems. In the proposed VLC system, consider that there are always N reflector elements of R 1 optimally aligned with the left and right headlights of the CV, i.e., Tx 1 and Tx 2 . Thus, the end-to-end SNR of the system can be expressed as:
SNR CV R 1 TI = σ s 2 σ n 2 = λ s y s 2 i = 1 2 N ρ RIS h Tx i , n PL , CV R 1 h Tx i , n PL , R 1 TI h A T P t , i 2 4 K b T F B / R L + 2 q μ d F B I b = λ s y s 2 ρ RIS 2 h PL CV R 1 TI a v g h A T P e 2 4 4 K b T F B / R L + 2 q μ d F B I b
where σ s 2 and σ n 2 denote the signal variance and noise variance, respectively.
Channel capacity refers to the maximum data transmission rate that a communication system can achieve. In short-distance and free-space optical communications using the IM-DD method, the average and peak intensities of the transmitted signals are limited [47]. Thus, under the high SNR condition, by ignoring the gap between the exact value and the lower limit value of the channel capacity [48], a closed-form expression of the channel capacity can be obtained as:
C = B 2 ln 2 ln 1 + e SNR CV R 1 TI 2 π = B 2 log 2 1 + e λ s y s 2 ρ RIS 2 h PL CV R 1 TI a v g h A T P e 2 8 π 4 K b T F B / R L + 2 q μ d F B I b

4.3. Outage Probability

Outage probability is a key indicator of the reliability and stability of a communication system. An outage occurs when the SNR corresponding to all the communication links falls below a certain threshold SNR.
For the proposed system, define K SNR as:
K SNR = λ s y s 2 ρ RIS 2 P e 2 4 4 K b T F B / R L + 2 q μ d F B I b ,
Thus, according to Equations (31) and (33), SNR CV R 1 TI in Equation (32) can be expressed as:
SNR CV R 1 TI = K SNR h PL CV R 1 TI a v g h A T 2 ,
Based on the definition of outage probability and the threshold data transfer rate C t h , the threshold SNR can be expressed as:
SNR t h CV R 1 TI = π e e 2 C t h ln 2 B 1 ,
Then, the outage probability can be calculated as:
P o u t = i = 1 2 0 SNR t h CV R 1 TI K SNR f h Tx i h Tx i d h Tx i ,
Accordingly, by applying the variable transformation method to simplify Equation (36), a closed-form expression of the outage probability can be obtained as:
P o u t = i = 1 2 Q ln SNR t h CV R 1 TI 4 K b T F B / R L + 2 q μ d F B I b λ s y s ρ RIS P t , i h PL CV R 1 TI a v g 2 σ y ,
where Q is the Gaussian Q-function and defined as Q x = 1 2 π x e t 2 2 d t .

4.4. Energy Efficiency

Currently, the significant characteristic of mobile communications is the coexistence of multiple generations of technology. Different generations of mobile communication systems utilize different spectrums and run diverse services. Therefore, greater demands are made on sustainable development. The deployment, operation, monitoring, and management of new networks and services should be economical, energy efficient, and simple and contribute to the sustainable development goal (SDG) of the whole society. Thus, energy efficiency is also a key performance indicator in VLC systems.
In RIS-aided VLC systems, the number of reflection elements is one of the most significant factors affecting energy efficiency. Therefore, for the proposed RIS-aided V2I–VLC system, it is necessary to derive a closed-form expression for N when the targeted energy efficiency η t h is satisfied.
In the RIS-aided VLC system, the energy efficiency η e signifies the ratio of total channel capacity C to the total power consumption P T , and is given by:
η e = C P T C P e + P L + P C + N P RIS ,
where P e is the total power of the transmitted information signal, and P L denotes the DC power required for the illumination of the vehicle headlights. In addition, P C is the power consumed by the Tx and Rx circuits for transmitting and receiving signals, and P RIS is the power consumed by each RIS reflection element.
Define the following variables: z 1 = B / 2 , z 2 = P e + P L + P C , z 3 = 2 π 4 K b T F B / R L + 2 q μ d F B I b and z 4 = λ s y s 2 i = 1 2 ρ RIS h Tx i , n PL , CV R 1 h Tx i , n PL , R 1 TI P t , i 2 . By substituting z 1 , z 2 , z 3 and z 4 into Equation (38) and simplifying, a inequality can be obtained as:
η e z 2 ln 2 z 1 + η e P RIS ln 2 z 1 N ln e N 2 z 4 z 3 ,
Then, taking the exponential of Equation (39), and after manipulating, the following inequality can be obtained:
N e η e P RIS ln 2 z 1 N z 3 e z 4 e η e z 2 ln 2 z 1 ,
Multiplying the values on both sides of Equation (40) by η e P RIS ln 2 z 1 , the inequality can be written as:
η e P RIS ln 2 z 1 N e η e P RIS ln 2 z 1 N z 3 η e P RIS ln 2 e z 1 z 4 e η e z 2 ln 2 z 1 ,
Let m = η e P RIS ln 2 z 1 N , Equation (41) can be expressed in the form of:
m e m z 3 η e P RIS ln 2 e z 1 z 4 e η e z 2 ln 2 z 1 ,
Since the inverse function of the function x e x is the Lambert W function, i.e., W x , Equation (42) can be rewritten as:
m W z 3 η e P RIS ln 2 e z 1 z 4 e η e z 2 ln 2 z 1 ,
Thus, corresponding to a targeted energy efficiency η t h , a lower-bound of the required number N of RIS reflection elements is given by:
N B 2 η t h P RIS ln 2 W 16 π 4 K b T F B / R L + 2 q μ d F B I b η t h P RIS ln 2 e B λ s y s 2 ρ RIS 2 P e 2 h PL CV R 1 TI a v g 2 e 2 η t h P e + P L + P C ln 2 B

5. Simulation Results and Discussions

In this section, numerical simulation results are presented to validate the accuracy of the derived theoretical expression and evaluate the effectiveness of the RIS-aided V2I–VLC system. Since weather conditions have a significant impact on outdoor V2I–VLC systems, they are important factors to be considered in performance analysis. The values of the parameters related to weather conditions are shown in Table 1.
In the simulation, the corresponding parameter settings are shown in Table 2. Please note that for the simulations, there are 10 6 channel realizations considered corresponding to each value of I CV TI . In addition, the system is in a 25 °C environment. Moreover, the typical −3 dB bandwidth of commercial LEDs is a few MHz to a few tens of MHz (e.g., about 3–5 MHz for phosphor white LEDs and about 20–50 MHz for RGB LEDs); therefore, in the simulation and calculation process of this work, the system bandwidth is considered to be 10 MHz, which falls within the bandwidth of commercial LEDs.

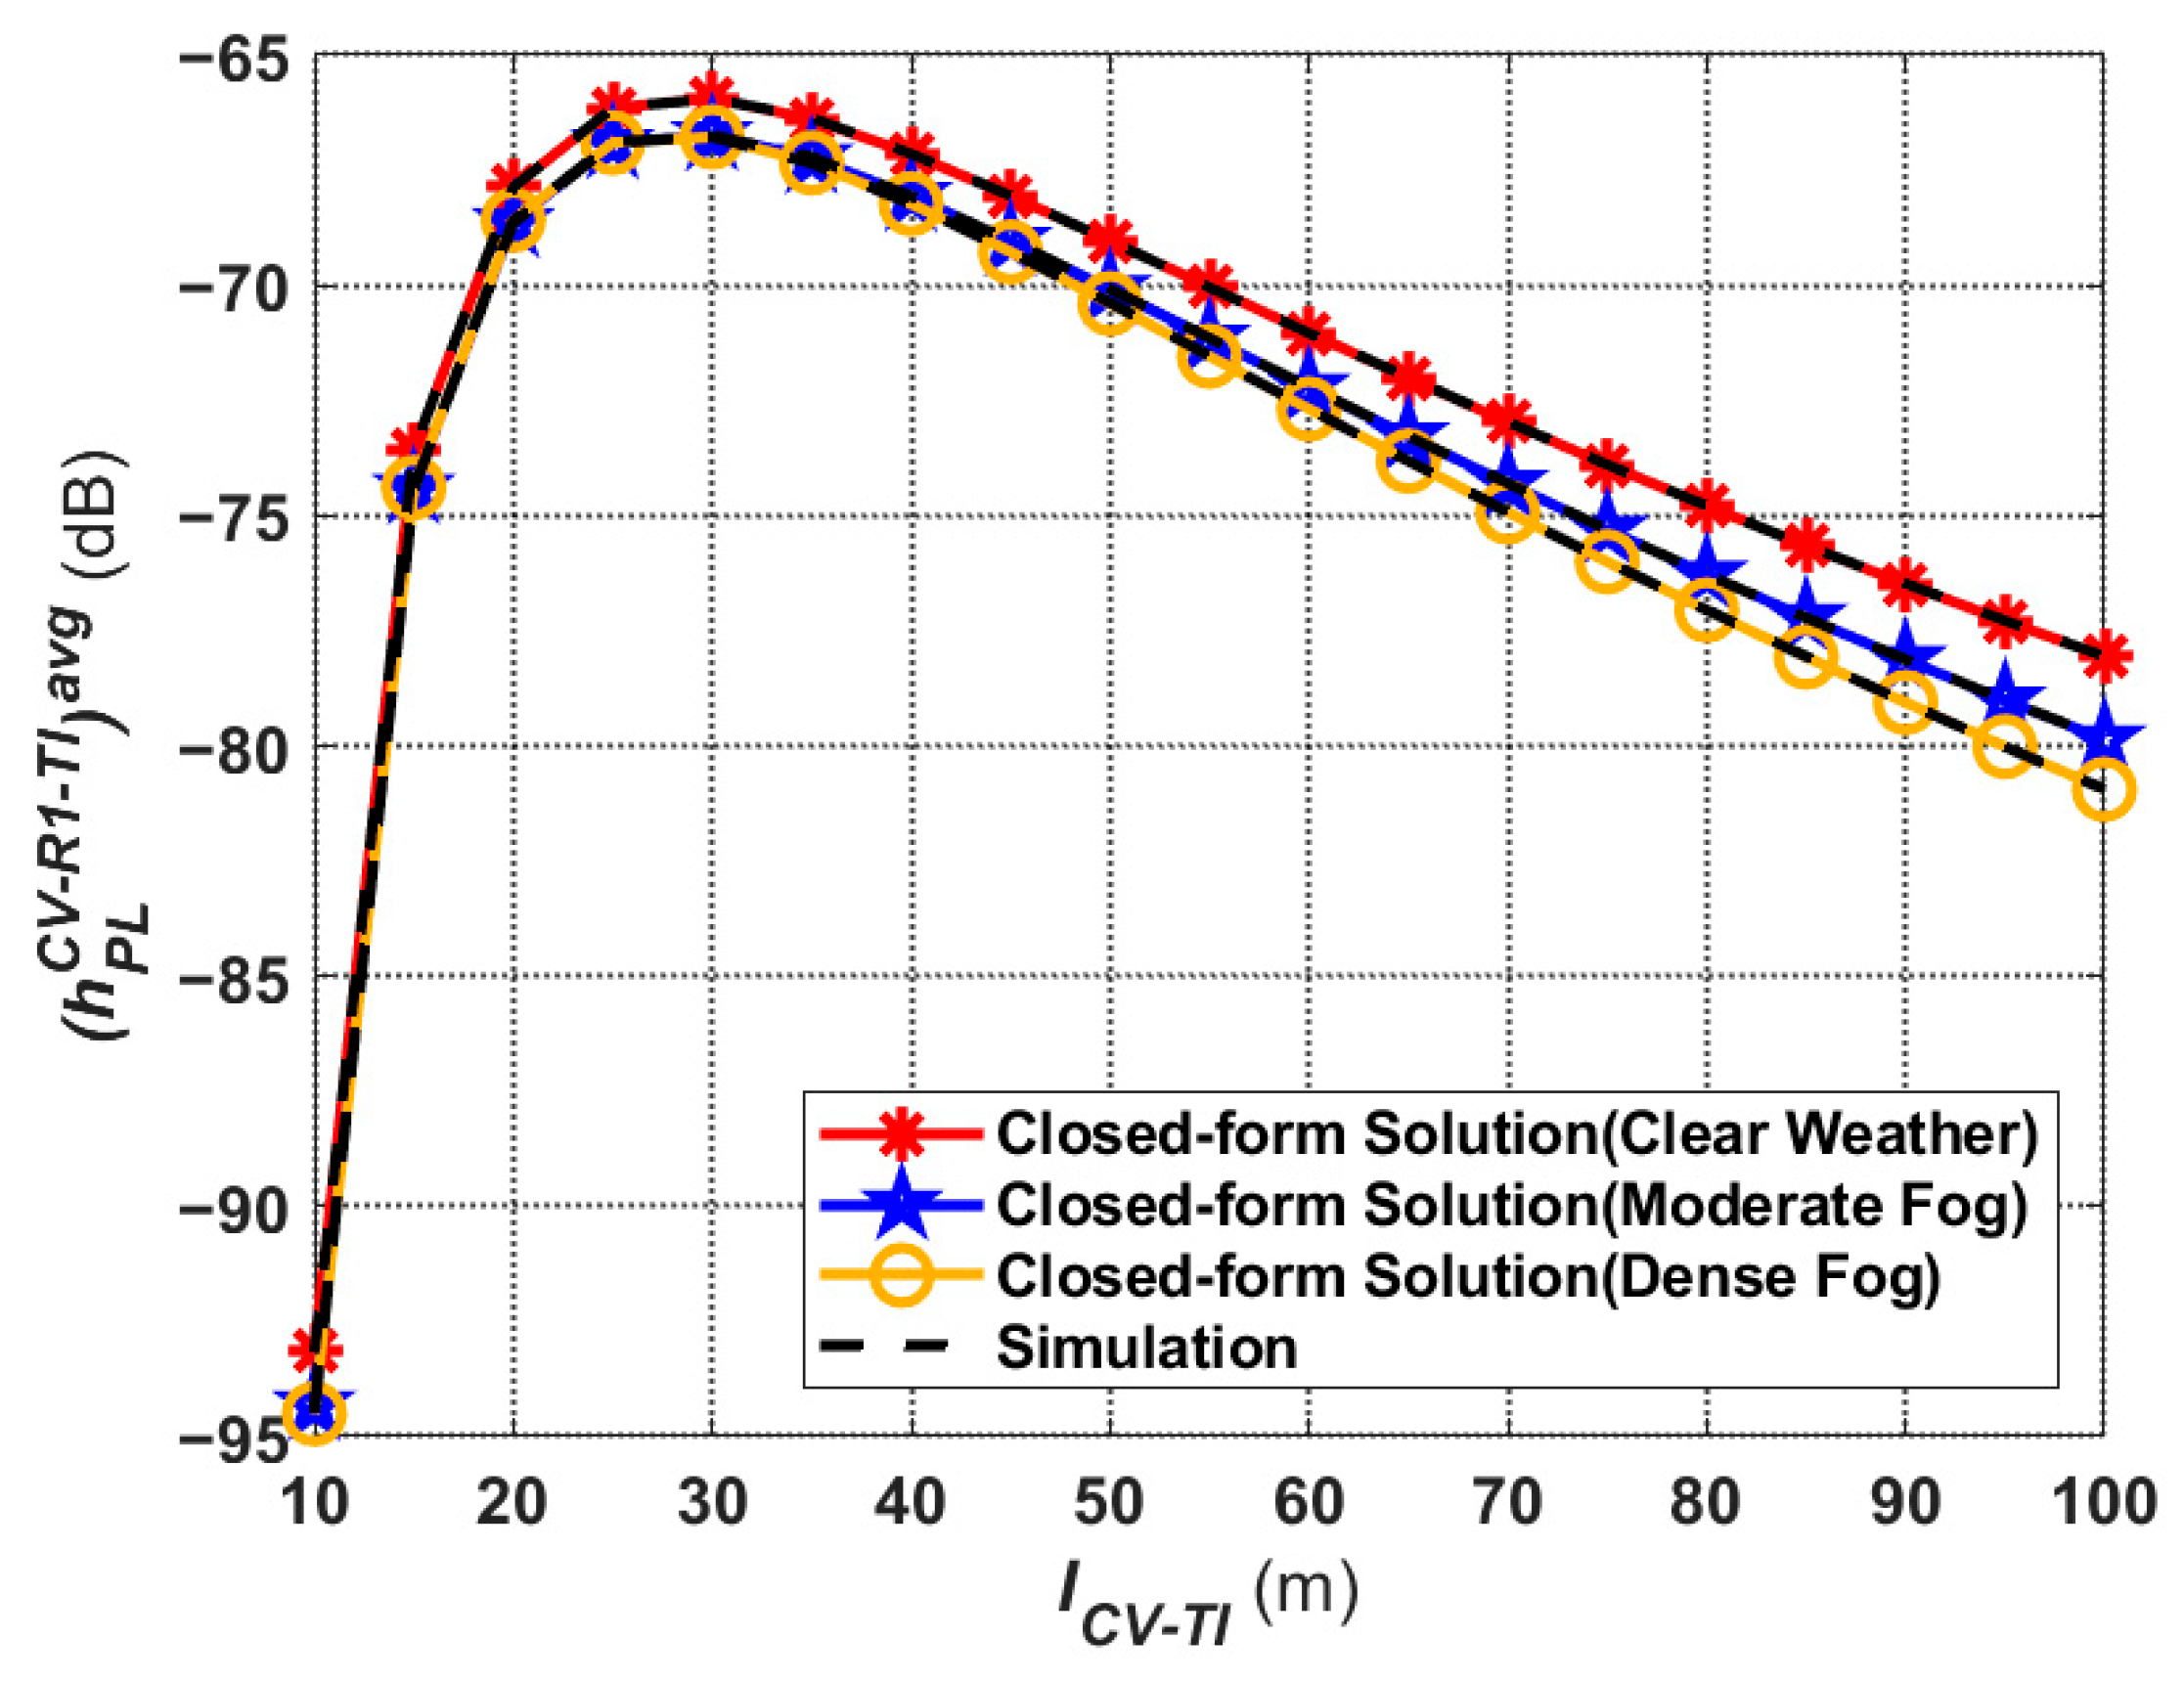
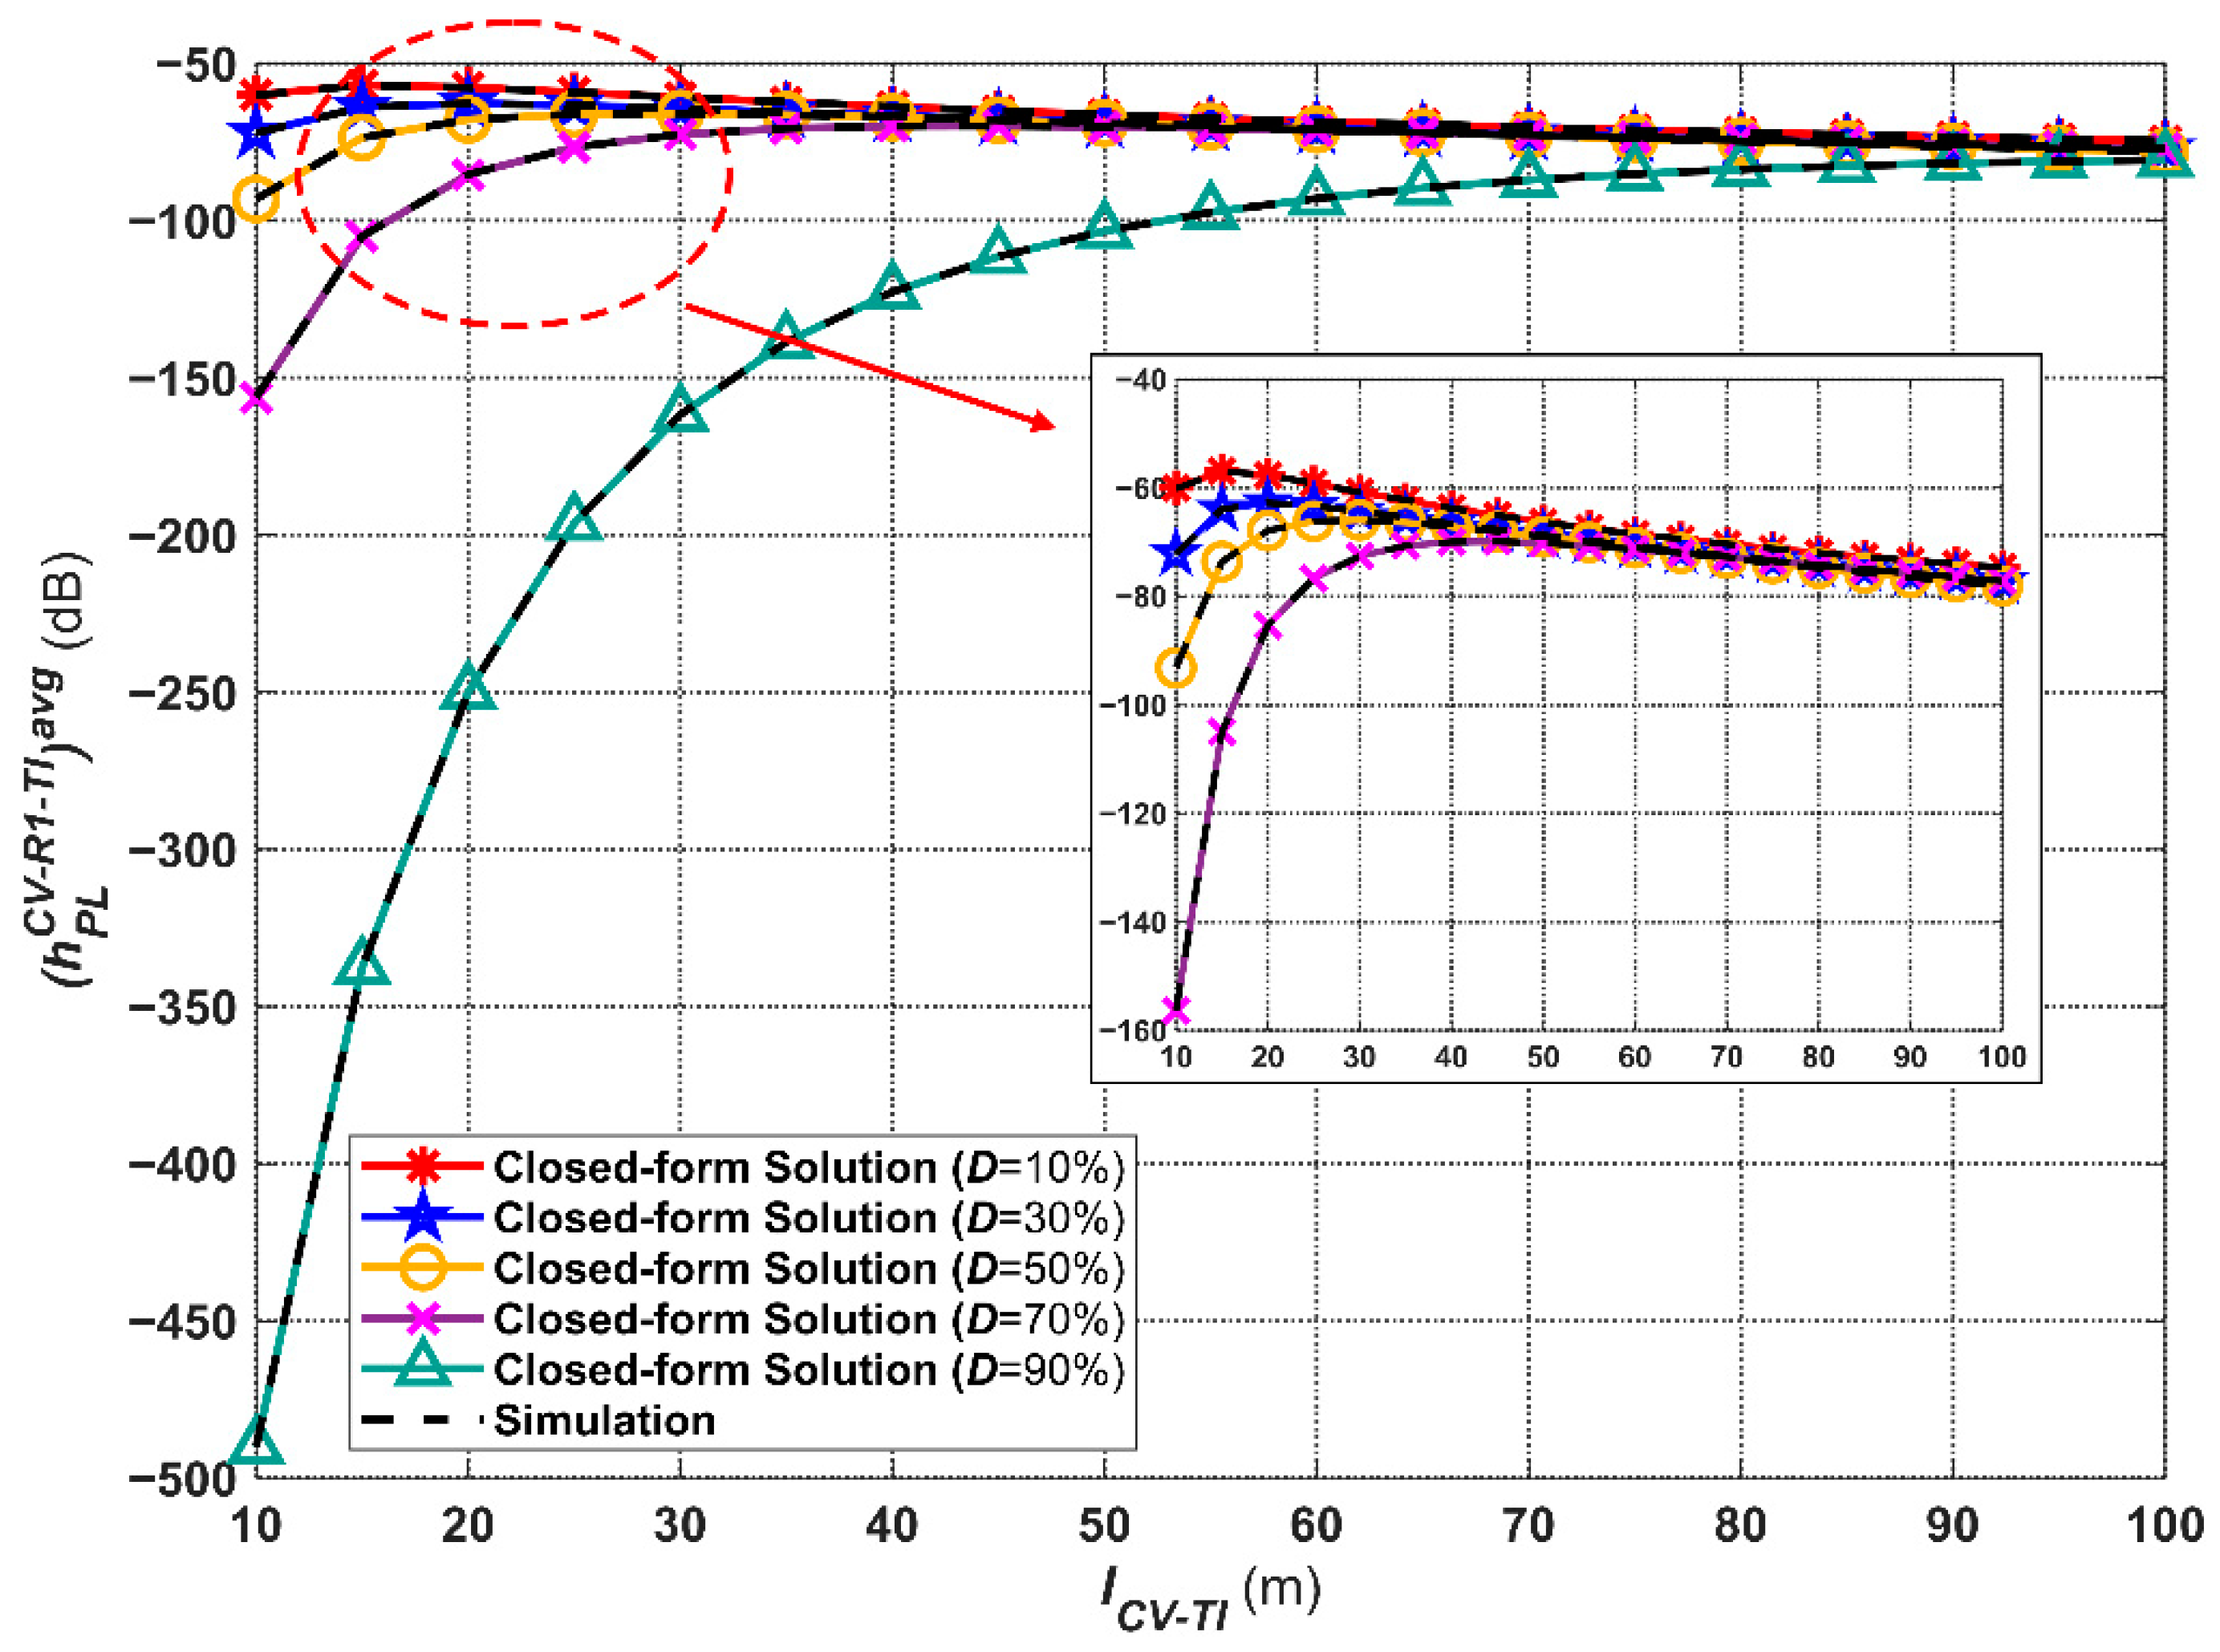
5.1. Average Path Loss

The path loss characteristics of the proposed system are quantified in this subsection. According to the closed-form expression derived in Equation (29), the average path loss under different longitudinal distance I CV TI between CV and TI is demonstrated in Figure 3. It is assumed that I CV R 1 = I R 1 TI and N = 1000 . It is worth noting that the negative sign (−) in the path loss values only indicates the loss in the form of a path loss penalty. The smaller the absolute value of the path loss, the smaller the penalty and the better the indicated performance. It can be seen from Figure 3 that the average path loss decreases rapidly and then increases gradually within the considered scope of I CV TI , both in clear and foggy weather. Meanwhile, the average path loss is minimized at I CV TI = 30   m under different weather conditions, and the values are about 65.93 dB, 67.23 dB, and 67.33 dB, respectively. It can also be observed that the maximum average path loss occurs at I CV TI = 10   m . This may be explained that, at that point, CV is much closer to R 1 , and the angles of irradiance of Txs ( α 1 and α 2 ) are much larger, thus a large amount of light scatters to other places instead of the reflection elements of R 1 . But with the increase in I CV TI , angles of irradiance become smaller, and more light will shine on the elements of R 1 , thus the average path loss decreases rapidly. However, when I CV TI is within the range of 30–100 m, the effect of distance becomes dominant, leading to a progressive increase in the average path loss. In addition, it can be observed from Figure 3 that the farther the propagation distance of light, the more significant the influence of weather factors. For example, when I CV TI = 30   m , the path loss under dense fog conditions is 1.4 dB higher than that under clear weather conditions, while when I CV TI = 100   m , the difference is 2.9 dB. Therefore, when the propagation distance of light is relatively long, the worse the weather conditions, the worse the performance of the system in terms of path loss. The results of the simulation agree with the results from theory.
To illustrate the impact of the deployment location of R 1 on system performance, a distance weight D is introduced to quantify the percentage of I CV R 1 to I CV TI . For example, D = 30 % means I CV R 1 = 0.3 I CV TI , and D = 50 % means I CV R 1 = I R 1 TI = 0.5 I CV TI . Taking clear weather conditions as an example, Figure 4 depicts the average path loss for different transmission distance I CV TI and distance weight D , incorporating simulation results and theoretical findings. As shown in Figure 4, the average path loss exhibits a progressive deterioration with increasing D . Especially, when D = 90 % , the average path loss is up to 490 dB at I CV TI = 10   m . The results indicate that when R 1 is deployed much closer to TI, the average path loss will be worse. To reveal more details, the curves excluding D = 90 % are displayed in the inset of Figure 4. It can be noticed that the curves of average path loss under different D have the same trend as the results shown in Figure 3. It is worth noting that when I CV TI is larger than 60 m, the four curves are almost close to each other. The results illustrate that when the CV is relatively close to the TI, the deployment location of R 1 has a significant impact on the system performance. But when the CV is relatively far away from TI, the effect of the deployment location is negligible, and the system is mainly affected by the total propagation distance. Based on the above analysis, in the subsequent studies, let D = 50 % .
In this work, the problem of the LOS link blockage caused by the mobility of vehicles is solved by deploying RIS. Thus, to fully demonstrate the impact of RIS on the performance of the outdoor V2I–VLC system, Figure 5 provides a quantitative comparison of the system deployed with RIS in this work and the system without RIS in the previous work [5]. The upper three curves are the results of the average path loss of the light reflected by the RIS under different weather conditions, while the lower three curves are the results of the light reflected directly by the mountain. It is obvious that when the LOS link blockage occurs, the performance of the RIS-aided V2I–VLC system in terms of path loss is better than that of the RIS-free system under all weather conditions, and the performance is improved by more than 23.5% on average. The results can suggest that the introduction of RIS in outdoor V2I–VLC systems not only solves the problem of LOS link blockage but also reduces path loss and improves system performance.

5.2. Received Optical Power

Based on Equation (30), Figure 6 depicts the total received optical power versus the longitudinal distance I CV TI under different weather conditions. In addition, numerical simulation results are also shown in the figure. The figure illustrates that for the same values of I CV TI , the total received optical power is maximum in clear weather and minimum in dense fog. In addition, the farther the distance between CV and TI, the larger the total light propagation distance is, and the greater the effect of weather factors on the received optical power. For example, when I CV TI = 30   m , the total received optical power under dense fog conditions is about 13.69% lower than that under clear weather conditions. However, when I CV TI = 100   m , the received optical power is 8.0 × 10 7   W under clear weather and 4.1 × 10 7   W under dense fog conditions, i.e., the difference is up to 48.75%.

5.3. Channel Capacity

According to Equation (32), curves of channel capacity (maximum data rate) with I CV TI are shown in Figure 7, and the accuracy of the closed-form expression is verified by simulation. First, Equation (32) indicates that channel capacity and the average path loss are highly correlated. This can also be seen from Figure 3 and Figure 7, i.e., channel capacity and the average path loss exhibit similar trends with respect to the distance I CV TI . Second, in clear weather, performance of channel capacity is better than that in foggy weather because of the smaller average path loss. More importantly, as the distance between CV and TI increases, the weather factor has an ever-growing impact on channel capacity. For example, when I CV TI = 30   m , channel capacity reaches its maximum value for different weather conditions, which are 86.4 Mb/s, 83.7 Mb/s, and 83.6 Mb/s, respectively. And at that point, the channel capacity under clear weather conditions is 3.23% and 3.35% higher than that under moderate and dense fog conditions, respectively. However, when I CV TI = 100   m , the clear weather condition exhibits 14.68% and 25.96% higher channel capacity compared to moderate and dense fog scenarios, respectively.

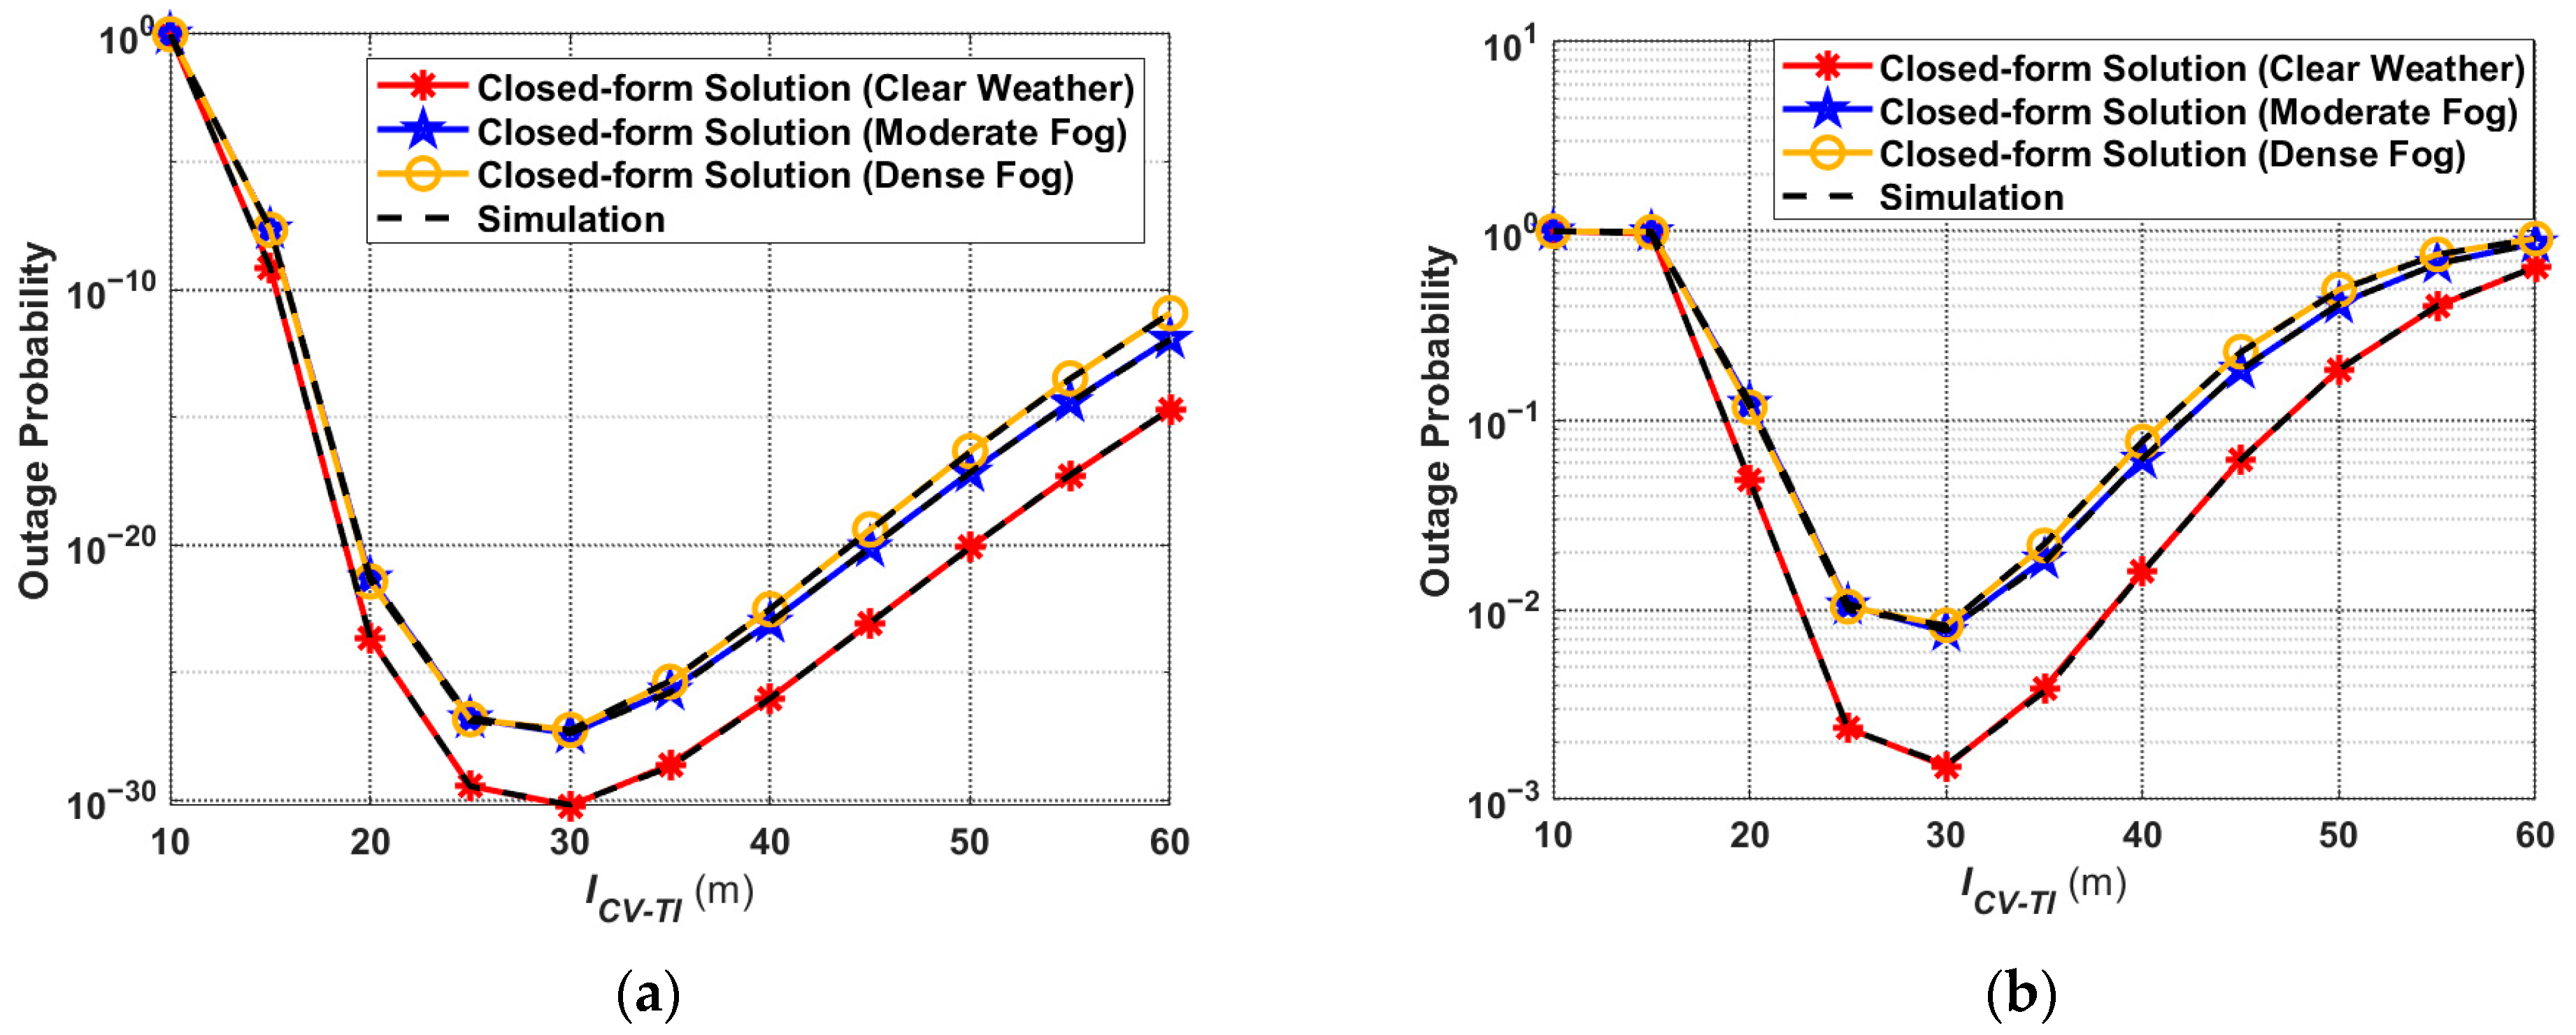
5.4. Outage Probability

It can be inferred from Equation (37) that the outage probability is highly correlated with SNR t h CV R 1 TI . Further, SNR t h CV R 1 TI is a function with respect to the threshold data transmission rate C t h . Therefore, the value of C t h has a significant impact on the outage performance of this system. Figure 8 shows the outage probability versus the distance I CV TI at two different C t h , i.e., C t h = 50   Mb / s and C t h = 70   Mb / s . It can be observed that the outage performance is better in clear weather as compared to foggy weather, while the outage performance under medium and dense fog is comparable. Moreover, as the transmission distance increases, the outage probability shows a tendency to decrease and then increase and reaches a minimum when I CV TI is about 30 m. On the other hand, comparing Figure 8a,b, it can be observed that under the same weather conditions and transmission distance, the larger the value of C t h , the higher the outage probability. For example, under moderate fog conditions, the outage probability is about 7.0 × 10 18 at I CV TI = 50   m and C t h = 50   Mb / s , while at I CV TI = 50   m and C t h = 70   Mb / s , the value is up to about 0.4.

5.5. Energy Efficiency

Figure 9 demonstrates the number N of RIS elements required to attain a targeted energy efficiency η t h versus the distance I CV TI . Here, η t h = 2   Mbps / Joule . The accuracy of Equation (44) is confirmed by the simulation results. Moreover, it can be observed that as I CV TI increases, the value of N shows a trend of sharp decrease and then slow increase, which is consistent with the trend of the average path loss value shown in Figure 3. The reason is that larger path loss results in smaller received optical power and SNR; thus, more RIS reflection elements are needed to maintain the target energy efficiency. In addition, compared to foggy weather conditions, the number N is smaller under clear weather conditions. Especially, with the increase in I CV TI , the advantage will be more significant. Furthermore, the light transmission distance has a greater effect on N than the weather conditions. As an example, under clear weather conditions, the value of N is 1144 when I CV TI = 10   m , and 130 when I CV TI = 30   m .

5.6. Summary of Discussions

Summarizing the simulation results and discussions in this section, the results of this work provide an important theoretical foundation and reference value for the design of V2I–VLC systems applied to mountain road transportation, which can be summarized as follows:
  • In V2I–VLC communication scenarios for mountain road transportation, deploying RISs can effectively solve the key challenge of the LOS link blockage due to the mobility of vehicles.
  • The received optical power, channel capacity, outage probability and energy efficiency of this system are highly correlated with the average path loss. Therefore, the system performance can be improved by reducing the system path loss.
  • The influence of weather conditions can be concluded as: The system performance is better in clear weather than in foggy weather. In addition, the further the distance between CV and TI, the more significant the effect of the weather conditions on the system.
  • The influence of communication distance can be concluded as follows: With the increasing of I CV TI (within the range of 10 m to 100 m), both the average path loss and the outage probability show a trend of rapid decrease and then gradual increase, while the received optical power and the channel capacity are rapidly increasing and then gradually decreasing. In addition, the effect of I CV TI on system performance is more significant compared to weather conditions.
  • The influence of the deployment location of RIS can be concluded as follows: When I CV TI < 60   m , the deployment position of R 1 between CV and TI has a greater impact on the system. However, when CV is far away from TI ( 60   m I CV TI 100   m ), the effect of the deployment location of R 1 is negligible.
  • The influence of the number N of RIS reflection elements can be concluded as follows: To attain a targeted energy efficiency, the lower bound of N is sharply decreasing and then slowly increasing with the increase in I CV TI . Further, the value of N is smaller under clear weather conditions compared to foggy weather conditions. Furthermore, the advantage of clear weather conditions is more significant as I CV TI increased.
  • Under the same conditions of weather and transmission distance, the higher the value of C t h , the higher the outage probability.

6. Conclusions and Outlook for the Future

In order to improve traffic safety on mountain roads and to solve the key challenge of the LOS link blockage due to the mobility of vehicles, a V2I–VLC system aided by optical RIS is proposed in this work. The dynamic propagation model of the proposed system is established. In channel modeling, the influence of propagation characteristics such as atmospheric environment and weather considerations on the system model is emphasized. Then, to comprehensively analyze the performance of the proposed RIS-aided V2I–VLC system, closed-form expressions for the key VLC performance metrics, including average path loss, received optical power, channel capacity, and outage probability, are derived. This work is also compared with an RIS-free system in terms of path loss. The results indicate that the performance of the proposed system is significantly better than the existing study. In addition, in order to gain more practical insights, a closed-form expression is derived for the number of RIS reflection elements required to attain the targeted energy efficiency.
It is worth noting that the results show that RIS will be strongly affected by weather, RIS deployment location, and other factors while solving the LOS link blockage problem. Therefore, the above influencing factors need to be emphasized when RIS is actually deployed to mountain roads in the future. For example, deploy RIS away from low-lying river valleys and leeward slopes of mountain ranges. The main reason is that low-lying areas can accumulate cold air and water vapor, resulting in the formation of dense fog or patchy fog. In addition, the leeward slopes of mountain ranges will make the air current sink, which increases the humidity of the air and leads to a longer retention time of fog. Moreover, the deployment of RIS at the entrance and exit of tunnels should also be avoided. This is because the large temperature difference between the inside and outside of tunnels will cause hot and cold air to meet at the entrances and exits of the tunnels, which makes it easy to form patchy fog.
In future studies, the reliability of the proposed system can be further improved by setting multiple Txs. Further, this study is based on the fact that vehicles and RIS are parallel in the channel modeling process. Therefore, future research could consider deploying RIS on infrastructures such as streetlights and traffic lights. Furthermore, the effects of other weather conditions, such as rain, snow, and dust, on outdoor VLC systems should be further investigated. In addition, Artificial Intelligence (AI) technology can be introduced into the system. This is because AI can speed up system and channel modeling and take more influencing conditions into account, making the analysis results more realistic and informative.

Author Contributions

Conceptualization, W.Y. and H.L.; methodology, W.Y. and H.L.; software, H.L.; validation, W.Y., H.L., G.C., Z.S. and Y.F.; formal analysis, W.Y. and H.L.; investigation, G.C., Z.S. and Y.F.; resources, W.Y. and H.L.; data curation, H.L.; writing—original draft preparation, H.L.; writing—review and editing, W.Y. and H.L.; visualization, H.L.; supervision, W.Y.; project administration, W.Y.; funding acquisition, W.Y. All authors have read and agreed to the published version of the manuscript.

Funding

This research received no external funding.

Institutional Review Board Statement

Not applicable.

Informed Consent Statement

Not applicable.

Data Availability Statement

Data are contained within the article.

Conflicts of Interest

The authors declare no conflicts of interest.

Abbreviations

The following abbreviations are used in this manuscript:
VLCVisible light communication
ITSIntelligent transportation system
V2VVehicle-to-vehicle
V2IVehicle-to-infrastructure
LOSLine-of-sight
RISReflecting intelligent surface
ATAtmospheric turbulence
LEDLight-emitting diode
OFDMOrthogonal frequency-division multiplexing
PPMPulse-position modulation
Li-FiLight fidelity
CMAConstant modulus algorithm
MLMachine learning
E-PPMEnhanced pulse position modulation
IoVInternet of Vehicles
AFAmplify-and-forward
DFDecode-and-forward
UAVUnmanned aerial vehicle
MIMOMultiple-input multiple-output
LCLiquid crystal
SMSpatial modulation
NOMANon-orthogonal multiple access
SCMAScheme combining sparse code multiple access
PD-NOMAPower-domain non-orthogonal multiple access
STAR-RISSimultaneously transmitting and reflecting intelligent surface
DMTDiversity-multiplexing tradeoff
IVInterfering vehicle
CVCommunication vehicle
RSRoad surface
OOKOn–off keying
FOVField of view
IM-DDIntensity-modulation and direct-detection
PDFProbability density function
SNRSignal-to-noise ratio
SDGSustainable development goal
AIArtificial intelligence

References

  1. Ahmed, S.K.; Mohammed, M.G.; Abdulqadir, S.O.; El-Kader, R.G.A.; El-Shall, N.A.; Chandran, D.; Rehman, M.E.U.; Dhama, K. Road Traffic Accidental Injuries and Deaths: A Neglected Global Health Issue. Health Sci. Rep. 2023, 6, e1240. [Google Scholar] [CrossRef] [PubMed]
  2. Thornbury, W.D. Principles of Geomorphology, 1st ed.; John Wiley & Sons: New York, NY, USA, 1969; pp. 16–33. [Google Scholar]
  3. Wang, F.; Wang, J.; Zhang, X.; Gu, D.; Yang, Y.; Zhu, H. Analysis of the Causes of Traffic Accidents and Identification of Accident-Prone Points in Long Downhill Tunnel of Mountain Expressways Based on Data Mining. Sustainability 2022, 14, 8460. [Google Scholar] [CrossRef]
  4. Wen, Z.; Zhang, H.; Zhang, R. Safety-Critical Event Identification on Mountain Roads for Traffic Safety and Environmental Protection Using Support Vector Machine with Information Entropy. Sustainability 2021, 13, 4426. [Google Scholar] [CrossRef]
  5. Yang, W.; Liu, H.; Cheng, G. Modeling and Performance Study of Vehicle-to-Infrastructure Visible Light Communication System for Mountain Roads. Sensors 2024, 24, 5541. [Google Scholar] [CrossRef]
  6. Shaaban, K.; Shamim, M.H.M.; Abdur-Rouf, K. Visible Light Communication for Intelligent Transportation Systems: A Review of the Latest Technologies. J. Traffic Transp. Eng. (Engl. Ed.) 2021, 8, 483–492. [Google Scholar] [CrossRef]
  7. Zhu, M.; Wang, Y.; Liu, X.; Ma, S.; Zhang, X.; Fu, Y. Performance Analysis for DF Relay-Aided Visible Light Communication System With NOMA. IEEE Photonics. J. 2022, 14, 1–9. [Google Scholar] [CrossRef]
  8. Cailean, A.-M.; Dimian, M. Current Challenges for Visible Light Communications Usage in Vehicle Applications: A Survey. IEEE Commun. Surv. Tutor. 2017, 19, 2681–2703. [Google Scholar] [CrossRef]
  9. Elamassie, M.; Uysal, M. Unified Atmospheric Attenuation Models for Visible and Infrared Wavelengths. J. Opt. Soc. Am. A 2024, 41, 2099–2111. [Google Scholar] [CrossRef]
  10. Abumarshoud, H.; Mohjazi, L.; Dobre, O.A.; Di Renzo, M.; Imran, M.A.; Haas, H. LiFi through Reconfigurable Intelligent Surfaces: A New Frontier for 6G? IEEE Veh. Technol. Mag. 2022, 17, 37–46. [Google Scholar] [CrossRef]
  11. Vijayakumari, K.; Anusudha, K. A Comprehensive Study on the Advances and Challenges in Visible Light Communication Technologies. In Proceedings of the 2024 Third International Conference on Smart Technologies and Systems for Next Generation Computing (ICSTSN), Villupuram, India, 18–19 July 2024; pp. 1–6. [Google Scholar]
  12. Politi, C.T.; Serpi, H.; Tselios, C.; Denazis, S. Integrated Sensing, Communication and Lighting Visible Light Communication for Indoor 6G Networks. In Proceedings of the 2024 24th International Conference on Transparent Optical Networks (ICTON), Bari, Italy, 14–18 July 2024; pp. 1–4. [Google Scholar]
  13. Zhang, Y.; Ren, J.; Li, K.; Mou, H. Performance Analysis of a Single Light Source Bidirectional Visible Light Communication Reverse Reflection Link. Photonics 2023, 11, 18. [Google Scholar] [CrossRef]
  14. Wang, H.; Weng, Q.; Liu, H. Research on Signal Equalization Technology Based on Visible Light Communication. J. Phys. Conf. Ser. 2024, 2807, 012042. [Google Scholar] [CrossRef]
  15. Sliti, M.; Mrabet, M.; Garai, M.; Ammar, L.B. A Survey on Machine Learning Algorithm Applications in Visible Light Communication Systems. Opt. Quant. Electron. 2024, 56, 1351. [Google Scholar] [CrossRef]
  16. Palavenia, S.; Salauyou, A.; Karneyeva, A.; Zahariev, V. Research on the Atmospheric Channel for Transmitting Information Using Visible Light. In Proceedings of the 2024 Systems of Signal Synchronization, Generating and Processing in Telecommunications (SYNCHROINFO), Vyborg, Russia, 1–3 July 2024; pp. 1–7. [Google Scholar]
  17. Barber, D.; Tummala, M.; McEachen, J. Daylight Noise Baseline for Outdoor Visible Light Communication with CMOS Sensors. In Proceedings of the 2024 Conference on Lasers and Electro-Optics Pacific Rim (CLEO-PR), Incheon, Republic of Korea, 4 August 2024; pp. 1–2. [Google Scholar]
  18. Liu, X.; Zhao, G.; Xu, Z.; Guo, L. Channel Analysis and Performance Enhancement for VLC under Smoke Conditions. In Proceedings of the 2024 2nd International Conference on Signal Processing and Intelligent Computing (SPIC), Guangzhou, China, 20 September 2024; pp. 337–340. [Google Scholar]
  19. Achari, S.; Yang, A.Y.; Goodhead, J.; Swanepoel, B.; Cheng, L. Self-Synchronizing on-off-Keying Visible Light Communication System for Intra- and Inter-Vehicle Data Transmission. SAIEE Afr. Res. J. 2024, 115, 4–15. [Google Scholar] [CrossRef]
  20. Ugolini, A.; Poli, F.; Croce, D.; Mangione, S. Characterization of Depth-Dependent Loss for Visible Light Propagation in Underwater Optical Wireless Links. In Proceedings of the 2024 Italian Conference on Optics and Photonics (ICOP), Firenze, Italy, 17 June 2024; pp. 1–4. [Google Scholar]
  21. Haodong, W.; Lincong, Z. Light Source Deployment Study Based on Downhole Visible Light Communication System. J. Phys. Conf. Ser. 2024, 2880, 012004. [Google Scholar] [CrossRef]
  22. Suying, T.; Lincong, Z.; Ying, L. Research on Visible Light Communication Channel Model in Underground Mines. J. Phys. Conf. Ser. 2024, 2880, 012002. [Google Scholar] [CrossRef]
  23. Wang, X.; Wang, J.; Wang, H.; Gu, H.; Zhang, Y. In Proceedings of the Visible Light Communication System for Mine Environment. In Proceedings of the International Conference on Computing, Machine Learning and Data Science, Singapore, 12 April 2024; pp. 1–6. [Google Scholar]
  24. Mensi, N.; Rawat, D.B. On the Performance of Partial RIS Selection vs. Partial Relay Selection for Vehicular Communications. IEEE Trans. Veh. Technol. 2022, 71, 9475–9489. [Google Scholar] [CrossRef]
  25. Singh, A.K.; Sahana, B.C. Performance Evaluation of STAR-RIS and AF Relay in NOMA-Enabled V2V Networks Fo6, rG. In Proceedings of the 2024 ITU Kaleidoscope: Innovation and Digital Transformation for a Sustainable World (ITU K), New Delhi, India, 21 October 2024; pp. 1–6. [Google Scholar]
  26. Lv, A.; Zhu, J.; Zou, Y.; Lin, S. Outage Probability Analysis of RIS-Assisted Relay Transmission Systems. In Proceedings of the 2023 International Conference on Wireless Communications and Signal Processing (WCSP), Hangzhou, China, 2 November 2023; pp. 904–909. [Google Scholar]
  27. Lininger, A.; Zhu, A.Y.; Park, J.-S.; Palermo, G.; Chatterjee, S.; Boyd, J.; Capasso, F.; Strangi, G. Optical Properties of Metasurfaces Infiltrated with Liquid Crystals. Proc. Natl. Acad. Sci. USA 2020, 117, 20390–20396. [Google Scholar] [CrossRef]
  28. Lee, S.H.; Choi, M.; Kim, T.-T.; Lee, S.; Liu, M.; Yin, X.; Choi, H.K.; Lee, S.S.; Choi, C.-G.; Choi, S.-Y.; et al. Switching Terahertz Waves with Gate-Controlled Active Graphene Metamaterials. Nat. Mater. 2012, 11, 936–941. [Google Scholar] [CrossRef]
  29. Ayub, M.S.; Adasme, P.; Soto, I.; Rodriguez, D.Z. Reconfigurable Intelligent Surfaces Enabling Future Wireless Communication. In Proceedings of the 2021 Third South American Colloquium on Visible Light Communications (SACVLC), Toledo, Brazil, 11 November 2021; pp. 1–5. [Google Scholar]
  30. Aboagye, S.; Ngatched, T.M.N.; Ndjiongue, A.R.; Dobre, O.A.; Shin, H. Liquid Crystal-Based RIS for VLC Transmitters: Performance Analysis, Challenges, and Opportunities. IEEE. Wirel. Commun. 2024, 31, 98–105. [Google Scholar] [CrossRef]
  31. Hasan, S.R.; Chowdhury, M.Z.; Sayem, M.; Jang, Y.M. Integration of Reconfigurable Intelligent Surface and Visible Light Communication Systems for 5G and Beyond Communications. In Proceedings of the 2023 International Conference on Artificial Intelligence in Information and Communication (ICAIIC), Bali, Indonesia, 20 February 2023; pp. 149–153. [Google Scholar]
  32. Palitharathna, K.W.S.; Maria Vegni, A.; Suraweera, H.A. SLIVER: A SLIPT-Enabled IRS-Assisted VLC System for Energy Optimization. In Proceedings of the 2023 IEEE 20th International Conference on Mobile Ad Hoc and Smart Systems (MASS), Toronto, ON, Canada, 25 September 2023; pp. 143–151. [Google Scholar]
  33. Zhang, L.; Jia, X.; Tian, N.; Hong, C.S.; Han, Z. When Visible Light Communication Meets RIS: A Soft Actor–Critic Approach. IEEE Wirel. Commun. Lett. 2024, 13, 1208–1212. [Google Scholar] [CrossRef]
  34. Ndjiongue, A.R.; Dobre, O.A.; Shin, H. Maximal Transmission Rate in Omni-DRIS-Assisted Indoor Visible Light Communication Systems. IEEE Trans. Veh. Technol. 2024, 73, 13956–13961. [Google Scholar] [CrossRef]
  35. Shen, P.; Lu, L. Reconfigurable Intelligent Surface Enabled Spatial Modulation for Visible Light Communications. IEEE Photonics J. 2023, 15, 1–12. [Google Scholar] [CrossRef]
  36. Mi, J.; Wang, J.; Sun, S. RIS-Aided Indoor Visible Light Communication System with Spatial Modulation. In Proceedings of the 2024 IEEE International Symposium on Broadband Multimedia Systems and Broadcasting (BMSB), Toronto, ON, Canada, 19 June 2024; pp. 1–6. [Google Scholar]
  37. Liu, C.; Yu, L.; Yu, X.; Qian, J.; Wang, Y.; Wang, Z. Capacity Analysis of RIS-Assisted Visible Light Communication Systems with Hybrid NOMA. In Proceedings of the 2022 IEEE Globecom Workshops (GC Wkshps), Rio de Janeiro, Brazil, 4 December 2022; pp. 118–123. [Google Scholar]
  38. Abdeljabar, S.; Eltokhey, M.W.; Alouini, M.-S. Reconfigurable Intelligent Surfaces for Outdoor Visible Light Communications. IEEE Internet Things Mag. 2025, 8, 58–64. [Google Scholar] [CrossRef]
  39. Sharda, P. Next Generation Based Vehicular Visible Light Communications: A Novel Transmission Scheme. IEEE Trans. Veh. Technol. 2024, 73, 16735–16743. [Google Scholar] [CrossRef]
  40. Eldeeb, H.B.; Naser, S.; Bariah, L.; Muhaidat, S. Energy and Spectral Efficiency Analysis for RIS-Aided V2V-Visible Light Communication. IEEE. Commun. Lett. 2023, 27, 2373–2377. [Google Scholar] [CrossRef]
  41. Meghraoui, A.; Tayebi, M.L.; Besseghier, M.; Ho, T.D. Secure Vehicular Visible Light Communications via STAR-RIS: Secrecy Capacity Evaluation. In Proceedings of the 2024 IEEE International Mediterranean Conference on Communications and Networking (MeditCom), Madrid, Spain, 8 July 2024; pp. 68–72. [Google Scholar]
  42. Meghraoui, A.; Tayebi, M.L.; Besseghier, M.; Eldeeb, H.B.; Muhaidat, S. Performance Evaluation of STAR-RIS-Aided-V2V Visible Light Communications at Road Intersections. In Proceedings of the 2024 3rd International Conference on Advanced Electrical Engineering (ICAEE), Sidi-Bel-Abbes, Algeria, 5 November 2024; pp. 1–6. [Google Scholar]
  43. Rüb, M.; Grüber, J.; Lipps, C.; Schotten, H.D. Update Rate and Dimension Requirements for Reconfigurable Mirror Arrays in Vehicular Visible Light Communication. In Proceedings of the 2024 IEEE 99th Vehicular Technology Conference (VTC2024-Spring), Singapore, 24 June 2024; pp. 1–6. [Google Scholar]
  44. Mishra, S.; Maheshwari, R.; Grover, J.; Vaishnavi, V. Investigating the Performance of a Vehicular Communication System Based on Visible Light Communication (VLC). Int. J. Inf. Tecnol. 2022, 14, 877–885. [Google Scholar] [CrossRef]
  45. Sharda, P.; Bhatnagar, M.R.; Ghassemlooy, Z. Modeling of a Vehicle-to-Vehicle Based Visible Light Communication System Under Shadowing and Investigation of the Diversity-Multiplexing Tradeoff. IEEE Trans. Veh. Technol. 2022, 71, 9460–9474. [Google Scholar] [CrossRef]
  46. Sharda, P.; Bhatnagar, M.R. Vehicular Visible Light Communication System: Modeling and Visualizing Critical Outdoor Propagation Characteristics. IEEE Trans. Veh. Technol. 2023, 72, 1–14. [Google Scholar] [CrossRef]
  47. Lapidoth, A.; Moser, S.M.; Wigger, M.A. On the Capacity of Free-Space Optical Intensity Channels. IEEE Trans. Inform. Theory 2009, 55, 4449–4461. [Google Scholar] [CrossRef]
  48. Yin, L.; Haas, H. Physical-Layer Security in Multiuser Visible Light Communication Networks. IEEE J. Select. Areas Commun. 2018, 36, 162–174. [Google Scholar] [CrossRef]
Figure 1. A typical RIS-aided V2I–VLC scenario for mountain roads.
Photonics 12 00664 g001
Figure 2. The system model of the proposed RIS-aided V2I–VLC system.
Photonics 12 00664 g002
Figure 3. Average path loss under different weather conditions (the system is in a 25 °C environment and the negative sign (−) in the path loss values indicates the loss in the form of a path loss penalty).
Photonics 12 00664 g003
Figure 4. Average path loss for different distance weights under clear weather conditions (the negative sign (−) in the path loss values indicates the loss in the form of a path loss penalty).
Photonics 12 00664 g004
Figure 5. Average path loss based on RIS reflection and mountain reflection under different weather conditions (the negative sign (−) in the path loss values indicates the loss in the form of a path loss penalty).
Photonics 12 00664 g005
Figure 6. Received optical power under different weather conditions.
Photonics 12 00664 g006
Figure 7. Channel capacity under different weather conditions.
Photonics 12 00664 g007
Figure 8. Outage probability under different weather conditions when the threshold data transmission rate is (a) 50 Mb/s and (b) 70 Mb/s.
Photonics 12 00664 g008
Figure 9. Number of RIS reflection elements required to attain the targeted energy efficiency under different weather conditions.
Photonics 12 00664 g009
Table 1. The values of the parameters related to weather conditions.
ParameterVariable NameClear WeatherModerate FogDense Fog
c Extinction Coefficient00.007820.01565
ε Weather Correction Factor 10.01750.01720.0170
ζ Weather Correction Factor 20.15850.16000.1550
Table 2. The values of the parameters setting in the simulation.
ParameterVariable NameValue
D R Receive Aperture0.02 m
A R Area   of   the   Reflection   Element   of   R 1 0.02 m2
L w Road Width4.5 m
v w Vehicle Width1.8 m
P t , i Power of the Transmitted Information Signal of the i th Transmitter29 W
P L DC Power Required for the Lighting2 W
ρ RIS Optical   Signal   Reflection   Coefficient   of   R 1 0.85 W/A
ρ Tx Electro-Optical Conversion Coefficient of Txs0.44 W/A
ρ Rx Photoelectric Conversion Coefficient of Rx1 W/A
μ d Gain of the PD-based Rx50
μ f Gain of the filter of Rx1
B System Bandwidth10 MHz
F Detector Noise Figure0.2
R L Load Resistance50 Ω
I b Background Solar Radiation Current1.6 × 10−3 A
σ l 2 Variance of the Lognormal Distribution0.2
P RIS Power Consumed by Each RIS Reflection Element15 dBm
P C Power Consumed by the Circuits for Transmitting and Receiving Signals20 dBm
Disclaimer/Publisher’s Note: The statements, opinions and data contained in all publications are solely those of the individual author(s) and contributor(s) and not of MDPI and/or the editor(s). MDPI and/or the editor(s) disclaim responsibility for any injury to people or property resulting from any ideas, methods, instructions or products referred to in the content.

