Article

Nested U-Net-Based GAN Model for Super-Resolution of Stained Light Microscopy Images

1
Department of Radiological Science, Gachon University, Incheon 21936, Republic of Korea
2
Department of Dental Hygiene, Gachon University, Incheon 21936, Republic of Korea
*
Author to whom correspondence should be addressed.
Photonics 2025, 12(7), 665; https://doi.org/10.3390/photonics12070665
Submission received: 29 May 2025 / Revised: 21 June 2025 / Accepted: 1 July 2025 / Published: 1 July 2025
(This article belongs to the Special Issue Recent Advances in Biomedical Optics and Biophotonics)

Abstract

The purpose of this study was to propose a deep learning-based model for the super-resolution reconstruction of stained light microscopy images. To achieve this, perceptual loss was applied to the generator to reflect multichannel signal intensity, distribution, and structural similarity. A nested U-Net architecture was employed to address the representational limitations of the conventional U-Net. For quantitative evaluation, the peak signal-to-noise ratio (PSNR), structural similarity index (SSIM), and correlation coefficient (CC) were calculated. In addition, intensity profile analysis was performed to assess the model’s ability to restore the boundary signals more precisely. The experimental results demonstrated that the proposed model outperformed both the signal and structural restoration compared to single U-Net and U-Net-based generative adversarial network (GAN) models. Consequently, the PSNR, SSIM, and CC values demonstrated relative improvements of approximately 1.017, 1.023, and 1.010 times, respectively, compared to the input images. In particular, the intensity profile analysis confirmed the effectiveness of the nested U-Net-based generator in restoring cellular boundaries and structures in the stained microscopy images. In conclusion, the proposed model effectively enhanced the resolution of stained light microscopy images acquired in a multichannel format.

1. Introduction

Light microscopy, which can be used to observe high-resolution microstructures, is an essential tool for tissue analysis in disease diagnosis and biological research [1,2]. However, light microscopes have inherent limitations in resolution owing to physical limitations that include diffraction. Performing a detailed analysis at high magnification after obtaining an overview of the entire structure at low magnification can result in sample damage and increased image acquisition time [3,4,5].
Staining techniques have been introduced to compensate for these limitations indirectly. Staining increases the contrast between the nucleus, cells, and the tissue matrix, clearly revealing the structure of the subject and enabling accurate pathological analysis [6,7]. In addition, quantitative evaluation using stain intensity and distribution is possible, and biological information such as protein expression locations can be visualized using specific markers [8,9,10]. Inappropriate staining can cause noise in images, blur cell boundaries, and overly intensify or weaken the signals from specific structures, which can reduce the accuracy of quantitative analysis [11,12].
Thus, various algorithms have been proposed to directly improve resolution. In particular, super-resolution algorithms demonstrate high image restoration performance, such as preserving boundary signals with improved blurring and noise in grayscale light-microscopy images.
Among conventional super-resolution algorithms, a variety of techniques have been developed to surpass the diffraction limit through fluorescence imaging grounded in physical principles [13,14,15,16]. These approaches enhance spatial resolution by combining precise illumination control or position-dependent data acquisition with advanced post-processing and image reconstruction procedures. Fluorescence fluctuation-based super-resolution methods further improve resolution by exploiting the temporal variability of fluorescence emission [17,18]. By statistically analyzing the intrinsic flickering and intensity fluctuations of fluorescent molecules, these techniques enable detailed structural reconstruction without the need for specialized optical configurations or learning-based models. Interference-based super-resolution techniques address diffraction limitations by leveraging the interference properties of light, allowing for the visualization of cellular microstructures that remain inaccessible under conventional optical microscopy [19,20,21]. Through the integration of multiple optical paths, phase modulation, and precise interference pattern analysis, these methods facilitate high-resolution three-dimensional imaging. Although they often require intricate optical alignment, rapid data acquisition, and complex reconstruction algorithms, they can achieve spatial resolutions on the scale of several tens of nanometers.
However, stained light microscopy images are typically composed of three channels (RGB) [22,23]. Compared to single channels, multiple channels generated by staining cause distortion signals, such as the point spread function (PSF), noise, and blurring, which are difficult to characterize, leading to difficulties in accurate correction [24,25]. In addition, staining can introduce nonlinear color distributions and boundary intensities across different structural regions. Consequently, applying inappropriate algorithms may exaggerate artificial boundaries driven by color contrast rather than true structural features [26,27]. In addition, optimization of the conventional super-resolution algorithm should be tailored to specific image characteristics, as the staining intensity can vary significantly across different samples.
Deep learning-based models have been proposed to overcome the limitations of conventional algorithms for improving the resolution of images. Deep learning models, which are trained on real image data, show superior performance in analyzing nonlinear and complex patterns and demonstrate high potential for noise and artifact reduction. These results indicate a strong suitability for processing stained light microscopy images. In particular, deep learning models have been actively applied to various analytical tasks in light microscopy imaging, such as segmentation, image restoration, and super-resolution, owing to their notable advantages in image processing [28,29,30,31].
Initial U-Net-based models have been actively used in light microscope images owing to their advantages, such as the superior restoration of high-frequency information and efficient computation owing to their simple structure [32]. However, the use of single-skip connections to transfer the encoded feature information often results in blurred boundary representations. In contrast, the nested U-Net model addresses the structural limitations of the U-Net by introducing nested skip pathways with intermediate convolution layers between the encoder and decoder, along with deep supervision [33]. This architecture enables multiscale learning and improves the accuracy of boundary and fine structure restoration. In particular, compared to the standard U-Net, the nested U-Net architecture further improves feature propagation and gradient flow through dense nested paths. These nested paths enable features extracted at various depths to be reused across scales, which contribute to minimizing the semantic gap between the encoder and decoder. The structure of nested U-Net is particularly suitable for restoring fine structures in images that contain complex and multichannel information, such as stained optical microscope images. Furthermore, applying deep supervision not only improves convergence speed during training, but also reduces the risk of overfitting by supervising intermediate outputs at multiple stages of the decoder. Thus, nested U-Net demonstrates improved generalization performance and robustness in high-resolution image restoration.
Generative adversarial network (GAN)-based models were trained to generate visually realistic high-resolution outputs by simultaneously leveraging adversarial and perceptual losses [34,35]. Because the discriminator evaluates visual plausibility based on features such as boundaries, high-frequency textures, and fine intracellular structures, the generator is encouraged to emphasize these components, leading to an enhanced restoration of fine details and edges. However, in the pursuit of visual sharpness, GANs may also produce artificial high-frequency information, potentially resulting in boundary distortions or the generation of false edges [36,37].
Therefore, in this study, we propose a GAN model that incorporates a nested U-Net architecture to improve the super-resolution of stained light microscopy images, effectively addressing the structural limitations of U-Net and the perceptual artifacts commonly observed in conventional GANs.

2. Materials and Methods

2.1. Dataset Construction

The light microscopy images of mouse embryo head sections at embryonic day 16.5 were used as the dataset. All tissue sections were prepared and stained with hematoxylin and eosin (H&E) using standard histological procedures. Light microscopy images were captured at 12.5× magnification using a digital microscope (DM500; Leica Microsystems, Heerbrugg, Switzerland) and saved in RGB format at a resolution of 1040 × 1392 pixels. All imaging parameters were kept consistent across samples.
From the acquired light microscopy images, the noise was reduced while preserving the edge signals by applying the non-local means (NLM) algorithm as follows:
N L M f m = n = 1 ω m , n f n ,
where m and n are the pixel indices in the stained light microscopy image, and ω m , n is a weight representing the similarity between pixels m and n constrained by 0   ω m , n 1 . The weights were computed based on the distance between pixel neighborhoods as follows:
ω m , n = 1 Z m e v k m v k n 2 , a 2 d 2 ,
Z m = n e v k m v k n 2 , a 2 d 2 ,
Here, for a square kernel of size k centered at pixel i , v k i represents the vectorized intensity values within the patch. The term v k m v k n 2 , a 2 is the squared Euclidean distance between two patches, computed with a Gaussian kernel of standard deviation a . Z m is a normalization constant that ensures that the weights sum to one, and d is a smoothing parameter that controls the degree of filtering. In this study, d was set to 0.05, and the patch size and search window were set to 7 and 15, respectively.
Subsequently, two sets of images were prepared: one processed with NLM, and the other with a resolution degraded by a factor of 16. Both were converted into patches from 512 × 512 matrix-sized images using a stride of 256, forming the label and input datasets, respectively. We obtained 26,996 paired data points; 19,748, 2416, and 4832 paired data points were used for training, validation, and testing, respectively.

2.2. Nested U-Net-Based GAN Model

2.2.1. Comparison with Previous Super-Resolution Models in Microscopy

A variety of deep learning-based models have been proposed to achieve the super-resolution reconstruction of light microscopy images. Table 1 summarizes prior representative studies, organized by input channel types, network architectures, loss functions, and key technical features.
Early approaches, such as those based on deep convolutional neural networks (DCNNs) and fully convolutional networks (FCNs), predominantly relied on pixel-wise losses and were often constrained to single channel data. As a result, their applicability to multichannel stained images was limited, particularly due to the lack of perceptual and adversarial components in their design. To overcome these shortcomings, U-Net and GAN-based architectures were introduced. These models adopted adversarial learning strategies, with later studies incorporating attention mechanisms and frequency-domain modules. Such developments enhanced the realism of reconstructed structures and improved edge sharpness. Nonetheless, most models were still optimized for grayscale images, and only a few directly addressed the nonlinear distortions introduced by staining in multichannel microscopy. More recent efforts have applied composite loss functions to better balance global image quality with local textural detail. In parallel, advances in architectural design, such as the use of attention modules, residual dense blocks, multi-scale feature fusion, and frequency-domain processing, have contributed to the improved restoration of fine structures and greater robustness to noise. However, explicitly modeling the semantic variability and nonlinear structural characteristics of complex stained microscopy data remains a significant challenge. Furthermore, most existing models have been evaluated on images with relatively mild degradation, where much of the original spatial and color information is still retained. As a result, their effectiveness is limited when applied to severely degraded inputs, which often occur in practical microscopy settings involving poor-quality or highly compromised data. To address these issues, the present study introduces a GAN-based model employing a nested U-Net generator, specifically optimized for stained light microscopy images. The generator utilizes densely connected skip pathways and deep supervision to enhance the recovery of structural details, while a patch-based discriminator enforces local realism in fine cellular features. The model was trained using a composite loss function allowing it to effectively handle both nonlinear chromatic distortions and semantic inconsistencies introduced by staining. Furthermore, the proposed model was designed to effectively restore both visual clarity and structural fidelity in severely degraded multichannel images, aiming to address challenging conditions where conventional models tend to underperform.

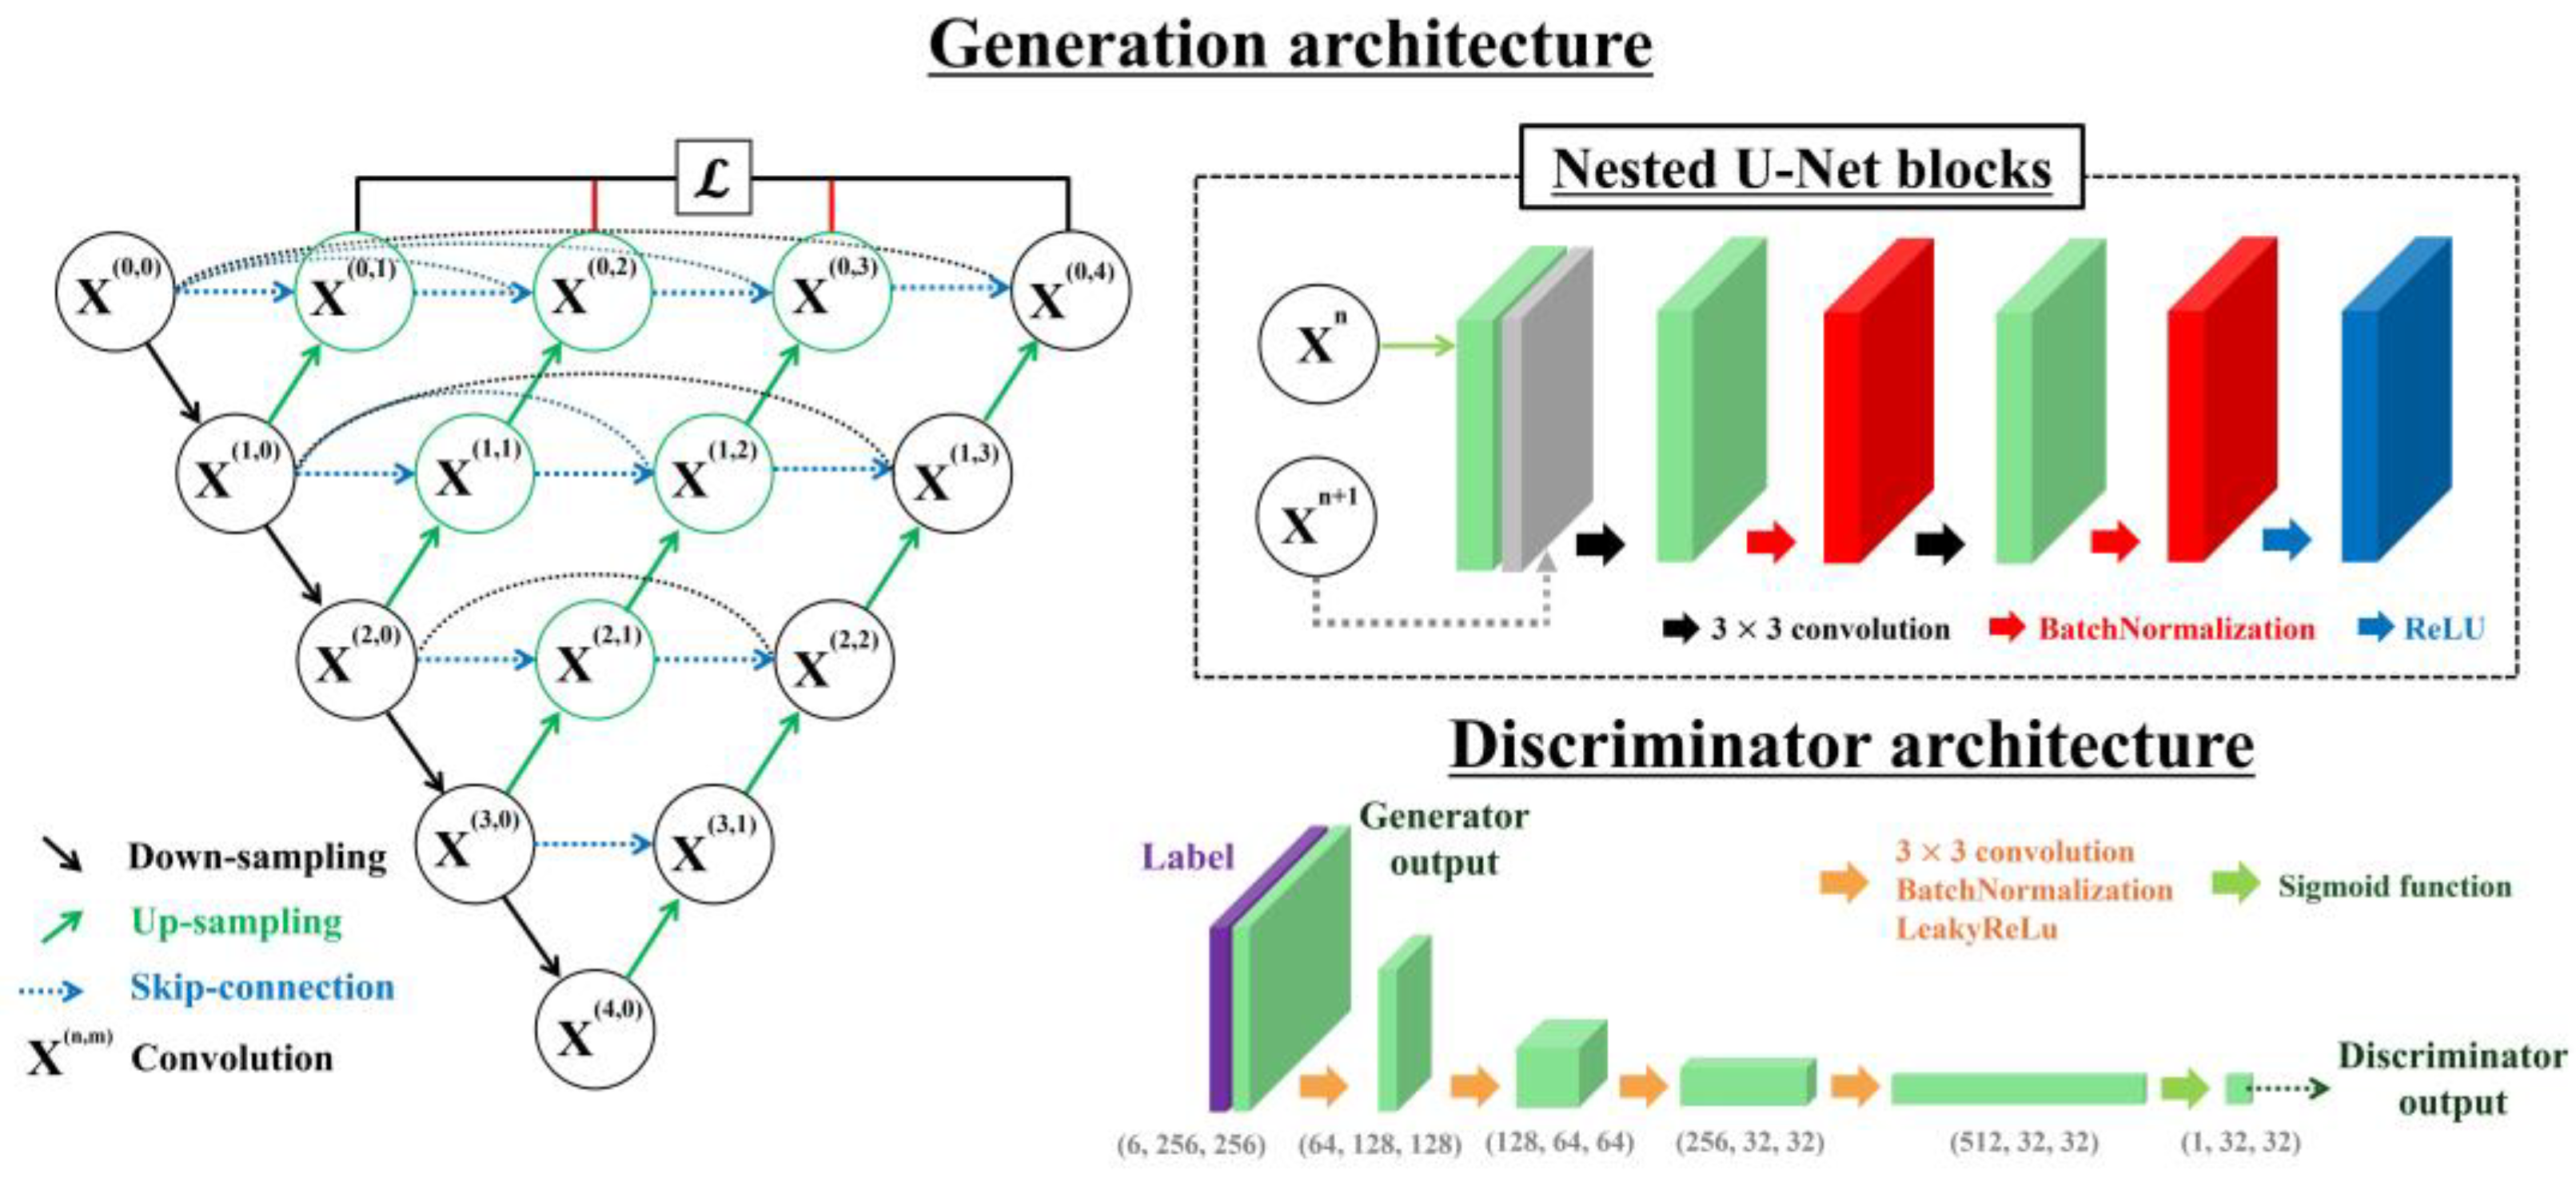
2.2.2. Generation Architecture

Figure 1 is an illustration of a super-resolution nested U-Net-based GAN model for stained light microscope images. The generator in the proposed GAN model was based on a nested U-Net architecture, which addresses the semantic gap limitations of the original U-Net by introducing densely connected skip pathways between the encoder and decoder at multiple depths. These nested skip connections enable the progressive refinement of features and facilitate the more effective fusion of multi-scale contextual information. Each convolutional unit comprises two 3 × 3 convolutional layers, followed by Batch Normalization and ReLU activation. Feature maps from deeper layers were up-sampled using bilinear interpolation and concatenated with shallower features to enhance the structural reconstruction. Furthermore, deep supervision was applied by generating auxiliary outputs at multiple decoding stages, which improved the gradient flow and accelerated convergence during training.
To achieve the high-quality super-resolution of stained light microscopy images, we employed a composite generator for perceptual loss that jointly accounted for pixel-level accuracy, perceptual similarity, structural consistency, and artifact suppression. The overall objective function is defined as follows:
L G = L G A N + λ L 1 L L 1 + λ V G G L V G G + λ S S I M L S S I M + λ T V L T V ,
where L G A N denotes the adversarial loss, which encourages the generator to produce visually realistic outputs that are indistinguishable from real high-resolution images, and are particularly important for recovering fine-grained textures and staining-induced high-frequency variations. L L 1 is the pixel-wise L1 loss between the generated image and ground truth, contributing to the overall structural alignment and reducing the global intensity deviations. L V G G represents the perceptual loss, calculated as the L1 distance between the feature maps extracted from a pretrained VGG-19 network, enabling the preservation of semantic details and morphological patterns. L S S I M measures structural similarity by comparing luminance, contrast, and texture between images, which is critical for maintaining biologically meaningful features such as cell boundaries and internal structures. Finally, L T V is a total variation regularization term that reduces noise and suppresses checkerboard artifacts by enforcing local smoothness in the generated output.
In models for the super-resolution of stained microscope images, L1 loss is most important for accurately estimating the signal intensity of the restored image. However, applying L1 loss independently can cause excessive blurring. To resolve blurring and to clearly depict the boundaries of fine structures, SSIM loss was applied. Additionally, TV loss contributes to maintaining the local smoothness of the image by mitigating the artificially enhanced boundary signals caused by SSIM loss. VGG loss calculates the loss based on feature maps, thereby preserving the shapes of detailed structures and complementing L1 and SSIM loss. The weighting factors λ L 1 , λ V G G , λ S S I M , and λ T V control the relative importance of each loss component and were empirically set to 50, 1, 5, and 0.01, respectively. This multi-objective formulation is particularly well-suited for stained light microscopy data, where the color distribution, structural integrity, and perceptual clarity must be simultaneously optimized to ensure both visual plausibility and quantitative reliability.

2.2.3. Discriminator Architecture

In this study, the discriminator adopted a patchGAN-based architecture that evaluates the realism of image patches rather than the entire image. Specifically, the discriminator receives a concatenation of the input image and either the ground truth or the generated image as input, and produces a two-dimensional map of real/fake predictions, where each element corresponds to a local receptive field. Structurally, the discriminator consists of a series of convolutional layers that progressively down-sample the input while preserving spatial information at the patch level. This enabled the model to focus on fine-grained, localized inconsistencies between real and generated image pairs. For optimization, a binary cross-entropy loss with logits (BCEWithLogitsLoss) was used to distinguish between the real and fake patches. The adversarial loss from this discriminator is back-propagated to the generator to encourage the production of a locally realistic output. In the proposed model, the discriminator structure was applied to generate images that were both structurally accurate and visually convincing. The discriminator structure penalizes elements such as unrealistic textures and color transitions. High-resolution label images were used as ground truth in the adversarial learning process, and the generator’s output was directly compared with ground truth to enable the more effective learning of high-frequency information and detailed structures in boundary areas.
For these reasons, patchGAN is particularly well suited for stained light microscopy images, where critical information is often concentrated in small, high-frequency structures, such as cell boundaries, nuclei, and stained subcellular regions. Unlike global discriminators that may overlook localized differences, patchGAN enforces local realism, which is essential for faithfully reconstructing biologically relevant textures and structures that are altered by staining. Localized adversarial supervision is crucial to improve the perceptual quality and interpretability of super-resolved microscopy images.

2.3. Quantitative Evaluation

To quantitatively evaluate the performance of each super-resolution model on the stained light microscopy images, the peak signal-to-noise ratio (PSNR), structural similarity index measure (SSIM), and correlation coefficient (CC) were measured as follows:
P S N R = 10   ·   l o g 10 S p e a k 2 M S E ,
M S E = i = 1 N f i g i 2 N ,
where f i and g i represent the reference and comparison images, respectively, N is the number of pixels in the image, and S p e a k 2 is the maximum signal intensity in the region of interest (ROI).
S S I M = 2 μ f μ g + C 1 2 μ f g + C 2 μ f 2 + μ g   2 + C 1 σ f   2 + σ g 2 + C 2 ,
C C = i = 1 N f i f ^ g i     g ^ i = 1 N f i f ^ 2 i = 1 N g i g ^ 2 ,
where μ f and μ g represent the local mean intensities of the reference image f and the comparison image g , respectively, and μ f g represents the local covariance between the two images. σ f 2 and σ g 2 are the local variances, and C 1 and C 2 are small constants introduced to avoid instability when the denominators are close to zero. In addition, f ^ and g ^ are their global mean values, and N is the total number of pixels.
SSIM comprehensively considers brightness, contrast, and structural elements, while CC measures the linear relationship between two images, enabling structural and statistical quality assessment of the entire image. In particular, in color images, structural information dispersion and color distortion occur in each channel. SSIM and CC are useful factors that can comprehensively evaluate consistency in structure and color between channels, including simple intensity differences. However, blurring effects can occur in detailed areas during the application of super-resolution models. Thus, the tooth region of the embryo was designated as the region of interest (ROI) to analyze variations in boundary sharpness and the signal intensity profiles were measured. The mean squared error (MSE), mean absolute error (MAE), and Pearson correlation coefficient (PCC) were calculated based on the obtained intensity profiles. In addition, to reduce the influence of noise on the label data during intensity profile extraction, a median filter was applied as a preprocessing step. The measured MSE, MAE, and PCC can analyze the restoration rate of high-frequency signals in local areas that cannot be measured by PSNR and SSIM. In particular, MSE and MAE can intuitively confirm the difference in signal intensity between the two images. In addition, PCC was measured to evaluate the consistency of detailed structural differences and intensity distribution patterns.

3. Results

Figure 2 presents the results of applying various super-resolution models to the stained light microscopy images. Box A indicates the enlarged tooth region shown in Figure 3.
Visually, the output images generated by all super-resolution models exhibited improved image quality compared to the input images. However, in some models, although noise reduction had been achieved, the blurring of fine structures remained unresolved. In particular, Figure 3 demonstrates that the U-Net model failed to preserve fine details in Circle A, indicating a degraded resolution performance. By contrast, both the nested U-Net and GAN-based models showed enhanced contrast and boundary sharpness in the embryonic tooth region.
Figure 4 illustrates another example of super-resolution applied to stained microscopy images, with Box B corresponding to the magnified salivary gland area shown in Figure 5.
In this case, the U-Net model exhibited a globally distorted signal intensity. Meanwhile, the GAN model based on nested U-Net clearly enhanced the contrast and boundary definition in subtle tissue structures. Figure 6 presents enlarged images of the three regions defined in Figure 5 to provide a visually intuitive comparison of the performance of each model.
For quantitative evaluation, the PSNR, SSIM, and Pearson correlation coefficient (PCC) were measured, and the results are summarized in Figure 7.
Among all the models, the GAN model based on the nested U-Net yielded the highest performance across all metrics. Notably, when applying the U-Net model for the super-resolution of stained light microscopy images, the PSNR, PCC, and SSIM were approximately 86.4%, 97.7%, and 99.6%, respectively, compared with the input image, indicating a degradation in reconstruction quality. In addition, to evaluate the degree of restoration of actual tissue boundaries, as shown in Figure 8, line A in Figure 3 was selected as the region of interest (ROI), and the intensity profiles were measured and analyzed (Table 2).
The GAN model based on nested U-Net exhibited the best performance in terms of MSE and MAE. However, in terms of the PCC, although the model achieved high accuracy, it showed an approximately 0.7% lower correlation than the model using nested U-Net without GAN.

4. Discussion

Light microscopy is widely used in the biological and diagnostic fields to analyze cellular and tissue structures. However, structural differentiation is often challenging because most biological samples are colorless or translucent. To address this issue, staining is commonly employed to enhance the contrast and facilitate morphological identification. This process enables the more accurate detection of spatial features, such as location, size, and shape, and supports quantitative analysis. Furthermore, because staining agents selectively bind to specific biochemical components, they allow the investigation of various biological characteristics and molecular information within the sample.
In particular, stained light microscopy images demonstrate that each RGB channel corresponds to distinct biological structures (e.g., nuclei, cytoplasm), and each channel exhibits unique point spread functions (PSFs), noise characteristics, and intensity distributions. This causes nonlinear and heterogeneous signal distortion between channels. However, most traditional super-resolution algorithms are based on grayscale images and assume that the PSFs, noise distribution, and blur of the entire image are the same regardless of the channel. Thus, conventional methods fail to capture structural interactions across channels, and simple intensity-based restoration often leads to issues such as color boundary distortion, color loss, and the generation of artificial edges. Furthermore, the omission of structural information may lead to distortions in biologically important features such as cell boundaries. In addition, conventional U-Net models trained with a single loss function focus solely on minimizing pixel-wise differences, which makes it difficult to account for the complex structural and chromatic interactions inherent in color images. The use of a single skip connection also limits the model’s ability to comprehensively estimate inter-channel structural signals and morphological variations in stained microscopy data. To address this issue, the present study proposes a GAN model based on a nested U-Net architecture to effectively achieve super-resolution for stained light microscopy images. Furthermore, perceptual loss was employed to reflect diverse image characteristics, thereby enhancing the reconstruction performance of the model.
The quantitative evaluation results demonstrated a progressive improvement in performance across all factors in the order of U-Net, nested U-Net, U-Net-based GAN, and nested U-Net-based GAN (Figure 7). Specifically, the PSNR is a metric that quantifies the reconstruction error based on pixel-wise differences in signal intensity. The U-Net model recorded the lowest PSNR, and the nested U-Net model exhibited relatively poor performance compared to the GAN-based models. These results suggested that models using only the U-Net architecture were less effective in restoring the signal intensity and distribution in multichannel-stained light microscopy images than those incorporating GANs. SSIM, a metric that considers image brightness, contrast, and structural consistency to evaluate structural similarity, showed a similar trend, with the GAN-based models outperforming the others. In contrast, CC, which focuses on the linear relationship between pixel intensities rather than the absolute signal magnitude, showed relatively small performance differences between the nested U-Net and GAN-based models.
This suggests that the integration of GAN architectures is more effective than conventional U-Net structures in enhancing the resolution of stained-light microscopy images [46,47]. The basic U-Net architecture employs a skip connection scheme that transfers features directly from each encoder block to its corresponding decoder block, without adequately addressing the semantic gap between encoder and decoder features. This makes it insufficient for restoring fine details such as boundary information and internal cellular structures [48]. In particular, since the input data in this study were down-sampled by a factor of 16, the U-Net lacked sufficient structural means to effectively recover the severe loss of high-frequency information. Additionally, the model processed all input channels through a unified feature flow after merging them in the initial convolution layer, without considering the distinct biological meanings or signal distribution characteristics of each channel. This could have resulted in the distortion of boundary signals and tissue structures due to an imbalance in the ratio of signal intensities between channels. To address these limitations, the nested U-Net model improved structural restoration by employing nested skip connections and deep supervision. However, it still relied on pixel-wise-based static feature flows and lacked a feedback structure to guide the recovery of boundary sharpness or visual clarity. These limitations became more pronounced in stained light microscopy images, where each channel carries unique biological information. Without explicitly modeling the nonlinear color distributions and boundary intensities across channels, the nested U-Net may have failed to maintain the structural consistency and relative intensity ratios, leading to blurred or distorted reconstructions [49,50,51]. On the other hand, GAN-based models leverage the adversarial interplay between the generator and discriminator to more accurately reconstruct not only visual similarity but also sharp boundaries and intricate intracellular structures [52,53,54]. This was achieved by training the generator to produce stained light microscopy images that were evaluated by the discriminator across all color channels, thereby promoting the restoration of channel-specific features that resembled actual biological structures. In this process, the discriminator provided implicit feedback regarding the visual plausibility of the generated outputs, which guided the generator toward reducing artifacts such as color imbalance and channel-dependent edge degradation. In particular, the patchGAN discriminator, which operates on local image patches, contributes to the enhancement of fine structures such as cell boundaries and subcellular regions, enabling perceptually coherent and structurally faithful reconstructions.
The reliability of this analysis was further supported by the intensity profile results presented in Table 2. According to the intensity profile evaluation, the GAN models based on the U-Net architecture exhibited superior performances in terms of the MSE and MAE. This indicated that the GAN-based models achieve higher quantitative accuracy in estimating the signal intensity and distribution in multichannel images. In particular, the accurate restoration of signal distribution across multiple channels can significantly contribute to enhancing both the contrast and resolution between structures in stained light microscopy images. On the other hand, with respect to structural similarity evaluated by the Pearson correlation coefficient (PCC), the nested U-Net model demonstrated the highest correlation with the label data compared to conventional U-Net and GAN-based models. This suggests that the nested U-Net architecture partially overcame the limitations of the basic U-Net in representing structural patterns.
On the other hand, the GAN model incorporating a nested U-Net architecture yielded slightly lower PCC values than the standalone nested U-Net. This result indicated that, in the process of enhancing visual sharpness, the GAN may have overemphasized high-frequency details, leading to the appearance of artificial edges or distortions that deviated from the actual structural features. These findings imply that although the nested U-Net performs well in restoring boundary information, its integration within a GAN framework requires more careful tuning of the perceptual loss. Moreover, introducing a global discriminator loss in parallel may contribute to suppressing excessive high-frequency enhancement and supporting the preservation of overall structural continuity. With further refinement, the model could be developed into a more advanced framework that more reliably restores both the signal intensity and spatial distribution in multichannel stained light microscopy images, while also preserving fine structural detail.
In addition, the proposed super-resolution model demonstrated overall strong performance in high-frequency restoration; however, several limitations were also clearly observed. As illustrated in Figure 5 and Figure 6, when magnifying the salivary gland region, the model successfully reconstructed prominent boundary signals; however, small and fine edge structures were either blurred or partially omitted. This limitation was presumed to result from the extreme downscaling of input data during training, which likely caused the loss of detailed boundary information. Additionally, certain fine boundary signals exhibited statistical properties similar to background noise, leading the model to mistakenly suppress them as noise [55,56,57]. To address these shortcomings, it is anticipated that incorporating pre- or post-processing techniques such as deblurring algorithms could enhance the preservation of fine structures and enable more precise edge restoration.
In addition, although multiple-slice images were used for model training, the dataset was constructed based on a single embryo specimen. Therefore, further validation using a more diverse set of embryo samples is required to ensure the generalizability of the results. In addition, while perceptual loss was employed to capture structural similarities along with signal intensity and distribution across channels, the super-resolution model followed the conventional U-Net-based architecture [58,59,60]. To further enhance the super-resolution performance proposed in this study, future work should consider structural modifications or extensions of the model, such as optimized layer configurations, the use of multi-resolution inputs, and the integration of color correction subnetworks [61,62,63].

5. Conclusions

In this study, we proposed a nested U-Net-based GAN model for the super-resolution reconstruction of stained light microscopy images. We first identified the structural representation limitations of conventional U-Net-based models and addressed them by employing a nested U-Net architecture as the generator, which was advantageous for restoring cellular boundaries and fine structures. The perceptual loss was incorporated to enhance the visual quality of the reconstructed images. The experimental results demonstrated that the proposed model outperformed the conventional U-Net and GAN-based models in terms of quantitative metrics such as PSNR, SSIM, and PCC. Furthermore, the model showed improved performance in restoring the signal intensity, distribution, and structural information in the stained microscopy images.

Author Contributions

Conceptualization, S.-H.K. and J.-Y.K.; formal analysis, S.-H.K.; investigation, S.-H.K. and J.-Y.K.; methodology, J.-Y.K.; software, S.-H.K.; writing of the original draft, S.-H.K. and J.-Y.K.; writing, review, and editing, S.-H.K. and J.-Y.K. All authors have read and agreed to the published version of the manuscript.

Funding

This research received no external funding.

Institutional Review Board Statement

Not applicable.

Informed Consent Statement

Not applicable.

Data Availability Statement

Data will be made available on request.

Conflicts of Interest

The authors declare no conflicts of interest.

References

  1. Friedrich, R.P.; Kappes, M.; Cicha, I.; Tietze, R.; Braun, C.; Schneider-Stock, R.; Nagy, R.; Alexiou, C.; Janko, C. Optical microscopy systems for the detection of unlabeled nanoparticles. Int. J. Nanomed. 2022, 17, 2139–2163. [Google Scholar] [CrossRef] [PubMed]
  2. Nikitaev, V.G.; Tupitsyn, N.N.; Pronichev, A.N.; Dmitrieva, V.V.; Polyakov, E.V.; Liberis, K.A.; Grigorieva, M.S.; Paladina, A.D. Analysis of biological objects by digital optical microscopy using neural networks. Bull. Lebedev Phys. Inst. 2021, 48, 332–336. [Google Scholar] [CrossRef]
  3. Jiang, Z.; Wang, D.; Zheng, Y.; Liu, C.; Wang, Q.H. Continuous optical zoom microscopy imaging system based on liquid lenses. Opt. Express 2021, 29, 20322–20335. [Google Scholar] [CrossRef]
  4. Klimas, A.; Gallagher, B.R.; Wijesekara, P.; Fekir, S.; DiBernardo, E.F.; Cheng, Z.; Stolz, D.B.; Cambi, F.; Watkins, S.C.; Brody, S.L.; et al. Magnify is a universal molecular anchoring strategy for expansion microscopy. Nat. Biotechnol. 2023, 41, 858–869. [Google Scholar] [CrossRef]
  5. Melanthota, S.K.; Gopal, D.; Chakrabarti, S.; Kashyap, A.A.; Radhakrishnan, R.; Mazumder, N. Deep learning-based image processing in optical microscopy. Biophys. Rev. 2022, 14, 463–481. [Google Scholar] [CrossRef]
  6. Chen, M.; Liu, Y.T.; Khan, F.S.; Fox, M.C.; Reichenberg, J.S.; Lopes, F.C.P.S.; Sebastian, K.R.; Markey, M.K.; Tunnell, J.W. Single color digital H&E staining with In-and-Out Net. Comput. Med. Imaging Graph. 2024, 118, 102468. [Google Scholar]
  7. Hoque, M.Z.; Keskinarkaus, A.; Nyberg, P.; Seppänen, T. Stain normalization methods for histopathology image analysis: A comprehensive review and experimental comparison. Inf. Fusion 2024, 102, 101997. [Google Scholar] [CrossRef]
  8. Fan, Z.; Yang, Y.; Hu, P.; Huang, Y.; He, L.; Hu, R.; Zhao, K.; Zhang, H.; Liu, C. Molecular mechanism of ethylparaben on zebrafish embryo cardiotoxicity based on transcriptome analyses. Sci. Total Environ. 2022, 842, 156785. [Google Scholar] [CrossRef] [PubMed]
  9. Fives, C.; Toulouse, A.; Kenny, L.; Brosnan, T.; McCarthy, J.; Fitzgerald, B. Cytology techniques can provide insight into human placental structure including syncytiotrophoblast nuclear spatial organisation. J. Dev. Biol. 2023, 11, 46. [Google Scholar] [CrossRef]
  10. Ekoka Mbassi, F.-A.; Mombo-Ngoma, G.; Ndzebe Ndoumba, W.; Yovo, E.K.; Eberhardt, K.A.; Ekoka Mbassi, D.; Adegnika, A.A.; Agnandji, S.T.; Bouyou-Akotet, M.K.; Ramharter, M.; et al. Comparison of special stains (Giemsa stain and modified toluidine blue stain) with immunohistochemistry as gold standard for the detection of H. pylori in gastric biopsies. Arab J. Gastroenterol. 2022, 23, 75–81. [Google Scholar]
  11. Park, C.-H.; Kwon, H. Quality assessment of Wright-Giemsa staining in digital cell imaging. J. Lab. Med. Qual. Assur. 2023, 45, 18–24. [Google Scholar] [CrossRef]
  12. Yoon, C.; Park, E.; Misra, S.; Kim, J.Y.; Baik, J.W.; Kim, K.G.; Jung, C.K.; Kim, C. Deep learning-based virtual staining, segmentation, and classification in label-free photoacoustic histology of human specimens. Light Sci. Appl. 2024, 13, 226. [Google Scholar] [CrossRef] [PubMed]
  13. Gustafsson, M.G.L. Nonlinear structured-illumination microscopy: Wide-field fluorescence imaging with theoretically unlimited resolution. Proc. Natl. Acad. Sci. USA 2005, 102, 13081–13086. [Google Scholar] [CrossRef]
  14. Rust, M.J.; Bates, M.; Zhuang, X. Sub-diffraction-limit imaging by stochastic optical reconstruction microscopy (STORM). Nat. Methods 2006, 3, 793–796. [Google Scholar] [CrossRef] [PubMed]
  15. Axelrod, D. Total internal reflection fluorescence microscopy. Methods Cell Biol. 2008, 89, 169–221. [Google Scholar]
  16. Balzarotti, F.; Eilers, Y.; Gwosch, K.C.; Gynnå, A.H.; Westphal, V.; Stefani, F.D.; Elf, J.; Hell, S.W. Nanometer resolution imaging and tracking of fluorescent molecules with minimal photon fluxes. Science 2017, 355, 606–612. [Google Scholar] [CrossRef]
  17. Dertinger, T.; Colyer, R.; Iyer, G.; Weiss, S.; Enderlein, J. Fast, background-free, 3D super-resolution optical fluctuation imaging (SOFI). Proc. Natl. Acad. Sci. USA 2009, 106, 22287–22292. [Google Scholar] [CrossRef]
  18. Venkatachalapathy, M.; Belapurkar, V.; Jose, M.; Gautier, A.; Nair, D. Live cell super resolution imaging by radial fluctuations using fluorogen binding tags. Nanoscale 2019, 11, 3626–3632. [Google Scholar] [CrossRef]
  19. Shtengel, G.; Galbraith, J.A.; Galbraith, C.G.; Lippincott-Schwartz, J.; Gillette, J.M.; Manley, S.; Sougrat, R.; Waterman, C.M.; Kanchanawong, P.; Davidson, M.W.; et al. Interferometric fluorescent super-resolution microscopy resolves 3D cellular ultrastructure. Proc. Natl. Acad. Sci. USA 2009, 106, 3125–3130. [Google Scholar] [CrossRef]
  20. York, A.G.; Chandris, P.; Nogare, D.D.; Head, J.; Wawrzusin, P.; Fischer, R.S.; Chitnis, A.; Shroff, H. Instant super-resolution imaging in live cells and embryos via analog image processing. Nat. Methods 2013, 10, 1122–1126. [Google Scholar] [CrossRef]
  21. Chen, B.-C.; Legant, W.R.; Wang, K.; Shao, L.; Milkie, D.E.; Davidson, M.W.; Janetopoulos, C.; Wu, X.S.; Hammer, J.A., III; Liu, Z.; et al. Lattice light-sheet microscopy: Imaging molecules to embryos at high spatiotemporal resolution. Science 2014, 346, 1257998. [Google Scholar] [CrossRef] [PubMed]
  22. Hüpfel, M.; Kobitski, Y.; Zhang, W.; Nienhaus, G.U. Wavelet-based background and noise subtraction for fluorescence microscopy images. Biomed. Opt. Express 2021, 12, 969–980. [Google Scholar] [CrossRef] [PubMed]
  23. Gao, X.; Huang, T.; Tang, P.; Di, J.; Zhong, L.; Zhang, W. Enhancing scanning electron microscopy imaging quality of weakly conductive samples through unsupervised learning. Sci. Rep. 2024, 14, 6439. [Google Scholar] [CrossRef]
  24. Zhang, H.; Zhen, J.; Wu, Y.; Wu, R.; Luo, Z.; Liu, M.; Luo, J.; Xie, R.; Yan, L. Fast color Fourier ptychographic microscopic imaging technology with fusion color correction. Opt. Laser Eng. 2024, 181, 108385. [Google Scholar] [CrossRef]
  25. Nehme, E.; Ferdman, B.; Weiss, L.E.; Naor, T.; Freedman, D.; Michaeli, T.; Shechtman, Y. Learning optimal wavefront shaping for multi-channel imaging. IEEE Trans. Pattern Anal. Mach. Intell. 2021, 43, 2179–2192. [Google Scholar] [CrossRef] [PubMed]
  26. Sun, X.; Zhang, Y.; Kong, L.; Peng, X.; Luo, Z.; Shi, J.; Tian, L. Multi-color channel gamma correction in fringe projection profilometry. Photonics 2025, 12, 74. [Google Scholar] [CrossRef]
  27. Borah, B.J.; Sun, C.K. A radial distortion compensation method for artifact-free multi-adjacent-tile stitching/mosaicking in mesoscopic optical microscopy. Proc. SPIE 2022, 11965, 95–98. [Google Scholar]
  28. Archit, A.; Freckmann, L.; Nair, S.; Khalid, N.; Hilt, P.; Rajashekar, V.; Freitag, M.; Teuber, C.; Buckley, G.; von Haaren, S.; et al. Segment anything for microscopy. Nat. Methods 2025, 22, 579–591. [Google Scholar] [CrossRef]
  29. Zhou, Z.; Kuang, W.; Wang, Z.; Huang, Z.L. ResNet-based image inpainting method for enhancing the imaging speed of single molecule localization microscopy. Opt. Express 2022, 30, 31766–31784. [Google Scholar] [CrossRef]
  30. Gong, D.; Ma, T.; Evans, J.; He, S. Deep neural networks for image super-resolution in optical microscopy by using modified hybrid task cascade U-Net. Prog. Electromagn. Res. 2021, 171, 185–199. [Google Scholar] [CrossRef]
  31. Shah, Z.H.; Müller, M.; Wang, T.-C.; Scheidig, P.M.; Schneider, A.; Schüttpelz, M.; Huser, T.; Schenck, W. Deep-learning based denoising and reconstruction of super-resolution structured illumination microscopy images. Photonics Res. 2021, 9, B168–B181. [Google Scholar] [CrossRef]
  32. Ronneberger, O.; Fischer, P.; Brox, T. U-Net: Convolutional networks for biomedical image segmentation. In Medical Image Computing and Computer-Assisted Intervention–MICCAI 2015; Springer: Berlin/Heidelberg, Germany, 2015; Volume 9351, pp. 234–241. [Google Scholar]
  33. Zhou, Z.; Siddiquee, M.M.R.; Tajbakhsh, N.; Liang, J. UNet++: A nested U-Net architecture for medical image segmentation. In Deep Learning in Medical Image Analysis and Multimodal Learning for Clinical Decision Support: 4th International Workshop, DLMIA 2018, and 8th International Workshop, ML-CDS 2018, Held in Conjunction with MICCAI 2018; Springer: Berlin/Heidelberg, Germany, 2018; Volume 11045, pp. 3–11. [Google Scholar]
  34. Creswell, A.; White, T.; Dumoulin, V.; Arulkumaran, K.; Sengupta, B.; Bharath, A.A. Generative adversarial networks: An overview. IEEE Signal Process. Mag. 2018, 35, 53–65. [Google Scholar] [CrossRef]
  35. Durgadevi, M. Generative adversarial network (GAN): A general review on different variants of GAN and applications. In Proceedings of the 2021 6th International Conference on Communication and Electronics Systems (ICCES), Coimbatore, India, 8–10 July 2021; pp. 1–8. [Google Scholar]
  36. Huang, J.; Luo, T.; Li, L.; Yang, G.; Xu, H.; Chang, C.C. ARWGAN: Attention-guided robust image watermarking model based on GAN. IEEE Trans. Instrum. Meas. 2023, 72, 1–17. [Google Scholar] [CrossRef]
  37. Ajitha, D.; Shanmugavalli, T.; Pillai, H.N. A deep learning approach for enhanced clarity: Transforming underwater imagery with U-Net GAN. Int. J. Adv. Res. Interdiscip. Sci. Endeav. 2025, 2, 561–569. [Google Scholar] [CrossRef]
  38. Rivenson, Y.; Göröcs, Z.; Günaydin, H.; Zhang, Y.; Wang, H.; Ozcan, A. Deep learning microscopy. Optica 2017, 4, 1437–1443. [Google Scholar] [CrossRef]
  39. Nehme, E.; Weiss, L.E.; Michaeli, T.; Shechtman, Y. Deep-STORM: Super-resolution single-molecule microscopy by deep learning. Optica 2018, 5, 458–464. [Google Scholar] [CrossRef]
  40. Wang, H.; Rivenson, Y.; Jin, Y.; Wei, Z.; Gao, R.; Günaydın, H.; Bentolila, L.A.; Kural, C.; Ozcan, A. Deep learning enables cross-modality super-resolution in fluorescence microscopy. Nat. Methods 2019, 16, 103–110. [Google Scholar] [CrossRef]
  41. Qiao, C.; Li, D.; Guo, Y.; Liu, C.; Jiang, T.; Dai, Q.; Li, D. Evaluation and development of deep neural networks for image super-resolution in optical microscopy. Nat. Methods 2021, 18, 194–202. [Google Scholar] [CrossRef] [PubMed]
  42. Sun, Q.; Yang, X.; Guo, J.; Zhao, Y.; Liu, Y. CIEGAN: A deep learning tool for cell image enhancement. Front. Genet. 2022, 13, 913372. [Google Scholar] [CrossRef]
  43. Chen, R.; Tang, X.; Zhao, Y.; Shen, Z.; Zhang, M.; Shen, Y.; Li, T.; Chung, C.H.Y.; Zhang, L.; Wang, J.; et al. Single-frame deep-learning super-resolution microscopy for intracellular dynamics imaging. Nat. Commun. 2023, 14, 2854. [Google Scholar] [CrossRef]
  44. Qiao, C.; Zeng, Y.; Meng, Q.; Chen, X.; Chen, H.; Jiang, T.; Wei, R.; Guo, J.; Fu, W.; Lu, H.; et al. Zero-shot learning enables instant denoising and super-resolution in optical fluorescence microscopy. Nat. Commun. 2024, 15, 4180. [Google Scholar] [CrossRef] [PubMed]
  45. Guo, M.; Wu, Y.; Hobson, C.M.; Su, Y.; Qian, S.; Krueger, E.; Christensen, R.; Kroeschell, G.; Bui, J.; Chaw, M.; et al. Deep learning-based aberration compensation improves contrast and resolution in fluorescence microscopy. Nat. Commun. 2025, 16, 313. [Google Scholar] [CrossRef]
  46. Wu, C.; Zou, Y.; Yang, Z. U-GAN: Generative adversarial networks with U-Net for retinal vessel segmentation. In Proceedings of the 2019 14th International Conference on Computer Science & Education (ICCSE), Coimbatore, India, 17–19 July 2019; pp. 642–646. [Google Scholar]
  47. He, Y.; Li, J.; Shen, S.; Liu, K.; Wong, K.K.; He, T.; Wong, S.T. Image-to-image translation of label-free molecular vibrational images for a histopathological review using the UNet+/seg-cGAN model. Biomed. Opt. Express 2022, 13, 1924–1938. [Google Scholar] [CrossRef] [PubMed]
  48. Di, Y.; Zhu, X.; Jin, X.; Dou, Q.; Zhou, W.; Duan, Q. Color-UNet++: A resolution for colorization of grayscale images using improved UNet++. Multimed. Tools Appl. 2021, 80, 35629–35648. [Google Scholar] [CrossRef]
  49. Wei, K.; Kong, W.; Liu, L.; Wang, J.; Li, B.; Zhao, B.; Li, Z.; Zhu, J.; Yu, G. CT synthesis from MR images using frequency attention conditional generative adversarial network. Comput. Biol. Med. 2024, 170, 107983. [Google Scholar] [CrossRef] [PubMed]
  50. Sajjadi, M.S.M.; Schölkopf, B.; Hirsch, M. EnhanceNet: Single image super-resolution through automated texture synthesis. In Proceedings of the IEEE International Conference on Computer Vision (ICCV), Venice, Italy, 22–29 October 2017; pp. 4491–4500. [Google Scholar]
  51. Aadarsh, Y.G.; Singh, G. Comparing UNet, UNet++, FPN, PAN and Deeplabv3+ for gastrointestinal tract disease detection. In Proceedings of the 2023 International Conference on Evolutionary Algorithms and Soft Computing Techniques (EASCT), Bengaluru, India, 20–21 October 2023; pp. 1–7. [Google Scholar]
  52. Chen, Y.-I.; Chang, Y.-J.; Liao, S.-C.; Nguyen, T.D.; Yang, J.; Kuo, Y.-A.; Hong, S.; Liu, Y.-L.; Rylander, H.G.; Santacruz, S.R.; et al. Generative adversarial network enables rapid and robust fluorescence lifetime image analysis in live cells. Commun. Biol. 2022, 5, 18. [Google Scholar] [CrossRef]
  53. Rivenson, Y.; Liu, T.; Wei, Z.; Zhang, Y.; De Haan, K.; Ozcan, A. PhaseStain: The digital staining of label-free quantitative phase microscopy images using deep learning. Light Sci. Appl. 2019, 8, 23. [Google Scholar] [CrossRef]
  54. Shaban, M.T.; Baur, C.; Navab, N.; Albarqouni, S. StainGAN: Stain style transfer for digital histological images. In Proceedings of the 2019 IEEE 16th International Symposium on Biomedical Imaging (ISBI 2019), Venice, Italy, 8–11 April 2019; pp. 953–956. [Google Scholar]
  55. Cheong, H.; Devalla, S.K.; Chuangsuwanich, T.; Tun, T.A.; Wang, X.; Aung, T.; Schmetterer, L.; Buist, M.L.; Boote, C.; Thiéry, A.H.; et al. OCT-GAN: Single step shadow and noise removal from optical coherence tomography images of the human optic nerve head. Biomed. Opt. Express 2021, 12, 1482–1498. [Google Scholar] [CrossRef]
  56. Lu, Y.; Ying, Y.; Lin, C.; Wang, Y.; Jin, J.; Jiang, X.; Shuai, J.; Li, X.; Zhong, J. UNet-Att: A self-supervised denoising and recovery model for two-photon microscopic image. Complex Intell. Syst. 2025, 11, 55. [Google Scholar] [CrossRef]
  57. Zhu, N.; Liu, C.; Forsyth, B.; Singer, Z.S.; Laine, A.F.; Danino, T.; Guo, J. Segmentation with residual attention U-Net and an edge-enhancement approach preserves cell shape features. In Proceedings of the 2022 44th Annual International Conference of the IEEE Engineering in Medicine & Biology Society (EMBC), Glasgow, UK, 11–15 July 2022; pp. 2115–2118. [Google Scholar]
  58. Cai, X.; Wang, G.; Lou, J.; Jian, M.; Dong, J.; Chen, R.C.; Stevens, B.; Yu, H. Perceptual loss guided generative adversarial network for saliency detection. Inf. Sci. 2024, 654, 119625. [Google Scholar] [CrossRef]
  59. Krawczyk, P.; Gaertner, M.; Jansche, A.; Bernthaler, T.; Schneider, G. Reducing artifact generation when using perceptual loss for image deblurring of microscopy data for microstructure analysis. Methods Microsc. 2025, 1, 137–150. [Google Scholar] [CrossRef]
  60. Cho, S.W.; Baek, N.R.; Koo, J.H.; Park, K.R. Modified perceptual cycle generative adversarial network-based image enhancement for improving accuracy of low light image segmentation. IEEE Access 2020, 9, 6296–6324. [Google Scholar] [CrossRef]
  61. Fan, Y.; Li, J.; Lu, L.; Sun, J.; Hu, Y.; Zhang, J.; Li, Z.; Shen, Q.; Wang, B.; Zhang, R.; et al. Smart computational light microscopes (SCLMs) of smart computational imaging laboratory (SCILab). PhotoniX 2021, 2, 19. [Google Scholar] [CrossRef]
  62. Ghaznavi, A.; Rychtáriková, R.; Saberioon, M.; Štys, D. Cell segmentation from telecentric bright-field transmitted light microscopy images using a residual attention U-Net: A case study on HeLa line. Comput. Biol. Med. 2022, 147, 105805. [Google Scholar] [CrossRef]
  63. Daksh, D.; Kaltbeitzel, A.; Landfester, K.; Lieberwirth, I. Multi-resolution cross-modality image registration using unsupervised deep learning approach. Microsc. Microanal. 2023, 29, 1964–1965. [Google Scholar] [CrossRef]
Figure 1. Illustration of the nested U-Net-based GAN model for super-resolution in stained light microscopy images.
Photonics 12 00665 g001
Figure 2. Stained light microscopy images of mouse embryo head with applied super-resolution models: (a) Label, (b) input, (c) U-Net, (d) nested U-Net, (e) U-Net-based GAN, and (f) nested U-Net-based GAN model.
Photonics 12 00665 g002
Figure 3. Magnified stained light microscopy images of mouse embryo teeth enhanced by super-resolution models: (a) Label, (b) input, (c) U-Net, (d) nested U-Net, (e) U-Net-based GAN, and (f) nested U-Net-based GAN model.
Photonics 12 00665 g003
Figure 4. Stained light microscopy images of mouse embryo head with applied super-resolution models (case 2): (a) Label, (b) input, (c) U-Net, (d) nested U-Net, (e) U-Net-based GAN, and (f) nested U-Net-based GAN model.
Photonics 12 00665 g004
Figure 5. Magnified stained light microscopy images of mouse embryo salivary gland enhanced by super-resolution models: (a) Label, (b) input, (c) U-Net, (d) nested U-Net, (e) U-Net-based GAN, and (f) nested U-Net-based GAN model.
Photonics 12 00665 g005
Figure 6. Enlarged stained light microscopy image regions of the mouse embryonic salivary gland enhanced by each super-resolution model for comparative visual analysis.
Photonics 12 00665 g006
Figure 7. Quantitative evaluation results of models for super-resolution of stained optical microscopy images: (a) Peak signal-to-noise ratio, (b) structural similarity index (SSIM), and (c) correlation coefficient (CC).
Photonics 12 00665 g007
Figure 8. Intensity profiles of the tooth region in stained optical microscopy images of a mouse embryo obtained from various super-resolution models.
Photonics 12 00665 g008
Table 1. Prior studies on deep learning-based super-resolution model development for optical microscopy images.
AuthorYearInput TypeArchitectureGenerator
Loss
Discriminator
Loss
Notable
Features
Rivvenson et al. [38]2017MultichannelDCNNL2 Registration-based dataset, direct image-to-image mapping, self-feeding
Nehme et al. [39]2018Single channelFCNL1 + L2 Localization-free reconstruction,
sparse regression optimization
Wang et al. [40]2019MultichannelU-Net + patchGANMSE, SSIMBCEHybrid loss design, platform-adaptive, patch-based discriminator
Qiao et al. [41]2021MultichannelcGAN + Fourier Channel AttentionMSE, SSIM, BCEBCESpatial-frequency domain integration
Sun et al. [42]2022MultichannelDCGANMSE, VGG19, Gram, TVBCEMulti-component loss for texture restoration
Chen et al. [43]2023MultichannelU-Net + Residual-dense based patchGANL1, SSIM, VGG19BCEDual-stage (signal enhancement + SR),
U-Net discriminator, frequency domain L1
Qiao et al. [44]2024MultichannelU-Net + 3D RCANMSE, Hessian Reg., Gap Amend. Reg. Self-supervised with image re-corruption, dual-stage denoise + deconvolution
Guo et al. [45]2025Multichannel3D RCANMSE Multi-stage synthetic degradation for self-supervision, scalable multi-step restoration
Table 2. Quantitative evaluation results of super-resolution models based on intensity profiles.
ModelMSEMAEPCC
Input 1.03 × 10 3 2.59 × 10 2 0.949
U-Net 4.12 × 10 3 5.81 × 10 2 0.963
Nested U-Net 1.32 × 10 3 3.14 × 10 2 0.979
U-Net-based GAN 6.91 × 10 4 2.12 × 10 2 0.966
Nested U-Net-based GAN 5.97 × 10 4 1.97 × 10 2 0.972
Disclaimer/Publisher’s Note: The statements, opinions and data contained in all publications are solely those of the individual author(s) and contributor(s) and not of MDPI and/or the editor(s). MDPI and/or the editor(s) disclaim responsibility for any injury to people or property resulting from any ideas, methods, instructions or products referred to in the content.

