Article

Chaotic Image Encryption System as a Proactive Scheme for Image Transmission in FSO High-Altitude Platform

1
Institute of Electronic Information Engineering, Changchun University of Science and Technology, Changchun 130022, China
2
National and Local Joint Engineering Research Center of Space Optoelectronics Technology, Changchun University of Science and Technology, Changchun 130022, China
*
Author to whom correspondence should be addressed.
Photonics 2025, 12(7), 635; https://doi.org/10.3390/photonics12070635
Submission received: 11 May 2025 / Revised: 15 June 2025 / Accepted: 21 June 2025 / Published: 23 June 2025

Abstract

To further enhance the stability and security of image transmission in FSO (Free Space Optics) aviation platforms, this paper proposes a communication transmission scheme that integrates a chaotic image encryption system with the HAP (high-altitude platform) environment. This scheme effectively combines the chaotic image encryption algorithm with the atmospheric turbulence channel transmission process, improving the anti-interference capabilities and security of HAP optical communication for image transmission. First, a five-dimensional hyperchaotic system with complex dynamic characteristics is introduced, and the system’s chaotic behaviors and dynamic properties are explored. The improved system model incorporates chaotic mapping and DNA coding techniques, forming a robust chaotic image encryption system, whose performance is experimentally validated. Next, the feasibility of integrating the chaotic image encryption system with HAP optical communication is discussed. A detailed description of the corresponding turbulence model and test conditions is provided. To verify the scheme’s feasibility, plaintext images of varying sizes are selected for experiments, comparing the transmission performance of both unencrypted and encrypted images under three turbulence levels: weak, medium, and strong. The impact on image communication quality is quantitatively analyzed using PSNR (Peak Signal-to-Noise Ratio) and SSIM (Structural Similarity Index measure). Finally, the effect of malicious interception attacks, caused by noise interference from different levels of atmospheric turbulence, is examined. The robustness and feasibility of the proposed scheme are validated, providing a promising approach for integrating HAP optical communication’s anti-turbulence capabilities with chaotic image encryption.

1. Introduction

Due to the expensive nature of fiber optics deployment and the limited spectrum resources in RF systems, FSO communication has emerged as an optimal technology for data transmission. It offers significant advantages such as high capacity, high speed, wide bandwidth, and adaptable deployment, making it highly promising for future development [1,2,3,4,5]. FSO communication finds extensive applications in optical wireless communication, underwater communication, aviation platforms, high-altitude-to-ground communication, and various other fields [6,7,8,9,10]. In aviation platforms and high-altitude ground communication, FSO systems can provide flexible and reliable communication links, especially in scenarios that require rapid response, demonstrating unique advantages. FSO communications require the atmosphere as the transmission channel, and atmospheric turbulence is the key bottleneck that constrains performance. Atmospheric turbulence arises from random fluctuations in localized temperature, pressure, and wind speed in the atmosphere. These fluctuations lead to inhomogeneous refractive index of the air. Inhomogeneous refractive index of the air, in turn, causes a series of problems in the optical signal. These problems can seriously degrade the stability of communications. To further enhance the performance of FSO communication systems, researchers have investigated various advanced technologies. For instance, adaptive optics technology is employed to mitigate beam disturbances caused by atmospheric turbulence, thereby enhancing the stability of communication links and improving the quality of data transmission [11,12]. Furthermore, leveraging multiple-input multiple-output technology significantly enhances the transmission capacity and immunity to interference in FSO systems [13]. In the realm of relay transmission technology, researchers have proposed various relay schemes aimed at significantly improving communication distance and system reliability through strategic design of relay node positions and functions [14,15].
High-altitude platforms encompass a diverse array of application scenarios, such as satellite communications, airborne Internet nodes, and emergency communications [16,17]. The presence of atmospheric turbulence can cause signal attenuation and fluctuations, significantly affecting communication quality. By establishing precise channel models, researchers can gain better insights into and effectively address these challenges. Therefore, scholars are highly interested in modeling and analyzing HAPs. During this process, the influence of atmospheric turbulence is crucial, as it is the primary factor limiting the transmission performance of the link. The light intensity distribution under weak turbulence can be characterized by the Log-normal model. The Gamma–Gamma model serves as a versatile channel model for FSO communication systems, capable of simulating turbulent conditions ranging from weak to strong [18,19]. Ref. [20] examined the outage probability across different atmospheric turbulence channel models, emphasizing the benefits for high-altitude satellite applications. Meanwhile, Ref. [21] developed a communication system tailored for multiple HAPS, focusing on the uplink and leveraging research advancements to enhance overall network performance. Despite efforts by researchers to mitigate the effects of atmospheric turbulence and facilitate the transmission of critical data, there remains a notable gap in research concerning encrypted transmission of image information, particularly valuable in military and related domains.
To investigate the realizability of image transmission in FSO communication technology, Ref. [22] realized the effective transmission of FSO communication technology in wireless video transmission based on FPGA chip using compression sensing to realize the transmission of massive video data streams. Ref. [23] simulated the pixel encoding and decoding processes for image transmission in a 1 km horizontal turbulent channel, analyzing the impact of turbulence parameters and detector noise on system performance. While these studies enhanced system efficiency and analyzed influencing factors, there remain shortcomings in the security design of image transmission. Ref. [24] proposed a solution employing chaotic mapping and a three-dimensional filtering algorithm (C-BM3D) to enhance image security in turbulent channels, highlighting the efficacy of chaotic mapping algorithms for encryption as a suitable approach.
Chaotic systems possess intricate dynamic characteristics, including sensitivity to initial conditions, unpredictability, and complexity, which fulfill fundamental requirements for communication security [25,26,27]. Chaos mapping offers advantages such as a straightforward mathematical form, ease of implementation and programming, low computational overhead, and the capability to exhibit complex chaotic behavior under specific conditions, making it widely adopted in image encryption systems. However, the simplicity of chaotic mapping renders it susceptible to decryption, given its relatively limited key space, thereby increasing vulnerability to brute force attacks. In contrast, high-dimensional chaotic systems refer to chaotic systems with a dimensionality of three or more. These systems exhibit more intricate dynamic behaviors and larger chaotic attractors. Compared to chaotic mapping, the complexity inherent in high-dimensional systems significantly enhances system security, thwarting decryption attempts through simple analysis or attacks. Moreover, high-dimensional systems offer a broader parameter space, enabling a wider range of key selections and further bolstering security. Additionally, these systems generate highly complex chaotic trajectories, rendering encrypted data more challenging to predict and decrypt. Furthermore, multiple encryption schemes can be implemented, such as employing multiple state variables for multi-layer encryption, thereby augmenting data protection even further.
The intricate dynamic behaviors and chaotic characteristics exhibited by high-dimensional chaotic systems provide enhanced security in chaotic image encryption applications. Currently, researchers have shown considerable interest in constructing chaotic image encryption systems using these advanced chaotic systems [28,29]. Ref. [30] developed a sophisticated chaotic system to simulate chaotic image encryption using plaintext scrambling algorithms, demonstrating the effectiveness and security of their encryption approach. Ref. [31] introduced a one-time one-class chaotic image cipher integrating data steganography, encompassing both encryption of plaintext images and embedding of encrypted images. Ref. [32] proposed a fractional-order five-dimensional hyperchaotic system for generating chaotic sequences used in permutation and diffusion processes. They expanded DNA encoding rules and employed four DNA computation methods to enhance encryption scheme security. Additionally, Ref. [33] presented a cross-channel pixel recombination color image encryption scheme based on asymptotic shape synchronization using a three-dimensional chaotic system. Simulation results validated the algorithm’s capability to effectively conceal plaintext images and accurately restore them through asymptotic shape synchronization.
The aforementioned research outcomes clearly demonstrate that integrating high-dimensional chaotic systems with image encryption algorithms significantly expands the key space and enhances resistance against malicious attacks, thereby achieving robust security. The use of high-dimensional chaotic image encryption systems effectively filters out noise interference and mitigates malicious interception during both encryption and decryption processes, particularly beneficial in FSO communication to reduce transmission interferences. Furthermore, applying chaotic image encryption enhances image transmission security on aviation platforms by encrypting plaintext images. With the aim of enhancing performance and security in image transmission on FSO aviation platforms, this study proposes an enhanced five-dimensional hyperchaotic system combined with DNA coding technology to develop a chaotic image encryption algorithm. The research focuses on analyzing and evaluating the performance and security of image transmission within aviation platform environments. A novel image transmission modeling scheme is constructed by integrating these technologies, and its feasibility is demonstrated through comparative experiments.
The details of the study are as follows: 
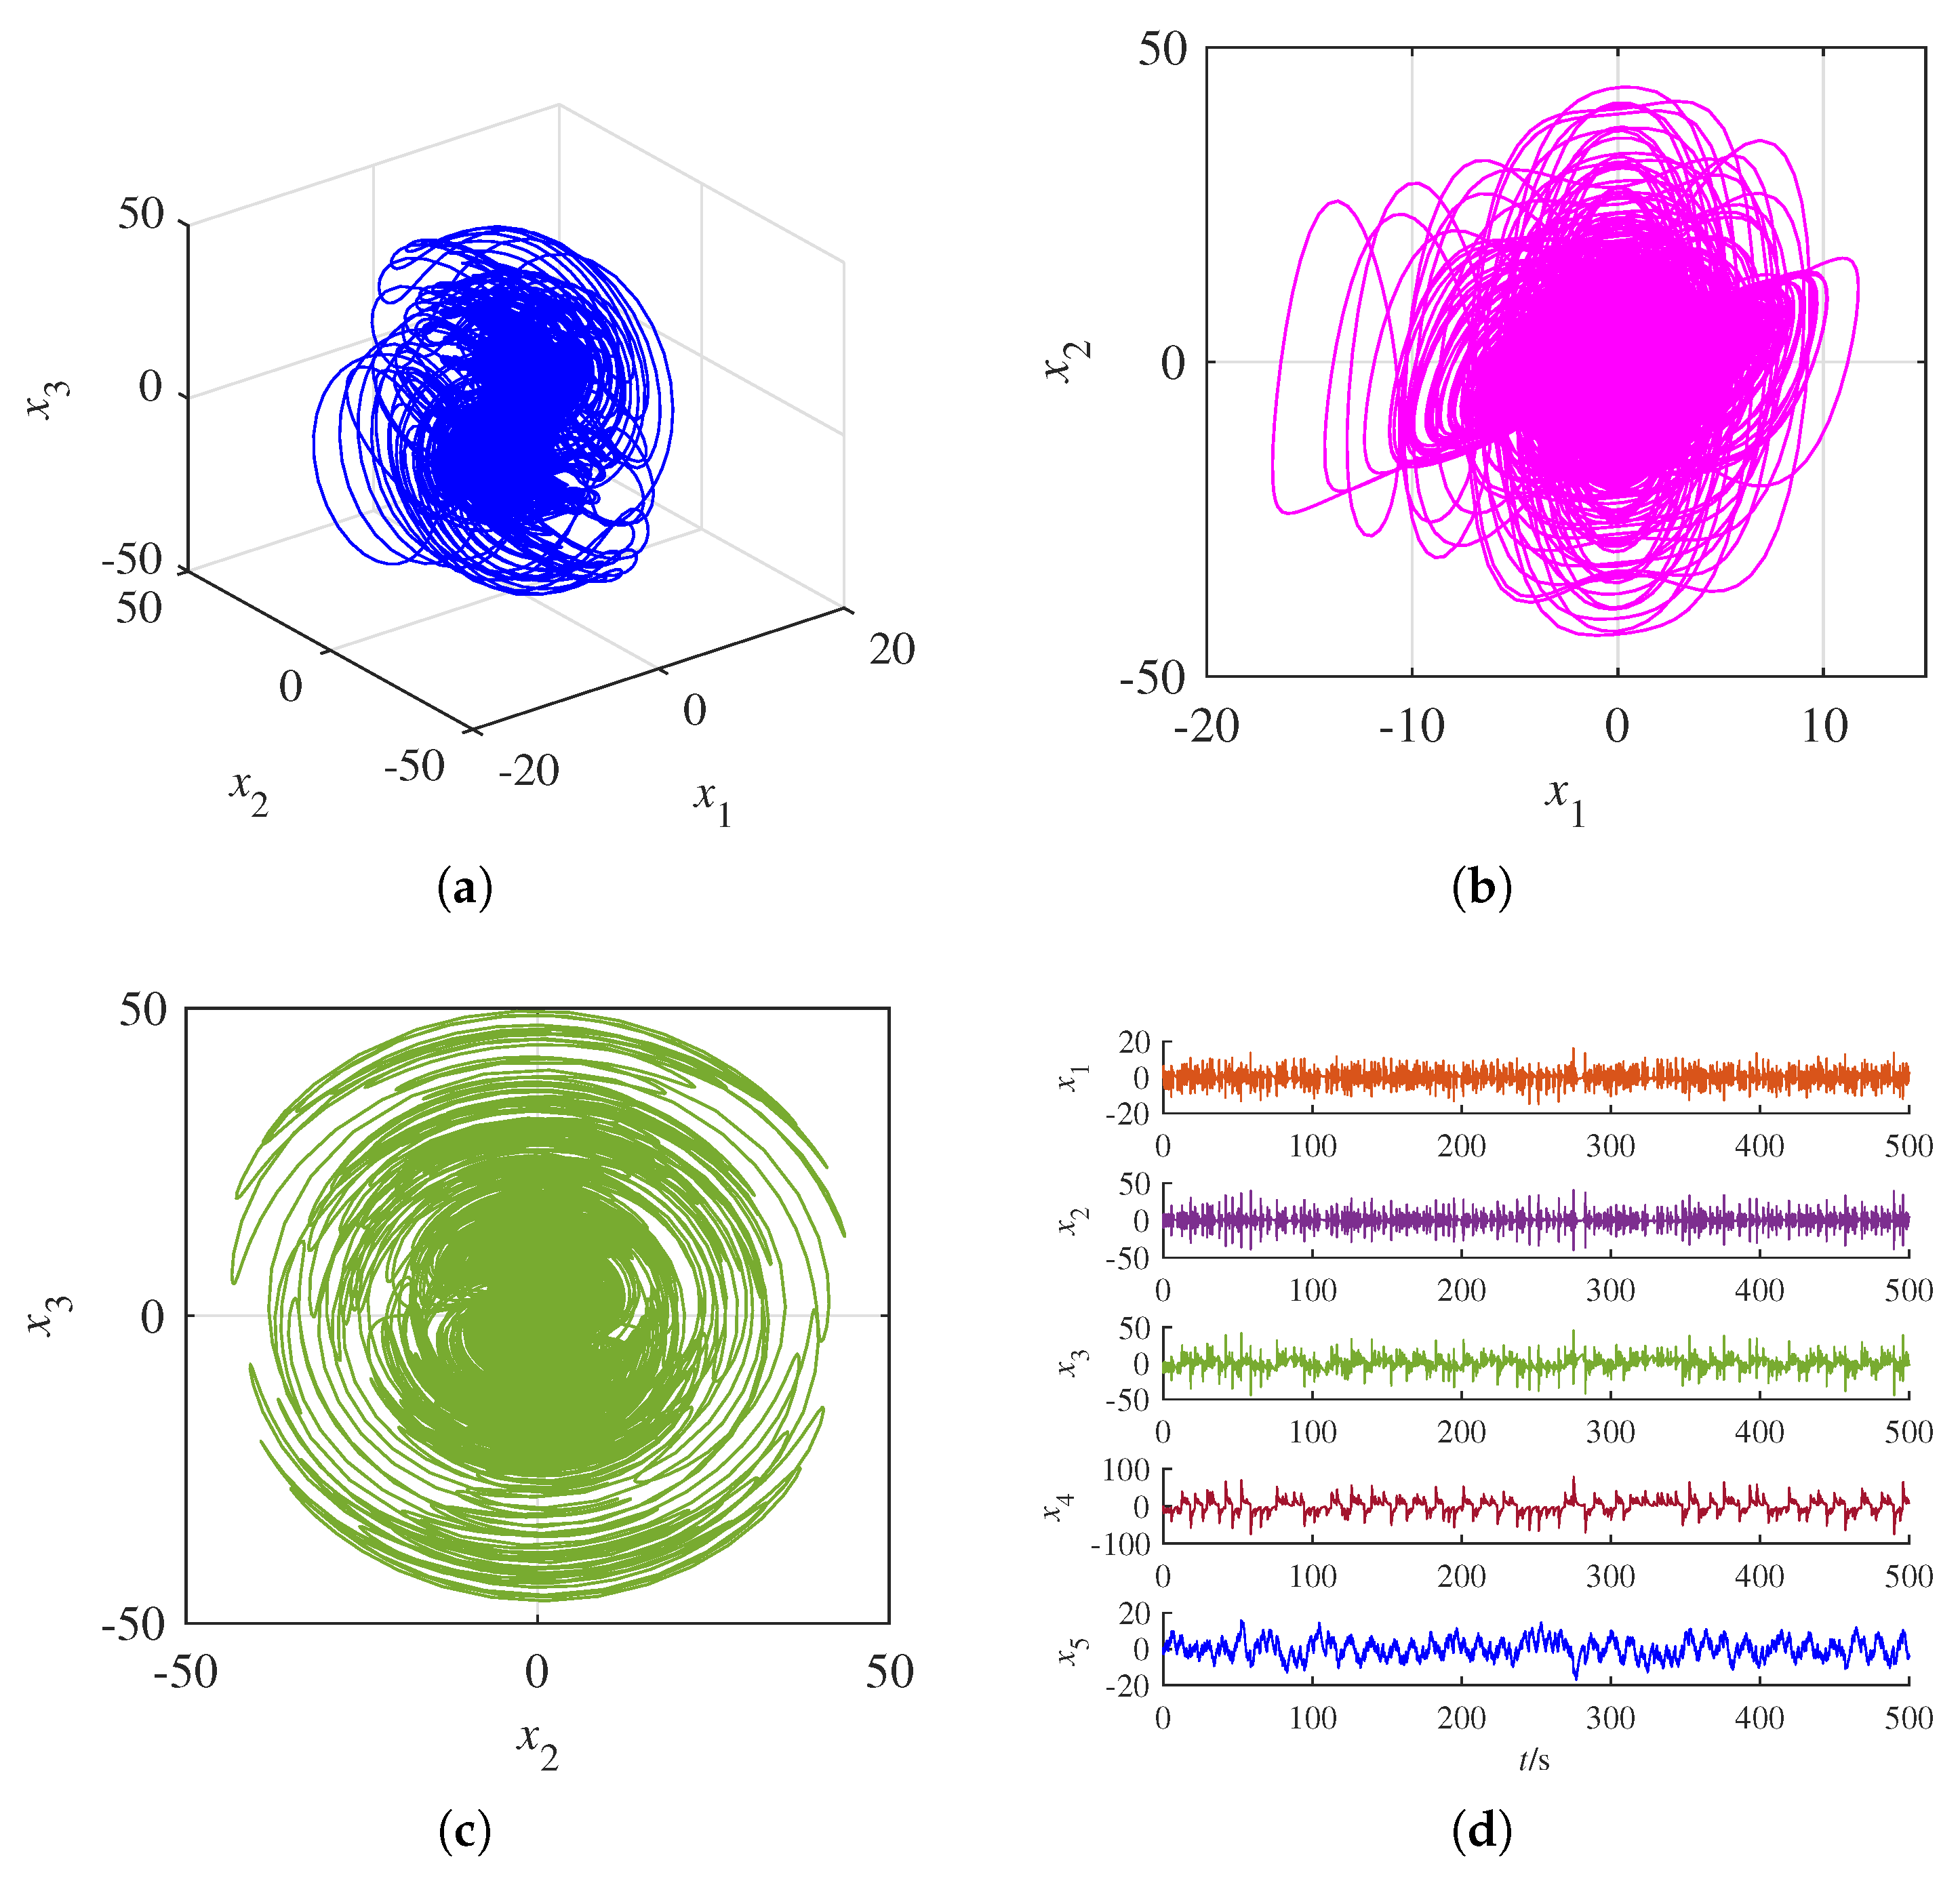
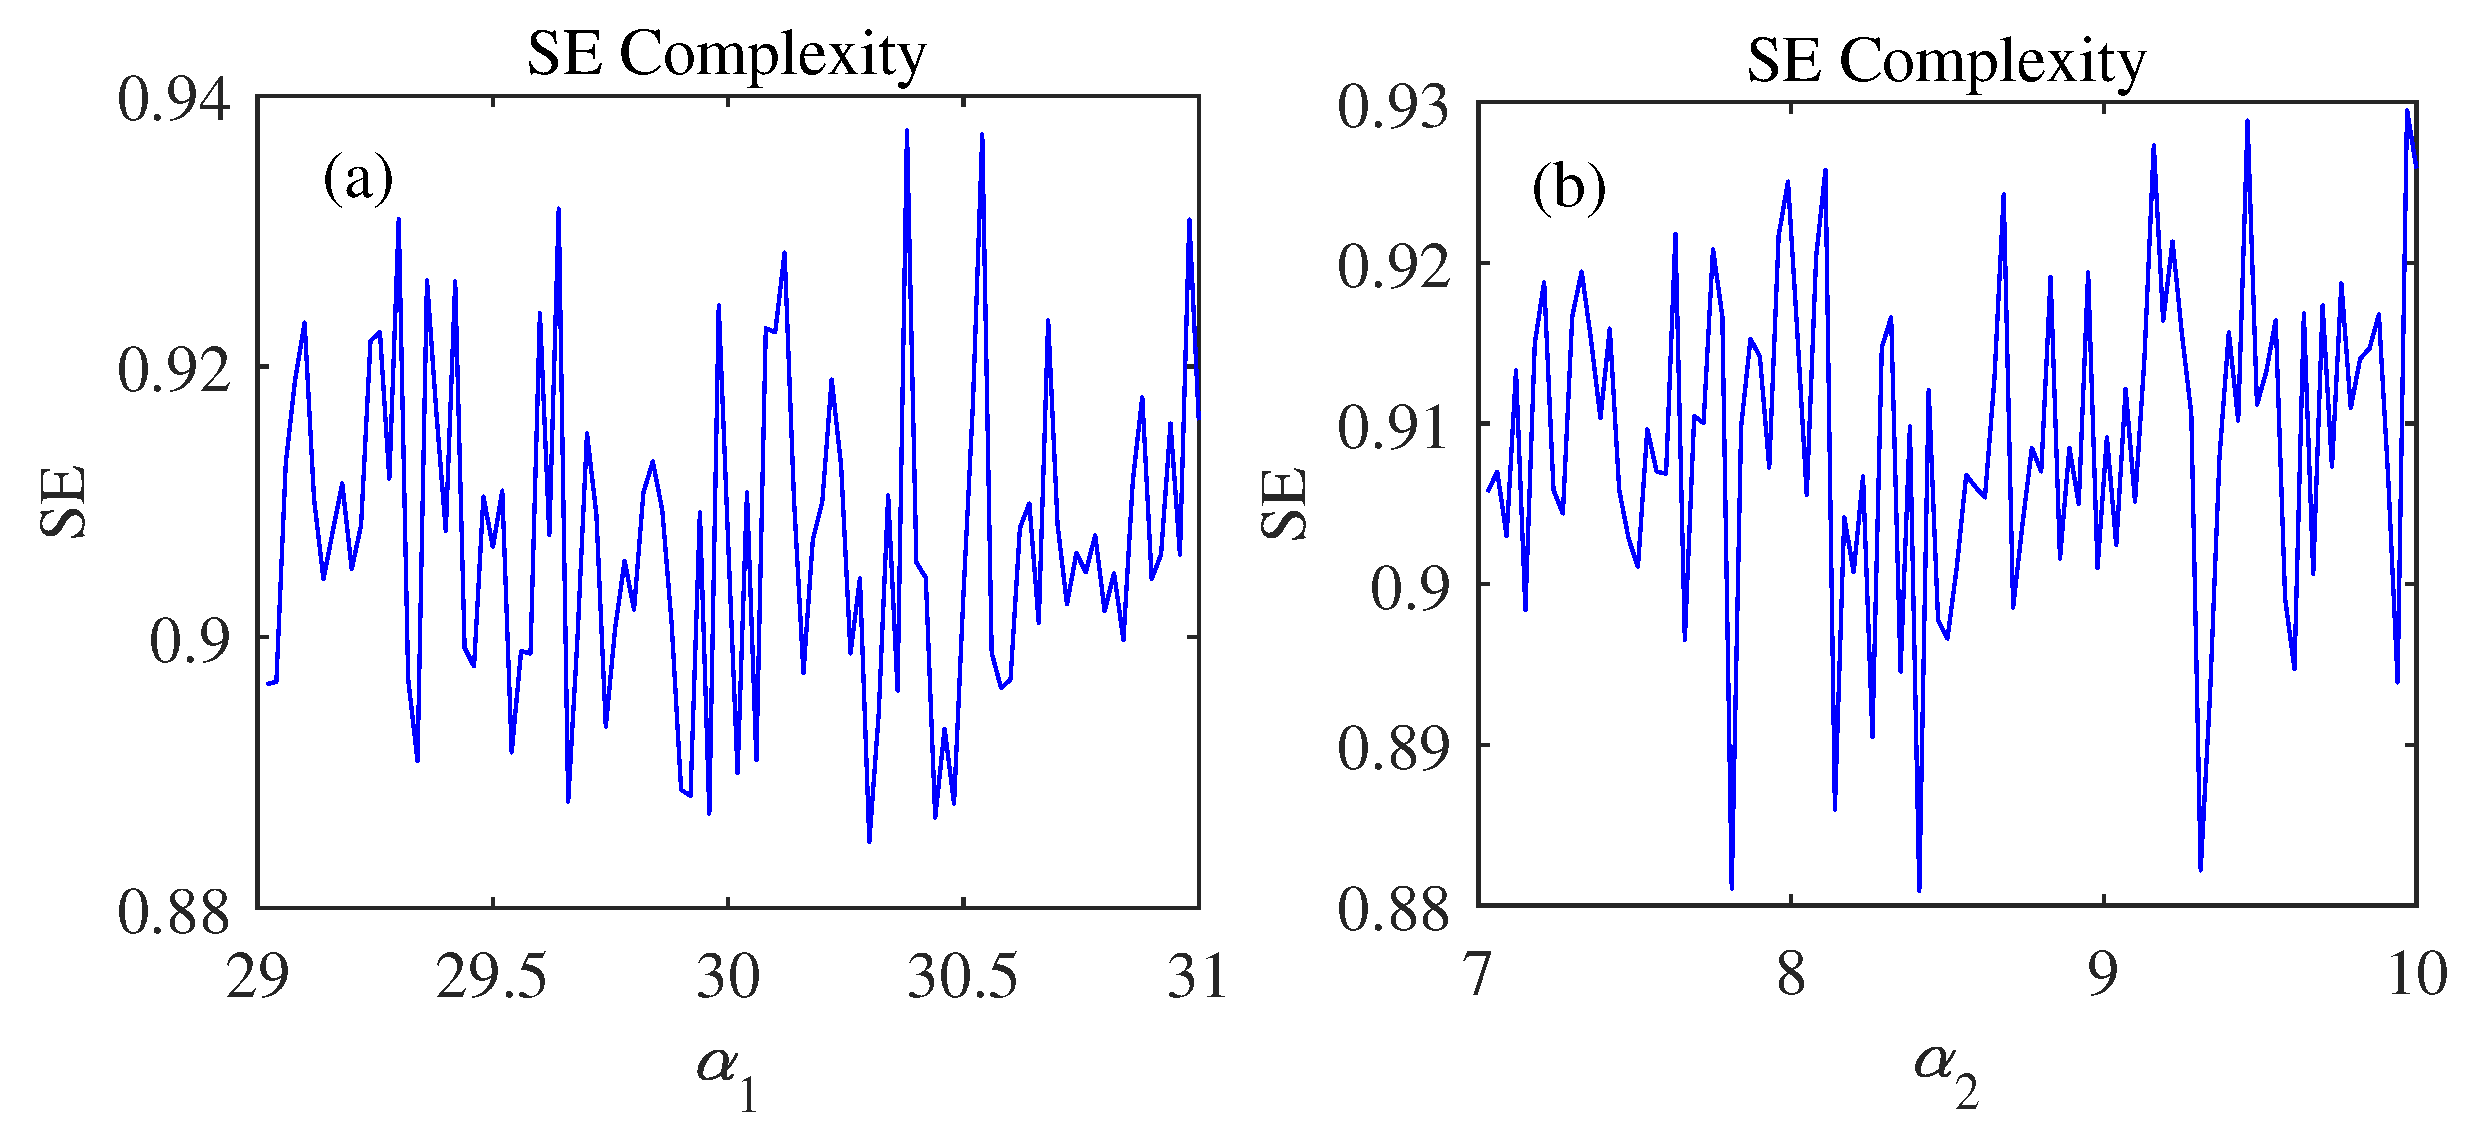
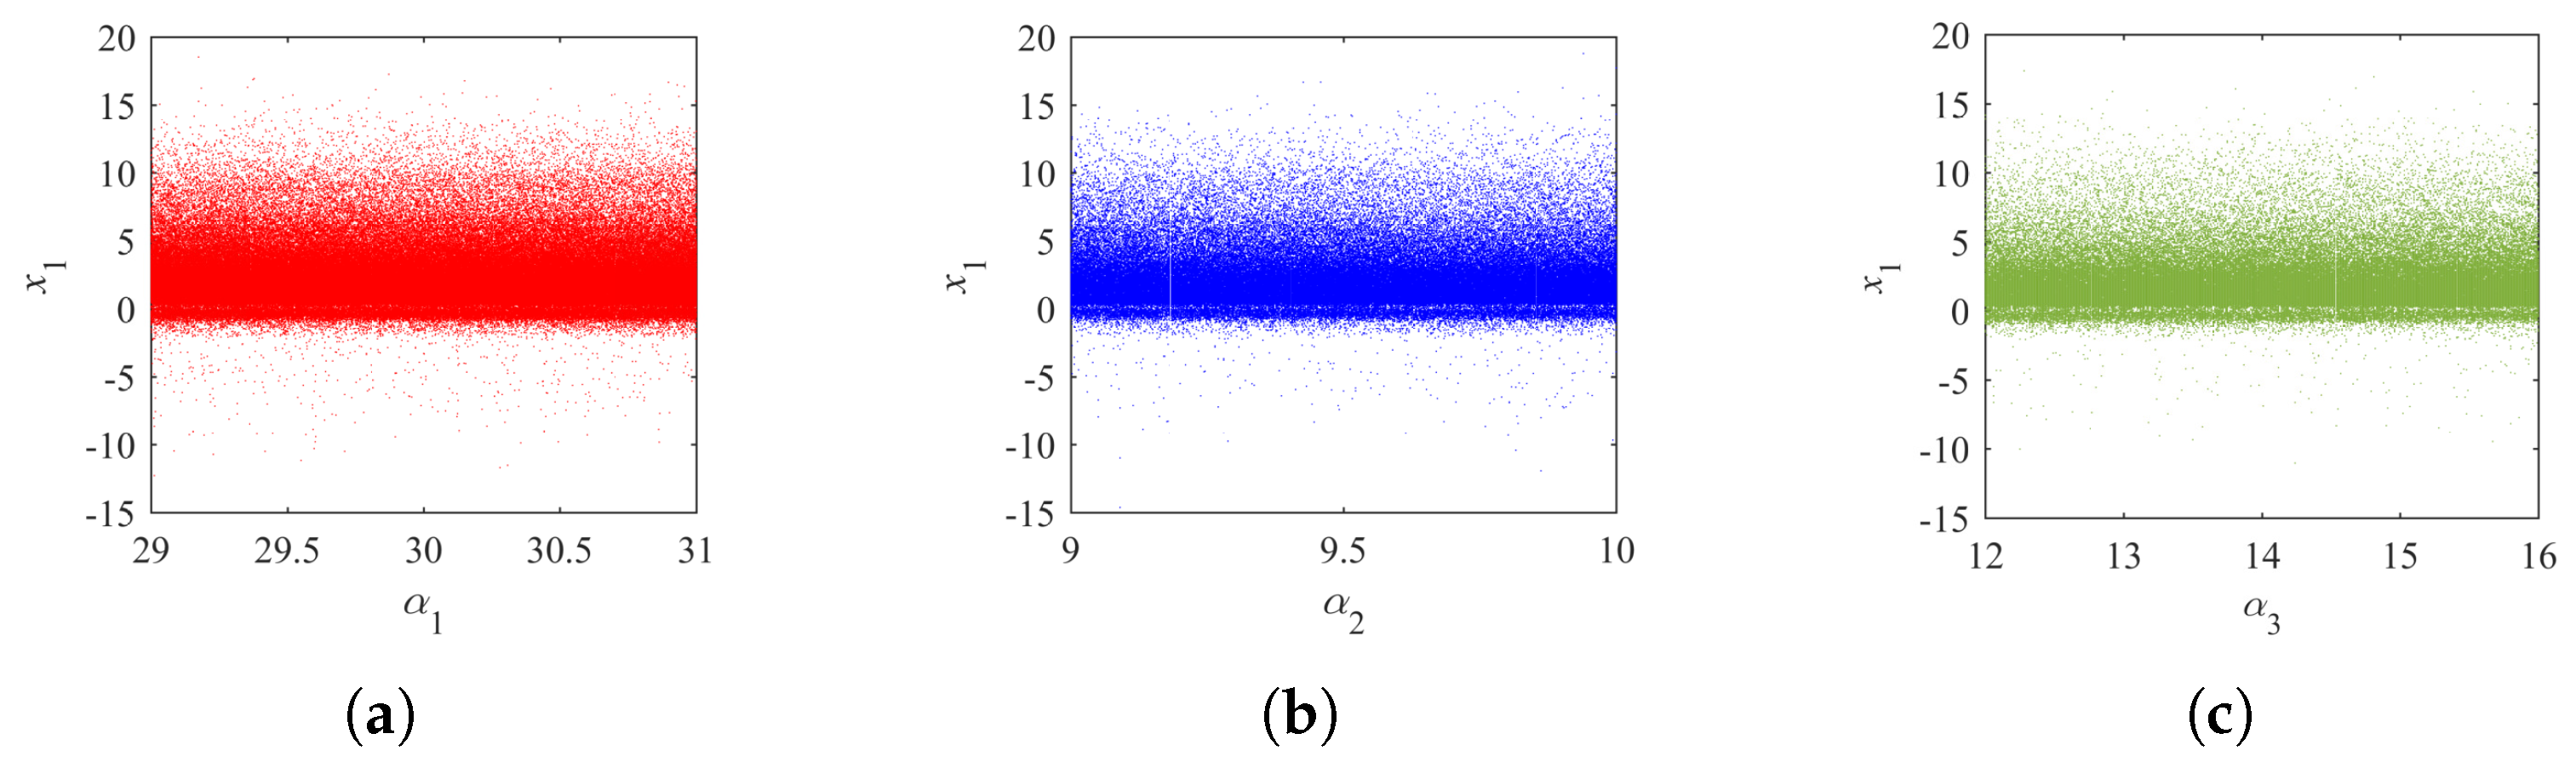
Section 2 introduces the improved five-dimensional hyperchaotic system model and dynamic behavior. The hyperchaotic system is applied to the image encryption algorithm, and the algorithm’s ability to resist attacks is tested. Section 3 shows the experimental scheme and scheme parameters and explains the turbulence model used in the scheme. At the same time, the evaluation indicators of the quality of the original image and the restored image are given. 
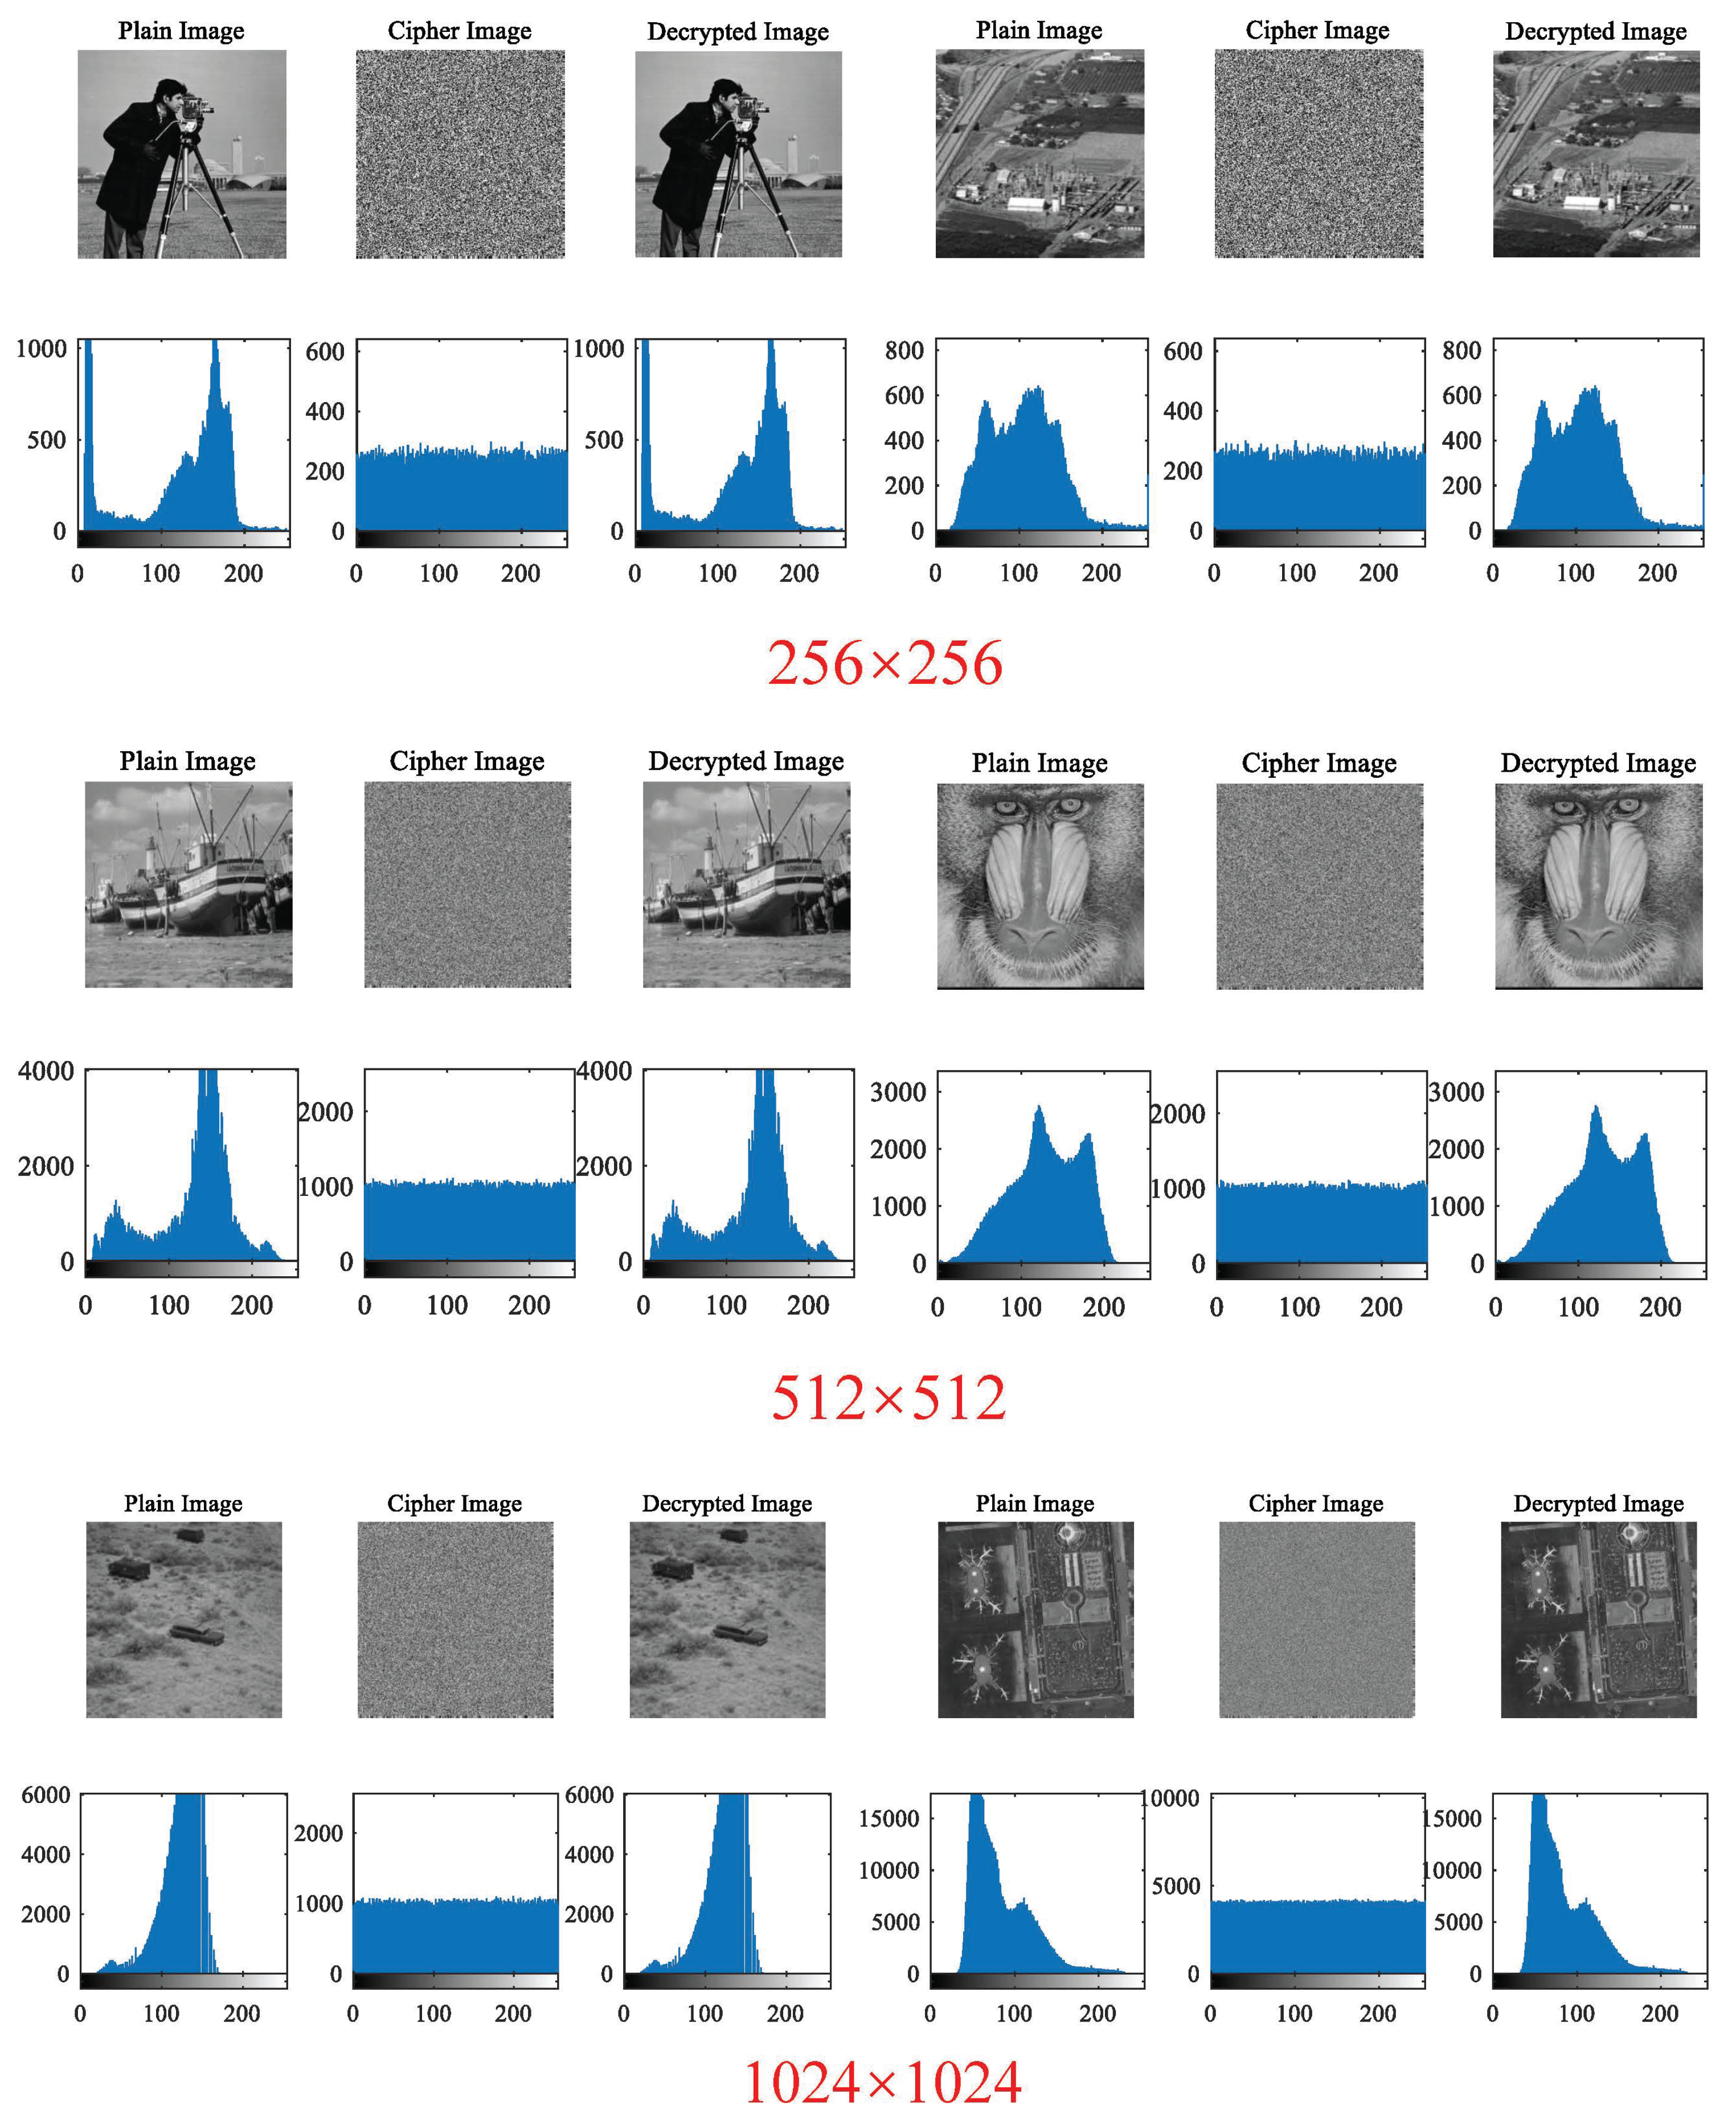
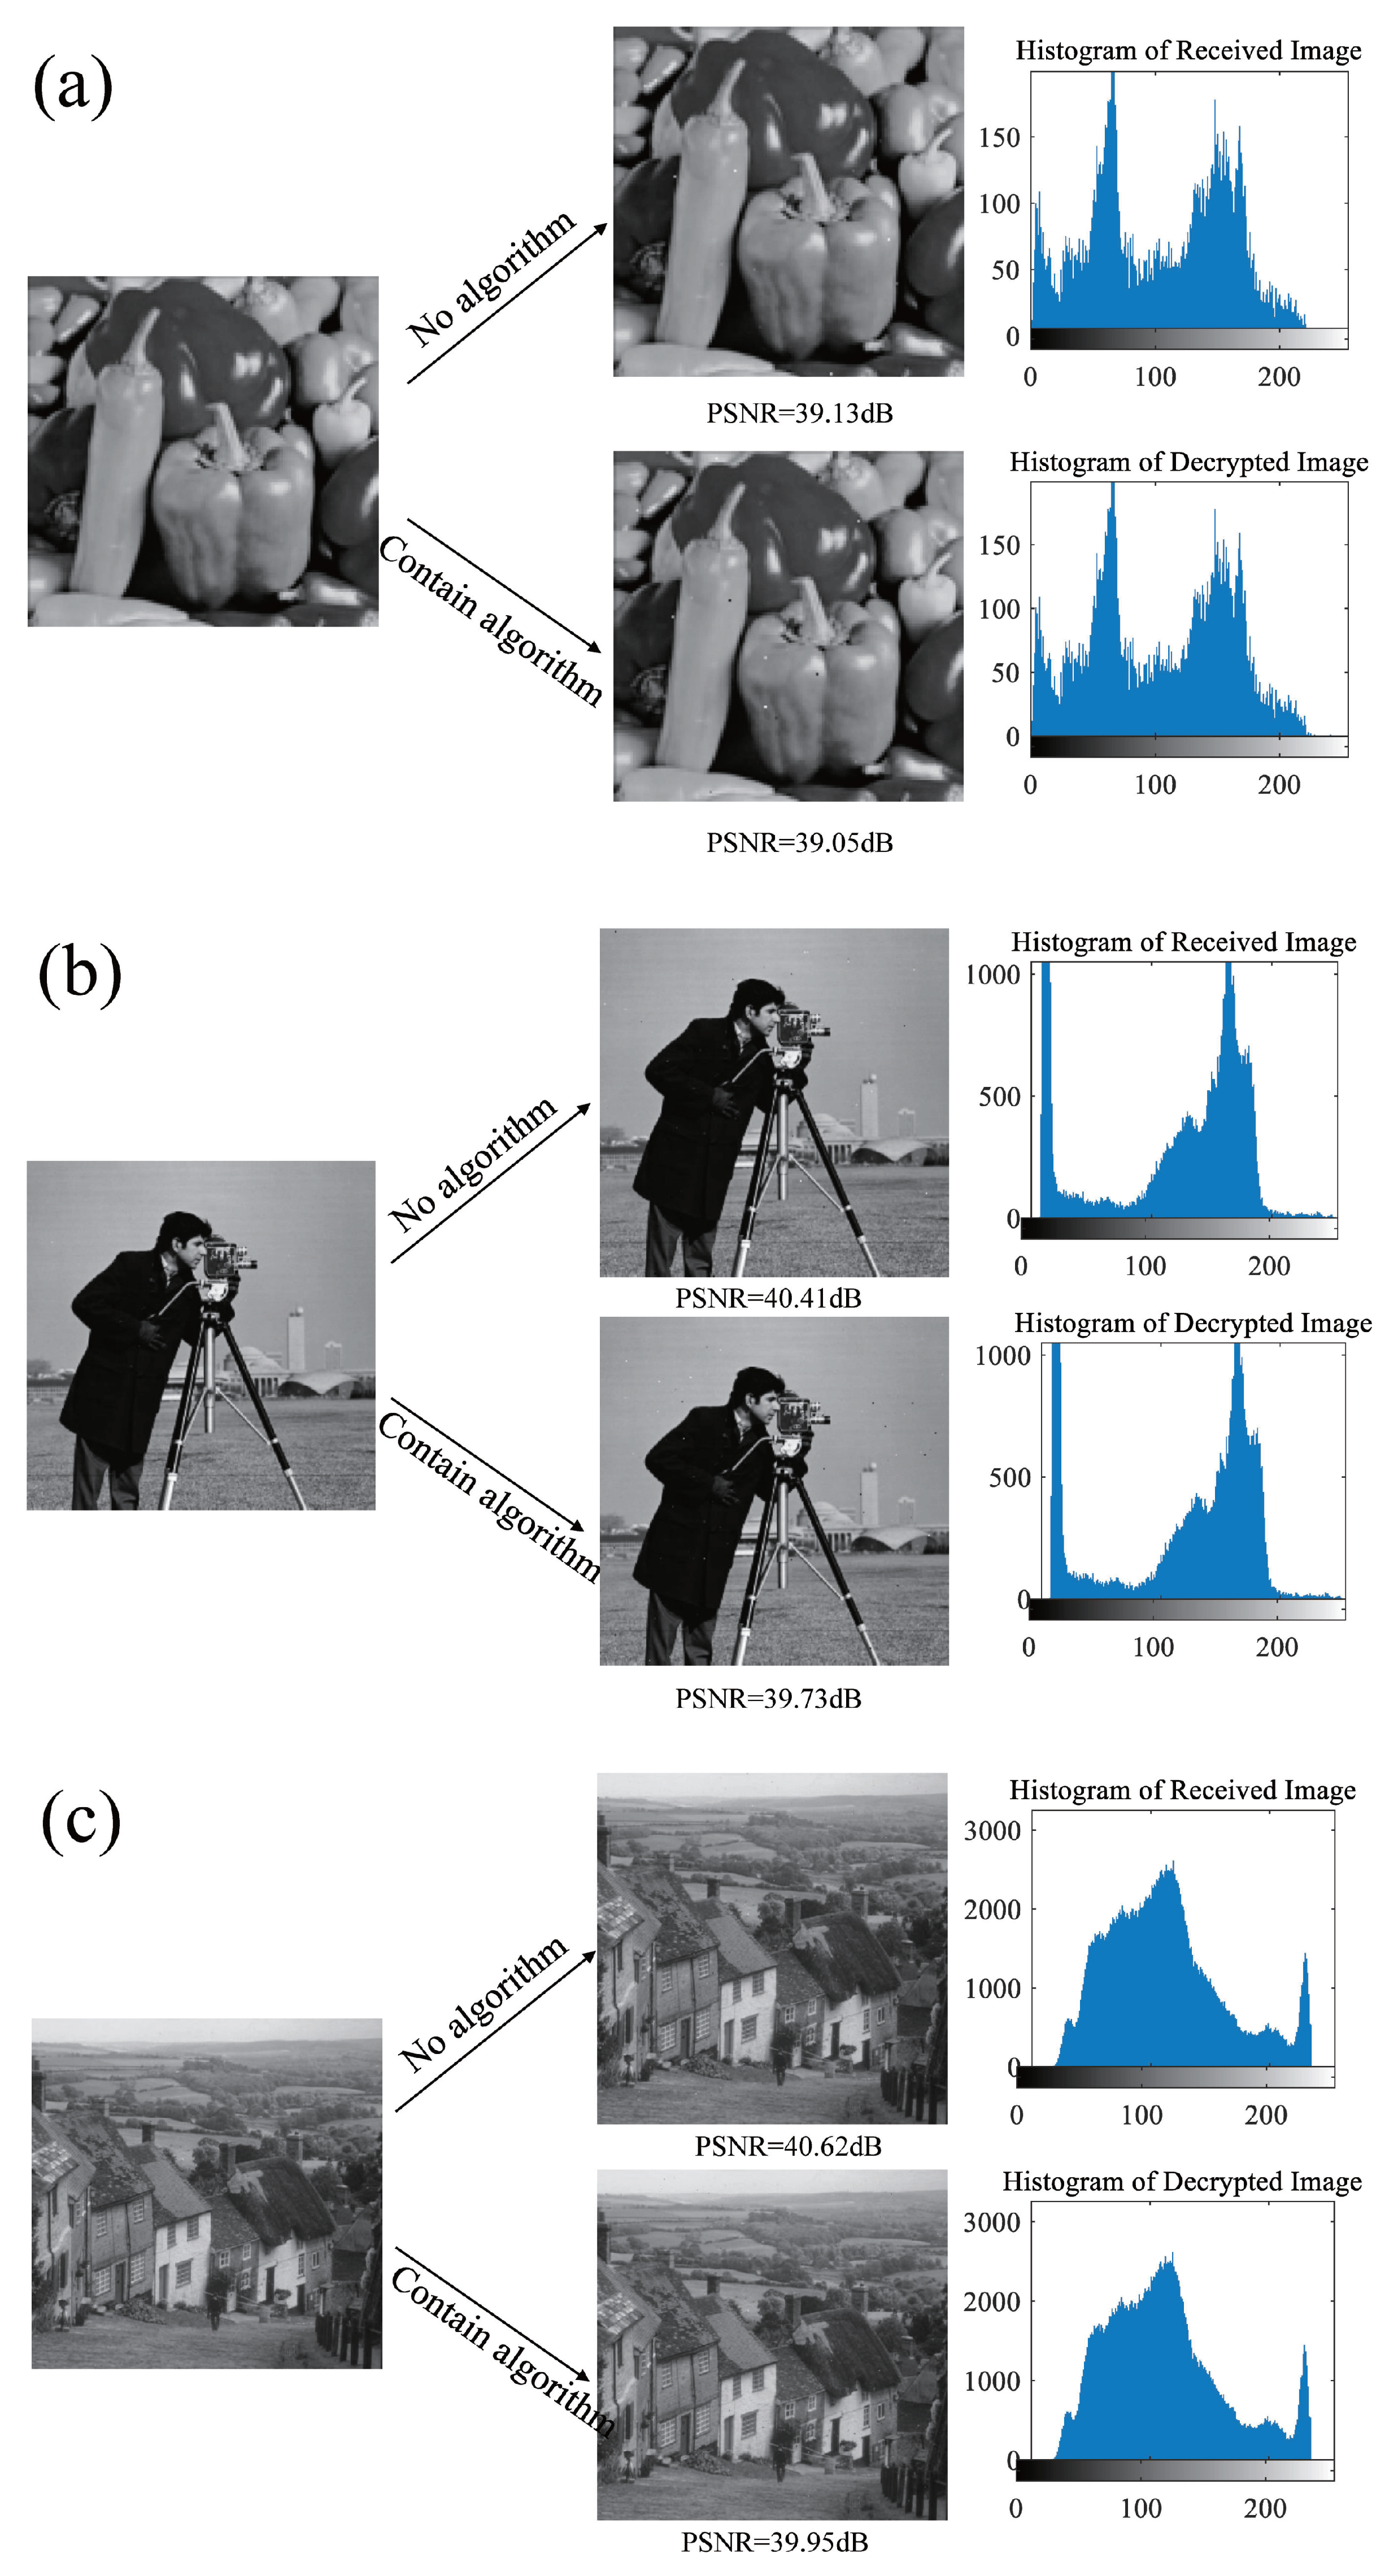
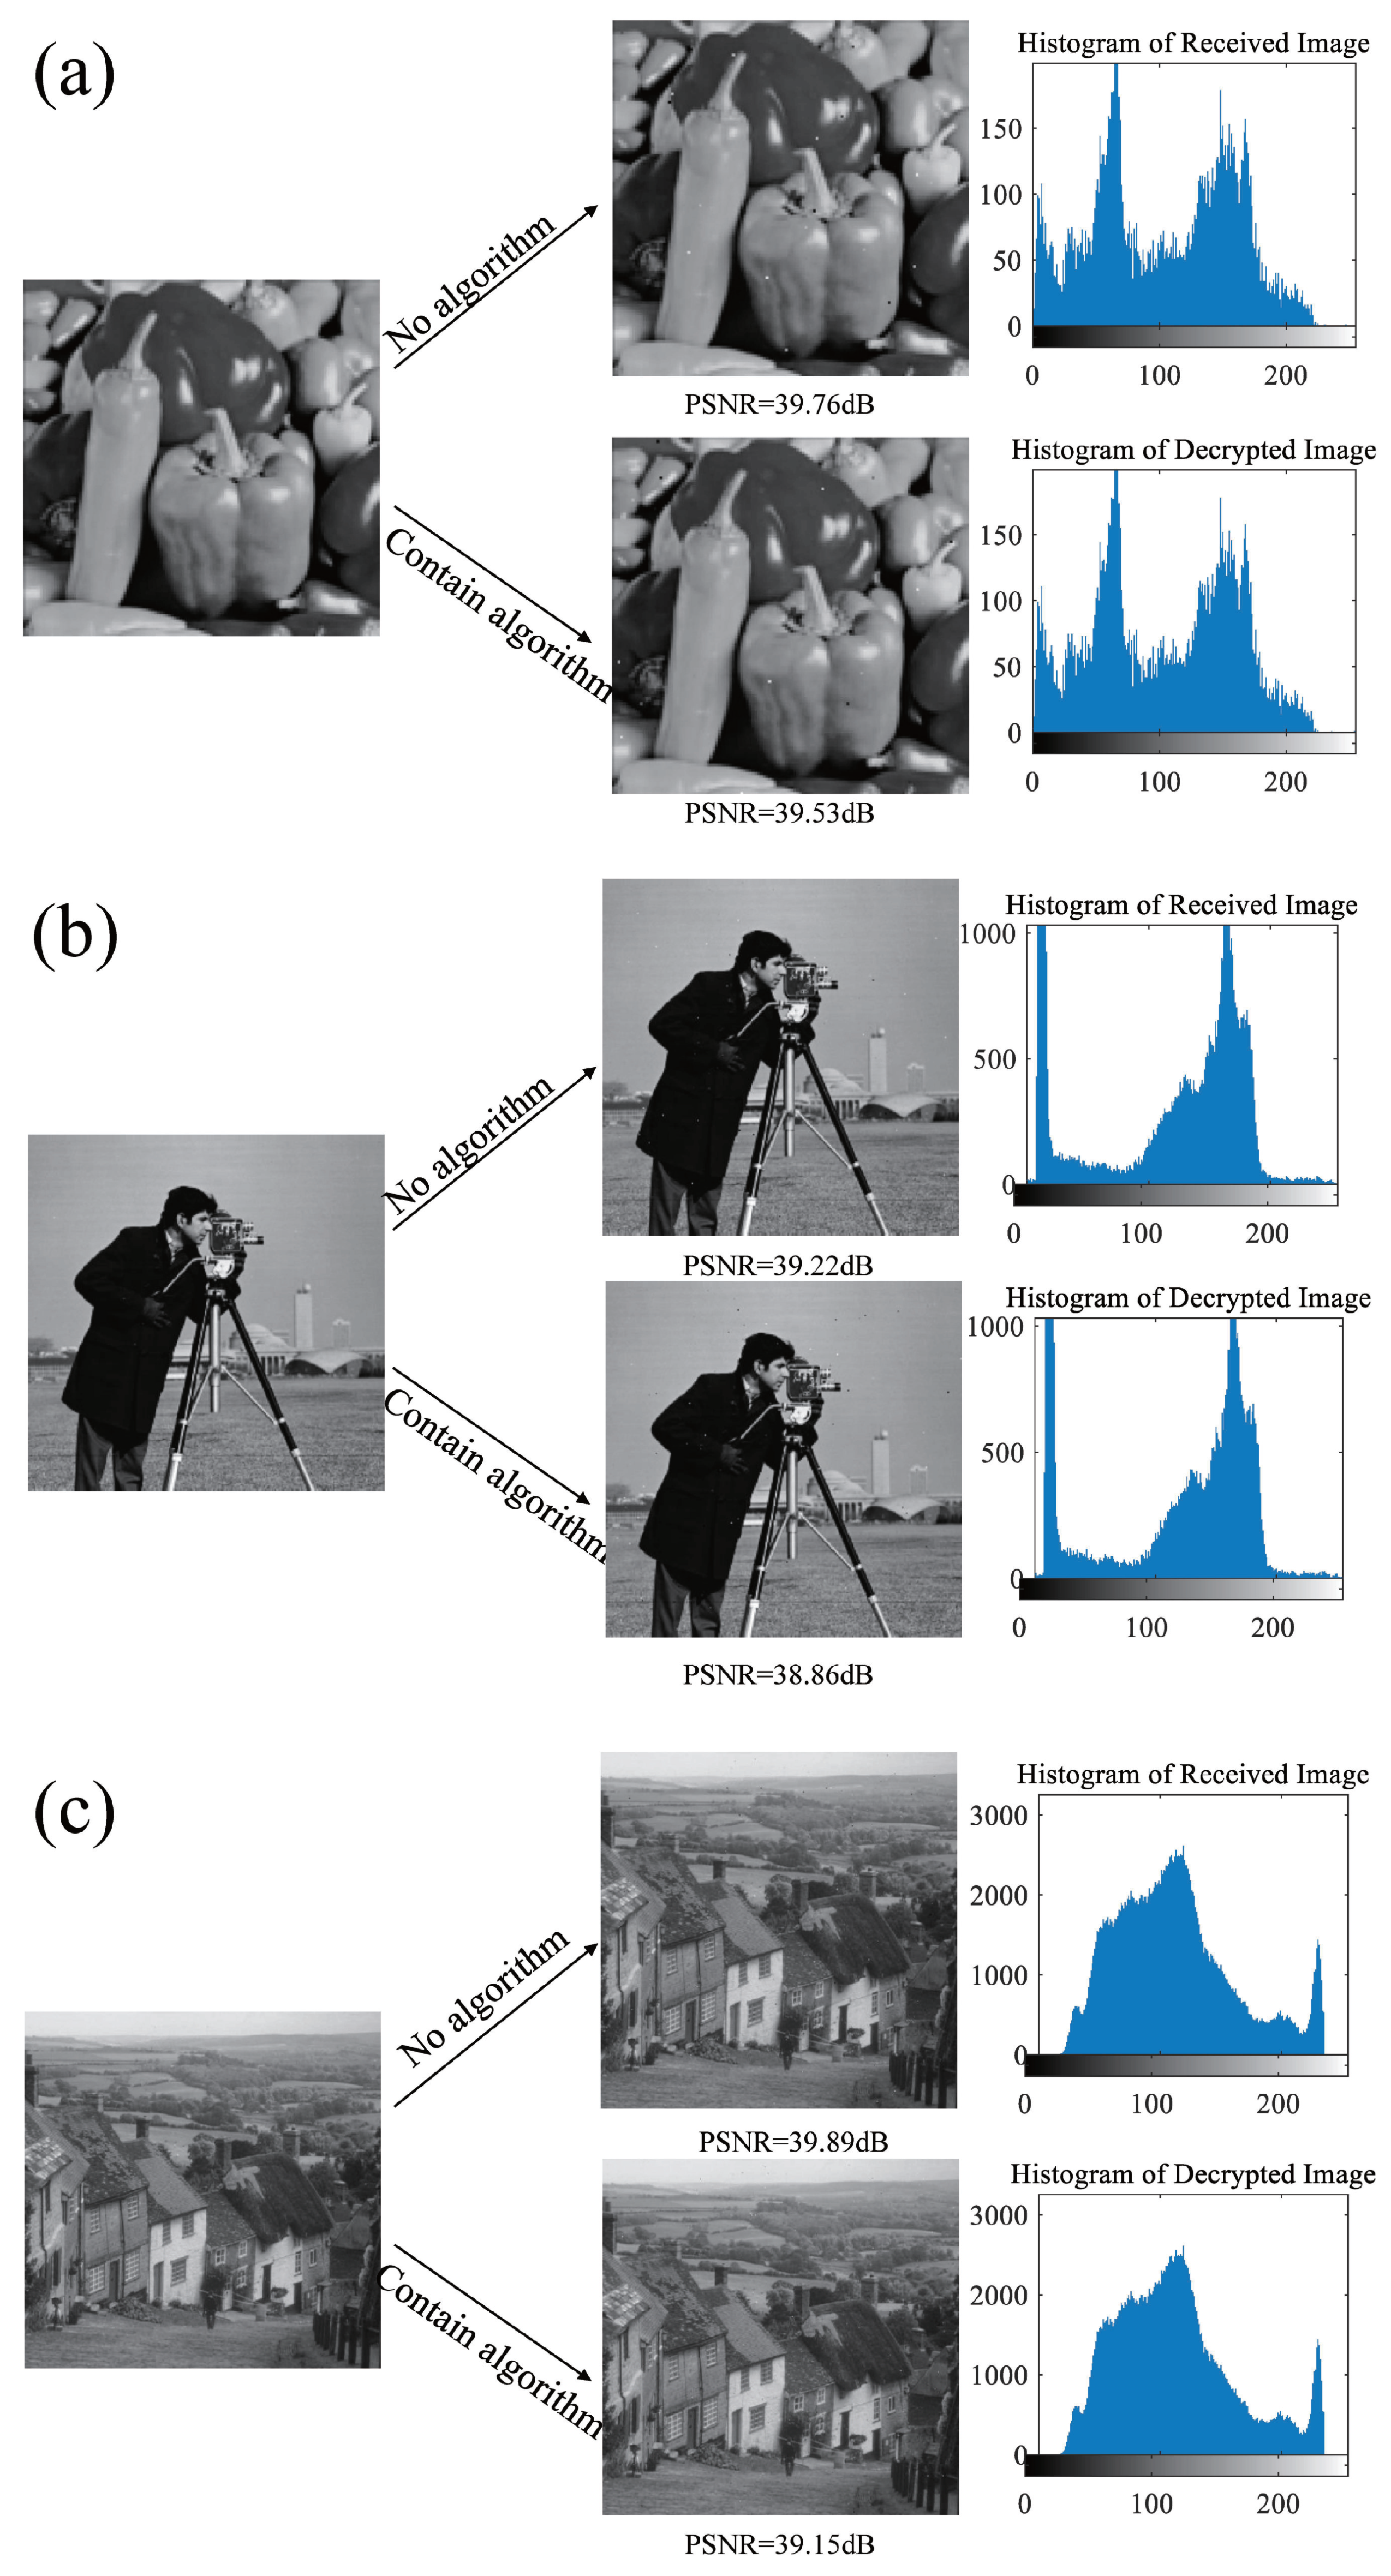
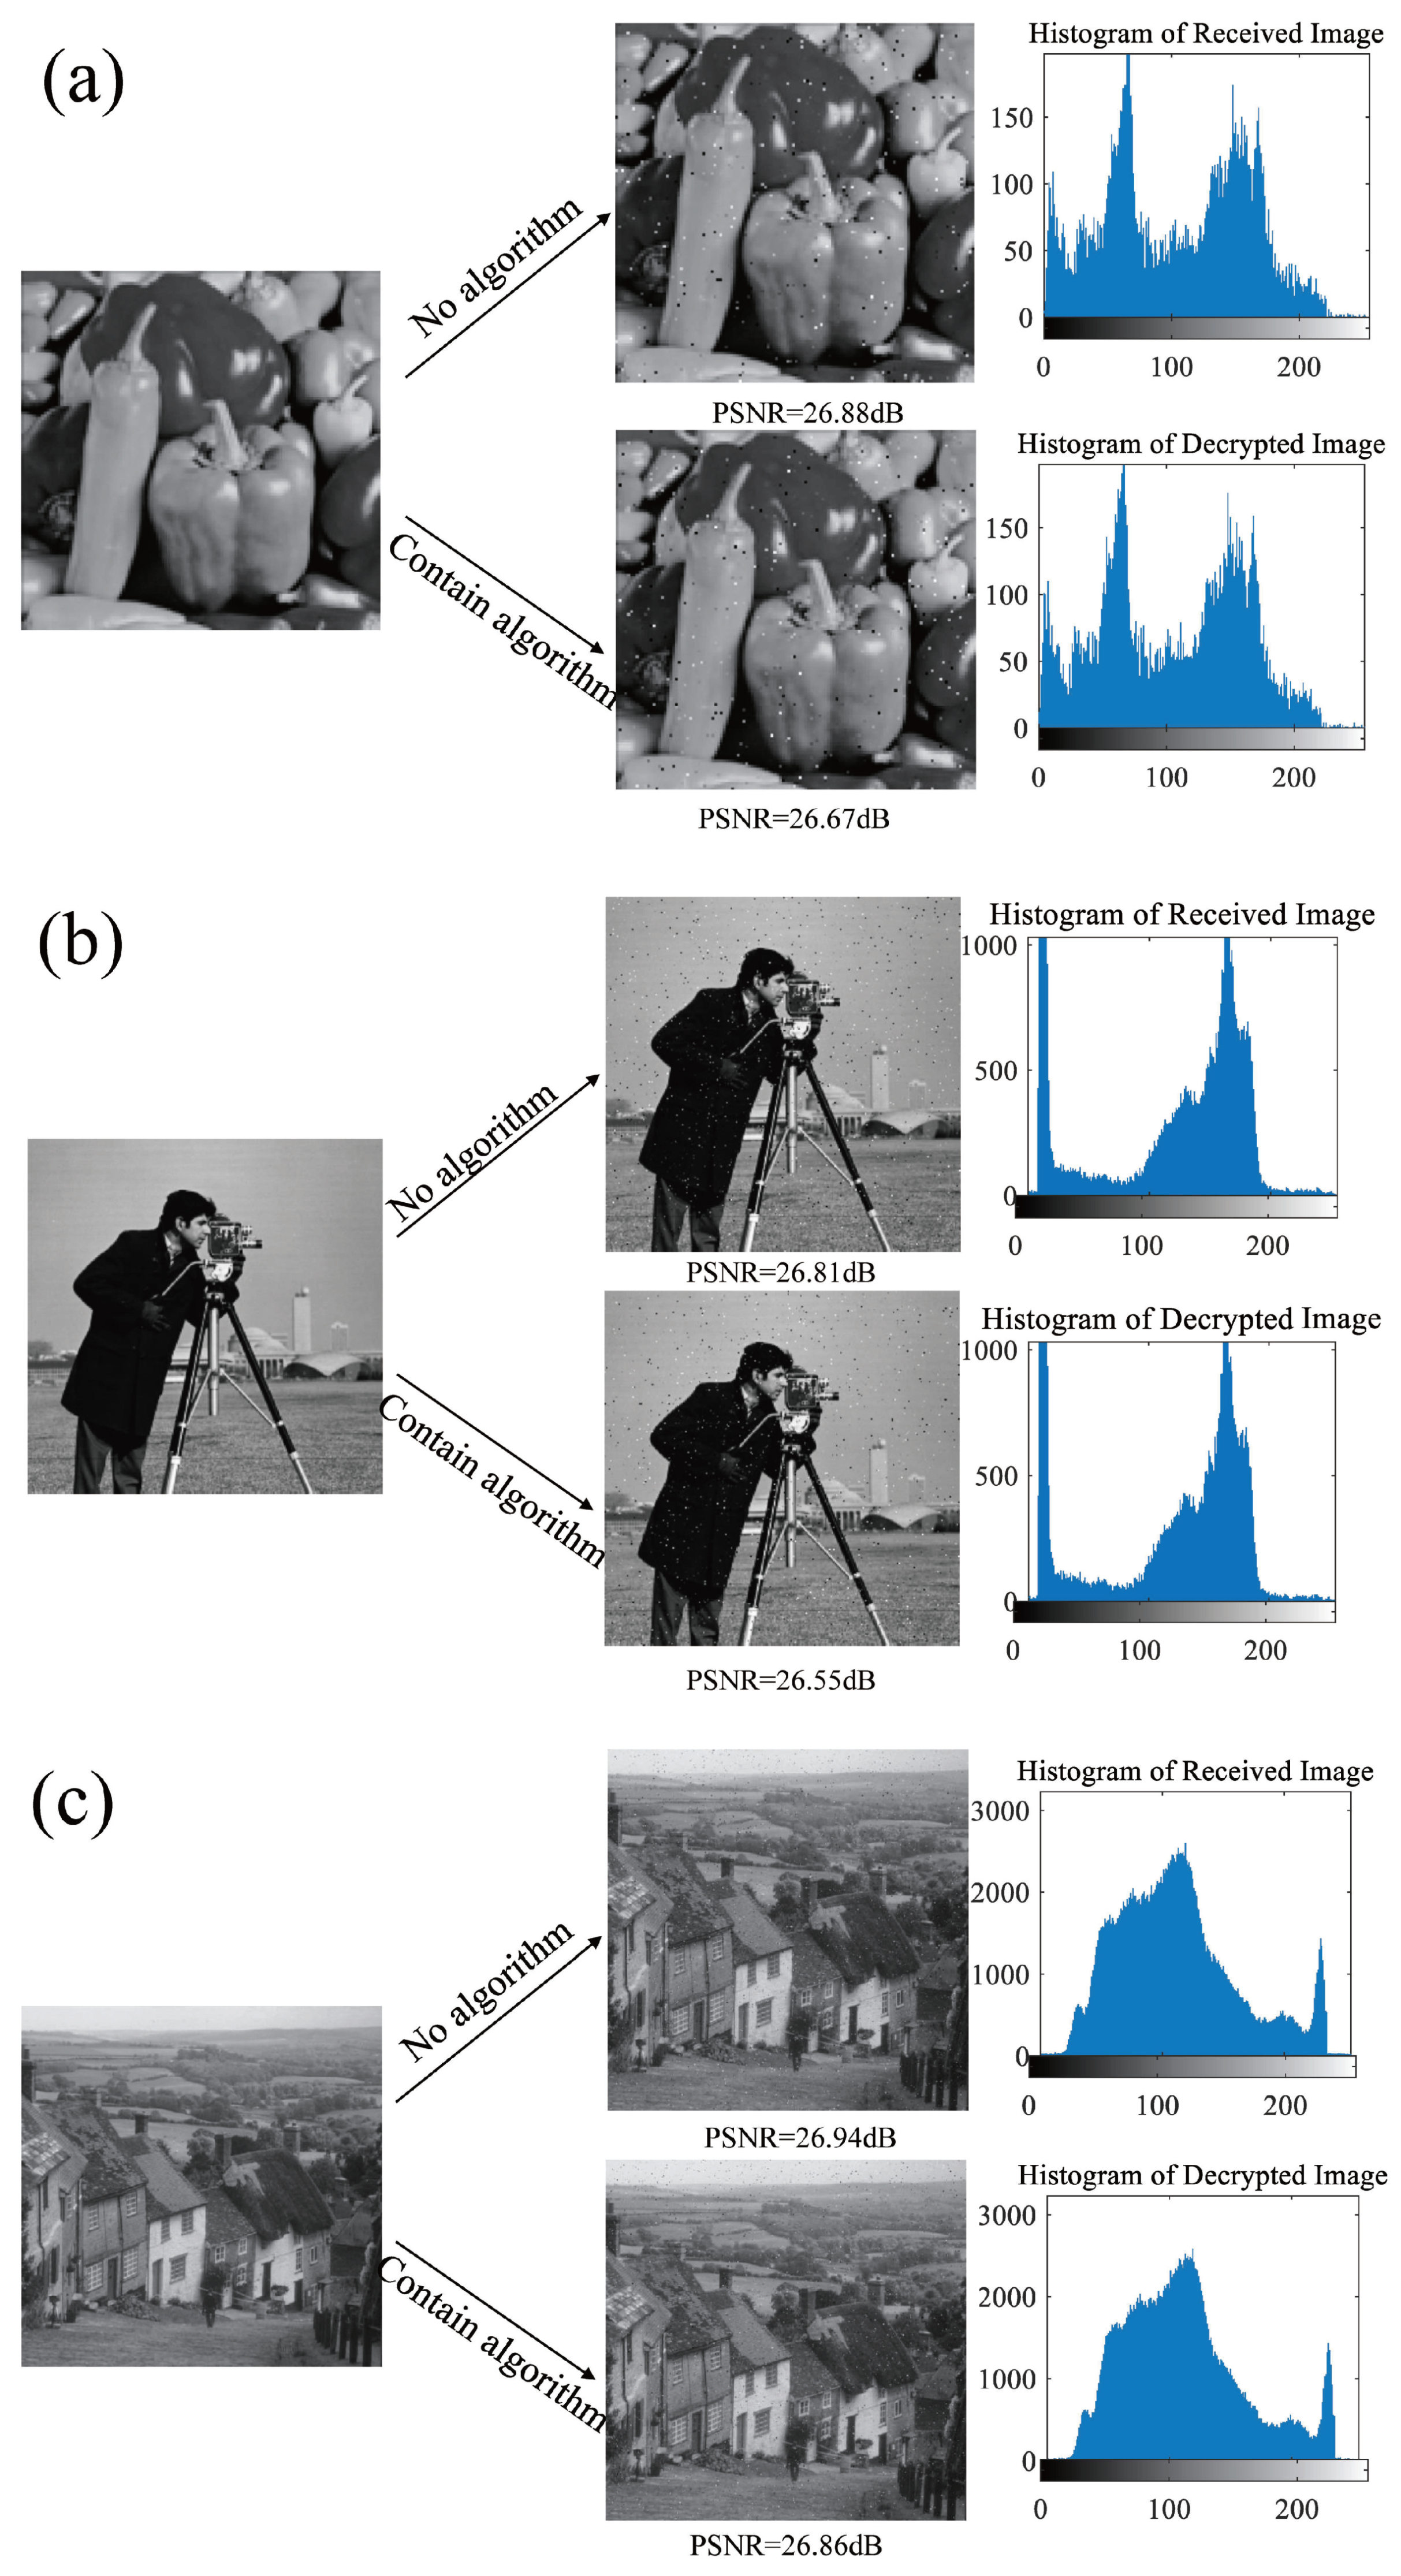
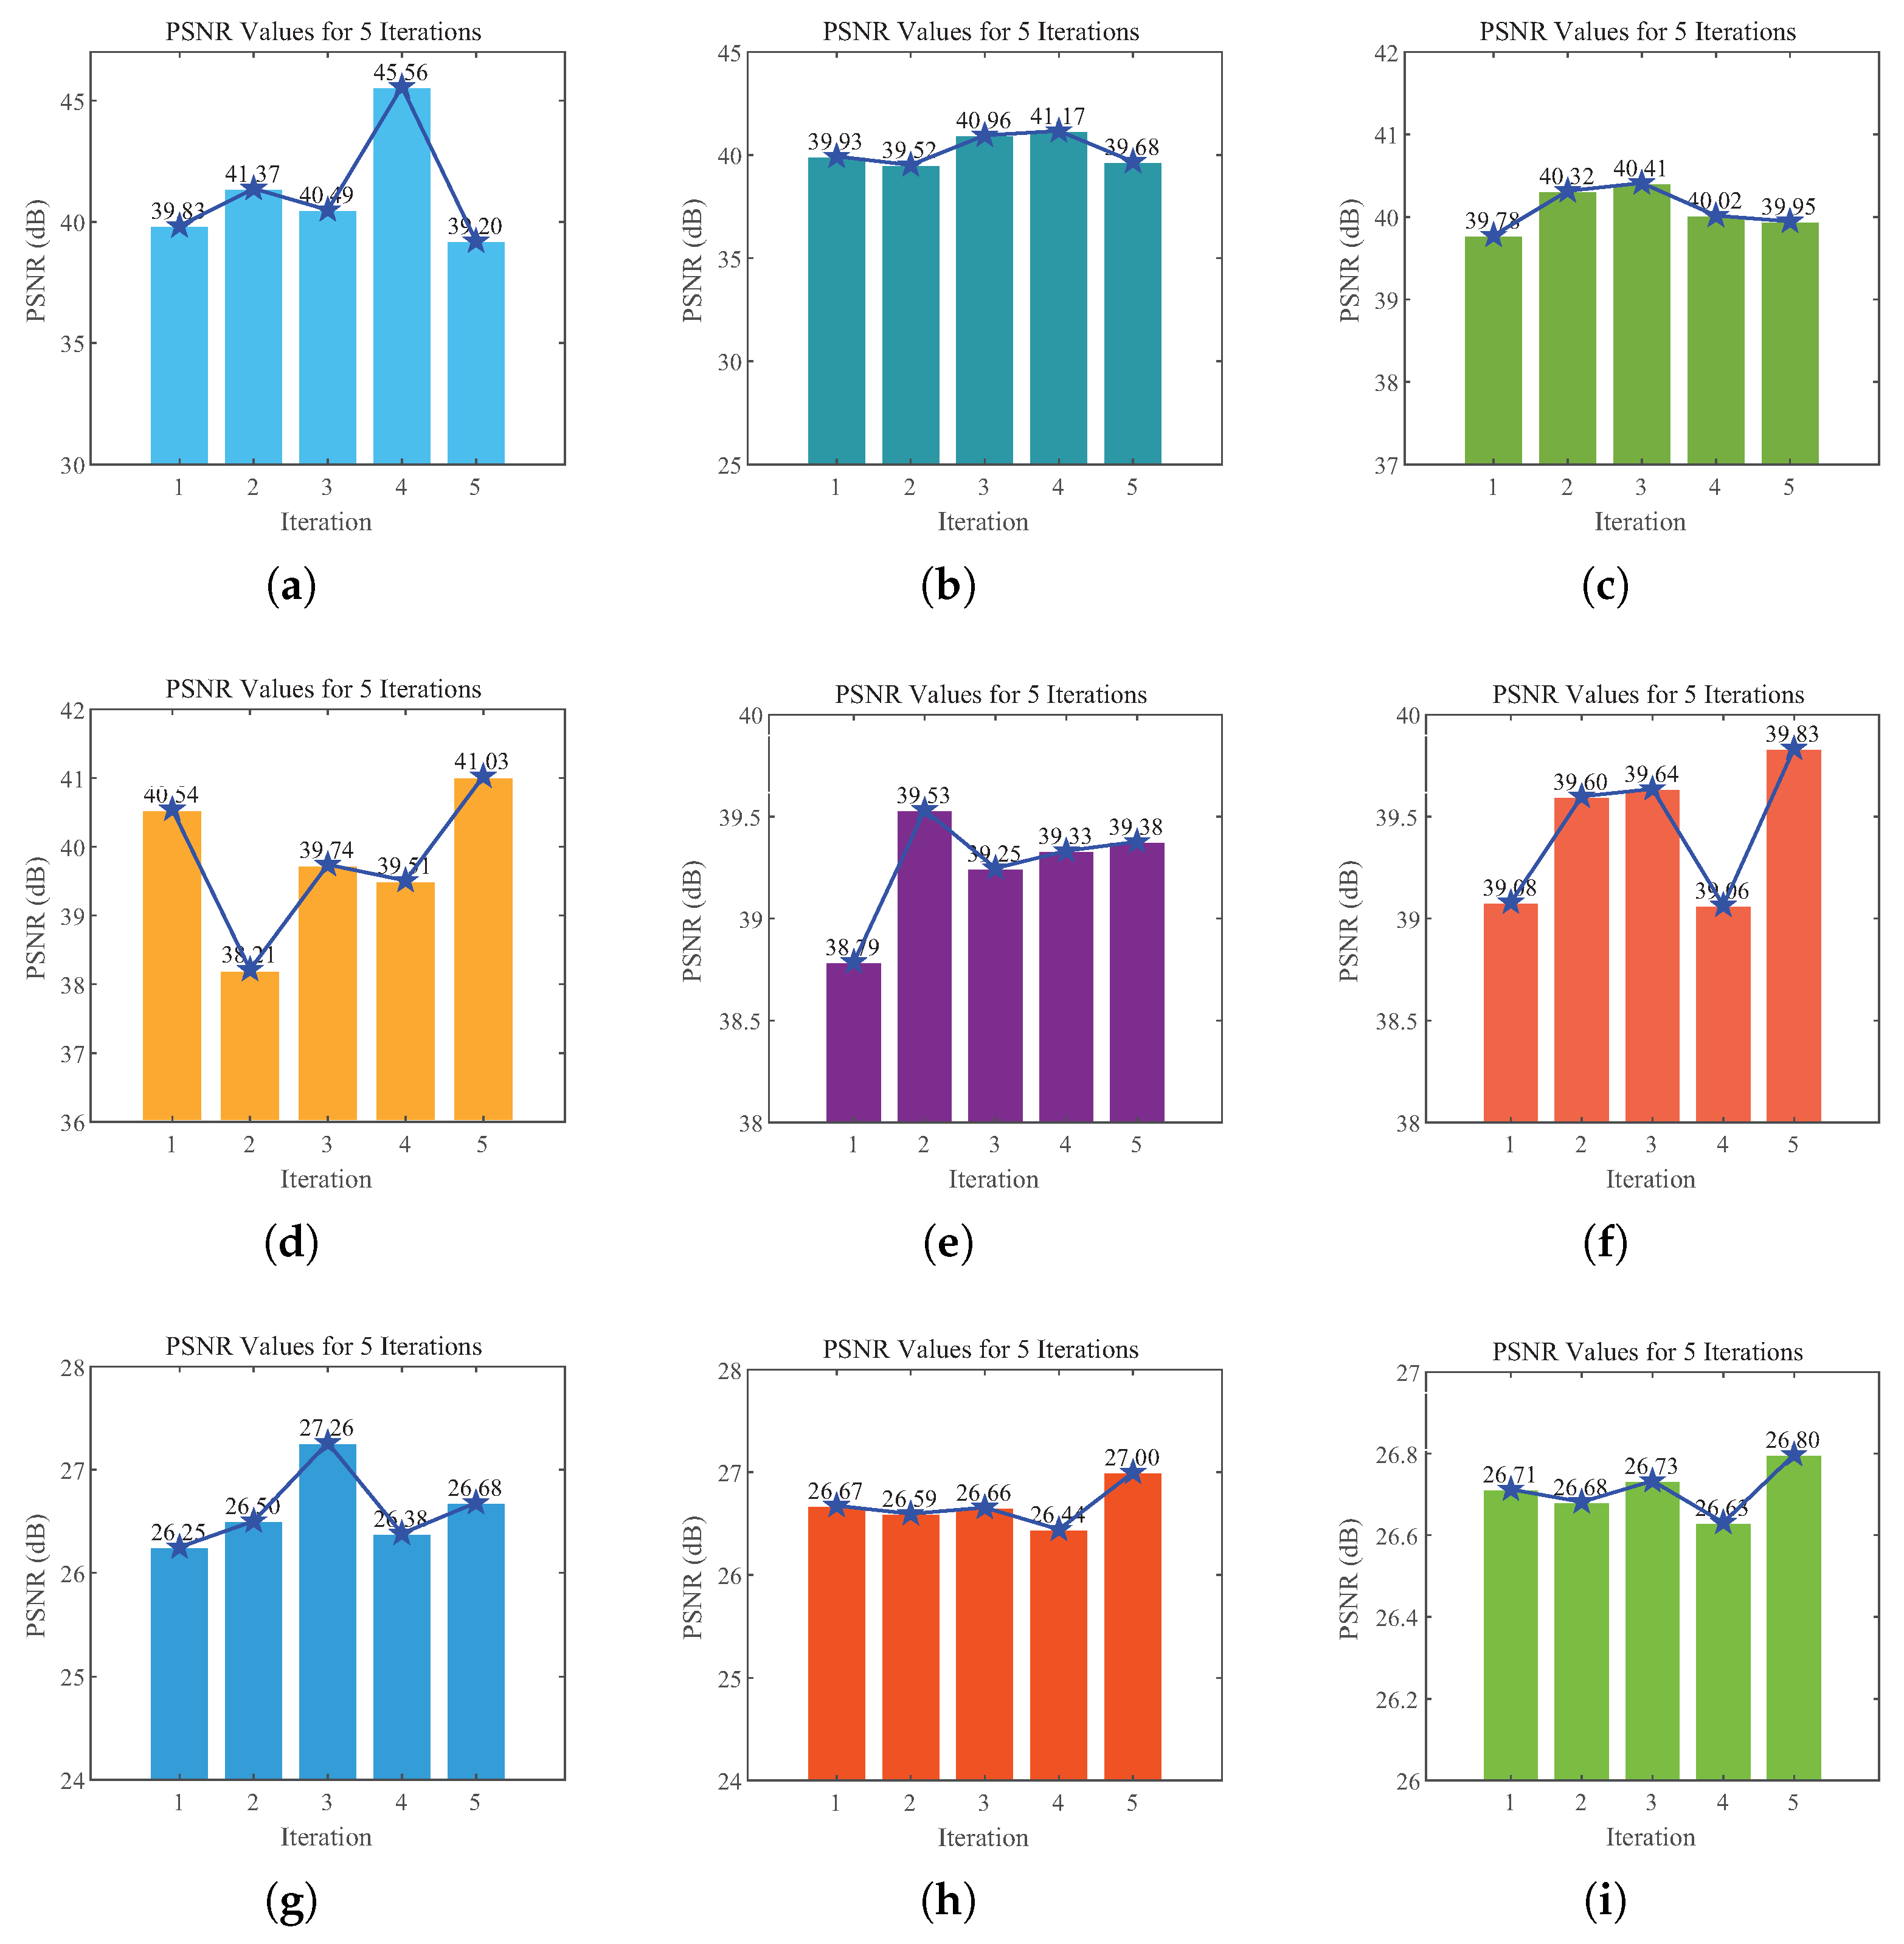
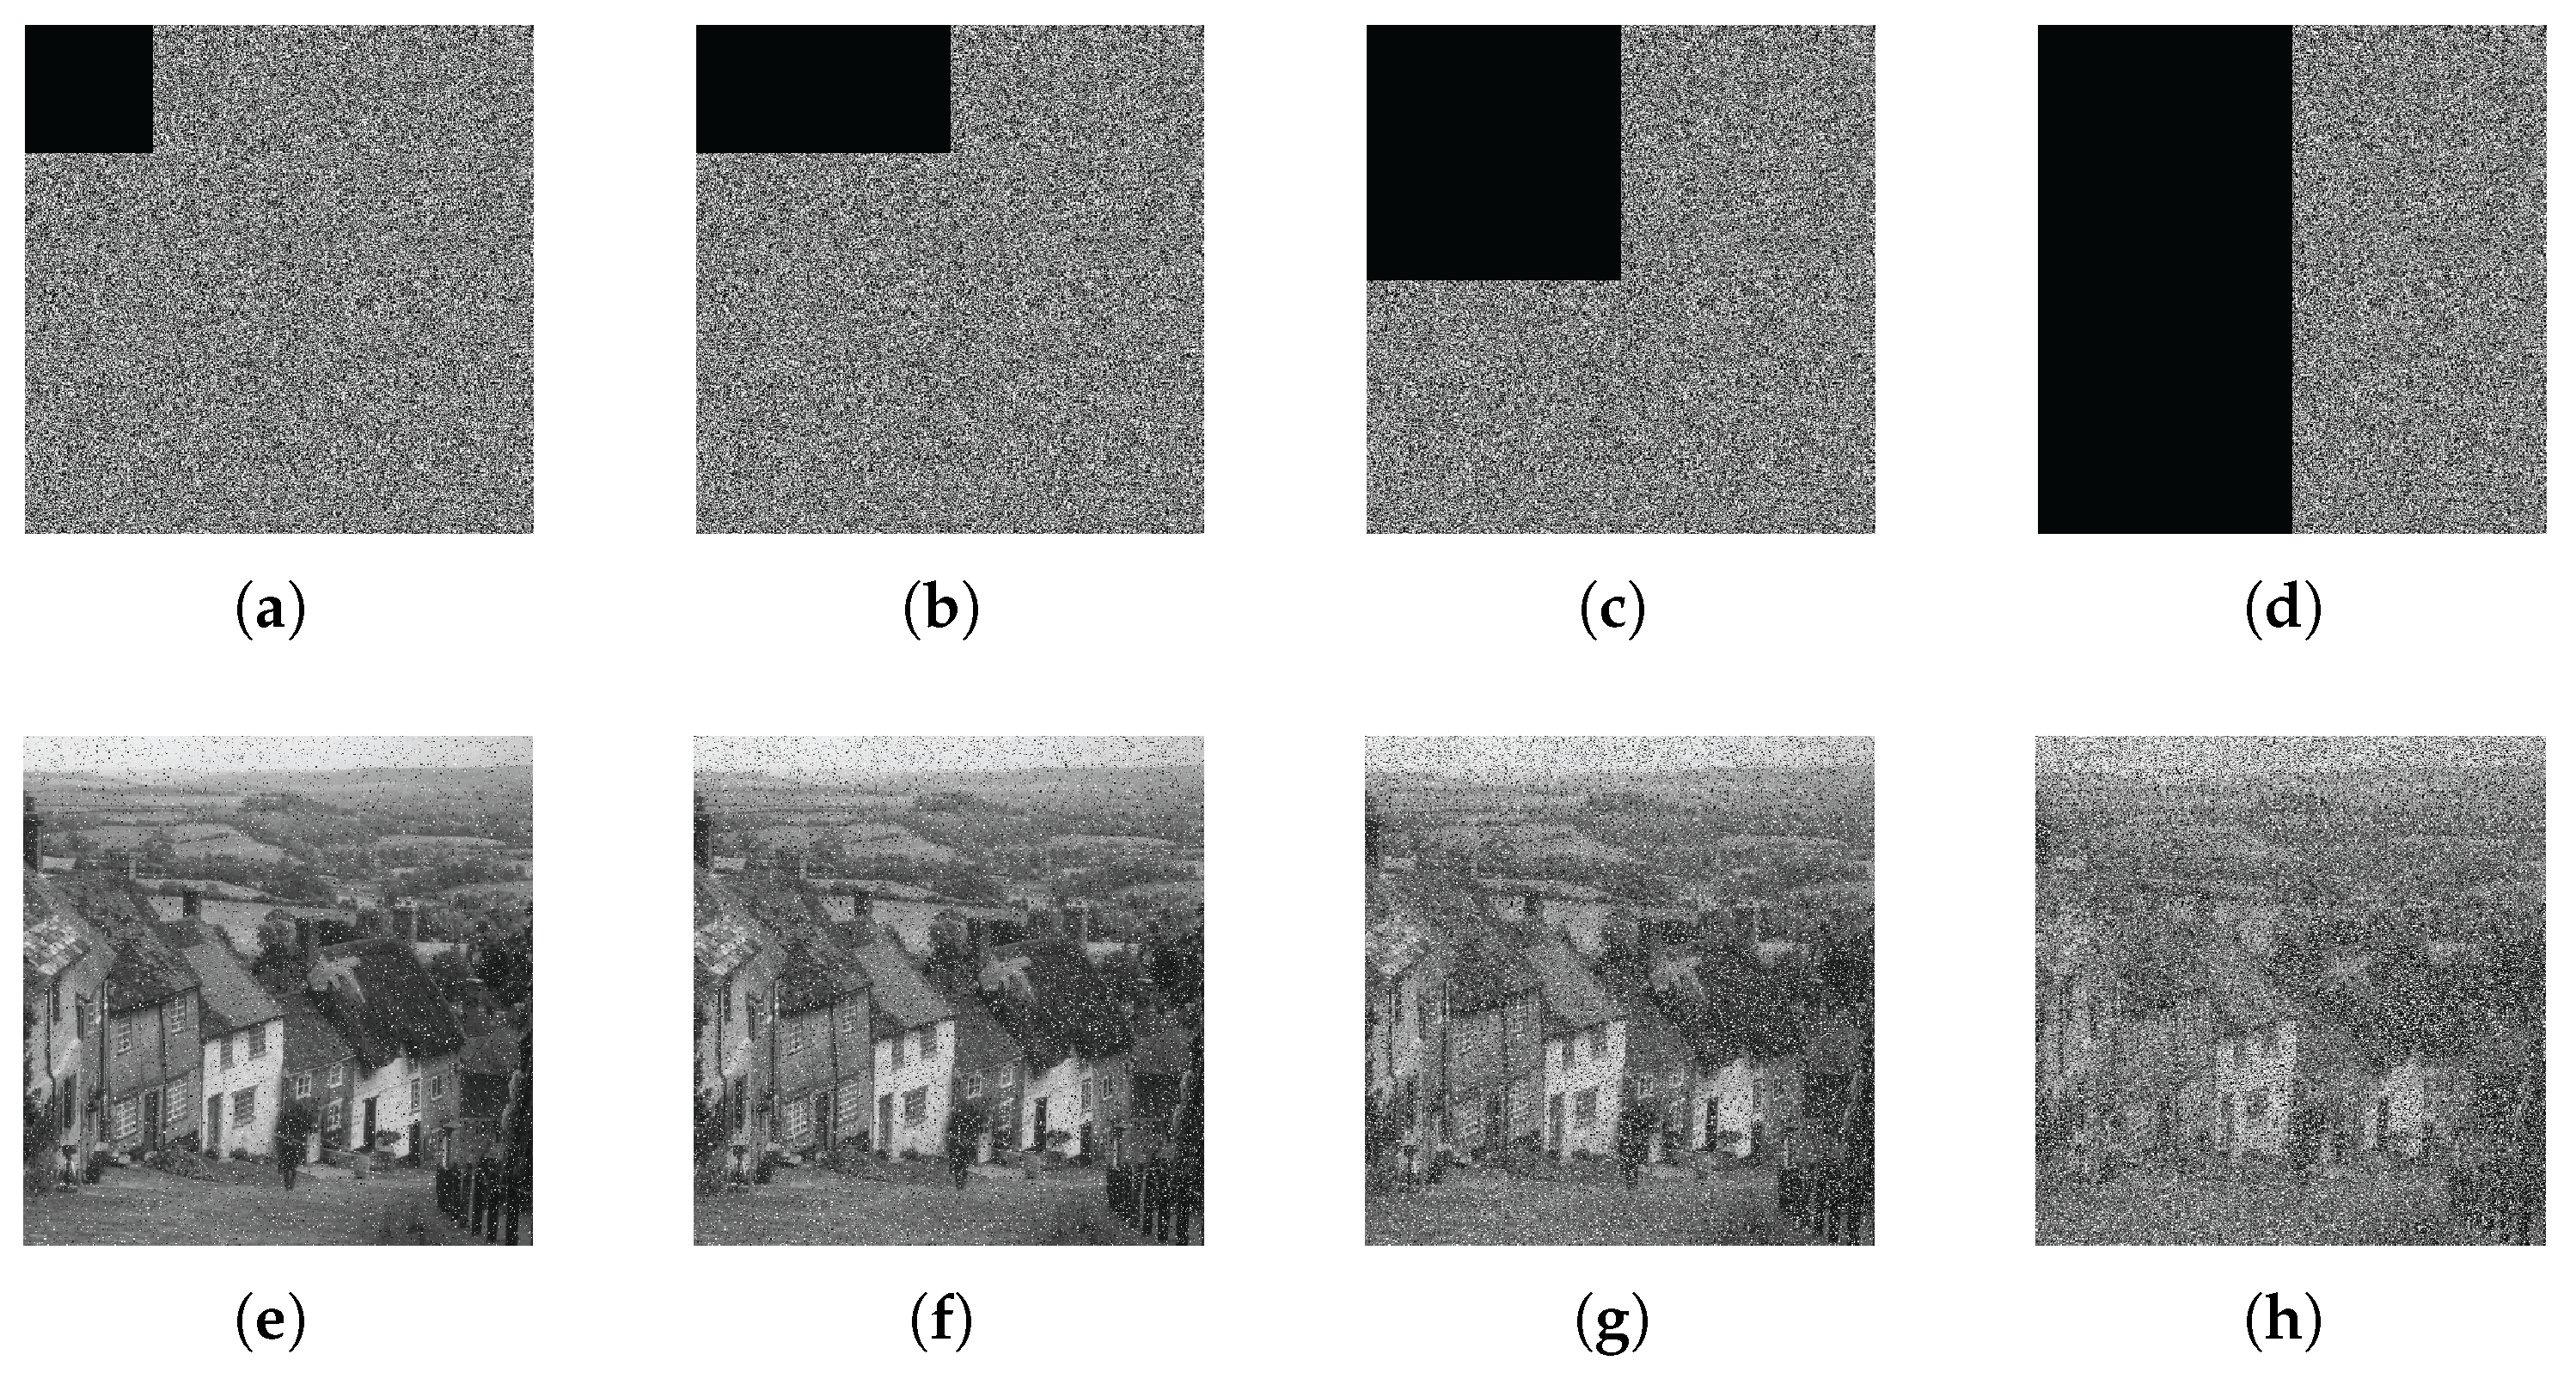
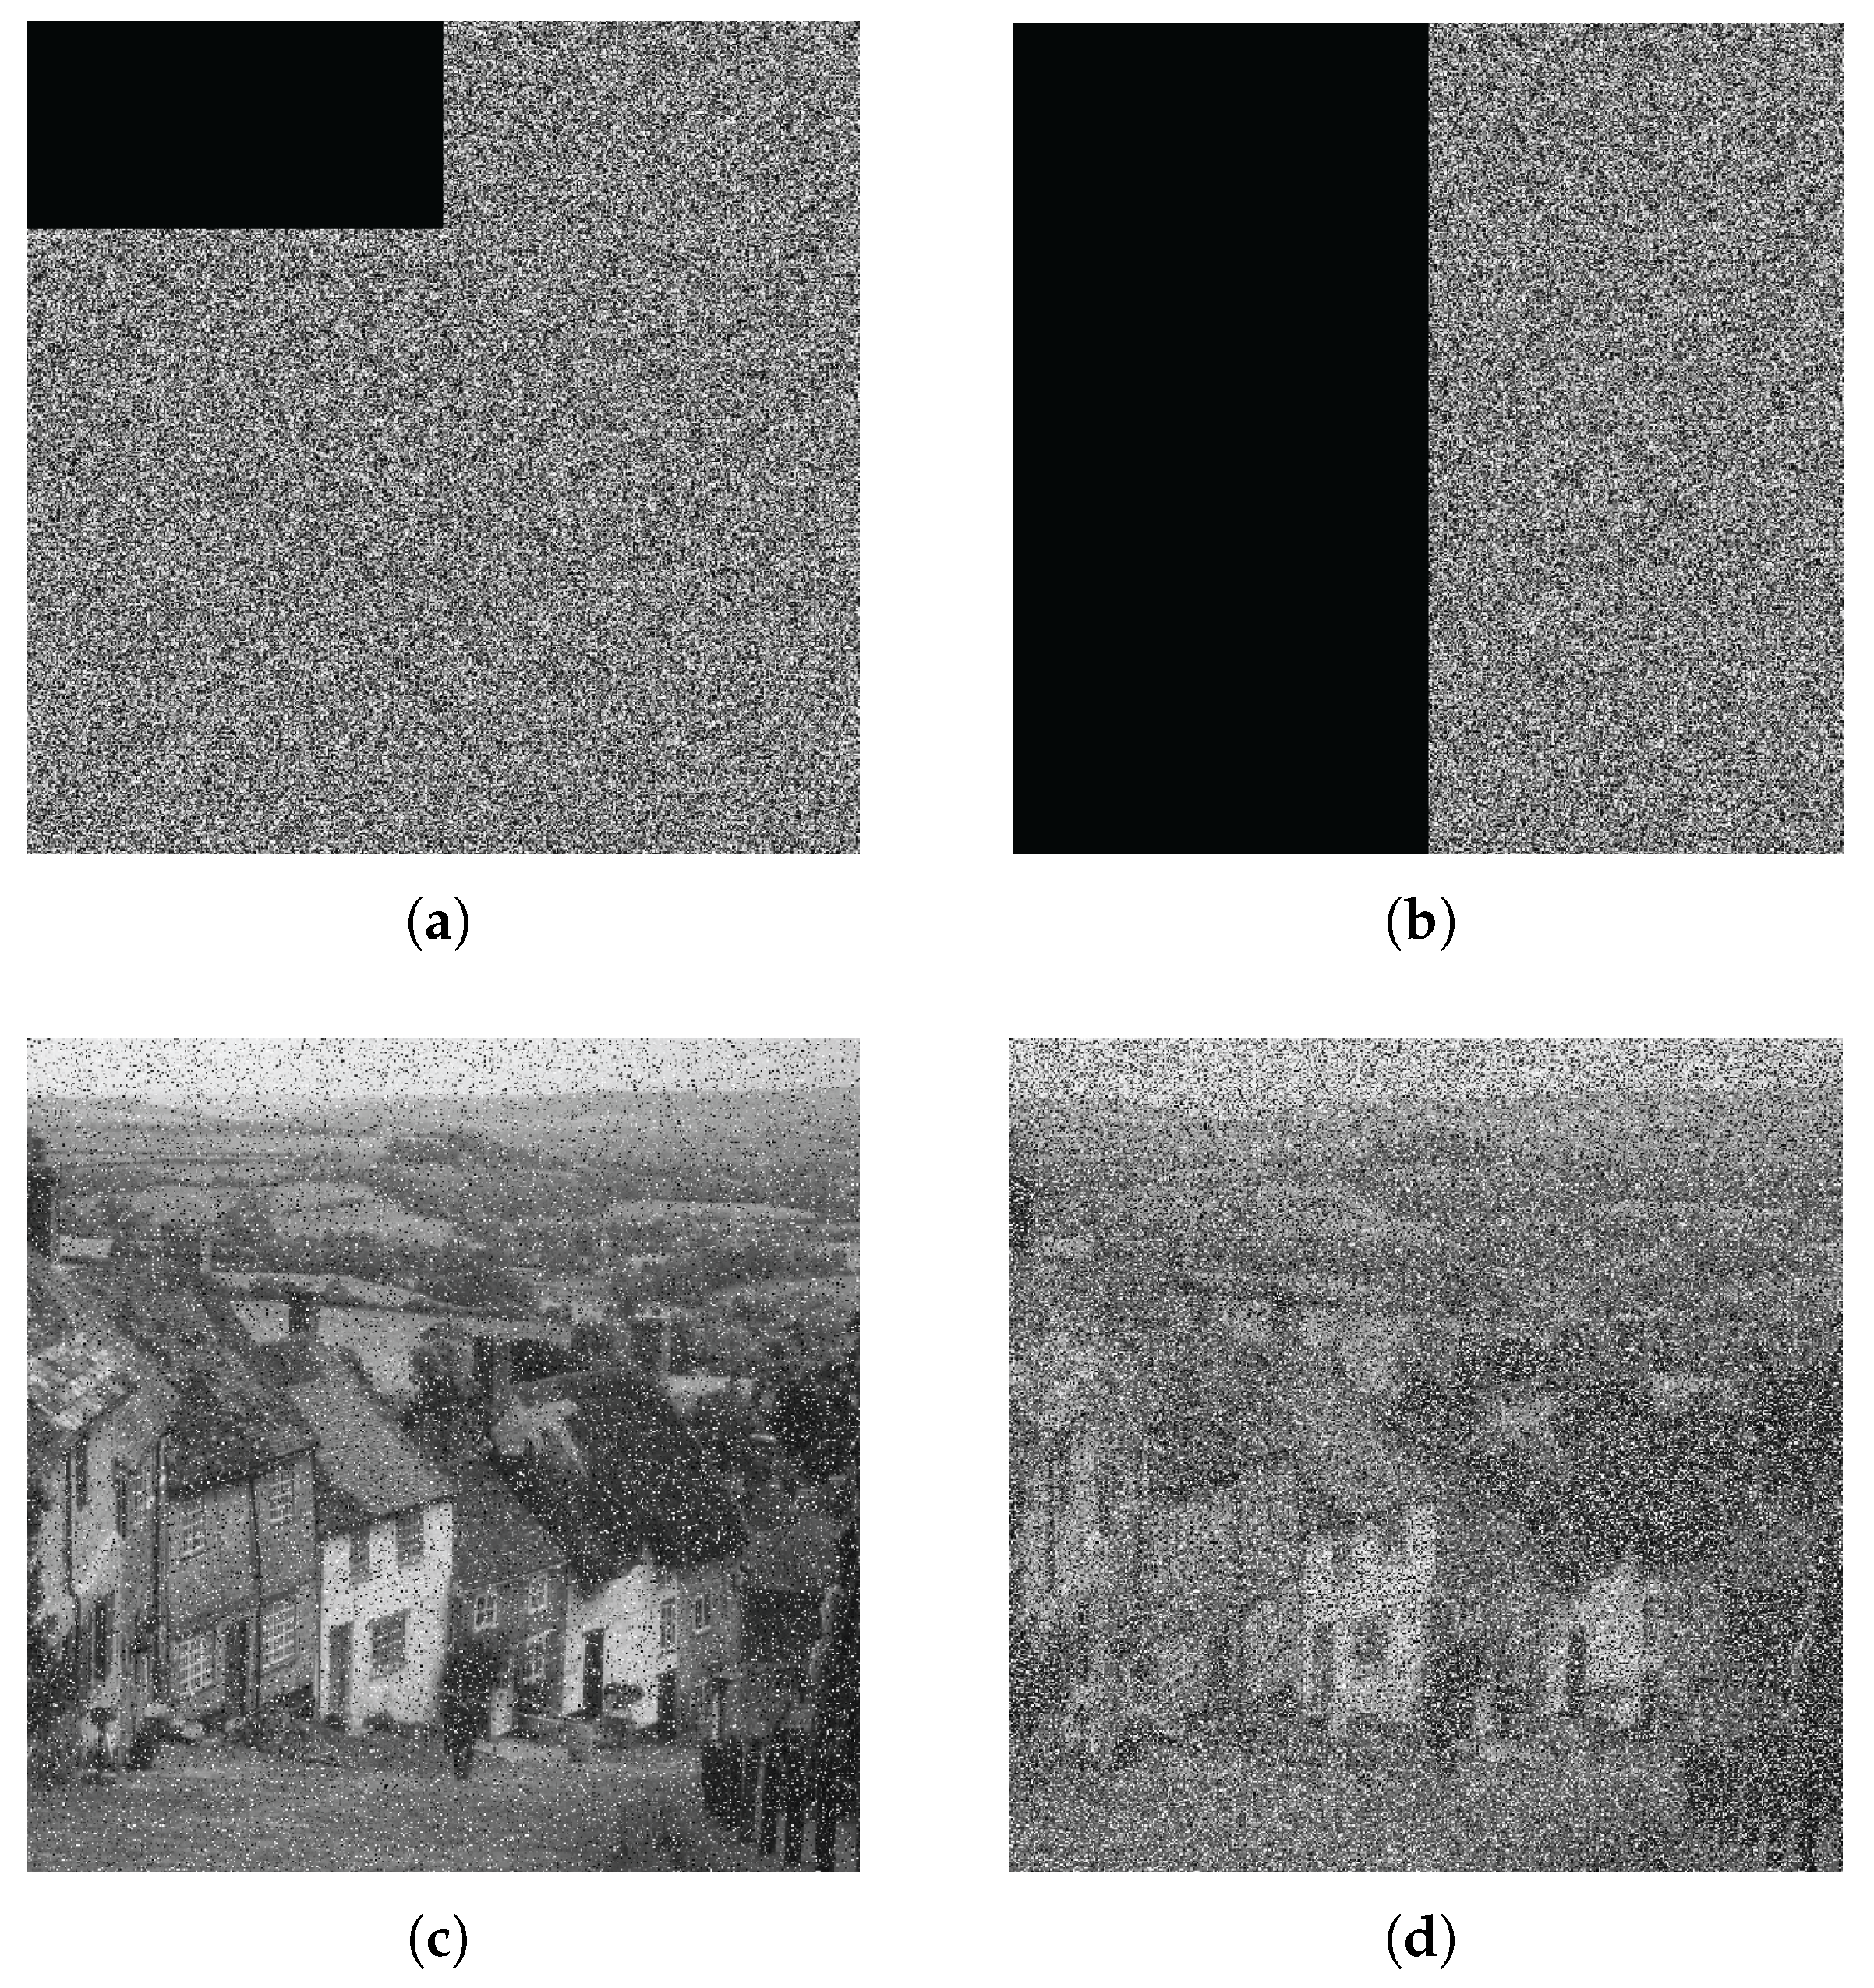
Section 4 provides simulation explanations from three aspects: transmission performance, transmission quality, and resistance to truncation attacks. Images of different sizes and turbulent channels of different intensities are used to verify the feasibility, turbulence resistance, security, and robustness of the scheme. Finally, the overall work of the article is summarized.

2. Chaotic Image Encryption System

2.1. System Model

Five-dimensional hyperchaotic systems represent a significant branch within chaos theory, offering distinct advantages over lower-dimensional chaotic systems [34]. The dynamics of these systems exhibit greater complexity and diversity due to higher dimensionality, generating richer and more intricate forms of chaotic motion. This characteristic enhances the potential for applications in fields such as information encryption and random number generation. Additionally, five-dimensional hyperchaotic systems typically have larger Lyapunov exponents, reflecting heightened sensitivity to initial conditions. This increased sensitivity leads to the generation of more random and unpredictable motion trajectories, greatly enhancing the suitability for information security applications [35].
Additionally, the chaotic behavior of five-dimensional hyperchaotic systems encompasses a broader range of attractor structures, enabling the display of complex non-periodic motions. This flexibility makes them highly adaptable in engineering applications, catering effectively to diverse system requirements. Lastly, these systems boast superior information transmission rates and capacities, thereby improving the efficiency and quality of data transmission processes. Consequently, when integrated with image encryption and transmission, the five-dimensional hyperchaotic system exemplifies its model’s superiority through its complex dynamics, enhanced randomness and security, adaptable attractor structures, and efficient information transmission capabilities. The state variable of the five-dimensional system is denoted as x = x 1 , x 2 , x 3 , x 4 , x 5 T , with the unknown parameter α j , j = 1 , 2 , , 6 and the unknown disturbance β s , s = 1 , 2 . The state-space equation can be expressed as:
x = A α x + N x + B β
where the linear parameter matrix A α and the nonlinear term vector N x are:
A α = α 1 α 1 0 0 0 α 2 α 2 0 0 1 0 α 3 0 α 4 0 0 0 0 α 5 0 α 6 α 6 0 0 0 , N ( x ) = 0 x 1 x 3 x 4 x 1 x 2 x 4 x 1 2 x 3 0
The disturbance input matrix B is given as follows:
B = 0 0 0 0 0 0 1 0 0 1 , β = β 1 β 2
The resulting state space equation is given as follows:  
x ˙ = α 1 x 1 + α 1 x 2 α 2 x 1 + α 2 x 2 + x 5 α 3 x 2 + α 4 x 4 α 5 x 4 α 6 x 1 + α 6 x 2 + 0 x 1 x 3 x 4 x 1 x 2 x 4 x 1 2 x 3 0 + 0 0 0 β 1 β 2
with parameters α 1 = 30.5 , α 2 = 9.8 , α 3 = 15 , α 4 = 2.5 , α 5 = 1.45 , α 6 = 3.5 , β 1 = 0.01 , β 2 = 0.01 and initial values selected as ( 0.1 , 0.1 , 0.1 , 0.1 , 0.1 ) , the three-dimensional plane attractor diagrams and timing diagrams are obtained, as shown in Figure 1.
Figure 1 shows that the trajectory of the chaotic attractor is relatively complex and has complex dynamic characteristics. The time series diagrams reflect the trajectory of the chaotic system changing over time, thus demonstrating the disorder and sensitivity of the chaotic system.
Complexity is a powerful indicator of the complexity of chaotic systems. The complexity of Chaotic System (4) is evaluated using SE (Spectral Entropy) complexity. The SE complexity is derived from the spectral entropy value obtained by combining the energy distribution in the Fourier transform domain with Shannon entropy. Figure 2 shows the complexity analysis of system (4).
An analysis of complexity in cases α 1 [ 29 , 31 ] and α 2 [ 7 , 10 ] can be conducted through Figure 2. From the complexity analysis diagram, the overall complexity is above 0.88, indicating that the chaotic system (4) has a high level of complexity.

Lyapunov Exponent and Bifurcation Diagram

To further demonstrate the dynamic behavior of a five-dimensional chaotic system, the Lyapunov exponent diagram will be used for chaotic characteristic analysis. The Lyapunov exponent diagram is used to quantitatively describe the sensitive dependencies of the system and determine whether the system is stable, periodic, quasi periodic, chaotic, or hyperchaotic. The Lyapunov exponent diagram can be used to comprehensively analyze and understand the dynamic behavior of the system, identify key parameter points, optimize system parameters, and achieve expected behavior. The Lyapunov exponent diagrams obtained under specific initial conditions are shown in Figure 3.
Figure 3a demonstrates the presence of two positive Lyapunov exponents, one value equal to 0, and two negative exponents in a five-dimensional chaotic system under specific initial conditions. Figure 3b indicates that even under variable parameter conditions, the system retains two positive Lyapunov exponents, affirming the existence of hyperchaos. These findings illustrate that the five-dimensional chaotic system exhibits sustained hyperchaotic behavior under certain initial conditions, thereby meeting the security requirement for the subsequent chaotic image encryption system.
Bifurcation diagrams are an important means of studying the dynamic behavior of chaotic systems. By judging the dense points on the bifurcation diagram, a clear understanding of the different state transitions of the chaotic system can be gained. Combining the Lyapunov exponent diagram can further judge the dynamic behavior of the hyperchaotic system.
Combined with the Lyapunov exponent diagrams of different parameters in Figure 3, the bifurcation diagrams under different parameter conditions are tested, and the results are shown in Figure 4.
The bifurcation diagrams under different parameter conditions in Figure 4 cover a large number of dense points under certain parameter conditions. Combined with the Lyapunov index diagram under different parameter conditions shown in Figure 3, system (4) is stable in the hyperchaotic state.
Through the above dynamic analysis of system (4), the system can maintain a hyperchaotic state to a certain extent, which provides good stability for the hyperchaotic system combined with the image encryption algorithm.

2.2. Chaotic Image Encryption System

Chaotic image encryption algorithms utilize the high sensitivity, unpredictability, and initial value dependence of chaotic systems to provide strong security and attack resistance. Its randomness and complexity make the encrypted image difficult to decipher.
It is suitable for use in situations where high confidentiality is required. The DNA chaotic image encryption algorithm further enhances the encryption strength and increases the complexity and diversity of image data by combining the five-dimensional hyper chaotic system, chaotic mapping, and DNA coding technology. The parallel processing capability and large storage density of DNA coding improves the encryption efficiency, which provides DNA chaotic image encryption with significant advantages in terms of efficiency and security [36].
The main flow of the chaotic image encryption algorithm selected in this section is shown in Figure 5. The main algorithms of the encryption process are shown in Algorithm 1.
The decryption process is the reverse process of the encryption process, and the specific contents will not be described one by one.
Algorithm 1 Chaotic image encryption algorithm
  1: 
Input:
  2: 
   Original plaintext image ( P 1 ); 256-bit key (K)
  3: 
Step 1: Hash value generation
  4: 
   Concatenate the data sources and perform a SHA256 hash operation → H ( 256 )
  5: 
Step 2: Key generation
  6: 
   The key K is XORed with the hash value H ( 256 ) K XOR
  7: 
Step 3: Numeric code conversion
  8: 
   Convert the pixel value in P 1 to the quaternary sequence P 2
  9: 
Step 4: DNA base sequence conversion
10: 
   Based on the logical chaotic sequence, generate coding rules, and convert the quaternary numerical sequence into a DNA base sequence P 3
11: 
Step 5: DNA base sequence rearrangement
12: 
   Use logical mapping to generate a replacement vector and rearrange the DNA base sequence to obtain P 4
13: 
Step 6: Key DNA image generation
14: 
   Use a five-dimensional hyperchaotic system to generate a random sequence, which is mapped to a key DNA image K DNA composed of P 3
15: 
Step 7: Diffusion process
16: 
   According to the operator sequence generated by the logical mapping, perform logical operations on P 4 and K DNA to obtain the diffused sequence P 5
17: 
Step 8: Reverse decoding
18: 
   According to the chaotic rule sequence, reverse the decoding process to restore the quaternary value sequence and obtain the decimal pixel matrix P 6
19: 
Output:
20: 
   Cipher image P 6

2.2.1. Analysis of Encryption and Decryption Effects

To verify the encryption and decryption effect of the improved hyperchaotic image encryption system under different conditions, the encryption and decryption tests were carried out on different plaintext images with dimensions of 256 × 256, 512 × 512, and 1024 × 1024. The test results of different plaintext images obtained via the experiment are shown in Figure 6.
Figure 6 illustrates the impact of varying plaintext image sizes on the encryption and decryption processes. The system exhibits strong performance across different image sizes. Specifically, the histogram of the plaintext image displays distinct concave and convex patterns, whereas the histogram of the ciphertext image becomes nearly uniform. The flattening indicates that the encryption process effectively conceals the plaintext information, making it challenging to extract meaningful data from the ciphertext image. These results further confirm the system’s excellent encryption and decryption capabilities.

2.2.2. Encryption and Decryption Time

Testing the encryption and decryption speed of chaotic image encryption system is of great significance in evaluating the feasibility of practical applications, optimizing the performance of algorithms, enhancing the user experience, meeting the demand for high throughput, and rationally utilizing hardware resources. To a certain extent, it can find the efficiency bottleneck in the algorithm, weigh the relationship between speed and security, and ensure that the system has sufficient operational efficiency while guaranteeing security. Different sizes of plaintext images are selected for encryption and decryption speed testing, and each group of images is repeated 100 times to take the average value. The test results are shown in Table 1.
The average time of the encryption process and decryption process is obtained by performing encryption and decryption operations on plaintext images of different sizes. The encryption and decryption time in Table 1 has a shorter time compared to other studies. This indicates that the hyper chaotic image encryption system applied in this paper has faster encryption and decryption speeds.

2.2.3. Information Entropy

Information entropy is an important index used to evaluate the randomness of encryption in chaotic image encryption systems, which directly reflects the security and anti-attack ability of the encryption system. When designing and optimizing the encryption algorithm, the information entropy of the encrypted image can intuitively show the encryption performance of the system. The specific equation of information entropy can be reflected as:
H = i = 0 L 1 P i log 2 P i
where L denotes the gray level—for an 8-bit image, L = 256 —and P i denotes the probability of occurrence of a pixel point with gray value i. The information entropy results are tested for plaintext and ciphertext images under different size conditions, and the results obtained are shown in Table 2.
The information entropy test of plaintext images and ciphertext images of different sizes in Table 2 shows that the results of ciphertext images are close to the theoretical values. It shows that the system has an excellent encryption effect and reflects the security of the system.

2.2.4. Plaintext Sensitivity Test

In a robust chaotic image encryption system, a small change in the plaintext (e.g., a change in the gray value of a pixel) should result in a significant change in the ciphertext. This phenomenon is known as the plaintext sensitivity of an encryption system. Plaintext sensitivity testing of a system is an important tool used to evaluate whether an encryption system is highly sensitive. The commonly used evaluation metrics are NPCR and UACI.
NPCR is used to measure the percentage of different pixels between two ciphertext images. The main equations are as follows:
NPCR = i = 1 M j = 1 N D ( i , j ) M × N × 100 %
D i , j = 1 , i f C 1 i , j C 2 i , j 0 , i f C 1 i , j = C 2 i , j
where M and N are the height and width of the image. The variable D i , j indicates whether the ciphertext pixels have been altered. C 1 i , j and C 2 i , j are the pixel values of the two ciphertext images before and after the small change, respectively.
UACI is used to evaluate the average degree of change in pixel gray values between two cipher images. The definition is as follows:
UACI = i = 1 M j = 1 N C 1 ( i , j ) C 2 ( i , j ) 255 0 M × N × 100 %
where 255 represents the maximum range of variation of pixel gray value under the 8-bit image condition.
Using NPCR and UACI as test metrics for plaintext sensitivity, the test results obtained for different images are shown in Table 3.
The test results for NPCR and UACI for the different plaintext images shown in Table 3 are close to the theoretical results, indicating that the system is highly sensitive. To a certain extent, the ability of the system to resist differential attacks is demonstrated, and the system has strong security performance.

2.2.5. Adjacent Pixel Correlation

To evaluate the effectiveness of the chaotic image encryption system, the correlation between adjacent pixels is assessed. The metric quantifies the degree of correlation in digital images, with high correlations typically found between adjacent pixels in vertical, horizontal, and diagonal directions in unencrypted images. The encryption process aims to significantly reduce these correlations in the ciphertext image to enhance resistance against statistical attacks. The correlation coefficient is computed for 10,000 pairs of randomly selected adjacent pixels from both plaintext and ciphertext images using standard statistical equations. The evaluation helps demonstrate the encryption system’s capability to reduce pixel correlation effectively, thereby improving the security and confidentiality of encrypted image data.
p h l = cov h , l D h D l
cov h , l = 1 α i = 1 α h i R h l i R l
D h = 1 α i = 1 α h i R h 2
R h = 1 α i = 1 α h i
According to the above equation, images showing the correlation of adjacent pixels in different directions between the plaintext image and the ciphertext image, as well as a table of data statistics, are shown in Figure 7 and Table 4.
From the perspective of adjacent pixel correlation, Figure 7 and Table 4 show that the calculated value of adjacent pixel correlation in the ciphertext image is almost 0, indicating that the chaotic image encryption system has excellent security.

3. Implementation Plan

3.1. System Flowchart

The objective of this experiment is to replicate the image transmission conditions encountered by HAPs at close range and assess the influence of chaotic image encryption algorithms on image transmission quality under models of atmospheric turbulence. Figure 8 illustrates the comprehensive architecture and specific configuration of the short-range image transmission system via HAP.
The experimental framework aims to investigate the efficacy and resilience of the encryption algorithms in mitigating atmospheric turbulence disturbances. Through the setup, a systematic analysis and evaluation of chaotic encryption algorithms integrated with HAP atmospheric turbulence can be conducted, thereby offering insights into their practical application performance.
In this experiment, images of sizes 128 × 128, 256 × 256, and 512 × 512 pixels are selected for validation. The experimental setup is depicted using the Cameraman image with a size of 128 × 128 pixels as an illustrative example. Initially, the plaintext image and its corresponding histogram are provided. The histogram of the plaintext image exhibits significant fluctuations, indicative of the image containing diverse visual information. Subsequently, the secret key K 1 is derived through the application of a hash function to the plaintext image, combined with an external key K. The key K 1 is employed to drive a hyperchaotic system, facilitating the encryption of the plaintext image into a ciphertext image using DNA-based image encryption techniques. Due to the irreversibility of the hash function, it is more resistant to attacks and plays a fundamental and important role in the encryption scheme. The specific process is explained in Section 2.2.
In this process, the histogram of the ciphertext image tends to stabilize, indicating that the visible information is significantly reduced and the information entropy increases. Subsequently, the encrypted image is converted into a stream of binary data to perform a heterodyne operation with a random sequence. After the atmospheric turbulence channel, the Log-Normal and Gamma–Gamma models under the aerial platform are applied. The decryption process is the inverse of the encryption process. At the receiving end, the data stream is restored to the original ciphertext image, which is decrypted using the DNA chaotic image decryption algorithm, thus restoring the original image.
The simulation parameters of the given transmission system are shown in Table 5.

3.2. Turbulence Model

Optical communication links offer numerous advantages such as high data rates, wide bandwidth capabilities, and discreet transmission, making them ideal for establishing high-speed and secure air communication links between HAPs. However, the transmission of image information via HAPs is susceptible to various factors that degrade signal quality. These factors include atmospheric attenuation, atmospheric turbulence, changes in meteorological conditions, and platform motion. Turbulence effects within high-altitude atmospheric channels can induce phenomena such as light intensity scintillation and beam spreading. In this study, we focus primarily on investigating the impacts of atmospheric attenuation and atmospheric turbulence on the quality of optical communication links for HAPs.
Typically, atmospheric attenuation is obtained by modeling using the Beer–Lambert law, which can be expressed as h l = e A ψ [41]. Atmospheric turbulence is a prevalent and intricate atmospheric phenomenon that notably impacts image transmission. To simulate the effects of atmospheric turbulence, this study employs established statistical models. Specifically, a Log-normal turbulence model is utilized to represent weak and moderate turbulence conditions, while the Gamma–Gamma turbulence model is applied for simulating strong turbulence. These models enable a detailed analysis of the impact of atmospheric turbulence on image transmission quality within the context of HAPs.
The probability density function of the distribution according to the Log-normal model can be expressed as:
p L N ( I ) = 1 2 2 π σ L N I 2 I exp ( ( ln ( I ) 2 μ L N I ) 2 8 σ L N I 2 )
where I follows a log-normal distribution, μ L N I is the log irradiance mean, and σ L N I 2 is the log irradiance variance. The mean and variance of log irradiance provide a better understanding and prediction of turbulence-induced irradiance fluctuations.
In addition, σ L N I 2 is approximately equal to σ R 2 4 . σ R 2 represents the Rytov variance, which is used to measure the intensity scintillation due to atmospheric turbulence, and can be expressed as [42]:
σ R 2 = 1.23 C n 2 k 7 / 6 L 11 / 6
where C n 2 represents the atmospheric refractive index structure constant, k = 2 π λ represents the wave number, and λ represents the wavelength. L is the distance that the laser beam propagates through the atmosphere.
For strongly turbulent channels, the Gamma–Gamma model is used for simulation. Based on HAP, the model’s distribution function can be expressed as [43]:
p G G ( I ) = 2 ( α β ) α + β 2 Γ ( α ) Γ ( β ) I α + β 2 1 k α β ( 2 α β I )
where Γ ( · ) represents Gamma function, and k n ( · ) is the second type of n-order modified Bessel function. α and β are the effective quantities of large-scale and small-scale eddies, respectively. This mainly depends on σ R 2 . Its expression is:
α = [ exp ( 0.49 σ R 2 ( 1 + 0.65 d 2 + 1.11 σ R 12 / 5 ) 5 / 6 ) 1 ] 1
β = [ exp ( 0.51 σ R 2 ( 1 + 0.69 σ R 12 / 5 ) 5 / 6 ( 1 + 0.9 d 2 + 0.62 d 2 σ R 12 / 5 ) 5 / 6 ) 1 ] 1
where d = ( k D 2 / 4 L ) 1 / 2 , D is the aperture size of the receiver.

4. Simulation and Analysis

4.1. Transmission Performance Analysis

This section investigates the influence of the DNA hyperchaotic image encryption algorithm on HAP close-range transmission performance. It compares the transmission performance of images without encryption and with the DNA hyperchaotic encryption algorithm under turbulent channel conditions. The study evaluates how the encrypted images fare in terms of transmission quality and anti-interference capability after undergoing transmission and decryption in turbulent channels. The analysis aims to assess the effectiveness of the DNA hyperchaotic encryption algorithm in enhancing image transmission quality and resilience to interference in challenging communication environments.
To evaluate the quality changes of images during HAP short-range atmospheric turbulence transmission, this paper utilizes PSNR and SSIM as evaluation indicators. By comparing the PSNR and SSIM values between the original image and the restored image, the image quality can be quantitatively analyzed. This approach allows for an accurate assessment of the impact of atmospheric turbulence and chaotic image encryption algorithms on image transmission performance and verifies the effectiveness of image restoration algorithms.
The PSNR of an image represents the peak error between the restored image data stream and the original plaintext image data stream, expressed as:
PSNR = 10 log 10 ( M A X 2 MSE )
where MAX is the maximum possible value of image pixels. For an eight-bit grayscale image, the typical value is 255. MSE represents the mean square error, which is expressed as:
MSE = 1 M × N i = 1 M j = 1 N ( I ( i , j ) K ( i , j ) ) 2
where I ( i , j ) and K ( i , j ) represent the pixel values of the original plaintext image and the received image, respectively. M, N represent the dimensions of the image.
SSIM is the similarity between the original image and the restored image. A value closer to 1 indicates higher similarity between the images. Typically, the image is characterized by three aspects: luminance l, contrast c, and structural features s. Their expressions are:
l ( x , y ) = 2 μ x μ y + C 1 μ x 2 + μ y 2 + C 1 , c ( x , y ) = 2 σ x σ y + C 2 σ x 2 + σ y 2 + C 2 , s ( x , y ) = σ x y + C 3 σ x σ y + C 3
where μ x and μ y are the average values of the original image and the received image, respectively. σ x and σ y are the standard deviations of the two images, respectively. σ x y represents the covariance of the two images. C i , i = 1 , 2 , 3 is a constant that avoids having a denominator of zero, usually C 3 = C 2 / 2 . The SSIM index is expressed as follows:
SSIM ( x , y ) = [ l ( x , y ) ] δ · [ c ( x , y ) ] θ · [ s ( x , y ) ] γ
In general, δ = θ = γ = 1 ; thus, the SSIM index can be expressed as follows:
SSIM ( x , y ) = ( 2 μ x μ y + C 1 ) ( 2 σ x y + C 2 ) ( μ x 2 + μ y 2 + C 1 ) ( σ x 2 + σ y 2 + C 2 )
We selected Peppers images with a size of 128 × 128 , Cameraman images with a size of 256 × 256 , and Goldhill images with a size of 512 × 512 for verification under three different turbulence intensities: weak, moderate, and strong. For the weak to strong turbulence model, the values of are 10 15 m 2 / 3 , 10 14 m 2 / 3 , 10 13 m 2 / 3 , respectively. The specific effects are shown in Figure 9, Figure 10 and Figure 11.
Figure 9, Figure 10 and Figure 11 show that under weak turbulent channel conditions, the degradation of the transmitted images is nearly negligible. However, in medium and strong turbulent channels, varying degrees of interference affect the image quality. Comparisons between encrypted and unencrypted images, along with histograms and PSNR analyses, reveal that chaotic image encryption algorithms do not introduce interference in image transmission across different turbulence intensities. The PSNR values exceed 40 dB under weak turbulence and remain above 26 dB under strong turbulence, indicating favorable image transmission quality. These findings affirm that the encryption algorithm does not adversely impact communication transmission.Moreover, the decryption algorithm’s efficacy in image recovery enhances the security of transmitted images during transmission.

4.2. Communications Quality Assessment

Section 2.2 evaluates the impact of DNA chaotic encryption algorithms on communication transmission. This section employs quantitative analysis through PSNR and SSIM to assess the communication quality of images before and after transmission with chaotic encryption algorithms. These evaluation metrics comprehensively analyze the effectiveness of chaotic encryption algorithms in maintaining image transmission quality and their overall impact on communication quality. The results provide a robust quantitative foundation for ensuring both the security and fidelity of image transmission. Due to minor variations in each simulation, a bar chart be utilized to illustrate the PSNR evaluation index across five experimental runs. Additionally, images of various sizes are employed to validate the universality and practicality of the encryption algorithms, as show in Figure 12.
Figure 12a–c show the PSNR values between the original image and the restored image under weak turbulence transmission for images of different sizes, with slight fluctuations around 40 dB and a maximum of 45.56 dB. A higher PSNR value indicates less distortion and higher reconstructed image quality. Figure 12d–f show the PSNR values of images of different sizes under moderate turbulence. There is some distortion in the images under moderate turbulence compared to weak turbulence. Compared with weak turbulence, the loss is less than 1dB, and the PSNR values are all around 39 dB, indicating better image quality. Figure 12g–i show the evaluation values of image quality under strong turbulence, with PSNR values dropping below 30 dB but all above 26.20 dB, indicating that strong turbulence has a strong impact on the image, and the noise is relatively dense. In this case, the restored image can still maintain medium quality, which also indicates that the image transmission quality is high and the encryption algorithm has strong anti-interference ability.
Next, SSIM will be utilized to evaluate the quality of images both prior to and following transmission, providing a more sophisticated assessment metric. Table 6 presents the SSIM values corresponding to images of various dimensions under different turbulence intensities.
Table 6 illustrates that for weak and moderate turbulence intensities, the SSIM values approach unity, indicating high image similarity. However, under strong turbulence conditions, SSIM values decrease and exhibit significant fluctuation. Nonetheless, they still ensure substantial similarity between the restored and original images, yielding favorable outcomes.
The comparison of PSNR and SSIM values between the original plaintext image and the decrypted restored image transmitted through turbulent channels demonstrates consistency. This consistency underscores the efficacy of the hyper chaotic image encryption algorithm in maintaining high image quality during HAP image transmission.

4.3. Cropping Attack Test

The preceding section addresses the influence of noise stemming from various atmospheric turbulence channels on image transmission and quality. This section shifts focus to cropping attacks within the overall process, further substantiating the robustness of image algorithms. The cropping attack is the attack method that takes advantage of compromising the integrity of an encryption algorithm or reducing the usability of decryption. It is mainly aimed at scenarios such as military satellite images or security surveillance images, etc., and the images are maliciously cut by the enemy to disrupt information transmission. Specifically, using the Goldhill image sized at 512 × 512 as an example, this section conducts cropping attack tests under two conditions: without turbulence and with turbulence. In the absence of turbulence, the efficacy of the DNA chaotic image encryption algorithm itself against malicious attacks is verified, as depicted in Figure 13.
As shown in Figure 13a–d, 1/16, 1/8, 1/4, and 1/2 of the encrypted image data are cut for Goldhill, respectively. Figure 13e–h show the decrypted images obtained by solving different scale pruning attacks using the DNA hyperchaotic decryption algorithm. Figure 13 shows that despite cropping half of the image, the encryption algorithm scheme successfully recovers and reconstructs the main information of the image. This underscores the encryption scheme’s robustness and its capability to resist interference effectively.
Next, this study explores the impact of image cropping attacks under strong turbulence conditions, illustrated in Figure 14, through qualitative analysis. Specifically, the effects of truncation attacks at ratios of 1/8 and 1/2 are depicted due to their significant truncation proportions. Furthermore, while the preceding analyses are qualitative, the subsequent section provides a quantitative assessment using PSNR values across various cropping ratios under differing turbulence intensities. This quantitative approach offers a more visually intuitive display of the impact through empirical data, detailed in Table 7.
Figure 14 shows that the image can be decrypted at the receiving end after being subjected to strong turbulence channel noise interference even when 1/8 and 1/2 of the data are truncated. This further validates the practicality and security of the encryption scheme in image transmission. Table 7 presents in detail the PSNR between the original image and the decrypted image for four different cropping ratios under conditions of no turbulence, weak turbulence, medium turbulence, and strong turbulence. Despite varying degrees of noise interference caused by turbulence, the PSNR consistently indicate effective performance. Table 7 thus reinforces the robustness and security of the DNA hyperchaotic encryption combined with the FSO image transmission scheme.

5. Conclusions

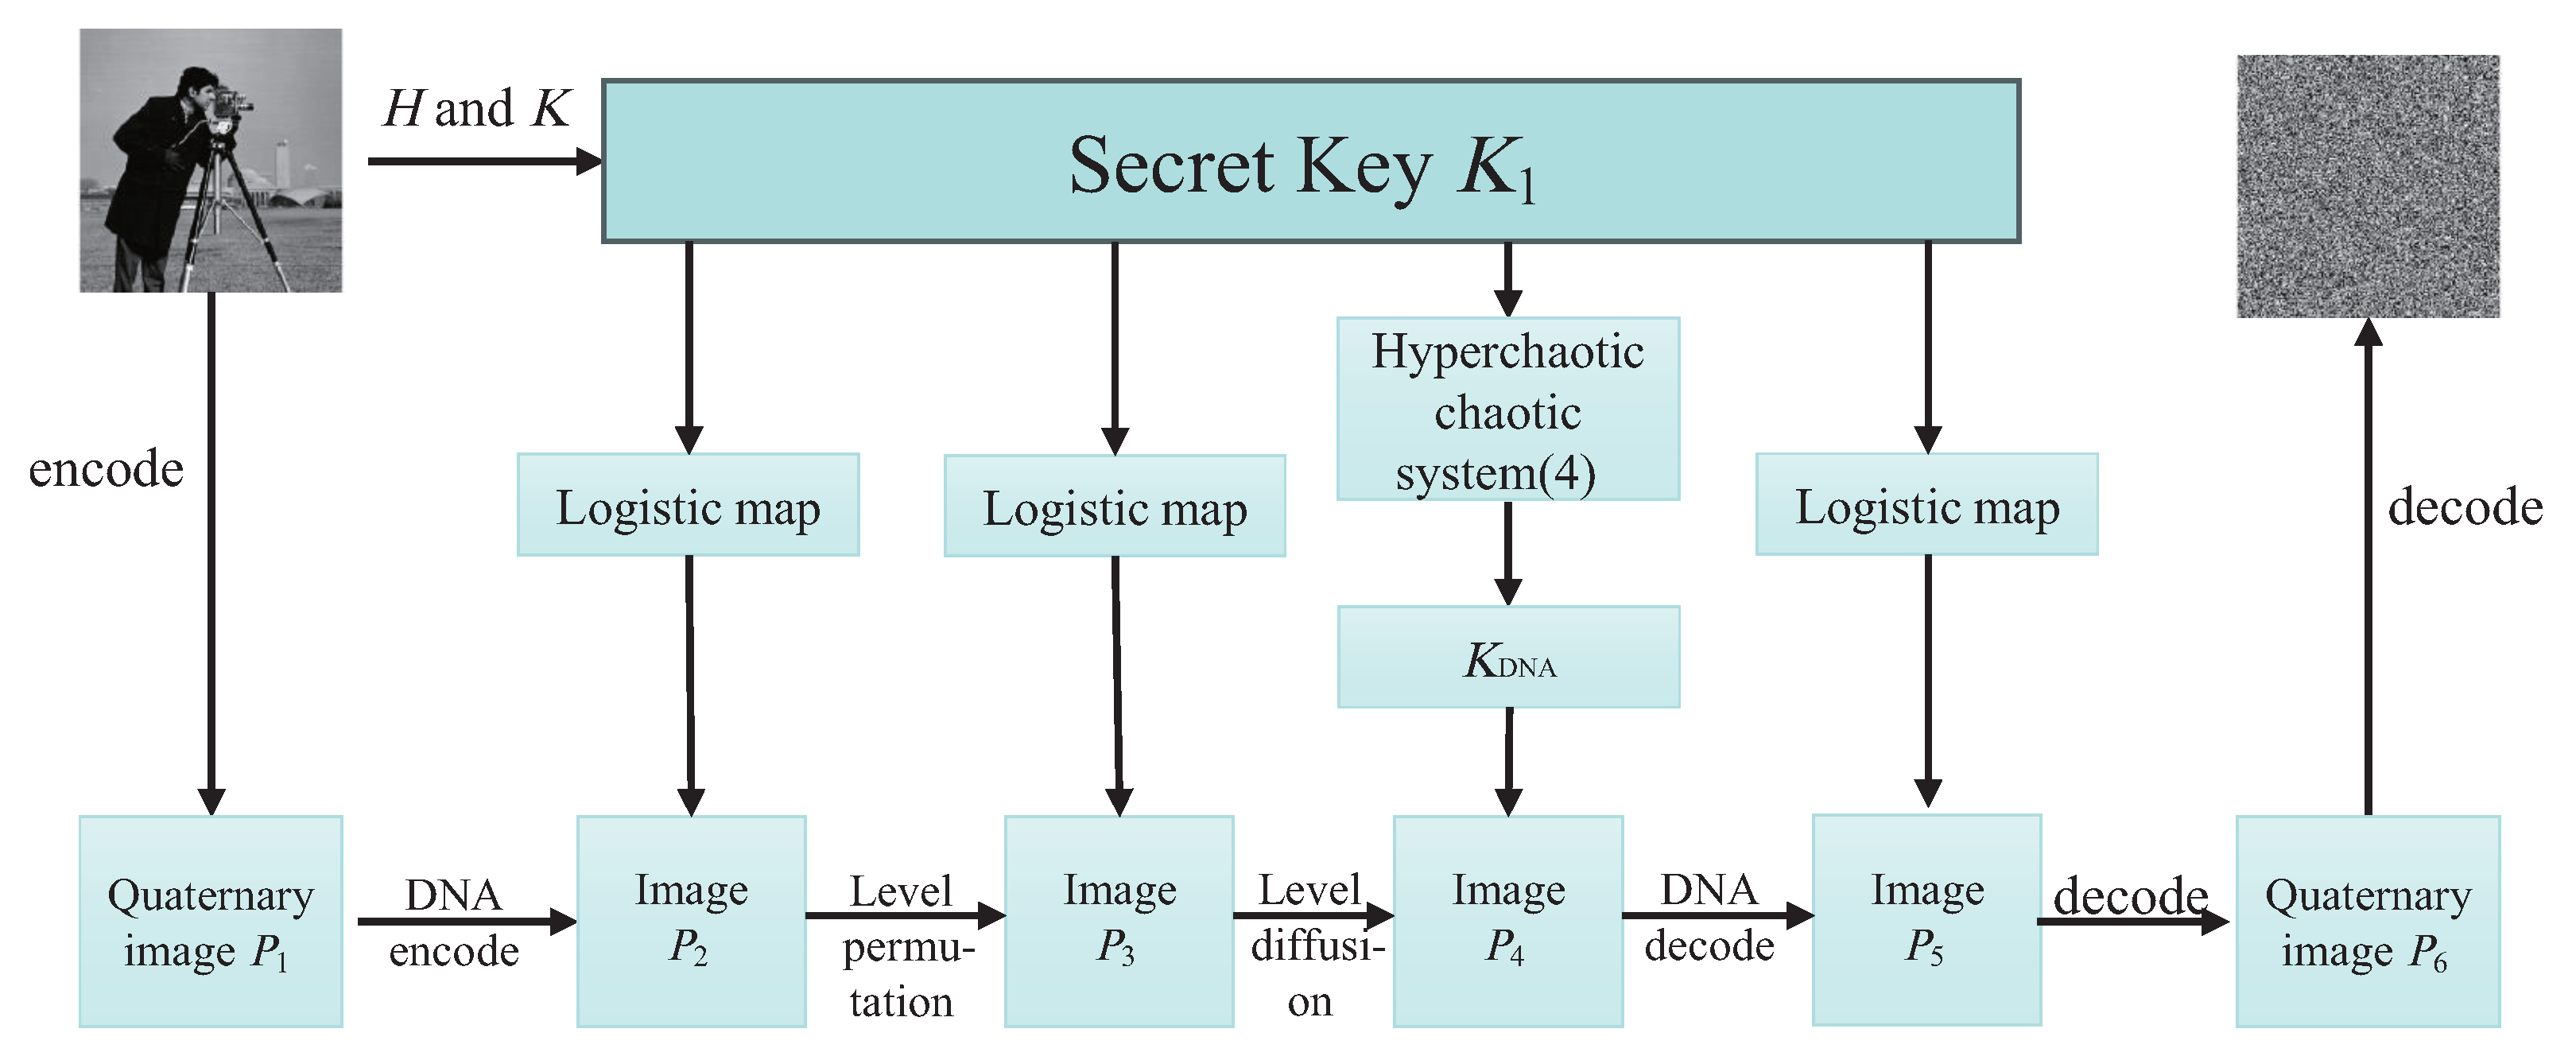
This article presents a methodology for constructing a system model by integrating unknown terms and vectors utilizing a practical three-dimensional system. This article proposes an integrity scheme based on the DNA chaotic image encryption algorithm combined with HAP for close-range image transmission. The encryption model in this scheme adopts an improved five-dimensional hyper chaotic system, chaotic mapping, and DNA encoding technology. The superiority of the encryption system is verified based on encryption and decryption effectiveness, encryption and decryption speed, information entropy, plaintext sensitivity test, and adjacent pixel correlation. Wet selected images with size 128 × 128 , 256 × 256 , and 512 × 512 and compared the impact of using encryption algorithms and not using encryption algorithms on image transmission performance under different turbulence intensities. The results indicate that using encryption algorithms will not have adverse effects on transmission performance and can also successfully recover images. To a certain extent, it can improve the transmission quality of optical communication, and even in strong turbulence conditions, the PSNR value reaches 26.86 dB, further demonstrating great image transmission performance. We also evaluated the communication quality of image transmission using encryption algorithms based on PSNR and SSIM metrics. Under weak and moderate turbulence conditions, the distortion is minimal, resulting in high-quality reconstruction of the image. Although strong turbulence has a significant impact on image quality, the reconstructed image quality remains at a moderate level, indicating that the scheme has strong stability in terms of communication quality. In addition, under cropping attacks, even when up to 50% of the image data is lost and it passes through strong turbulent channels, the image can still be successfully decrypted. In summary, by improving the anti-turbulence and security of image transmission in HAP optical communication, a high degree of robustness has been demonstrated. The experiment verified that under different turbulence intensities, the scheme maintains a high level of transmission quality for images of different sizes, providing solid theoretical support for future research on the anti turbulence and safety performance of HAP optical communication.

Author Contributions

Conceptualization, P.Z. and Z.L.; methodology, P.Z. and J.J.; software, P.Z.; validation, P.Z., J.J. and Z.L.; formal analysis, P.Z.; investigation, K.D.; resources, J.J.; data curation, P.Z.; writing—original draft preparation, P.Z.; writing—review and editing, J.J.; visualization, J.J.; supervision, Z.L.; project administration, K.D.; funding acquisition, Z.L. All authors have read and agreed to the published version of the manuscript.

Funding

This research was funded by National Natural Science Foundation of China Ye Qisun Science Foundation grant number U2141231.

Institutional Review Board Statement

Not applicable.

Informed Consent Statement

Informed consent was obtained from all subjects involved in the study.

Data Availability Statement

No data was used for the research described in the article. Data are contained within the article.

Conflicts of Interest

The authors declare no conflict of interest.

References

  1. Al-Gailani, S.A.; Salleh, M.F.M.; Salem, A.A.; Shaddad, R.Q.; Sheikh, U.U.; Algeelani, N.A. A Survey of Free Space Optics (FSO) Communication Systems, Links, and Networks. IEEE Access 2021, 9, 7353–7373. [Google Scholar] [CrossRef]
  2. Jahid, A.; Alsharif, M.H.; Hall, T.J. A contemporary survey on free space optical communication: Potentials, technical challenges, recent advances and research direction. J. Netw. Comput. Appl. 2022, 200, 103311. [Google Scholar] [CrossRef]
  3. Raj, A.B.; Majumder, A.K. Historical perspective of free space optical communications: From the early dates to today’s developments. IET Commun. 2019, 13, 2405–2419. [Google Scholar] [CrossRef]
  4. Liu, Y.; Li, X.; Li, D.; Zhang, L.; Huang, S. Free-space optical (FSO) feeder link planning in space-ground integrated optical networks (SGIONs): Trade off throughput and dynamics. Opt. Express 2023, 31, 35396–35418. [Google Scholar] [CrossRef]
  5. Farid, A.A.; Hranilovic, S. Outage Capacity Optimization for Free-Space Optical Links With Pointing Errors. J. Light. Technol. 2007, 25, 1702–1710. [Google Scholar] [CrossRef]
  6. Zheng, A.; Huang, Y.; Gao, S. Modeling and Spatial Diversity-Based Receiving Improvement of In-Flight UAV FSO Communication Links. Appl. Sci. 2021, 11, 6365. [Google Scholar] [CrossRef]
  7. Abou-Rjeily, C.; Kaddoum, G.; Karagiannidis, G.K. Ground-to-air FSO communications: When high data rate communication meets efficient energy harvesting with simple designs. Opt. Express 2019, 27, 34079–34092. [Google Scholar] [CrossRef]
  8. Wang, T.; Zhao, X.; Lv, C.; Wang, J.Y.; Song, Y.S.; Yu, X.N. Blimp-Borne Laser Communication Technology Based on Space Dynamic Base Station. IEEE Photonics J. 2021, 13, 1–7. [Google Scholar] [CrossRef]
  9. Chen, D.; Li, Z.; Wang, J.; Lu, H.; Hao, R.; Fan, K.; Jin, J.; Wang, Q.; Wu, S. Experimental study of laser spot tracking for underwater optical wireless communication. Opt. Express 2024, 32, 6409–6422. [Google Scholar] [CrossRef]
  10. Cheng, Z.; Ji, Z.; Su, H.; Gao, Y. Design and simulation of space-based photoelectric imaging stabilization control system. In Proceedings of the 7th International Conference on Control Engineering and Artificial Intelligence, Madurai, India, 17–19 May 2023; pp. 96–101. [Google Scholar]
  11. Marcos, S.; Benedí-García, C.; Aissati, S.; Gonzalez-Ramos, A.; Lago, C.; Radhkrishnan, A.; Romero, M.; Vedhakrishnan, S.; Sawides, L.; Vinas, M. VioBio lab adaptive optics: Technology and applications by women vision scientists. Ophthal. Physiol. Opt. 2020, 40, 75–87. [Google Scholar] [CrossRef]
  12. Kozak, I. Retinal imaging using adaptive optics technology. Saudi J. Ophthalmol. 2014, 28, 117–122. [Google Scholar] [CrossRef]
  13. Miao, M.; Li, X. Gallager Exponent Analysis of Coherent MIMO FSO Systems over Gamma-Gamma Turbulence Channels. Entropy 2020, 22, 1245. [Google Scholar] [CrossRef]
  14. Bhowal, A.; Kshetrimayum, R.S. Transmit Laser Selection for Two Hop Decode and Forward FSO Communication With Pointing Errors. IEEE Commun. Lett. 2019, 23, 2301–2305. [Google Scholar] [CrossRef]
  15. Yu, X.; Xu, G.; Zhang, Q.; Song, Z. Dual-Hop Optical Communication Systems Over Málaga Turbulence Under Pointing Error Impairments With Decode-and-Forward Protocol. IEEE Photonics J. 2022, 14, 1–15. [Google Scholar] [CrossRef]
  16. Mai, V.V.; Kim, H. Beam Size Optimization and Adaptation for High-Altitude Airborne Free-Space Optical Communication Systems. IEEE Photonics J. 2019, 11, 8653891. [Google Scholar] [CrossRef]
  17. Choudhary, N.; Khaitan nee Gupta, V. High Altitude Aeronautical Platform for VoIP: Dependability Analysis. Wirel. Pers. Commun. 2022, 125, 2277–2303. [Google Scholar] [CrossRef]
  18. Zhang, Z.; Liang, X.; Goutsoulas, M.; Li, D.; Yang, X.; Yin, S.; Xu, J.; Christodoulides, D.N.; Efremidis, K.; Chen, Z. Robust Propagation of Pin-Like Optical Beam Through Atmospheric Turbulence. APL Photonics 2019, 4, 076103. [Google Scholar] [CrossRef]
  19. Jurado-Navas, A.; Raddo, T.R.; Garrido-Balsells, J.M.; Borges, B.; Oimos, J.; Monroy, I. Hybrid Optical CDMA-FSO Communications Network Under Spatially Correlated Gamma-Gamma Scintillation. Opt. Express 2016, 24, 16799–16814. [Google Scholar] [CrossRef]
  20. Ata, Y.; Alouini, M.-S. Performance of Integrated Ground-Air-Space FSO Links Over Various Turbulent Environments. IEEE Photonics J. 2022, 14, 3218512. [Google Scholar] [CrossRef]
  21. Singh, D.; Swaminathan, R.; Pham, A.T. Multiple HAPS-Based Space-Air-Ground Network With FSO Communication: A Performance Analysis. Appl. Opt. 2024, 63, 2362–2375. [Google Scholar] [CrossRef]
  22. Li, J.; Yao, H.; Wang, J.; Cao, Z.; Wang, W.; Dong, K.; Hao, Q.; Song, Y.; Liu, X.; Liu, Z.; et al. Experimental Demonstration of a Free Space Optical Wireless Video Transmission System Based on Image Compression Sensing Algorithm. Opt. Express 2023, 31, 41479–41495. [Google Scholar] [CrossRef]
  23. Huang, X.; Bai, Y.; Fu, X. Image Transmission With Binary Coding for Free Space Optical Communications in the Presence of Atmospheric Turbulence. Appl. Opt. 2020, 59, 10283–10288. [Google Scholar] [CrossRef] [PubMed]
  24. Wu, T.; Mou, H.; He, Y.; Liu, Y.; Song, S.; Zhao, L.; Guo, L. Turbulence-Resistant Free Space Optical Communication via Chaotic Block-Matching and 3D Filtering. Opt. Express 2024, 32, 11395–11405. [Google Scholar] [CrossRef]
  25. Zhang, T.; Lu, Z.; Liu, J.; Liu, G. Parameter Estimation of Fractional Chaotic Systems Based on Stepwise Integration and Response Sensitivity Analysis. Nonlinear Dyn. 2023, 111, 15127–15144. [Google Scholar] [CrossRef]
  26. Jie, J.; Zhang, P.; Yang, Y.; Liu, Z. Exponential Change Characteristics of State Variables and Circuit Simulation of Classical Autonomous Systems. Arab. J. Sci. Eng. 2024, 49, 10047–10059. [Google Scholar] [CrossRef]
  27. Li, R.G.; Wu, H.N. Adaptive Synchronization Control With Optimization Policy for Fractional-Order Chaotic Systems Between 0 and 1 and Its Application in Secret Communication. ISA Trans. 2019, 92, 35–48. [Google Scholar] [CrossRef]
  28. Yan, M.; Jie, J.; Zhang, P. Chaotic Systems With Variable Indexs for Image Encryption Application. Sci. Rep. 2022, 12, 19585. [Google Scholar] [CrossRef]
  29. Yan, M.; Zhang, P.; Jie, J. A Simple Construction Method of Multi-Stable Switched Multi-Scroll/Multi-Wing Chaotic System and Circuit Design. IJST-T Electr. Eng. 2024, 48, 103–114. [Google Scholar] [CrossRef]
  30. Jie, J.; Zhang, P.; Zhu, Y.; Li, J.; Yang, Y. Dynamic behavior of small system under the influence of parameters and application of image encryption. Eur. Phys. J. Plus 2024, 139, 214. [Google Scholar] [CrossRef]
  31. Sheng, Q.; Fu, C.; Lin, Z.; Tie, M.; Chen, J.; Sham, C. A One-Time-Pad-Like Chaotic Image Encryption Scheme Using Data Steganography. J. Inf. Secur. Appl. 2023, 78, 103592. [Google Scholar] [CrossRef]
  32. Meng, F.Q.; Wu, G. A Color Image Encryption and Decryption Scheme Based on Extended DNA Coding and Fractional-Order 5D Hyper-Chaotic System. Expert Syst. Appl. 2024, 254, 124413. [Google Scholar] [CrossRef]
  33. Huang, Y.; Huang, H.; Huang, Y.; Wang, Y.; Yu, F.; Yu, B.; Liu, C. Asymptotic Shape Synchronization in Three-Dimensional Chaotic Systems and Its Application in Color Image Encryption. Chaos Soliton Fract. 2024, 184, 114945. [Google Scholar] [CrossRef]
  34. Dong, Q.; Bai, Y.; Zhu, K. A 5-D Memristive Hyperchaotic System with Extreme Multistability and Its Application in Image Encryption. Phys. Scr. 2024, 99, 035253. [Google Scholar] [CrossRef]
  35. Liu, H.; Teng, L.; Zhang, Y.; Shi, R.; Liu, P. Mutil-medical Image Encryption by A New Spatiotemporal Chaos Model and DNA New Computing for Information Security. Expert Syst. Appl. 2024, 235, 121090. [Google Scholar] [CrossRef]
  36. Zefreh, E.Z. An Image Encryption Scheme Based on a Hybrid Model of DNA Computing, Chaotic Systems and Hash Functions. Multimed. Tools Appl. 2020, 79, 24993–25022. [Google Scholar] [CrossRef]
  37. Man, Z.; Li, J.; Di, X.; Sheng, Y.; Liu, Z. Double Image Encryption Algorithm Based on Neural Network and Chaos. Chaos Soliton Fract. 2021, 152, 111318. [Google Scholar] [CrossRef]
  38. Brahim, A.H.; Pacha, A.A.; Said, N.H. Image Encryption Based on Compressive Sensing and Chaos Systems. Opt. Laser Technol. 2020, 132, 106489. [Google Scholar] [CrossRef]
  39. Cao, G.; Tao, Y.; Liu, X.; Zhang, T. Image Encryption Based on a Coined Chaotic System and High-Intensity Encryption Primitives. IEEE Access 2024, 12, 92043–92061. [Google Scholar] [CrossRef]
  40. Zefreh, E.Z. PSDCLS: Parallel Simultaneous Diffusion–Confusion Image Cryptosystem Based on Latin Square. J. Inf. Secur. Appl. 2024, 83, 103785. [Google Scholar] [CrossRef]
  41. Dabiri, M.T.; Sadough, S.M.S.; Khalighi, M.A. Channel Modeling and Parameter Optimization for Hovering UAV-Based Free-Space Optical Links. IEEE J. Sel. Areas Commun. 2018, 36, 2104–2113. [Google Scholar] [CrossRef]
  42. Hu, Z.; Chen, Z.; Li, Y.; Benton, D.M.; Ali, A.A.I.; Patel, M. Adaptive Transceiver Design for High-Capacity Multi-Modal Free-Space Optical Communications With Commercial Devices and Atmospheric Turbulence. J. Light. Technol. 2023, 41, 3397–3406. [Google Scholar] [CrossRef]
  43. Gao, Z.; Liu, H.; Ma, X.; Lu, W. Performance of Multi-Hop Parallel Free-Space Optical Communication Over Gamma-Gamma Fading Channel With Pointing Errors. Appl. Opt. 2016, 55, 9178–9184. [Google Scholar] [CrossRef]
Figure 1. Attractor diagrams and timing diagrams. (a) x 1 x 2 x 3 . (b) x 1 x 2 . (c) x 2 x 3 . (d) timing diagrams.
Photonics 12 00635 g001
Figure 2. Complexity analysis diagram. (a) α 1 [ 29 , 31 ] . (b) α 2 [ 7 , 10 ] .
Photonics 12 00635 g002
Figure 3. The Lyapunov exponent diagrams under different parameter conditions. (a) The large scale Lyapunov exponent diagram. (b) α 1 [ 29 , 31 ] . (c) α 2 [ 9 , 10 ] . (d) α 3 [ 12 , 16 ] .
Photonics 12 00635 g003
Figure 4. Bifurcation diagrams under different parameter conditions. (a) α 1 . (b) α 2 . (c) α 3 .
Photonics 12 00635 g004
Figure 5. Chaotic image encryption system flowchart.
Photonics 12 00635 g005
Figure 6. The results of system encryption and decryption and the corresponding histogram.
Photonics 12 00635 g006
Figure 7. Adjacent pixel correlation. (a) Plaintext image vertical orientation. (b) Ciphertext image vertical orientation. (c) Plaintext image horizontal orientation. (d) Ciphertext image horizontal orientation. (e) Plaintext image diagonal orientation. (f) Ciphertext image diagonal orientation.
Photonics 12 00635 g007
Figure 8. Proximity image transmission system for HAP.
Photonics 12 00635 g008
Figure 9. Transmission effects of images of different sizes with and without algorithms under weak turbulence intensity. (a) Peppers of 128 × 128 . (b) Cameraman of 256 × 256 . (c) Goldhill of 512 × 512 .
Photonics 12 00635 g009
Figure 10. Transmission effects of images of different sizes with and without algorithms under moderate turbulence intensity. (a) Peppers of 128 × 128 . (b) Cameraman of 256 × 256 . (c) Goldhill of 512 × 512 .
Photonics 12 00635 g010
Figure 11. Transmission effects of images of different sizes with and without algorithms under strong turbulence intensity. (a) Peppers of 128 × 128 . (b) Cameraman of 256 × 256 . (c) Goldhill of 512 × 512 .
Photonics 12 00635 g011
Figure 12. PSNR quantification of images of different sizes under weak, moderate, and strong turbulence intensity. (a,d,g) Peppers of 128 × 128 . (b,e,h) Cameraman of 256 × 256 . (c,f,i) Goldhill of 512 × 512 .
Photonics 12 00635 g012
Figure 13. Cropping attack test effect diagram. (a,e) 1/16. (b,f) 1/8. (c,g) 1/4. (d,h) 1/2.
Photonics 12 00635 g013
Figure 14. Cropping attack test diagram under strong turbulence. (a,c) 1/8. (b,d) 1/2.
Photonics 12 00635 g014
Table 1. Encryption and decryption time test.
ImageSizeEncryption ProcessDecryption Process
Peppers 128 × 128 0.01880.0255
Clock 256 × 256 0.07070.1045
Cameraman 256 × 256 0.06920.1051
Boat 512 × 512 0.26840.4455
Cameraman 512 × 512 0.26950.4104
Airplane 1024 × 1024 1.12371.6686
Ref. [37] 256 × 256 0.2346-
Ref. [38] 512 × 512 0.1038-
Ref. [39] 1024 × 1024 10.1894-
Table 2. Information entropy test results.
ImageSizePlaintext ImageCiphertext ImageTheoretical Value
Clock 256 × 256 6.70567.99758
Cameraman 256 × 256 7.00977.99768
Boat 512 × 512 7.19147.99938
Baboon 512 × 512 7.35797.99928
Cameraman 512 × 512 7.04237.99938
Airplane 1024 × 1024 6.83037.99988
Ref. [37] 256 × 256 -7.99818
Ref. [30] 512 × 512 7.35797.99948
Ref. [40] 1024 × 1024 5.77987.99938
Table 3. Test results of plaintext sensitivity of different images.
ImageSizeNPCR (0.996094)UACI (0.334635)
Clock 256 × 256 0.995770.33551
Cameraman 256 × 256 0.995720.33486
Boat 512 × 512 0.996160.33415
Baboon 512 × 512 0.996090.33491
Cameraman 512 × 512 0.996100.33426
Airplane 1024 × 1024 0.996100.33426
Ref. [37] 256 × 256 0.996120.33452
Ref. [30] 512 × 512 0.996080.33448
Ref. [40] 1024 × 1024 0.996080.33486
Table 4. Adjacent pixel correlation between plaintext and ciphertext images.
ImageSizePlain ImageEncrypted Image
Vertical Horizontal Diagonal Vertical Horizontal Diagonal
Peppers 128 × 128 0.93730.95100.8916−0.0399−0.0222−0.0061
Cameraman 256 × 256 0.91230.93880.87390.0047−0.0042−0.0021
Goldhill 512 × 512 0.97210.97340.9538−0.0102−0.0020−0.0030
Table 5. System simulation parameters.
ParameterSymbolValue
Atmospheric refractive index structure constant C n 2 10 15 m 2 / 3 10 13 m 2 / 3
DistanceL2000 m
Wavelength λ 1550 nm
Receiver aperture radiusr20 cm
Receiver aperture sizeD1260 cm2
Table 6. SSIM value comparison table.
Turbulence IntensityIndexImageSizeValue
Weak turbulenceSSIMPeppers 128 × 128 0.9861
Cameraman 256 × 256 0.9754
Goldhill 512 × 512 0.9823
Moderate turbulenceSSIMPeppers 128 × 128 0.9859
Cameraman 256 × 256 0.9639
Goldhill 512 × 512 0.9791
Strong turbulenceSSIMPeppers 128 × 128 0.8082
Cameraman 256 × 256 0.6132
Goldhill 512 × 512 0.7135
Table 7. Comparison of PSNR values under cropping attack.
CropWithout TurbulenceWeak TurbulenceModerate TurbulenceStrong Turbulence
1/1620.640020.599320.583519.7528
1/817.661417.643517.637217.2057
1/414.684114.674414.673114.5018
1/211.715211.712311.712011.6574
Disclaimer/Publisher’s Note: The statements, opinions and data contained in all publications are solely those of the individual author(s) and contributor(s) and not of MDPI and/or the editor(s). MDPI and/or the editor(s) disclaim responsibility for any injury to people or property resulting from any ideas, methods, instructions or products referred to in the content.

