Article

High-Precision Diagnosis of the Whole Process of Laser-Induced Plasma and Shock Waves Using Simultaneous Phase-Shift Interferometry

by
Lou Gao
,
Hongchao Zhang
*,
Jian Lu
* and
Zhonghua Shen
School of Physics, Nanjing University of Science and Technology, Nanjing 210094, China
*
Authors to whom correspondence should be addressed.
Photonics 2025, 12(6), 601; https://doi.org/10.3390/photonics12060601
Submission received: 15 April 2025 / Revised: 22 May 2025 / Accepted: 26 May 2025 / Published: 11 June 2025
(This article belongs to the Special Issue Advances in Laser Measurement)

Abstract

This study employs the simultaneous phase-shift interferometry (SPSI) system to diagnose laser-induced plasma (LIP) and shock wave (SW). In high-density LIP diagnostics, the Faraday rotation effect causes probe light polarization deflection, rendering traditional fixed-phase-demodulation methods ineffective, the Carré phase-recovery algorithm is adopted and its applicability is verified. Uncertainty analysis and precision verification show that the total phase shift uncertainty is controlled within 0.045 radians, equivalent to a refractive index accuracy of 8.55 × 10 6 , with sensitivity to weak perturbations improved by approximately one order of magnitude compared to conventional carrier-frequency interferometry. Experimental results demonstrate that the SPSI system precisely captures the initial spatiotemporal evolution of LIP and tracks shock waves at varying attenuation levels, exhibiting notable advantages in weak shock wave detection. This research validates the SPSI system’s high sensitivity to transient weak perturbations, offering a valuable diagnostic tool for high-vacuum plasmas, low-pressure shock waves, and stress waves in optical materials.

1. Introduction

In recent decades, the application of laser-induced plasma (LIP) and its shock wave (SW) has expanded to various fields, such as laser shock peening (LSP) [1], laser shock cleaning (LSC) [2], laser ignition [3], and pulsed-laser deposition (PLD) [4]. Among the non-contact diagnostic techniques used for LIP and SW, laser interferometry stands out for its unique advantages over methods like shadowgraphy, holography, and laser beam deflection. Unlike shadowgraphy and streak photography, which provide qualitative intensity distributions, interferometry enables quantitative phase measurements with nanometer-scale resolution, directly mapping the plasma refractive index and electron density [5]. While holography focuses on wavefront reconstruction and beam deflection probes offer pointwise measurements, interferometry captures full-field spatial data in a single exposure, resolving complex spatio-temporal dynamics without scanning [6]. Additionally, compared to laser-induced breakdown spectroscopy (LIBS) techniques [7], interferometry achieves non-contact, real-time diagnostics with nanosecond-to-femtosecond temporal resolution, making it ideal for ultra-fast transient processes. These capabilities make interferometry particularly well-suited for the high-precision dynamic characterization required in advanced applications such as LSP and PLD.
Laser interferometry is well-established for studying the dynamic evolution and spatio-temporally resolved density profiles of LIP and SW, particularly due to its high spatial and temporal resolutions. Breitling et al. used this technique to investigate the distinct behaviors of shock wave expansions and electron density distributions in LPP generated at different laser wavelengths [8]. Tao, Harilal, and coworkers observed shock wave-induced density jumps in laser pulses propagating through background air and compared the density profiles of single- and dual-pulse laser-produced Sn plasmas, revealing that dual-pulse-driven plasmas exhibit density profiles shifted farther from the target surface [9,10]. Sobra et al. characterized the evolution of plasma [11], shock waves, and compressed air from LPP in air, while Mao et al. studied the early stages of plasma formation during the picosecond laser ablation of metal targets [12]. Zhang et al. mapped the temporal and spatial evolution of electron densities in air-based LPP over 18–100 ns [5]. However, existing studies primarily focus on systems with substantial beam perturbations, such as the initial stages of LIP and SW evolution, whereas investigations of subtle perturbations remain limited. Because in conventional carrier-frequency interferometry, weak perturbations induce minimal fringe deflections [13], which can introduce errors (e.g., aliasing and frequency-domain leakage) during image processing, significantly degrading the measurement accuracy of traditional interferometry.
Many applications require high-precision measurement of transient faint perturbation processes, such as the preparation of extreme ultraviolet and soft X-ray sources [14], PLD technology [4], etc. In these applications, the true phase information is difficult to demodulate from conventional carrier frequency interferograms because the perturbations caused by LIP and SWs on the probe beam are minimal. Furthermore, the extensive use of image processing techniques increases the risk of introducing measurement errors. Moreover, in fields such as the medical industry [15], manufacturing industry [16], and non-destructive testing technology [17], the necessity to use extremely low laser energy injection to minimize damage constraints the applicability of traditional interferometric measurement techniques.
To address these limitations, the simultaneous phase-shift interferometry (SPSI) system was empolyed to enhance the interferometric accuracy of transient process in this study. While the SPSI technique has been previously used for the quantitative observation of dynamic phenomena—such as the three-dimensional refractive index imaging reported by Fukuda et al. [18]—this study extends its utility through targeted modifications in LIP and SW diagnostics. Specifically, in high-density LIP diagnostics, the Faraday rotation effect [19,20,21] induces polarization plane deflection of the probe light, introducing deviations from the ideal π / 2 phase differences in the four interferograms and rendering traditional fixed-phase demodulation methods ineffective. Regarding this issue, this study explores the use of the Carré phase recovery algorithm [22] as an alternative to traditional algorithms and verifies the applicability of this method.
Furthermore, the improved SPSI system was employed to analyze the complete evolution process of LIP and SW—from their initial spatio-temporal development to attenuation-stage tracking. Through experimental validation, the system’s capability to detect transient weak perturbations was demonstrated. By integrating the Carré phase recovery algorithm, this study not only addresses the limitations of SPSI in high-electron-density environments but also provides a robust methodology for quantitative phase diagnostics in transient optical weak perturbations. These findings offer new perspectives for optimizing laser-material interaction processes and enhancing the precision of LIP and SW related measurements, also with potential applications in high-vacuum plasma diagnostics, low-pressure shock waves detect, and stress waves nondestructive testing in optical materials [23,24].

2. Principle of the Technique

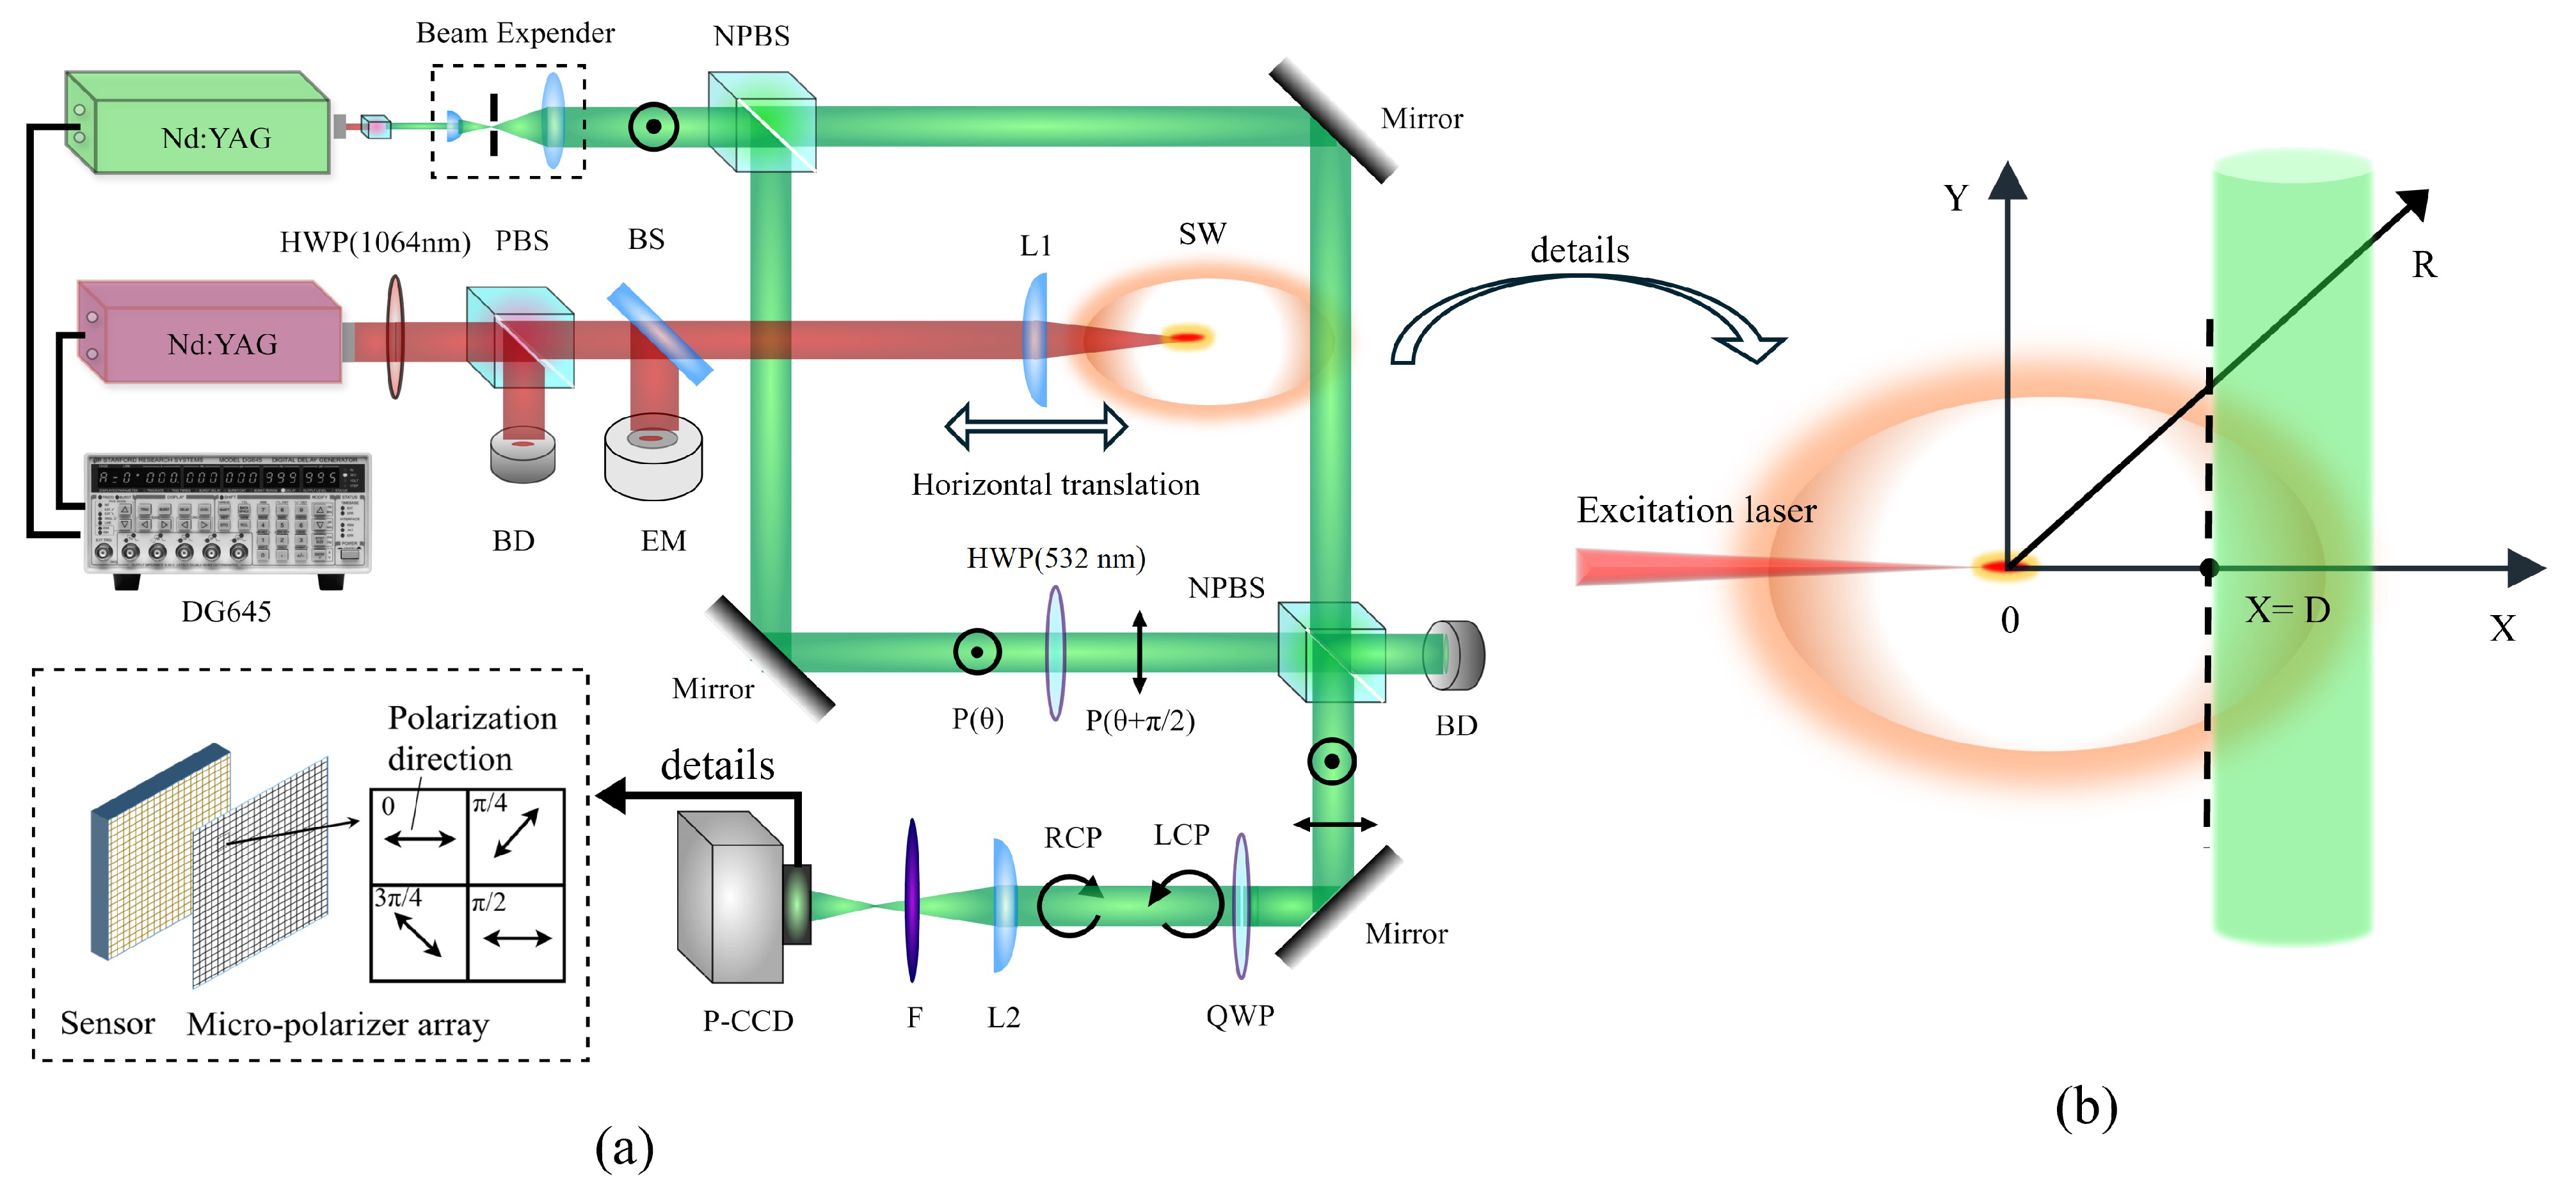
2.1. Optics Diagnosis of LIP and SW

In the research of laser-induced plasma (LIP) and shock waves, the refractive index is a crucial parameter, which is closely related to the electron density and molecular density [9,10]. Obtaining accurate refractive index information through specific interference diagnosis methods is of great significance for deeply understanding the physical properties of LIP and shock waves. When a light wave passes through the regions of LIP and shock waves with a refractive index of n ( x , y , z , t ) , its phase distribution ϕ ( x , y , t ) can be expressed as [5]:
ϕ ( x , y , t ) = 2 π λ Δ n ( x , y , z , t ) d z
where Δ n ( x , y , z , t ) = n ( x , y , z , t ) n 0 , n 0 is the reference refractive index (the reference refractive index of air is 1.0003), and λ is the wavelength of the laser beam used for recording the hologram. When the refractive index n ( x , y , z ) is axially symmetric along the y-axis, according to the Abel transform, we have:
ϕ ( x , y , t ) = 2 z ε ( r , y , t ) r 2 y 2 · r d r = ε ( r , y , t ) · d z
Here, the radius r = x 2 + z 2 , ϕ ( x , y , t ) is the phase distribution, and ε ( r , y , t ) is the product of the wavenumber and the refractive index distribution. In the region where | z | > z 0 , if the refractive index is constant, the phase distribution ϕ ( x , y , t ) is:
ϕ ( x , y , t ) = z 0 z 0 2 π λ Δ n ( r , y , t ) d z
Conversely, when the phase distribution is known, the refractive index distribution in the cylindrical coordinate system can be calculated using the Abel inversion. The Abel inversion formula is [18,25,26]:
n ( r , y , t ) = 1 π r 1 x 2 r 2 λ · d ϕ 2 π · d x d x d x + C = λ 2 π 2 r d ϕ d x 1 x 2 r 2 d x + C
where C is the integration constant, and usually C = n 0 . When the phase is constant when r > R , the refractive index obtained by Abel inversion is:
n ( r , y , t ) = n 0 + λ 2 π 2 r r m a x Δ ϕ ( x , y , t ) d x 1 x 2 r 2 d x
where r m a x is an arbitrary maximum value of r. The refractive index is directly related to the electron density and molecular density through the following relationship:
n = 1 e 0 2 8 π 2 ε 0 m e c 2 λ 2 N e + k A k + B k λ 2 N k N A
In this formula, λ is the wavelength of the probe laser radiation, e 0 is the elementary charge, m e is the electron mass, ε 0 is the dielectric constant, c is the speed of light in vacuum, and N A is the Avogadro constant. N e and N k are the number densities of free electrons and the k-th type of particles, respectively, and A k and B k are the gas-specific constants for these particles.
By obtaining the phase distribution through the above interference method and then performing calculations such as Abel inversion, the refractive indices of LIP and shock waves, which are closely related to the electron density and molecular density, can be obtained. This provides crucial data support for further studying their properties.

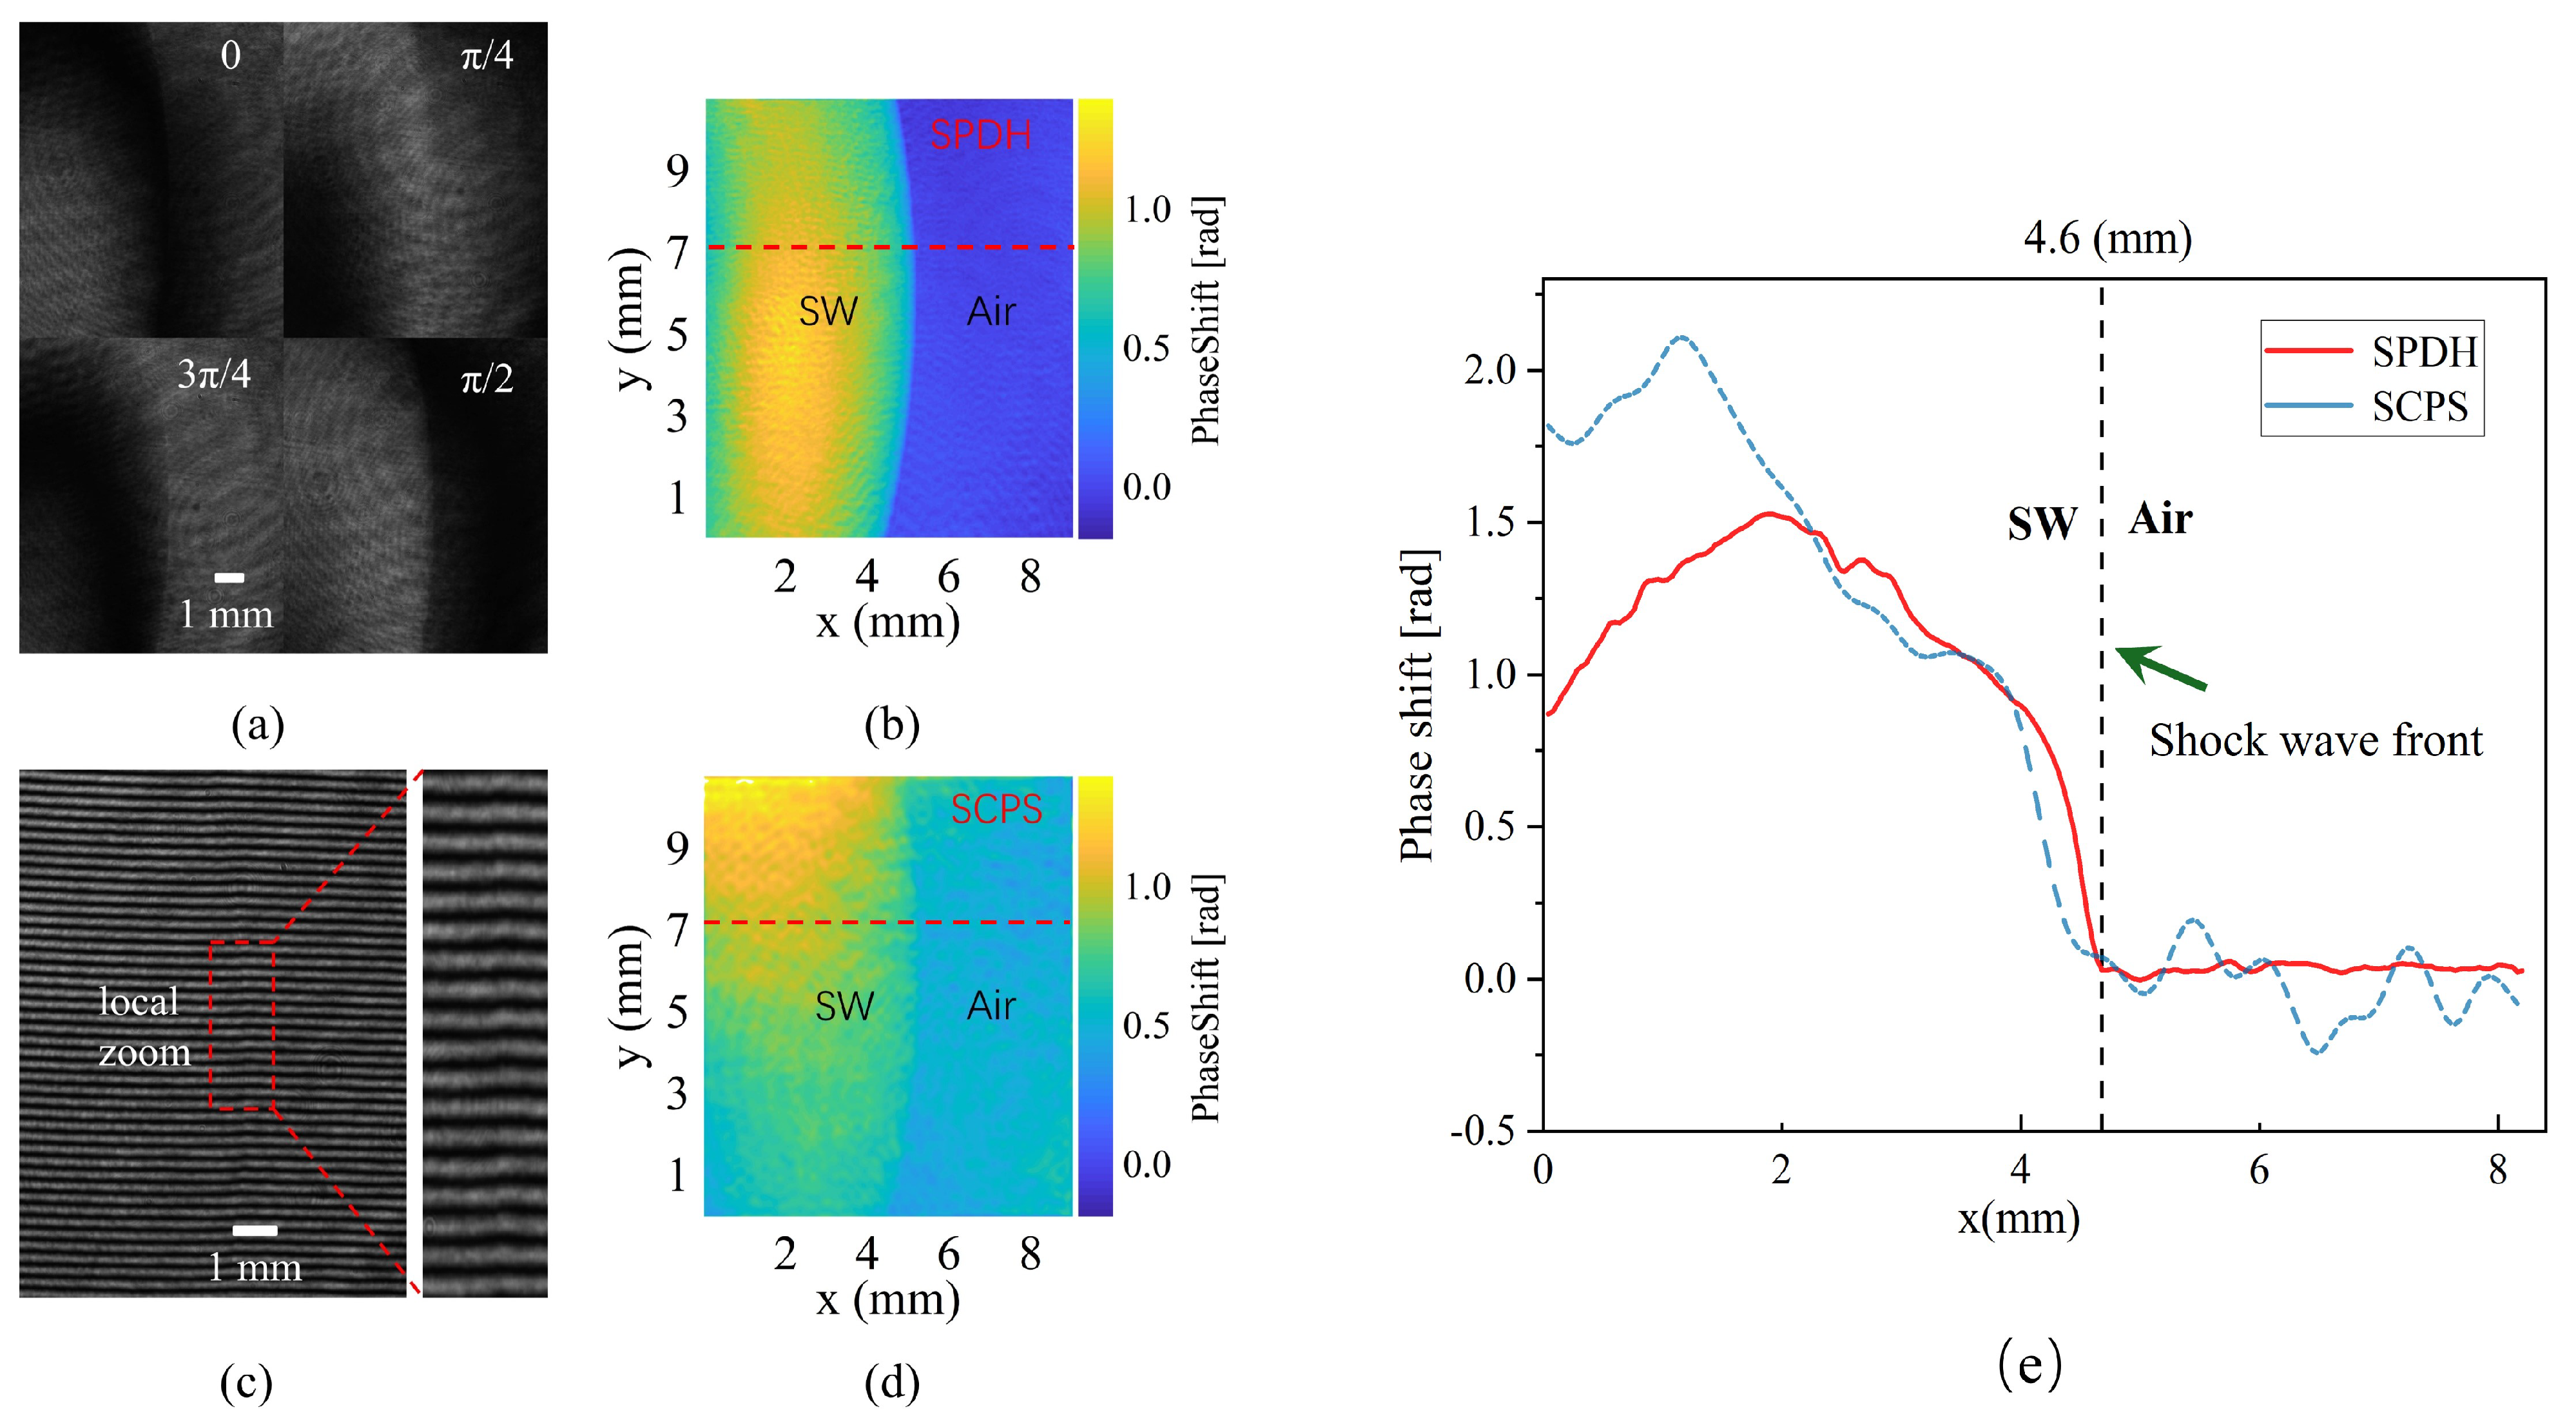
2.2. Simultaneous Phase-Shifting Interferometry

The SPSI technique allows for the single-shot recording of multiple interferogram necessary for phase-shifting interferometry using just one image sensor. The schematic in Figure 1 illustrates the principle of SPSI. Multiple interferograms, essential for phase-shifting interferometry, are recorded simultaneously on a single image sensor through space-division multiplexing. Pixels with identical phase shifts are identified within the recorded interferogram. The missing pixels in each interferogram are estimated by utilizing neighboring pixels. The amplitude and phase images on the image sensor plane are reconstructed without unwanted artifacts through a numerical process employed in SPSI [27]. A simple interferometer can measure the phase change of the object wave on the image sensor. However, the phase distribution on the image sensor plane differs from that on the object plane due to the diffraction of the object wave propagation. This difference can decrease the accuracy of the phase change measurement by a simple interferometer. Conversely, SPSI can reconstruct the phase change on the object plane by backpropagating the object wave from the image sensor plane to the object plane, eliminating the influence of diffraction. Therefore, SPSI can provide a more accurate phase distribution than a simple interferometer. In this study, we utilized the Carré method to calculate the backpropagation of the object wave from the image sensor plane to the object plane.

3. Experiment

3.1. Experimental Setup and Data Processing

The SPSI system used for transient perturbation processes imaging is illustrated in Figure 2a. A pulsed laser ( λ = 532 nm, FWHM = 7 ns) is collimated and expanded before entering the interferometer. After expansion, the beam passes through a 50/50 non-polarizing beam splitter (NPBS). One arm of the beam functions as a reference and is routed through a half-wave plate to polarize the laser vertically. The second arm passed through a field containing LIP and SWs, which served as the probe light. Next, the detection and reference waves are combined in another NPBS and passed through a quarter wave plate to generate circularly polarized light. The camera (LUCID Camera, PHX050S-PC, 12-bit depth, 2048 × 2448 pixels, pixel size of 3.45 μ m) used for these experiments has a micro-polarizer array before sensor for improving quantum efficiency (72% at 532 nm) and an on-chip wire grid polarizer array (300:1 polarization extinction ratio for each pixel at 532 nm) for capturing light from multiple polarizations at the same time. By capturing all four images on a single camera, this technique reduces setup complexity when compared with alternative two-camera techniques [28]. In addition, the Mach-Zehnder configuration is more suitable for ultra-short and ultra-fast process diagnostics. Since all the interferograms are captured simultaneously, this technique is well suited for single-shot acquisitions of ultrafast and ultra-short process [29].
To generate the LIP and SW, another Q-switched laser ( λ = 1064 nm, FWHM = 10 ns) is focused by a convex lens (f = 50 mm) and induces the air breakdown. For comparison with previous studies, the pulse energy used was each time stabilized at about 105 mJ per pulse [5]. The lens L1 is horizontally translated to create SWs with varying attenuation distances for detection purposes. To reduce plasma luminescence and improve the signal-to-noise ratio of the image, a band-pass filter ( λ = 532 nm, FWHM = 10 ns) is placed in front of the camera. A digital pulse delay generator (Standford DG645) is employed to control the delay time between the excitation laser and detection laser, allowing the acquisition of an image with a different delay. In Figure 2b, the edge position of the detection laser indicates the camera’s field of view boundary. The camera remains fixed during calibration, and the distance D is measured from the focal point of the lens to the edge of the camera field of view along the excitation direction. As shown in Figure 2a, prior to exiting the CMOS pixel, both left circularly polarized light (LCP) and right circularly polarized light (RCP) traverse a sensor consisting of multiple micro-polarizers. These micro-polarizers are organized in groups of four (2 × 2) units, with each unit containing micro-polarizers aligned at different optical axis angles: 0, π /4, π /2, and 3 π /4. By measuring the intensity of light passing through a polarizer in a specified direction, a sensor can simultaneously capture interferograms in four different polarization directions at a specific moment.

3.2. Data Processing and Error Calibration Method

Before the reference light and detection light reaches the grid polarizer array before the camera, the phase delay angle ϕ is considered to consider the phase’s relativity. Thus, it can be expressed as:
I ( ϕ ) = I e + I r + 2 I e I r cos ( ϕ + δ )
where I is the light intensity, I e and I r are the light intensity of the probe and the reference beams, respectively. ϕ represents the phase delay angle, and δ is the phase difference between the light waves of the detection laser and the reference laser. By conducting matrix optical calculations on the PPSI system utilized in this experiment, the phase shifts of the four fringe patterns were 0, π / 4 , π / 2 , and 3 π / 4 . Therefore, the phase to be measured, which contains information about the LIP and SW, can be expressed as follows:
ϕ ( x , y ) = arctan I 3 ( x , y ) I 1 ( x , y ) I 2 ( x , y ) I 4 ( x , y )
However, in diagnosing the LIP of high electron density, the polarization plane of the detected light is somewhat deflected due to the Faraday rotation effect [19,20,21]. Faraday rotation is the phenomenon where linearly polarized light undergoes a rotation while passing through a Faraday medium. In the case of plasma being used as a Faraday medium, the rotation angle of the polarized light can be expressed as
α = e 3 λ 2 8 π 2 ε 0 m e 2 c 3 n e B · d l
Here, α represents the rotation angle, n e is the electron density, B is the magnetic field component parallel to the probe light, and the integral is taken along the light path through the plasma. In the initial stage of LIP formation, the electron density can reach values as high as 10 19 cm 3 [5], which is three orders of magnitude higher than the critical density (∼ 10 16 cm 3 ) for significant Faraday rotation effects. According to Equation (9), such extremely high electron densities inevitably induce measurable polarization rotation angles (typically α > 0.1 rad ), even under moderate magnetic fields ( B 0.1 T ).
The SPSI relies on polarization-modulated phase shifts to encode optical phase information, where the probe light’s polarization state is manipulated via elements like half-wave plates, quarter-wave plates, and micro-polarizer arrays. In the ideal scenario, these components introduce strictly periodic phase differences (theoretically π / 2 ) between four simultaneously recorded interferograms, enabling precise phase recovery (Equation (8)). However, the polarization state distortion of probe lights causes the actual phase differences between the four interferograms to deviate from the nominal π / 2 .
To address this issue, the phase recovery algorithm needs to be improved. During each transient imaging process, when the probe light pulse width (7 ns employed in this study) is significantly shorter than the perturbation characteristic time, the polarization plane rotation angle α of the probe light induced by the Faraday rotation effect can be treated as a constant. Consequently, in each transient imaging process, the phase shift error between the four interferograms acquired by SPSI is a constant value. Thus, the phase shift value between each interferogram can be regarded as constant for a specific time point. Using the Carré method [22], the phase shift ( δ ± ε ) is treated as an unknown value. The method uses four phase-shifted images:
I 0 = I e + I r + 2 I e I r cos [ ϕ 3 ( δ ± ε ) 2 ] I π 2 = I e + I r + 2 I e I r cos [ ϕ ( δ ± ε ) 2 ] I π = I e + I r + 2 I e I r cos [ ϕ + ( δ ± ε ) 2 ] I 3 π 2 = I e + I r + 2 I e I r cos [ ϕ + 3 ( δ ± ε ) 2 ) ] ,
Then, the phase at each point is determined as follows:
ϕ = tan 1 I 1 I 4 + I 2 I 3 3 I 2 I 3 I 1 I 4 I 2 + I 3 I 1 + I 4 ,
However, the phase value obtained by the above formula (Figure 3a) is wrapped in [ π , π ] as shown in Figure 3b. For a continuously varying physical quantity, the wrapped phase must be extended to an absolute phase via phase unwrapping techniques. The relationship between the wrapped phase (relative phase) and the unwrapped phase (absolute phase) is described as follows:
ψ ( i , j ) = φ ( i , j ) + 2 k ( i , j ) π
where ψ ( i , j ) represents the absolute phase, k ( i , j ) is an integer corresponding to the interference fringe order, and indices i and j denote the elements in the i-th row and j-th column, respectively.
For the phase unwrapping in this context, we utilize the algorithm detailed in Reference [30]. The phase unwrapping result is presented in Figure 3c. In Figure 3d, a one-dimensional phase curve at a position 0.5 mm from the target (denoted by a dashed line) within the two-dimensional image is shown, clearly illustrating the process of unwrapping the phase from the wrapped interval of [ π , π ] .

3.3. Uncertainty Discussion and Precision Analysis

To address the reliability of experimental results and comply with rigorous scientific standards, this section quantifies the uncertainties and evaluates the measurement precision of the proposed SPSI system. The primary sources of uncertainty arise from three aspects: phase shift recovery errors, systemic noise and stability.
The Carré phase recovery algorithm, crucial for extracting phase information from four polarized interferograms, brings in inherent errors. These are influenced by the signal to noise ratio (SNR) and phase shift uniformity. In high-electron-density plasma, the Faraday rotation effect causes an unknown constant phase shift δ ± ε , which the Carré method treats as a global parameter. When the SNR exceeds 30 dB, achieved by a 532 nm band—pass filter reducing plasma luminescence noise, the root-mean-square (RMS) phase error is limited to ± 0.002 radians for uniform phase shifts. For non-uniform perturbations like shock wave fronts, spatial variations in light intensity I e and I r (as in Equation (1)) introduce additional errors, estimated as ± 0.005 radians, considering the camera’s polarization extinction ratio of 300:1 and pixel-to-pixel sensitivity variation of ± 2 % .
The optical components and experimental setup contribute to systematic uncertainties. The micro—polarizer array’s alignment error of ± 0 . 5 for the 0, π / 4 , π / 2 , 3 π / 4 axes introduces a phase bias of ± 0.01 radians, disrupting proper light polarization and phase measurements. The pump laser (1064 nm, 105 mJ per pulse) with ± 1.5 % energy stability and the probe laser (532 nm) with ± 1 % stability cause variations in plasma electron density and refractive index perturbations, leading to a ± 3 % relative uncertainty in the phase shift magnitude. The digital delay generator (DG645) has a timing jitter of ± 50 ps. Given the shock wave’s nanosecond to microsecond evolution timescale, this jitter is negligible and causes no appreciable phase error. The 12-bit CMOS sensor’s readout noise ( ± 0.1 % of full well capacity) and stable dark current at 20 C contribute an RMS noise of ± 0.03 in intensity measurements, equivalent to ± 0.002 radians in phase for low-contrast fringes. The total uncertainty in the measured phase shift ϕ is calculated as the quadrature sum σ ϕ = σ Carr é 2 + σ pol 2 + σ laser 2 + σ camera 2 , approximately ± 0.008 radians. This corresponds to a refractive index uncertainty of Δ n ± 1.52 × 10 6 (for λ = 532 nm), is much smaller than the 10 3 order of magnitude in the experimental results provided by the literature [5] for the same measurement object.
The above discusses the uncertainties in the proposed algorithms, optical components, and detectors. To determine the detection system’s accuracy by accounting for all uncertainties, background jitter is used for quantification. In the SPSI system, the phase shifts of LIP and SW are derived relative to the phase of the background interferogram. To determine the minimum detectable phase shift (phase shift precision), the stability of the background interferogram’s phase must be considered. As shown in Figure 4a, 50 trials were conducted with an interval of over 10 min between each trial (to ensure the environment returned to its prior state), and the acquired background interferograms were processed using the method described above (Section 3.2). Due to speckle noise in the light spot and environmental vibrations, the phase of each interferogram exhibited non-constant fluctuations. After calculating the root-mean-square error (RMSE) for all background phases obtained, the two-dimensional phase distribution histogram in Figure 4b reveals that phase jitter values range from 0.01 to 0.08 radians, with an average of 0.045 radians. Based on these experiments, the system’s minimum resolvable phase shift is determined to be approximately 0.045 radians, meaning that phase shifts of LIP or SW exceeding this value can be regarded as accurate.
In summary, the comprehensive uncertainty analysis demonstrates that the SPSI system exhibits rigorous control over measurement errors, with total phase shift uncertainty and refractive index uncertainty both lying well below the magnitudes of experimental results, thereby ensuring the reliability of quantitative phase measurements. Accuracy analysis further confirms that the system can discriminate phase shifts in excess of 0.045 radians, corresponding to a refractive index accuracy of Δ n ± 8.55 × 10 6 .

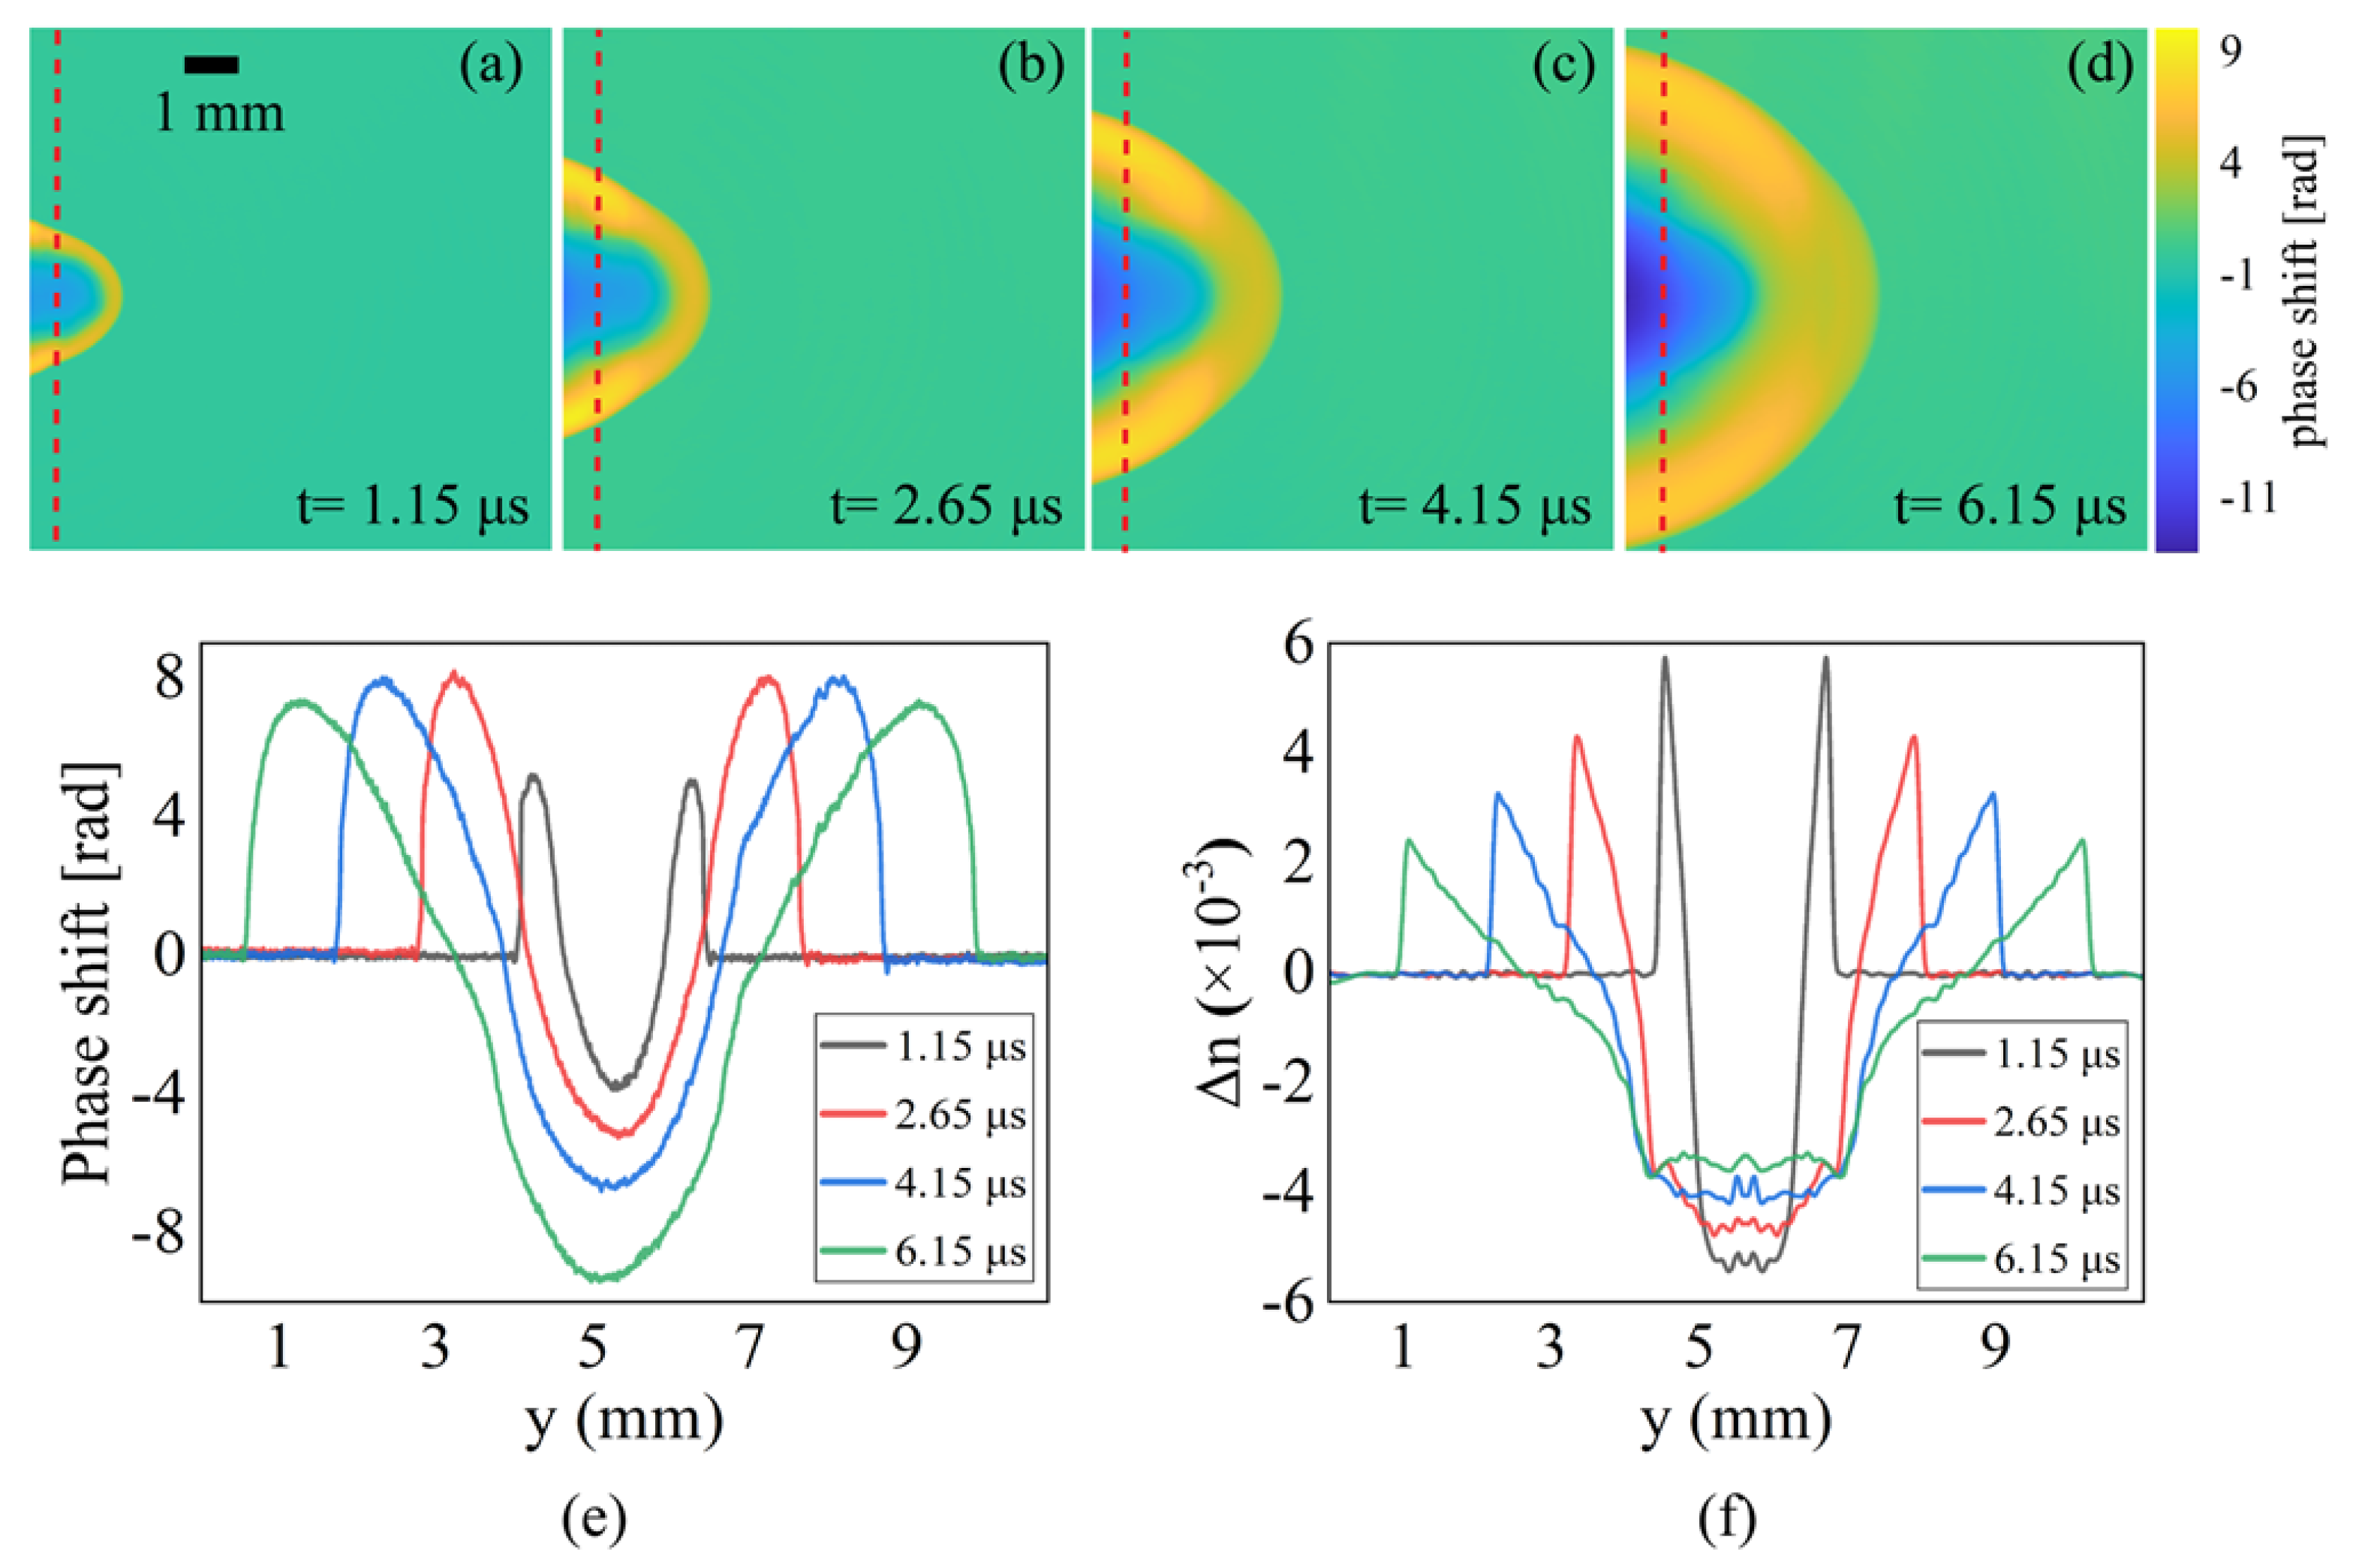
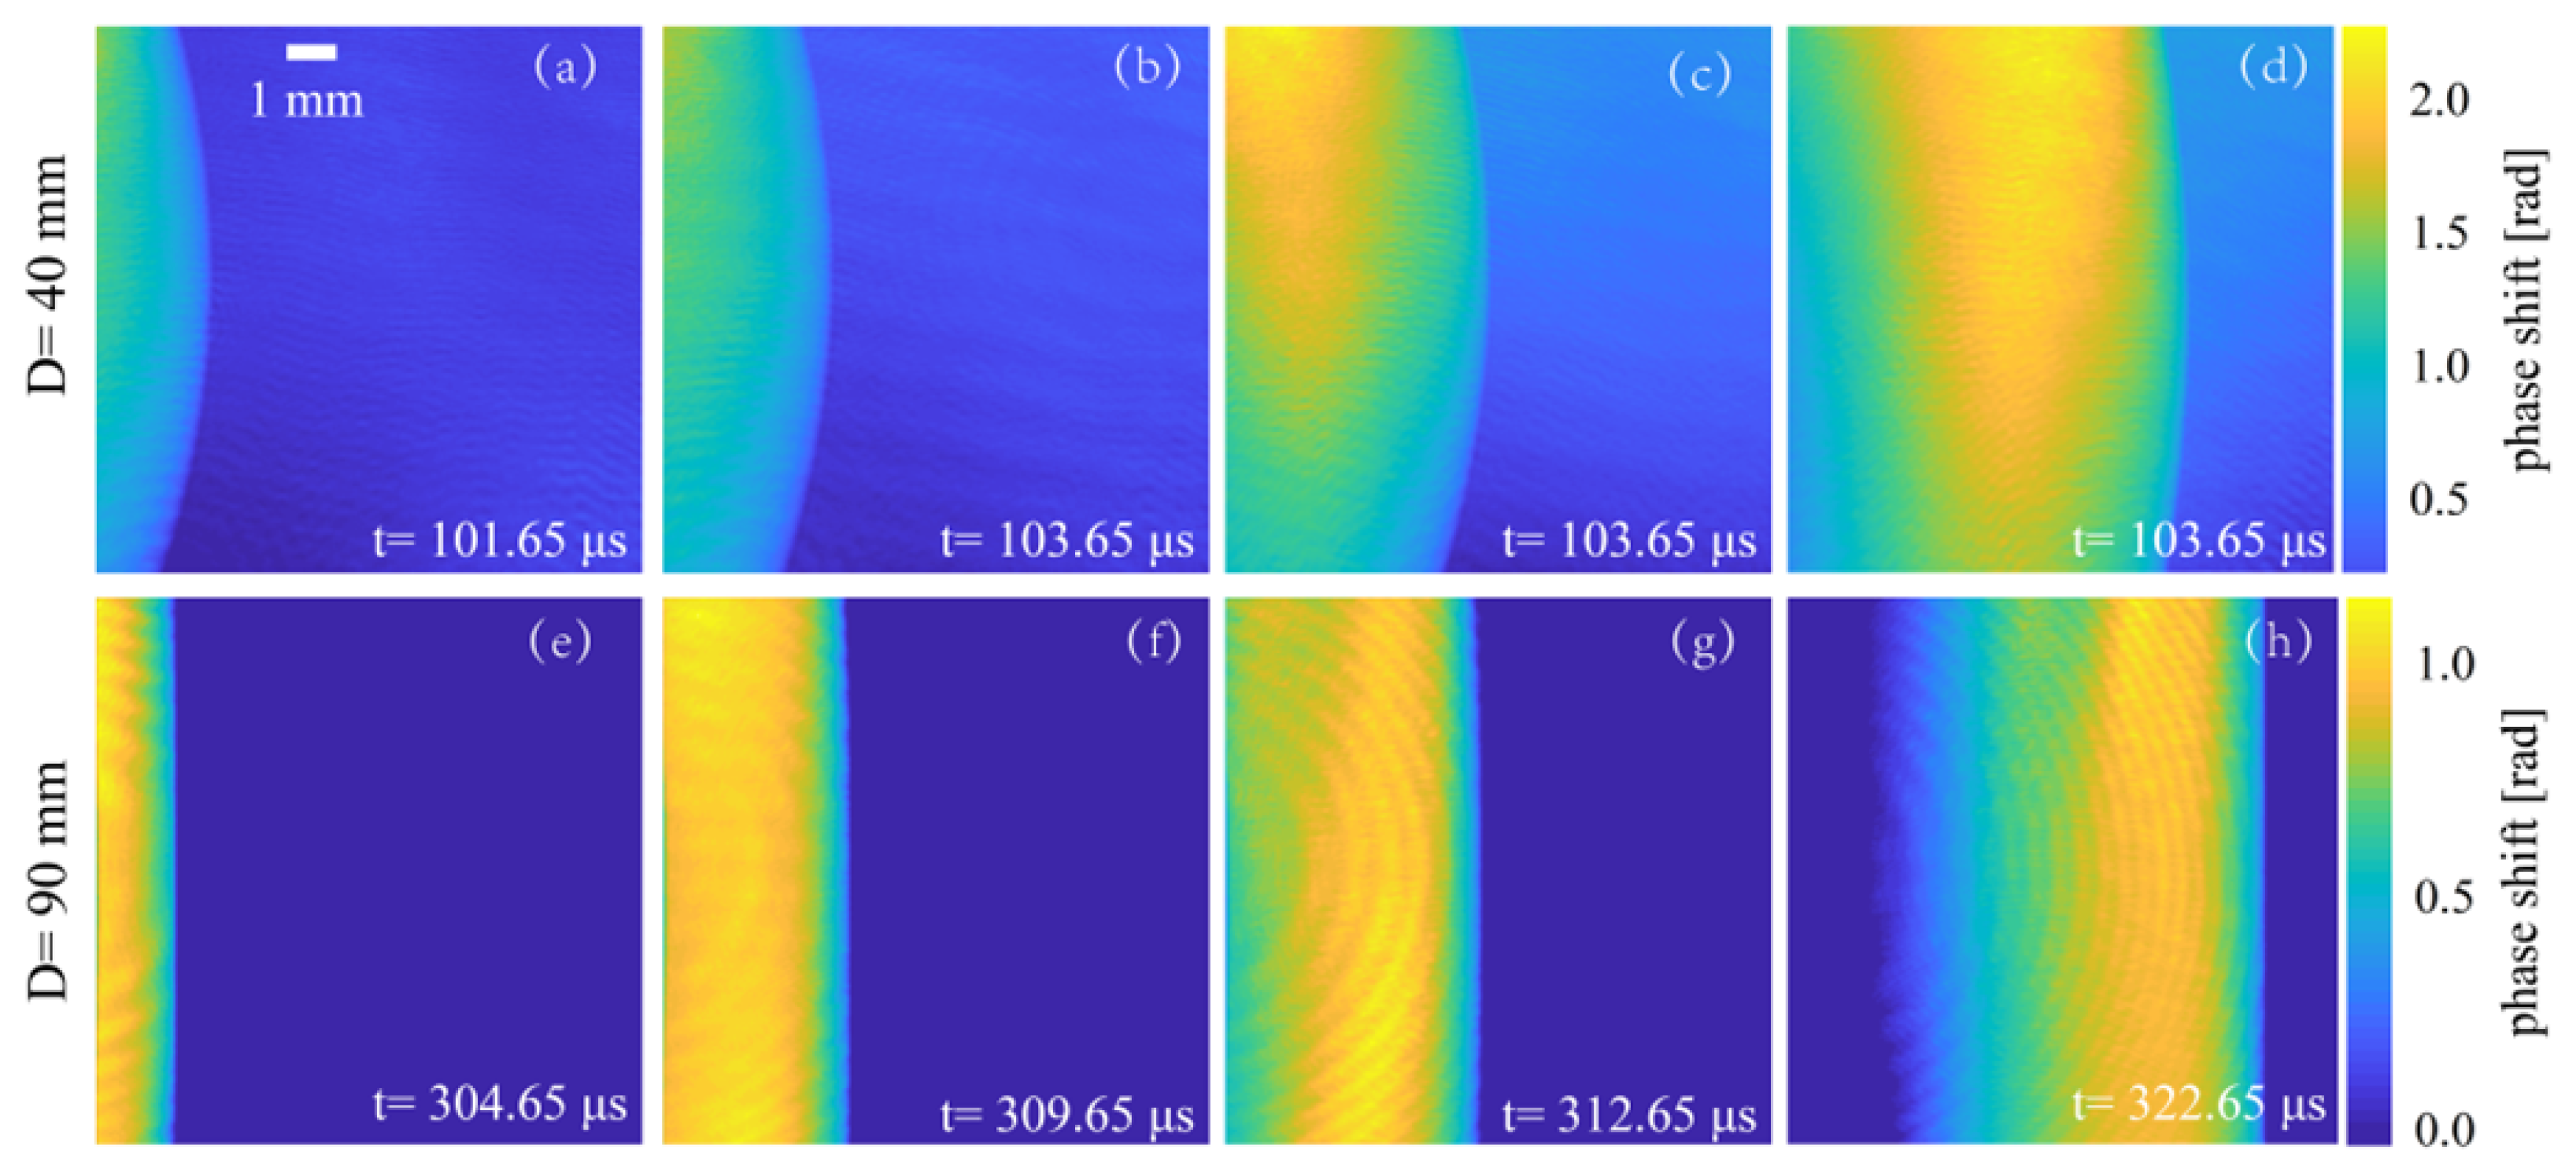
4. Results and Discussion

To demonstrate the phase recovery capability of the Carré method for measuring LIP and SW in the SPSI system, we processed four phase-shifted interferograms taken at different times during the initial phase of LIP. As shown in Figure 5a–d, these false-color images are the phase shift distribution in the early stages of LIP (D = 0), showcasing temporal and spatial variations. The images clearly depict the formation of shock waves and the overall symmetry that characterizes the initial stages of LIP expansion.
Figure 5e illustrates the phase shift distribution function relationship at the same position (D = 0.5 mm) marked by the dotted line, revealing the phase transition from LIP to SW, with opposite phase shift magnitudes. The negative phase shift observed in the early stage of LIP, caused by the high electron density, contrasts with the positive phaseshift of SW, primarily composed of compressed neutral molecules. The obtained phase shift distribution does not directly reflect the refractive index distribution. Instead, the refractive index can be derived by assuming the LIP is axisymmetric concerning the incident laser beam, resulting in the determination of the radial distribution of the refractive index variation in the medium through an inverse Abel transformation [25].
When calculating the refractive index of a measurement object, the precision of the phase shift significantly affects the accuracy of the numerical algorithm [5,25]. The refractive index distribution is represented in Figure 5f, which resulted from the application of Abel inversion to the profiles of the phase-shifted scratch marks as depicted in Figure 5e. The trend of the recovered refractive index change is clearly demonstrated to align with the mechanism of rapid decay of LIP in the initial stage and the subsequent generation and broadening of SW. Furthermore, the refractive index value obtained under the same laser energy aligns with previous research findings [5], having a magnitude in the order of 10 3 . The results above demonstrate that the accurate and precise measurement of LIP and SW transient phases can be achieved by combining the SPSI system with Carré’s phase recovery method. The early evolution stage of phase and interferogram for LIP and SW is presented by Visualization S1 in Supplementary Materials.
With increasing distance, the shock wave separates from the leading edge pressure, causing a rapid decrease in speed and energy. Lens L1 was moved to a distant position (D = 40 mm) to measure the weaker SW. Figure 6a shows the phase-shifted interferogram of the SW, captured by the SPSI system with a delay time of 105.65 μs, where the outline of the SW is plainly discernible. Adjustments were made to bolster the SW’s visibility during measurement by substantially widening the stripe width, a crucial factor to note as it does not impact the SPSI phase shift [18]. Figure 6b presents a 2D pseudo-color phase shift map recovered from Figure 6a, effectively illustrating the boundary between the SW and the background gas. To demonstrate the high sensitivity of the current method without compromising resolution, the Spatial carrier-frequency phase shift (SCPS) method was utilized in our experiments for comparative analysis [13]. The SCPS technology essentially relies on Fast Fourier Transform (FFT) for phase demodulation, i.e., the phase is demodulated by performing frequency-domain analysis on four interferograms with spatial carrier frequency, thereby approximately achieving the measurement accuracy of the camera itself. In this experiment, using this method is feasible to ensure fair comparison. This objective was pursued by modifying the optical path difference of the reference and detector lights within the SPSI system to narrow the fringe width. Once the fringes in each phase-shifted interferogram were closely spaced and reached a specific frequency, all of the phase-shifted interferograms were selected as the single-frame carrier frequency interferogram for phase recovery. Figure 6c shows the interferogram obtained from the single carrier frequency measurement, which was taken under the same conditions as Figure 6a. However, due to the low energy of the SW, it was challenging to distinguish the fringe deflection caused by it, even in the locally zoomed image.
The phase recovery in the single-frame carrier frequency interferogram is commonly performed using (2D) fast Fourier transform (FFT), as depicted in Figure 6d. The distribution diagram of phase shift was obtained using the phase unwrapping algorithm after demodulating the carrier frequency interferogram with the FFT method. The figure shows the phase recovered by the FFT method, which gives a rough profile of the SW-air interface. However, it lacks detailed information about the internal structure of SW compared to SPSI in Figure 6b. The limitation is primarily due to error effects such as aliasing and frequency domain leakage, which are caused by the interference of the measurement object not reaching the required carrier frequency. Furthermore, the common band filter employed by the FFT method to remove high-frequency noise resulted in the loss of high-frequency details, leading to a distorted phase shift of the shock wave observed in the figure. Quantitative analysis based on Figure 6d, due to the low fringe contrast ( C < 0.2 ) and noise accumulation, SCPS cannot resolve phase shifts smaller than 0.5 radians (Figure 6c,d shows blurred boundaries, relying on subjective judgment). Combined with the noise model ( Δ ϕ noise 1 / C ), the noise-equivalent phase error of SCFI under low contrast is significantly higher than that of SPSI. Conservatively estimating, its minimum measurable phase shift is more than 0.5 radians, an order of magnitude lower than SPSI’s 0.045. For better comparison, the phase distribution diagrams obtained at Y = 7 mm (marked by the red dotted line) are shown in Figure 6e through two different methods. It can be seen that the phase near the target in the SCPS is severely distorted compared with the actual wavefront phase, which is related to aliasing and frequency-domain leakage [13]. In the undisturbed background air part, although the distortion caused by phase deviation has been eliminated, there is still a certain amount of error. Compared with SCPS, SPSI can observe a favorable shock wave structure, and the part of the air disturbed by the leading edge also fluctuates within a very small error range. To further validate the capability of SPSI in measuring weak SW, a series of experiments were conducted with SW captured at different delay times. The SW phase shift sequences acquired by the SPSI system for a fading distance of D = 40 mm are illustrated in Figure 7a–d, while the measurements for D = 90 mm are presented in Figure 7e–h. The resulting phase shift interferogram was then processed, as illustrated in Figure 7. The figure unambiguously demonstrates that the interface profile between the SW and air shifts from a curved surface to a flat surface as the radius of curvature becomes larger. We performed the previously described single-frame carrier frequency interferometry on SW at a consistent attenuation distance and with a fixed delay time to facilitate comparison. However, observing the interferogram’s shock wave is difficult, and the phase’s processing results appear blurred. These findings are depicted in Visualizations S2 and S3 in the Supplementary Materials for reference.

5. Summary

This studyemploys the SPSI system to meet the demand for high-precision diagnosis of laser-induced plasma (LIP) and shock waves (SW). By integrating pump-probe technology, polarization-element coupled phase modulation, and the Carré phase-recovery algorithm, the system breaks through the bottlenecks of conventional carrier-frequency interferometry in weak perturbation detection. Utilizing single-sensor spatial multiplexing, the system can synchronously record multiple phase-shifted holograms in a single exposure. Combined with Abel inversion, it achieves high-precision reconstruction of the refractive index distribution and effectively corrects unknown phase shifts caused by the Faraday rotation effect in high-electron-density plasmas.
Through uncertainty analysis, the system’s total phase shift uncertainty of ±0.008 rad arises from Carré algorithm errors, optical component tolerances (e.g., polarizer alignment), and detector noise, as systematically analyzed, and this value reflects the measurement chain’s precision under ideal conditions. From a large number of experiments, statistical analysis of the background phase jitter has revealed that the minimum resolvable phase shift reaches 0.045 radians, equivalent to a refractive index accuracy of 8.55 × 10 6 , with sensitivity to weak perturbations improved by nearly an order of magnitude compared to traditional methods. Experimental results demonstrate that the SPSI system can accurately capture the spatiotemporal evolution characteristics of the initial LIP stage. In weak shock wave detection, the system clearly resolves the phase interface, whereas conventional carrier-frequency interferometry fails to identify low-energy shock wave details due to low-frequency noise, frequency-domain leakage, and phase demodulation errors, with a minimum measurable phase shift greater than 0.5 radians−an order of magnitude lower sensitivity. Additionally, this method is highly sensitive to transient micro-perturbations and can be used to measure high-vacuum plasmas, low-pressure shock waves, and stress waves in optical materials.

Supplementary Materials

The following supporting information can be downloaded at: https://www.mdpi.com/article/10.3390/photonics12060601/s1.

Author Contributions

Conceptualization, Z.S.; Methodology, H.Z.; Validation, L.G.; Formal analysis, L.G.; Investigation, L.G.; Writing−original draft, L.G.; Writing−review & editing, L.G.; Supervision, H.Z.; Funding acquisition, J.L. All authors have read and agreed to the published version of the manuscript.

Funding

National Natural Science Foundation of China (No. 12374289).

Institutional Review Board Statement

Not applicable.

Informed Consent Statement

Not applicable.

Data Availability Statement

Data underlying the results presented in this paper are not publicly available at this time but may be obtained from the authors upon reasonable request.

Acknowledgments

We thank Nan Zhao, Muwen Sun, and Mao Tang from the School of Science at Nanjing University of Science and Technology for their fruitful discussions.

Conflicts of Interest

The authors declare no conflicts of interest.

References

  1. Zhou, L.; Zhu, C.; Yuan, H.; Mei, X.; Jiang, J.; Lu, Z. Influence of the laser pulse time profile on residual stress characteristics in laser shock peening. Opt. Express 2023, 31, 18039. [Google Scholar] [CrossRef] [PubMed]
  2. Kono, M.; Baldwin, K.G.; Wain, A.; Rode, A.V. Treating the untreatable in art and heritage materials: Ultrafast laser cleaning of “cloth-of-Gold”. Langmuir 2015, 31, 1596–1604. [Google Scholar] [CrossRef] [PubMed]
  3. Scott, R.H.H.; Barlow, D.; Trickey, W.; Ruocco, A.; Glize, K.; Antonelli, L.; Khan, M.; Woolsey, N.C. Shock-Augmented Ignition Approach to Laser Inertial Fusion. Phys. Lett. 2022, 129, 195001. [Google Scholar] [CrossRef]
  4. Dumitrescu, L.N.; Ionita, E.R.; Birjega, R.; Lazea-Stoyanova, A.; Ionita, M.D.; Epurescu, G.; Banici, A.M.; Brajnicov, S.; Andrei, F.; Matei, A. Kaolinite Thin Films Grown by Pulsed Laser Deposition and Matrix Assisted Pulsed Laser Evaporation. Nanomaterials 2022, 12, 546. [Google Scholar] [CrossRef]
  5. Zhang, H.; Lu, J.; Shen, Z.; Ni, X. Investigation of 1.06 μm laser induced plasma in air using optical interferometry. Opt. Commun. 2009, 282, 1720–1723. [Google Scholar] [CrossRef]
  6. Gregorčixcx, P.; Petkovšek, R.; Možina, J. Investigation of a cavitation bubble between a rigid boundary and a free surface. J. Appl. Phys. 2007, 102, 094904. [Google Scholar] [CrossRef]
  7. Liu, Y.; Penczak, J.S.; Gordon, R.J. Nanosecond polarization-resolved laser-induced breakdown spectroscopy. Opt. Lett. 2010, 35, 112. [Google Scholar]
  8. Breitling, D.; Schittenhelm, H.; Berger, P.; Dausinger, F.; Huegel, H. Shadowgraphic and interferometric investigations on Nd:YAG laser-induced vapor/plasma plumes for different processing wavelengths. Appl. Phys. A 1999, 69, S505–S508. [Google Scholar] [CrossRef]
  9. Tao, Y.; Tillack, M.S.; Harilal, S.S.; Sequoia, K.L.; O’Shay, B.; Najmabadi, F. Effect of shockwave-induced density jump on laser plasma interactions in low-pressure ambient air. J. Phys. D Appl. Phys. 2006, 39, 4027–4030. [Google Scholar] [CrossRef]
  10. Tao, Y.; Tillack, M.S.; Harilal, S.S.; Sequoia, K.L.; Najmabadi, F. Investigation of the interaction of a laser pulse with a preformed Gaussian Sn plume for an extreme ultraviolet lithography source. J. Appl. Phys. 2007, 101, 023305. [Google Scholar] [CrossRef]
  11. Sobral, H.; Villagrán-Muniz, M.; Navarro-González, R.; Raga, A.C. Temporal evolution of the shock wave and hot core air in laser induced plasma. Appl. Phys. Lett. 2000, 77, 3158–3160. [Google Scholar] [CrossRef]
  12. Mao, S.S.; Mao, X.; Greif, R.; Russo, R.E. Initiation of an early-stage plasma during picosecond laser ablation of solids. Appl. Phys. Lett. 2000, 77, 2464–2466. [Google Scholar] [CrossRef]
  13. Du, Y.; Feng, G.; Li, H.; Vargas, J.; Zhou, S. Spatial carrier phase-shifting algorithm based on principal component analysis method. Opt. Express 2012, 20, 16471–16479. [Google Scholar] [CrossRef]
  14. Holburg, J.; Müller, M.; Mann, K. Improved gas-jet based extreme ultraviolet, soft X-ray laser plasma source. Opt. Express 2021, 29, 6620. [Google Scholar] [CrossRef]
  15. Požar, T.; Petkovšek, R. Cavitation induced by shock wave focusing in eye-like experimental configurations. Biomed. Opt. Express 2020, 11, 432. [Google Scholar] [CrossRef] [PubMed]
  16. Jin, S.; Zhou, Z.; Sakr, E.S.A.; Motlag, M.; Huang, X.; Tong, L.; Bermel, P.; Ye, L.; Cheng, G.J. Scalable Nanoshaping of Hierarchical Metallic Patterns with Multiplex Laser Shock Imprinting Using Soft Optical Disks. Small 2019, 15, 1900481. [Google Scholar] [CrossRef] [PubMed]
  17. Ying, K.N.; Ni, C.Y.; Dai, L.N.; Yuan, L.; Kan, W.W.; Shen, Z.H. Multi-mode laser-ultrasound imaging using Time-domain Synthetic Aperture Focusing Technique (T-SAFT). Photoacoustics 2022, 27, 100370. [Google Scholar] [CrossRef]
  18. Fukuda, T.; Wang, Y.; Xia, P.; Awatsuji, Y.; Kakue, T.; Nishio, K.; Matoba, O. Three-dimensional imaging of distribution of refractive index by parallel phase-shifting digital holography using Abel inversion. Opt. Express 2017, 25, 18066. [Google Scholar] [CrossRef]
  19. Jiang, Z.; Wu, J.; Chen, Z.; Wang, W.; Wang, Z.; Lu, Y.; Shi, H.; Li, X.; Qiu, A. Improvement of Faraday Rotation and Its Application in Preconditioned Single-Wire Z-Pinch Plasma. IEEE Trans. Plasma Sci. 2023, 51, 944–952. [Google Scholar] [CrossRef]
  20. Jiang, Z.; Wu, J.; Wang, Z.; Chen, Z.; Wang, W.; Shi, H.; Li, X.; Zhang, D. Experimental study of the magnetic field and current distribution in double-wire Z-pinch. Plasma Phys. Control. Fusion 2023, 65, 085005. [Google Scholar] [CrossRef]
  21. Swadling, G.F.; Lebedev, S.V.; Hall, G.N.; Patankar, S.; Stewart, N.H.; Smith, R.A.; Harvey-Thompson, A.J.; Burdiak, G.C.; De Grouchy, P.; Skidmore, J.; et al. Diagnosing collisions of magnetized, high energy density plasma flows using a combination of collective Thomson scattering, Faraday rotation, and interferometry (invited). Rev. Sci. Instruments 2014, 85, 11E502. [Google Scholar] [CrossRef] [PubMed]
  22. Hernández, D.; López, C.P.; Santoyo, F. Application of the carré algorithm and high speed interferometer technique for fast surface profile measurement. Optoelectron. Adv. Mater. Rapid Commun. 2014, 8, 185–191. [Google Scholar]
  23. Li, M.; Zhang, H.; Lu, J.; Shen, Z. Investigation of the laser ultrasound propagation in K9 glass using optical interferometry. Chin. Opt. Lett. 2022, 20, 021203. [Google Scholar] [CrossRef]
  24. Li, M.; Zhang, H.; Lu, J.; Shen, Z. Laser ultrasonic loading and optical interference detection of closed cracks in K9 glass. Opt. Lett. 2022, 47, 3736–3739. [Google Scholar] [CrossRef]
  25. Sun, Y.; Zhang, H.; Pan, Y.; Lu, J. Three-dimensional measurement of a thermal lens in K9 glass using a Mach–Zehnder interferometer. Appl. Opt. 2019, 58, 6604. [Google Scholar] [CrossRef]
  26. Parkevich, E.V.; Medvedev, M.A.; Selyukov, A.S.; Khirianova, A.I.; Mingaleev, A.R.; Mishin, S.N.; Pikuz, S.A.; Oginov, A.V. Setup involving multi-frame laser probing for studying fast plasma formation with high temporal and spatial resolutions. Opt. And Lasers Eng. 2019, 116, 82–88. [Google Scholar] [CrossRef]
  27. Yamaguchi, I. Phase-shifting digital holography. Opt. Photonics News 2008, 19, 48–53. [Google Scholar] [CrossRef]
  28. Han, J.H.; Li, R.P.; Liu, J.H.; Hai, F.S.; Huang, M.J. Two-step phase shifting differential-recording digital holographic microscopy. Sci. Rep. 2017, 7, 1992. [Google Scholar] [CrossRef]
  29. Kakue, T.; Yonesaka, R.; Tahara, T.; Awatsuji, Y.; Nishio, K.; Ura, S.; Kubota, T.; Matoba, O. High-speed phase imaging by parallel phase-shifting digital holography. Opt. Lett. 2011, 36, 4131–4133. [Google Scholar] [CrossRef]
  30. Herráez, M.A.; Burton, D.R.; Lalor, M.J.; Gdeisat, M.A. Fast two-dimensional phase-unwrapping algorithm based on sorting by reliability following a noncontinuous path. Appl. Opt. 2002, 41, 7437–7444. [Google Scholar] [CrossRef]
Figure 1. Principle of simultaneous phase-shifting interferometry [18].
Photonics 12 00601 g001
Figure 2. (a) The experimental setup of SPSI: NPBS, non-polarization beams splitter; BS, beam splitter; PBS, polarization beam splitter; HWP, half-wave plate; QWP, quarter-wave plate; BD, beam dump; EM, energy meter; LCP, left-circularly polarized; RCP, right-circularly polarized; L, convex lens. The measurement of SW with varying attenuation distances is achieved by horizontally moving the lens L1. (b) The distance between the focal point and the edge of the camera field of view along the excitation direction by D.
Photonics 12 00601 g002
Figure 3. Phase unwrapping process: (a) Wrapped phase distribution in [ π , π ] from Equation (1); (b) 2 π discontinuities in wrapped phase; (c) Unwrapped absolute phase via Ref [30] algorithm; (d) 1D phase profile at 0.5 mm (red dashed line) comparing wrapped (blue) and unwrapped (red) phases.
Photonics 12 00601 g003
Figure 4. Minimum detectable phase shift of SPSI system. (a) 50 trials (10+ min interval) for background interferogram phase stability evaluation. (b) Phase jitter (0.01–0.08 rad, avg. 0.045 rad) from speckle noise and vibrations.
Photonics 12 00601 g004
Figure 5. (ad) the phase shift distribution in the early stages of LIP. (e) The dotted line marked the phase shift distribution at the same position (D = 0.5 mm). (f) the distribution of refractive index obtained by performing the inverse Abel transformation (see Visualization S1 in Supplementary Materials).
Photonics 12 00601 g005
Figure 6. (a) Phase-shifted interferogram of the SW (D = 40 mm) obtained by SPSI system, with a delay time of 166.65 μs. (b) Phase shift distribution of (a) using the Carré method. (c) Single carrier frequency interferogram. (d) Phase shift distribution recovered from (c) using the FFT method. (see Visualization S2 in Supplementary Materials). (e) Profiles of the phases retrieved by two different methods at Y = 7 mm (marked by the red dashed line), where note that the SCPS method eliminates the background phase shift.
Photonics 12 00601 g006
Figure 7. (ad) The SW phase shift sequence was obtained from the SPSI system with D = 40 mm. (eh) Phase shift sequence with D = 90 mm (see Visualization S3 in Supplementary Materials).
Photonics 12 00601 g007
Disclaimer/Publisher’s Note: The statements, opinions and data contained in all publications are solely those of the individual author(s) and contributor(s) and not of MDPI and/or the editor(s). MDPI and/or the editor(s) disclaim responsibility for any injury to people or property resulting from any ideas, methods, instructions or products referred to in the content.

