Abstract
Label-free, high-throughput, and 3D morphological analysis of blood cells remains a major challenge in biomedical optics. In this study, we investigate this issue using flow cytometry with digital holographic microscopy (DHM) to enable real-time, label-free imaging of red blood cells (RBCs) and blood coagulation structures (BCSs) without the need for staining or chemical pretreatment. We demonstrate an approach for the automated quantification and statistical characterization of these cells using quantitative phase information reconstructed from digital holograms. Although established image processing techniques such as phase unwrapping and segmentation are used, this study presents, to the best of our knowledge, the first statistical characterization of the 3D morphological features of BCSs. This is particularly useful in analyzing the heterogeneous and complex 3D structures of BCSs, which are difficult to assess using conventional microscopy. The results suggest that this DHM-based flow cytometry system provides a promising platform for non-invasive, real-time morphological evaluation of blood samples and has potential applications in hematological diagnostics and research related to blood coagulation.
1. Introduction
DHM has become a powerful technique for label-free, quantitative phase imaging of biological cells [1,2,3,4,5]. DHM enables the reconstruction of optical phase information from a single hologram, allowing for 3D morphological imaging of transparent cells in a wide field of view and in real time. Because DHM does not require staining or other chemical pretreatments, it has been widely applied to the observation of various biological cells [3,4,5,6,7,8,9,10].
In particular, RBCs have attracted significant biomedical interest due to their role in oxygen transport and their diagnostic relevance in various diseases [11,12]. Quantitative phase imaging of RBC morphology using DHM has been explored as a non-invasive method for blood analysis [13,14,15,16,17,18,19]. In addition to oxygen delivery, another critical function of blood is hemostasis, which is the process of hemostasis after injury to blood vessels. Blood coagulation plays a central role in hemostasis, and disruptions in this process can lead to hemorrhagic or thrombotic disorders. To study coagulation-related phenomena, various techniques have been developed to detect the degree of blood coagulation and to observe aggregation structures formed by RBCs, which we refer to as BCSs in this study [20,21,22,23,24,25,26,27,28,29]. For microscopic techniques, scanning electron microscopy [26], atomic force microscopy [27], confocal microscopy [28], and conventional optical microscopy [29] have been applied to visualize RBC aggregates. However, these methods are generally limited by low throughput, the need for staining or fixation, and difficulties in real-time observation.
Recent advances in imaging flow cytometry have enabled high-throughput analysis of individual cells while simultaneously capturing morphological information [30]. In this context, flow cytometry with DHM has emerged as a promising approach for real-time, label-free, and 3D quantitative phase imaging of cells [31,32,33,34,35,36]. Based on previous work in DHM and blood coagulation, we proposed a method for 3D tomographic quantitative phase imaging of RBCs and BCSs using this optical system [33]. This approach enables quantitative 3D shape measurement of RBCs and BCSs without the need for staining or chemical pretreatment, while achieving high-throughput observation, a key advantage of flow cytometry. Compared to previous approaches using DHM alone or microfluidic cytometry, our method provides a unique combination of dimensionality, speed, and label-free capability. These features make it possible to characterize and statistically quantify the complex morphologies of RBCs and BCSs in real time, offering potential utility in hematology and coagulation-related diagnostics.
In this study, we report an automated quantification and statistical characterization of 3D morphological parameters of RBCs and BCSs using flow cytometry with DHM. To obtain statistical properties, we apply a combination of phase unwrapping and image processing techniques to extract nine morphological parameters from the reconstructed phase images of RBCs and BCSs. Although these are well-established image processing techniques, this study is the first to demonstrate that conventional DHM methods developed for RBCs can be reliably applied to BCSs. These parameters, including total phase, projected surface area and sphericity coefficient, are automatically computed for individual cells. By performing cell detection and counting [37,38,39,40,41], we produce normalized histograms of these parameters, which represent experimentally obtained probability density. These statistical properties provide a consistent basis for evaluating BCS morphology and may serve as a useful reference for exploring the underlying mechanisms of blood coagulation. To the best of our knowledge, this is the first report of a method enabling automated detection and statistical characterization of BCS morphology using flow cytometry with DHM.
2. Experiment
Figure 1 shows the optical system. In this study, we used the Mach–Zehnder-type DHM with an off-axis interferometric setup. This setup is widely adopted for its ability to suppress DC and twin-image terms in holographic reconstruction, enabling clearer phase retrieval. In addition, it provides a practical balance between optical stability, alignment simplicity, and suitability for real-time observation in flow cytometry applications. Although other configurations such as in-line or common-path interferometers exist, the Mach–Zehnder setup offers sufficient flexibility and robustness for the dynamic imaging conditions required in this study. The He–Ne laser with linear polarization (Lumentum Operations (San Jose, CA, USA), 632.8 nm, 21 mW) is used as the optical source. The laser light is divided by the beam splitter BS1. One of the split lights is reflected by BS1 and the mirror M4 and is then cleaned by the objective lens OL1 and the spatial filter SF. Subsequently, the beam is collimated by a lens L1 and is used as a reference wave. The light transmitted through BS1 is reflected by a mirror M5, and is incident on a flow cell (Translume Inc. (Ann Arbor, MI, USA), SF-300250-170-L), where an object wave is produced. The object wave is magnified by the objective lens OL2 (×40, = 0.85) and is collimated by a tube lens TL with a focal length of 150 mm. In this setup, an afocal configuration is used for DHM, with a magnification power of 30. The object and reference waves are coupled by a beam splitter BS2 again, and then these waves interfere with each other. The interference pattern, which is called a hologram, is detected on a CMOS camera (SVS-VISTEK (Gilching, Germany), exo250MU3) with 2448 × 2048 pixels and a pixel pitch of 3.45 m. The camera is located at the back focal plane of TL and therefore image holograms are recorded. The image size of digital holograms is = 1024 × 1024. As will be described later, each cell should be well resolved to calculate cell morphological parameters. In the reconstructed image obtained from this DHM, RBCs are sampled at about 40 pixels for their cell diameters. The focus of DHM is adjusted in the bottom of the flow channel (300 m in width, 250 m in depth) in the flow cell. The injection of blood is initiated by a push on the piston of the syringe by the auto micrometer, and the movie of digital holograms of the flow field in the flow channel is recorded by the camera at 75 fps in the field of view of 117.8 × 117.8 m2. For removing DC terms and a twin image in the reconstructed images, an off-axis setup is used by introducing a spatial carrier into the digital hologram by adjusting the angle of BS2.
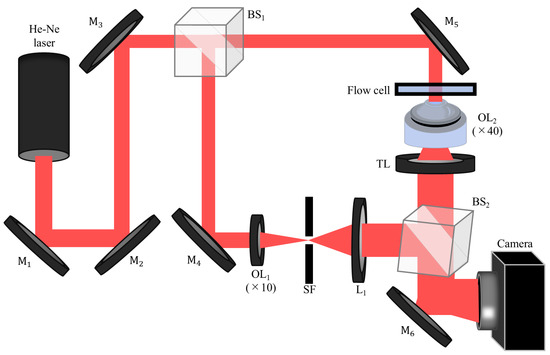
Figure 1.
Experimental setup of DHM. M, mirror; BS, beam splitter; OL, objective lens; SF, spatial filter; L, lens; TL, tube lens.
Figure 2 shows the schematic of the flow cell and its flow channel. The sample is horse blood (Japan BioSealum Co., Ltd.). The hematocrit value of horse blood is 25%, which is measured by a centrifugal separator and hematocrit capillary tube. The hematocrit value of the horse blood is then adjusted to 0.02% with plasma and saline having the refractive indices of 1.332 and 1.333. After the resulting blood sample is warmed at 37.0 °C for 30 min, it is drawn into one end of a tube with a syringe, and the other end of the tube is connected to the flow cell composed of the fused silica with the refractive index of 1.456. The sample is injected by pushing the piston of the syringe through the auto micrometer. To optimize the flow conditions for high-speed imaging at 75 fps, we controlled the injection speed using an automated micrometer, setting it to 2.9 m/s. Through preliminary trials, we found that this speed maintained the structural integrity of BCSs and provided the most stable observations. Under this condition, the flow velocity of the cells was approximately from 34.6 to 69.1 m/s, corresponding to a displacement from 4 to 8 pixels between frames in the reconstructed images. Motion blur did not occur because the short exposure time of 370 s, combined with the frame rate of 75 fps, kept the cell displacement within sub-pixel levels in the reconstructed images. However, we observed that BCSs tended to break at higher flow rates. In this setup, a laser light is vertically incident on the flow cell, and RBCs and BCSs flow in the direction from one side of the flow channel to the other in the flow cell.
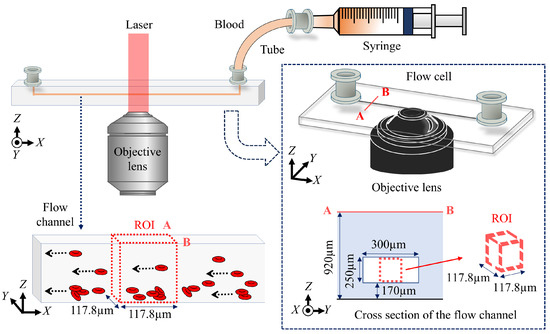
Figure 2.
Schematic of the flow cell and its flow channel.
3. Analysis
Figure 3 shows the procedure for analyzing the automated detection, cell identification, cell classification, and 3D counting of morphological parameters of RBCs and BCSs. In the reconstruction process, the amplitude and phase distributions of an object wave are numerically reconstructed from digital holograms using the spatial filtering method [42,43] and the angular spectrum method [1]. The unwrapping process, which is the fast-Fourier-based phase unwrapping [44], is applied to the phase distributions. Although this process does not need to be performed for a single RBC, it is necessary for the BCSs because they consist of multiple RBCs and then their phase values are often wrapped. The following image processing is then performed for the unwrapped phase maps. First, the binarization process, in which we used Otsu’s method [45], is performed for the unwrapped phase maps, and then the binary images of RBCs and BCSs are produced. Next, the label processing is applied to the binary images, and then the label-connected components of RBCs and BCSs are obtained. Using the label-connected components and the masking process, which multiplies the unwrapped phase maps by the binary image, the phase distributions of RBCs and BCSs in the label-connected components are extracted. From their phase distributions, the total phase, which is one of the morphological parameters based on the quantitative phase information of RBCs and BCSs, is calculated and its normalized histogram is produced. This is regarded as experimentally obtained probability density of morphological parameters when the number of samples is sufficiently large. By applying Otsu’s method to the histogram of the total phase, the cells are classified as RBCs or BCSs. After the cell classification, other morphological parameters for RBCs and BCSs and their normalized histograms are calculated. We calculated the nine morphological parameters based on the quantitative phase images of RBCs and BCSs, which are the total phase, the projected surface area, the perimeter, the circularity, the elongation, the average phase value, the phase of the center pixel, the sphericity coefficient, and the D-value [41,46].
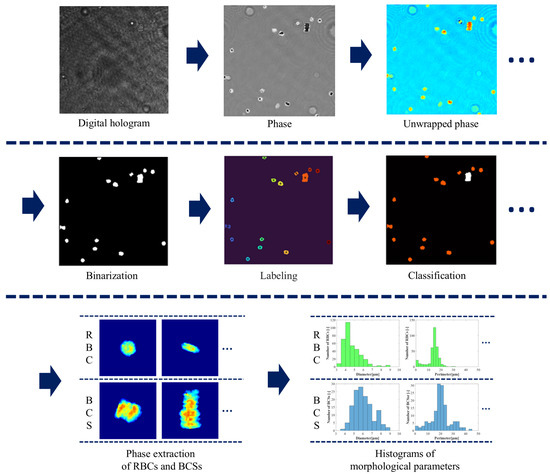
Figure 3.
Procedure for analyzing the detection and classification of RBCs and BCSs.
The projected surface area S is calculated from the number of pixels within each cell area in the binary images.
where is the number of pixels within RBCs or BCSs, p is the pixel size of the reconstructed image and M is the magnification of the DHM. The perimeter is obtained from the boundary length of each cell in the binary images.
where and are the number of even and odd elements in the boundary chain code of RBCs and BCSs, and is the total number of elements in the Freeman chain code for RBCs and BCSs. The circularity is given as follows:
The elongation is calculated from the chain code orientation in the cell boundary
where
in the case of or k. In Equations (4) and (5), is the chain code element and j and k are the direction number for eight-directional chain code. As these five parameters are obtained from the binary images, they are regarded as the 2D morphological parameters of RBCs and BCSs. On the other hand, the following parameters have the 3D information of RBCs and BCSs because the phase values corresponding to the cell thickness are taken into account. The average phase value is given by the average of the phase values within each cell area in the binary images.
The phase of center pixel is calculated from the average phase value of 5 × 5 pixels around the center of gravity of each cell in the binary images. The sphericity coefficient is calculated as follows:
where is the maximum phase value within each cell. The D-value is as follows:
4. Results
Figure 4 shows the images produced from the analysis in Section 3. Figure 4a–l are images in the different flames of the movie of digital holograms. Figure 4a,g are the digital holograms. Figure 4b,h show the wrapped phase maps reconstructed from Figure 4a,g. Figure 4c,i are the unwrapped phase maps of Figure 4b,h. Figure 4d,j are the binary images of Figure 4c,i. Figure 4e,k show the images after applying label processing to Figure 4d,j, in which cells with each label are color-coded according to label numbers. Figure 4f,l are the classification images of RBCs and BCSs, in which RBCs and BCSs are shown in the red and white colors. It can be seen from these figures that the image processing explained in Section 3 was successful in classifying RBCs and BCSs.
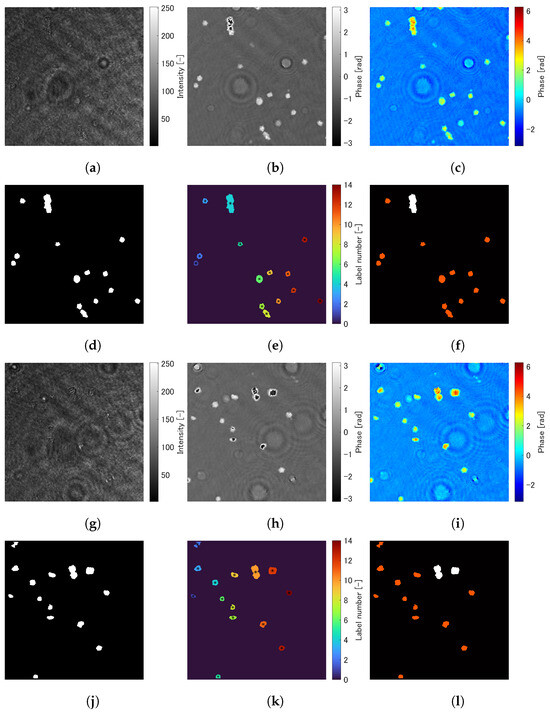
Figure 4.
Images produced from the analysis in Section 3. (a–f) and (g–l) are images in the different flames of the movie of digital holograms. (a,g) are the digital holograms. (b,h) show the wrapped phase maps reconstructed from (a,g). (c,i) are the unwrapped phase maps of (b,h). (d,j) are the binary images of (c,i). (e,k) shows the images after applying label processing to (d,j), in which cells with each label are color-coded according to label numbers. (f,l) are the classification images of RBCs and BCSs, in which RBCs and BCSs are shown in red and white colors.
Figure 5 shows several trimmed images of phase maps of RBCs and BCSs, in which the top and bottom rows are the phase maps of RBCs and BCSs. These images are trimmed pixels around the center of gravity of the cells. It can be observed from Figure 5 that BSCs have different structures with larger size and phase value than RBCs because two or more RBCs are connected to each other in three dimensions. Using the analysis described in Section 3, 1011 and 165 samples of the phase maps of RBCs and BSCs are obtained. From these phase maps, the morphological parameters are calculated and their normalized histograms are produced.

Figure 5.
Phase maps of RBCs and BCSs.
Figure 6 shows normalized histograms of morphological parameters based on the phase distributions of RBCs and BCSs: (a) total phase; (b) projected surface area; (c) perimeter; (d) circularity; (e) elongation; (f) average phase value; (g) phase of center pixel; (h) sphericity coefficient; and (i) D-value. In these figures, the blue and red bars are the normalized probability densities of RBCs and BCSs. From Figure 6a–c,f,g, it is seen that the normalized histograms of RBCs and BCSs have different distributions while there is a range of overlap. This is because BCSs are composed of more than two RBCs and therefore tend to have larger size and phase value than a single RBC. On the other hand, the two histograms are similar in Figure 6d,e,h,i. Since both rolling and non-rolling RBCs are involved, in which rolling RBCs have an elliptical shape as shown in the third figure from the right in the top row of Figure 5 while non-rolling RBCs have a circular shape, the normalized histograms of the circularity and the elongation become a similar tendency in RBCs and BCSs. From the data, the mean and standard deviation are calculated as fundamental statistics, which are shown in Table 1.
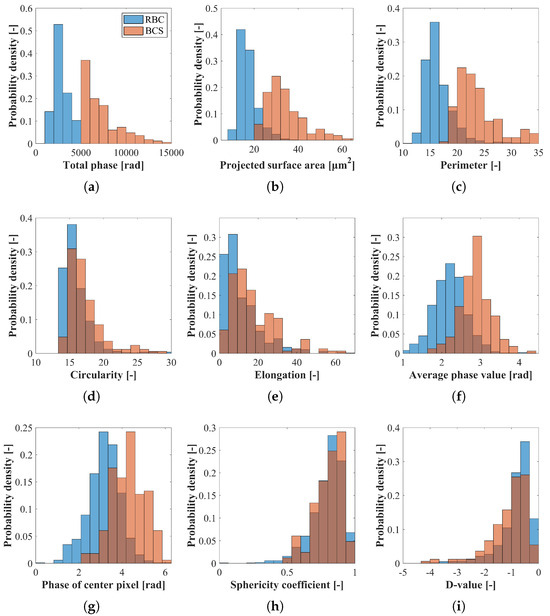
Figure 6.
Normalized histograms of the morphological parameters based on the phase distributions of RBCs and BCSs. (a) Total phase; (b) projected surface area; (c) perimeter; (d) circularity; (e) elongation; (f) average phase value; (g) phase of center pixel; (h) sphericity coefficient; and (i) D-value. The blue and red bars are the normalized probability densities of RBCs and BCSs.

Table 1.
Mean and standard deviation of the morphological parameters of RBCs and BCSs.
Although the primary aim of this study is to establish a quantitative method for measuring 3D morphological parameters of RBCs and BCSs using DHM-based flow cytometry, these parameters may also hold biological significance. For example, five morphological parameters with clearly distinct probability density distributions can reflect the degree of structural complexity in BCSs, which may correlate with the extent of coagulation activity. Differences in these parameters between samples could indicate abnormal coagulation behavior associated with hypercoagulable states or impaired hemostasis, while biological validation is beyond the scope of the present work, these morphological metrics may potentially serve as diagnostic indicators in future clinical applications. Furthermore, by extending this framework to time-resolved measurement of cell dynamics [47] and incorporating data-driven approaches such as machine learning [48], it may become possible to classify dynamic coagulation behavior or predict pathological coagulation states based on morphological features extracted from phase information.
5. Conclusions
In this study, we demonstrated an automated method for quantifying and statistically characterizing the 3D morphological features of RBCs and BCSs using flow cytometry with DHM. By applying phase unwrapping and image processing techniques to the reconstructed phase distributions, we extracted nine morphological parameters that characterize both 2D and 3D cellular features. These parameters were quantified across cell samples using a counting-based approach, and represented as normalized histograms that reflect their statistical distributions.
To the best of our knowledge, this is the first study to apply DHM-based flow cytometry to the automated analysis and statistical characterization of BCS morphology, while previous studies have focused on RBCs, the complex and heterogeneous structure of BCSs has posed significant challenges for quantitative analysis. Our approach provides a reproducible method for morphological profiling of BCSs, forming a foundation for multivariate analysis and machine learning techniques aimed at understanding blood coagulation dynamics and improving diagnostic precision.
The proposed system combines high-throughput, label-free imaging with low-cost and compact optical instrumentation, making it well suited for integration into point-of-care diagnostic platforms. In addition to facilitating real-time blood coagulation testing, the method offers potential for broader biomedical applications, including the study of clot formation mechanisms, early detection of coagulation-related disorders, and support for drug development targeting hemostatic dysfunctions. We believe this work represents an important step toward quantitative, phase-based cellular diagnostics in hematology and beyond.
Funding
This work was supported by Japan Society for the Promotion of Science Grants-in-Aid for Scientific Research Grant Numbers 21K04073 and 24K07501.
Data Availability Statement
Data underlying the results presented in this paper are not publicly available at this time but may be obtained from the authors upon reasonable request.
Conflicts of Interest
The author declares no conflicts of interest.
Abbreviations
The following abbreviations are used in this manuscript:
| DHM | Digital holographic microscopy |
| RBC | Red blood cell |
| BCS | Blood coagulation structure |
References
- Kim, M.K. Digital Holographic Microscopy; Springer: New York, NY, USA, 2011. [Google Scholar]
- Zhang, T.; Yamaguchi, I. Three-dimensional microscopy with phase-shifting digital holography. Opt. Lett. 1998, 15, 1221–1223. [Google Scholar] [CrossRef]
- Cuche, E.; Bevilacqua, F.; Depeursinge, C. Digital holography for quantitative phase-contrast imaging. Opt. Lett. 1999, 24, 291–293. [Google Scholar] [CrossRef] [PubMed]
- Marquet, P.; Depeursinge, C.; Pierre, J.; Magistretti, P.J. Review of quantitative phase-digital holographic microscopy: Promising novel imaging technique to resolve neuronal network activity and identify cellular biomarkers of psychiatric disorders. Neurophotonics 2014, 1, 020901. [Google Scholar] [CrossRef]
- Yu, X.; Hong, J.; Liu, C.; Myung, K.K. Review of digital holographic microscopy for three-dimensional profiling and tracking. Opt. Eng. 2014, 53, 112306. [Google Scholar] [CrossRef]
- Mann, C.J.; Yu, L.; Lo, C.-M.; Kim, M.K. High-resolution quantitative phase-contrast microscopy by digital holography. Opt. Express 2005, 13, 8693–8698. [Google Scholar] [CrossRef]
- Mann, C.J.; Yu, L.; Kim, M.K. Movies of cellular and sub-cellular motion by digital holographic microscopy. BioMed. Eng. OnLine 2006, 5, 1–10. [Google Scholar] [CrossRef]
- Charrière, F.; Marian, A.; Montfort, F.; Kuehn, K.; Colomb, T.; Cuche, E.; Marquet, P.; Depeursinge, C. Cell refractive index tomography by digital holographic microscopy. Opt. Lett. 2006, 31, 178–180. [Google Scholar] [CrossRef]
- Moon, I.; Javidi, B. Three-dimensional identification of stem cells by computational holographic imaging. J. R. Soc. Interface 2007, 4, 305–313. [Google Scholar] [CrossRef]
- Crha, I.; Zakova, J.; Huser, M.; Ventruba, P.; Lousova, E.; Pohanka, M. Digital holographic microscopy in human sperm imaging. J. Assist. Reprod. Genet. 2011, 28, 725–729. [Google Scholar] [CrossRef][Green Version]
- Jones, K.W. Evaluation of cell morphology and introduction to platelet and white blood cell morphology. In Clinical Hematology and Fundamentals of Hemostasis; Harmening, D., Ed.; F.A. Davis Company: Philadelphia, PA, USA, 2009. [Google Scholar]
- Geekiyanage, N.M.; Balanant, M.A.; Sauret, E.; Saha, S.; Flower, R.; Lim, C.T.; Gu, Y.T. A coarse-grained red blood cell membrane model to study stomatocyte-discocyte-echinocyte morphologies. PLoS ONE 2019, 14, e0215447. [Google Scholar] [CrossRef]
- Bernhardt, I.; Ivanova, L.; Langehanenberg, P.; Kemper, B.; Bally, G.V. Application of digital holographic microscopy to investigate the sedimentation of intact red blood cells and their interaction with artificial surfaces. Bioelectrochemistry 2008, 73, 92–96. [Google Scholar] [CrossRef] [PubMed]
- Choi, Y.-S.; Lee, S.-J. Three-dimensional volumetric measurement of red blood cell motion using digital holographic microscopy. Appl. Opt. 2009, 48, 2983–2990. [Google Scholar] [CrossRef] [PubMed]
- Rappaz, B.; Barbul, A.; Hoffmann, A.; Boss, D.; Korenstein, R.; Depeursinge, C.; Magistretti, P.J.; Marquet, P. Spatial analysis of erythrocyte membrane fluctuations by digital holographic microscopy. Blood Cells Mol. Dis. 2009, 42, 228–232. [Google Scholar] [CrossRef]
- Moon, I.; Javidi, B.; Yi, F.; Boss, D.; Marquet, P. Automated statistical quantification of three-dimensional morphology and mean corpuscular hemoglobin of multiple red blood cells. Opt. Express 2012, 20, 10295–10309. [Google Scholar] [CrossRef] [PubMed]
- Yi, F.; Lee, C.-G.; Moon, I. Statistical analysis of 3d volume of red blood cells with different shapes via digital holographic microscopy. J. Opt. Soc. Korea 2012, 16, 115–120. [Google Scholar] [CrossRef]
- Moon, I.; Yi, F.; Lee, Y.H.; Javidi, B.; Boss, D.; Marquet, P. Automated quantitative analysis of 3d morphology and mean corpuscular hemoglobin in human red blood cells stored in different periods. Opt. Express 2013, 21, 30947–30957. [Google Scholar] [CrossRef]
- Yi, F.; Moon, I.; Javidi, B.; Boss, D.; Marquet, P. Automated segmentation of multiple red blood cells with digital holographic microscopy. J. Biomed. Opt. 2013, 18, 026006. [Google Scholar] [CrossRef]
- Wilson, T.M. The conductivity of blood in coagulation. Biochem. J. 1907, 2, 377–382. [Google Scholar] [CrossRef][Green Version]
- Kishimoto, S.; Yoshioko, M. Method and System for Measuring Blood Coagulation Time. U.S. Patent NO.4 252, 536, 24 February 1981. [Google Scholar]
- Kloth, B.; Behnk, H. Blood Coagulation Time Measuring Device. U.S. Patent NO.4 964, 728, 1990. [Google Scholar]
- Greco, F.A. Reflectance spectroscopy of clotting blood: A description of the time-dependent behavior. Arch. Pathol. Lab. Med. 2004, 128, 173–180. [Google Scholar] [CrossRef]
- Faivre, M.; Peltié, P.; Planat-Chrétien, A.; Cosnier, M.-L.; Cubizolles, M.; Nougier, C.; Négrier, C.; Pouteau, P. Coagulation dynamics of a blood sample by multiple scattering analysis. J. Biomed. Opt. 2011, 16, 057001. [Google Scholar] [CrossRef]
- Tripathi, M.M.; Hajjarian, Z.; Cott, E.M.V.; Nadkarni, S.K. Assessing blood coagulation status with laser speckle rheology. Biomed. Opt. Express 2014, 5, 817–831. [Google Scholar] [CrossRef] [PubMed]
- Mardel, S.N.; Saunders, F.M.; Allen, H.; Menezes, G.; Edwards, C.M.; Ollerenshaw, L.; Baddeley, D.; Kennedy, A.; Ibbotson, R.M. Reduced quality of clot formation with gelatin-based plasma substitutes. Br. J. Anaesth. 1998, 80, 204–207. [Google Scholar] [CrossRef][Green Version]
- Yeow, N.; Tabor, R.F.; Garnier, G. Atomic force microscopy: From red blood cells to immunohaematology. Adv. Colloid Interface Sci. 2017, 249, 149–162. [Google Scholar] [CrossRef] [PubMed]
- Elnager, A.; Abdullah, W.Z.; Hassan, R.; Idris, Z.; Arfah, N.W.; Sulaiman, S.A.; Mustafa, Z. In vitro whole blood clot lysis for fibrinolytic activity study using d-dimer and confocal microscopy. Adv. Hematol. 2014, 2014, 814684. [Google Scholar] [CrossRef] [PubMed]
- Chaikeeratisak, V.; Tassanakajon, A.; Armstrong, P.B. Interaction of pathogenic vibrio bacteria with the blood clot of the pacific white shrimp, litopenaeus vannamei. Biol. Bull. 2014, 226, 102–110. [Google Scholar] [CrossRef] [PubMed]
- Barteneva, N.; Vorobjev, I. Imaging Flow Cytometry: Methods and Protocols; Humana Press Inc.: Totowa, NJ, USA, 2015. [Google Scholar]
- Cheong, F.C.; Dreyfus, B.S.R.; Amato-Grill, J.; Xiao, K.; Dixon, L.; Grier, D.G. Flow visualization and flow cytometry with holographic video microscopy. Opt. Express 2009, 48, H153–H159. [Google Scholar] [CrossRef]
- Merola, F.; Memmolo, P.; Miccio, L.; Savoia, R.; Mugnano, M.; Fontana, A.; D’Ippolito, G.; Sardo, A.; Iolascon, A.; Gambale, A.; et al. Tomographic flow cytometry by digital holography. Light. Sci. Appl. 2017, 6, e16241. [Google Scholar] [CrossRef]
- Funamizu, H.; Aizu, Y. Three-dimensional quantitative phase imaging of blood coagulation structures by optical projection tomography in flow cytometry using digital holographic microscopy. J. Biomed. Opt. 2019, 24, 031012. [Google Scholar] [CrossRef]
- Boltyanskiy, R.; Odete, M.A.; Cheong, F.C.; Philips, L.A. Label-free viability assay using in-line holographic video microscopy. Sci. Rep. 2022, 12, 12746. [Google Scholar] [CrossRef]
- Dudaie, M.; Barnea, I.; Nissim, N.; Shaked, N.T. On-chip label-free cell classification based directly on off-axis holograms and spatial-frequency-invariant deep learning. Sci. Rep. 2023, 6, 12370. [Google Scholar] [CrossRef]
- Giugliano, G.; Pirone, D.; Behal, J.; Wang, Z.; Cerbone, V.; Mugnano, M.; Licitra, F.; Montella, A.; Scalia, G.; Capasso, M.; et al. On the label-free analysis of white blood cells by holographic quantitative phase imaging flow cytometry. J. Opt. Soc. Am. A 2024, 41, 2421–2429. [Google Scholar] [CrossRef] [PubMed]
- Javidi, B.; Daneshpanah, M.; Moon, I. Three-dimensional holographic imaging for identification of biological micro/nanoorganisms. IEEE Photonics J. 2010, 2, 256–259. [Google Scholar] [CrossRef]
- Mihailescu, M.; Scarlat, M.; Gheorghiu, A.; Costescu, J.; Kusko, M.; Paun, I.A.; Scarlat, E. Automated imaging, identification, and counting of similar cells from digital hologram reconstructions. Appl. Opt. 2011, 50, 3589–3597. [Google Scholar] [CrossRef]
- Mir, M.; Tangella, K.; Popescu, G. Blood testing at the single cell level using quantitative phase and amplitude microscopy. Biomed. Opt. Express 2011, 2, 3259–3266. [Google Scholar] [CrossRef]
- Seo, S.; Isikman, S.O.; Sencan, I.; Mudanyali, O.; Su, T.-W.; Bishara, W.; Erlinger, A.; Ozcan, A. High-throughput lens-free blood analysis on a chip. Anal. Chem. 2010, 82, 4621–4627. [Google Scholar] [CrossRef]
- Yi, F.; Moon, I.; Lee, Y.H. Three-dimensional counting of morphologically normal human red blood cells via digital holographic microscopy. J. Biomed. Opt. 2015, 20, 016005. [Google Scholar] [CrossRef]
- Takeda, M.; Ina, H.; Kobayashi, S. Fourier-transform method of fringe-pattern analysis for computer-based topography and interferometry. J. Opt. Soc. Am. 1982, 72, 156–160. [Google Scholar] [CrossRef]
- Cuche, E.; Marquet, P.; Depeursinge, C. Spatial filtering for zero-order and twin-image elimination in digital off-axis holography. Appl. Opt. 2000, 39, 4070–4075. [Google Scholar] [CrossRef]
- Jeught, S.V.D.; Sijbers, J.; Dirckx, J.J.J. Fast fourier-based phase unwrapping on the graphics processing unit in real-time imaging applications. J. Imaging 2015, 1, 31–44. [Google Scholar] [CrossRef]
- Otsu, N. A threshold selection method from gray-level histograms. IEEE Trans. Syst. Man Cybern. 1979, 9, 62–66. [Google Scholar] [CrossRef]
- Bacus, J.W.; Weens, J.H. An automated method of differential red blood cell classification with application to the diagnosis of anemia. J. Histochem. Cytochem. 1977, 25, 614–632. [Google Scholar] [CrossRef] [PubMed]
- Martines-Arano, H.; Garcia-Perez, B.E.; Vidales-Hurtado, M.A.; Trejo-Valdez, M.; Hernandez-Gomez, L.H.; Torres-Torres, C. Chaotic Signatures Exhibited by Plasmonic Effects in Au Nanoparticles with Cells. Sensors 2019, 19, 4728. [Google Scholar] [CrossRef] [PubMed]
- Kim, Y.; Kim, J.; Seo, E.; Lee, S.J. AI-based analysis of 3D position and orientation of red blood cells using a digital in-line holographic microscopy. Biosens. Bioelectron. 2023, 2, 256–259. [Google Scholar] [CrossRef] [PubMed]
Disclaimer/Publisher’s Note: The statements, opinions and data contained in all publications are solely those of the individual author(s) and contributor(s) and not of MDPI and/or the editor(s). MDPI and/or the editor(s) disclaim responsibility for any injury to people or property resulting from any ideas, methods, instructions or products referred to in the content. |
© 2025 by the author. Licensee MDPI, Basel, Switzerland. This article is an open access article distributed under the terms and conditions of the Creative Commons Attribution (CC BY) license (https://creativecommons.org/licenses/by/4.0/).