Prediction of Aluminum Alloy Surface Roughness Through Nanosecond Pulse Laser Assisted by Continuous Laser Paint Removal

Abstract
1. Introduction
2. Materials and Methods
2.1. Experiment
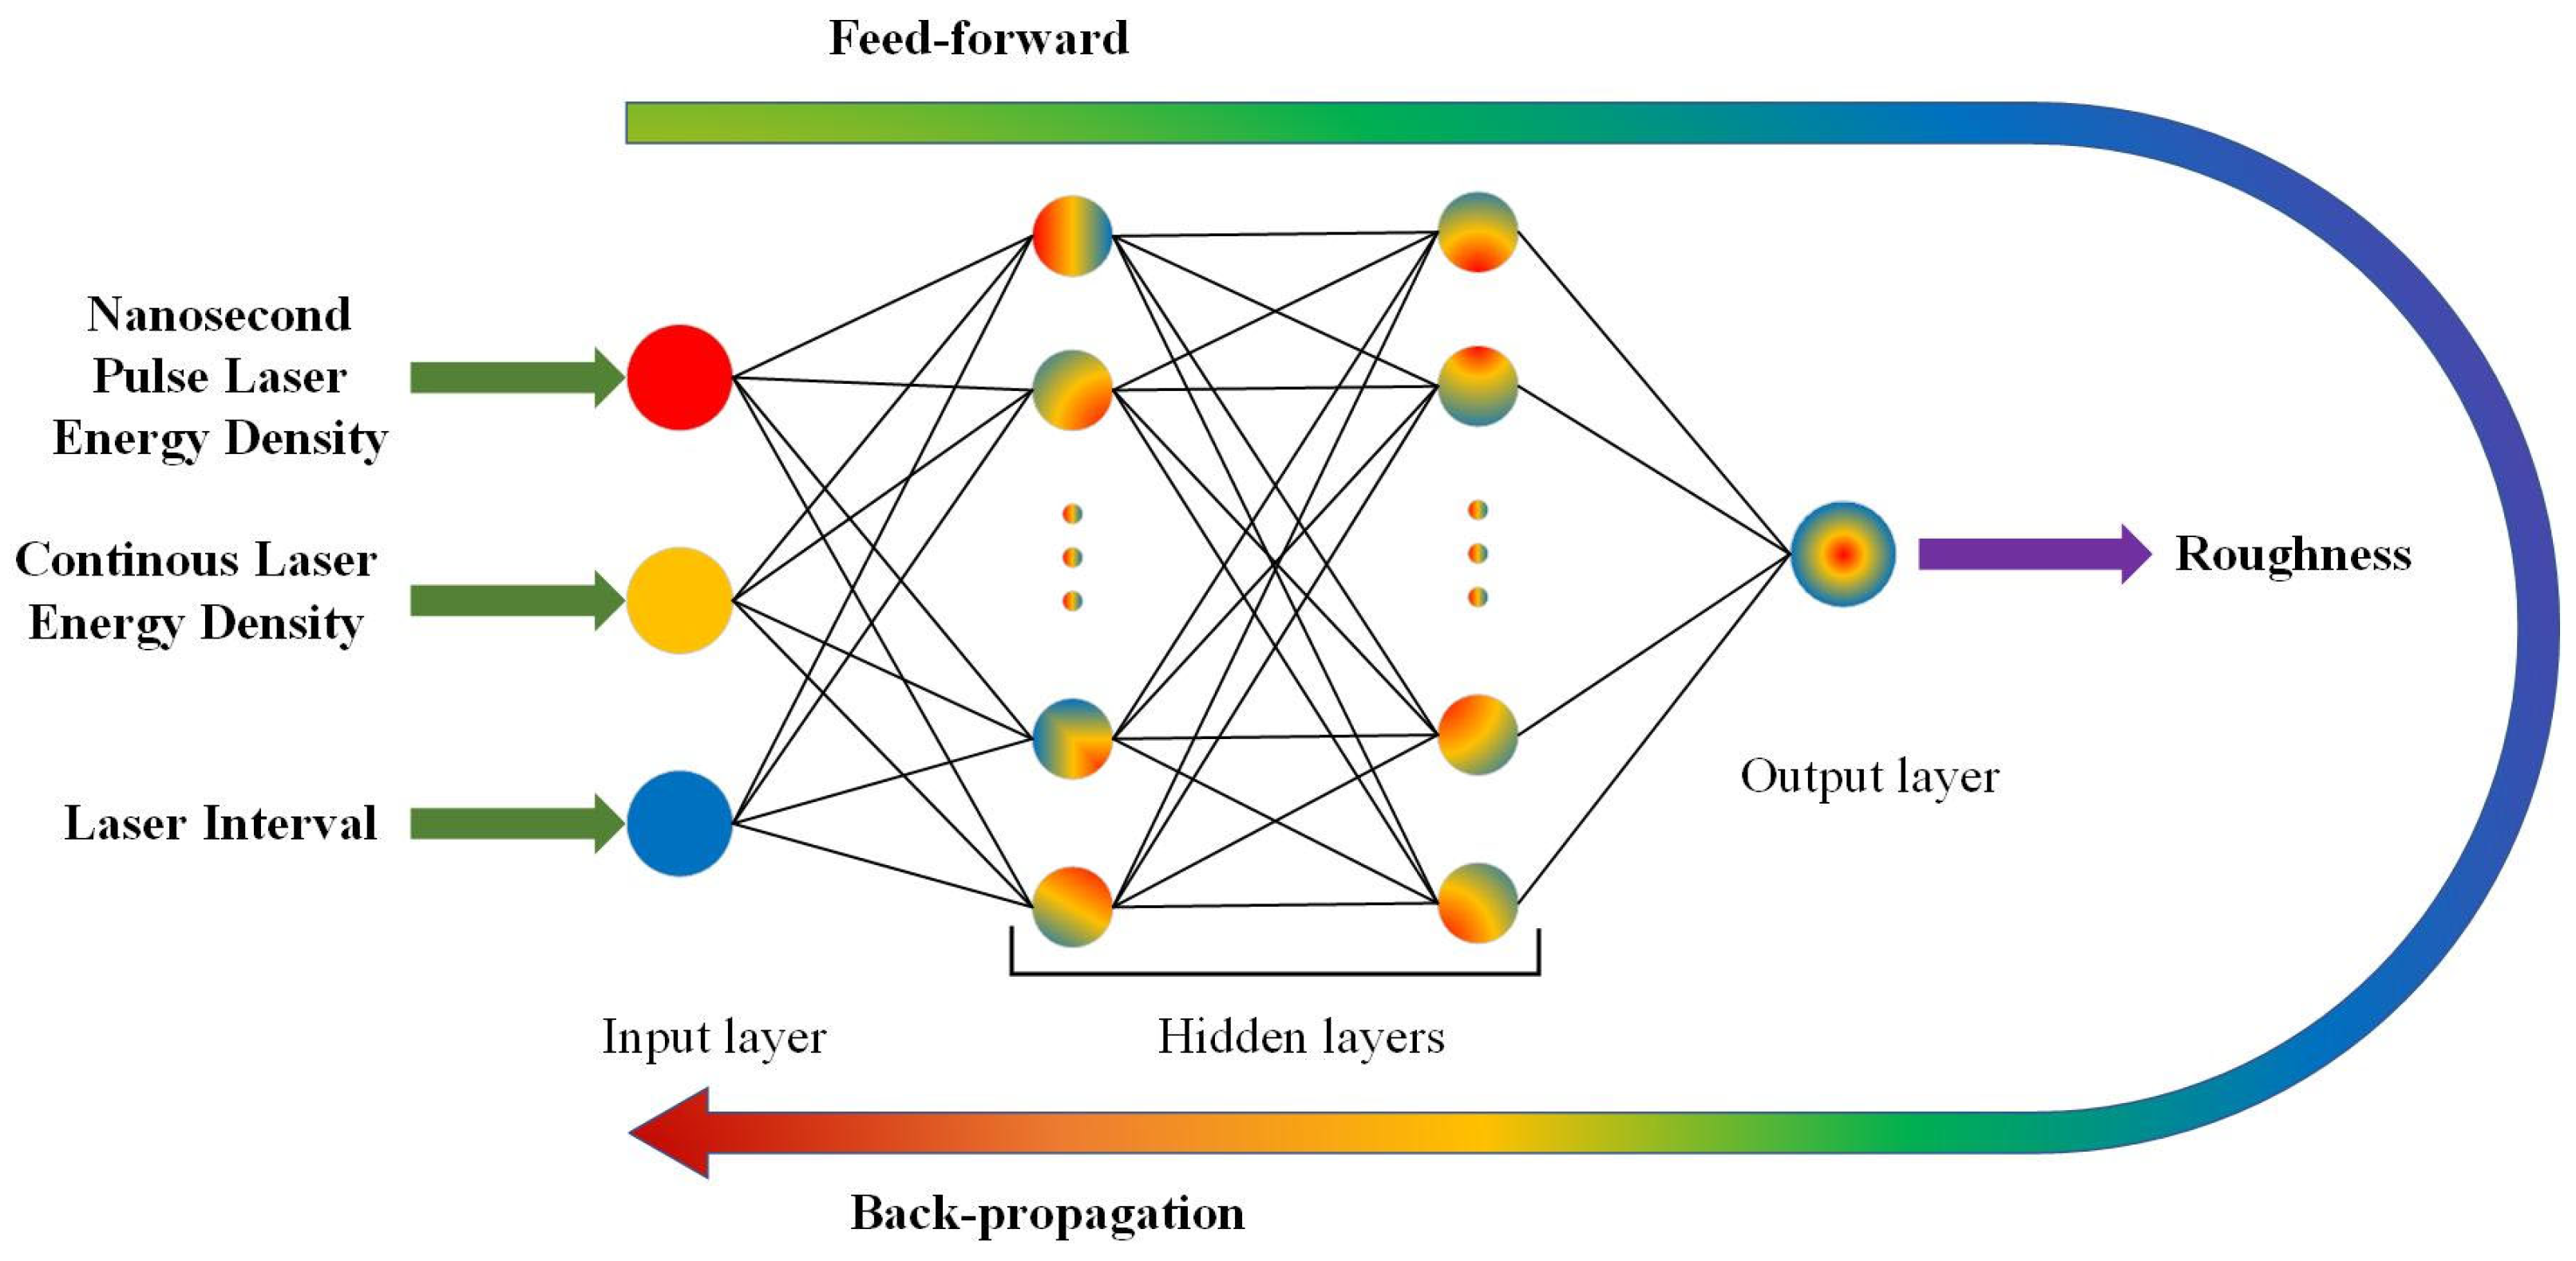
2.2. BPNN and SSA
2.2.1. BPNN
2.2.2. SSA-BPNN
2.2.3. Model Evaluation Indicators
3. Results and Discussion
3.1. Experimental Surface Roughness
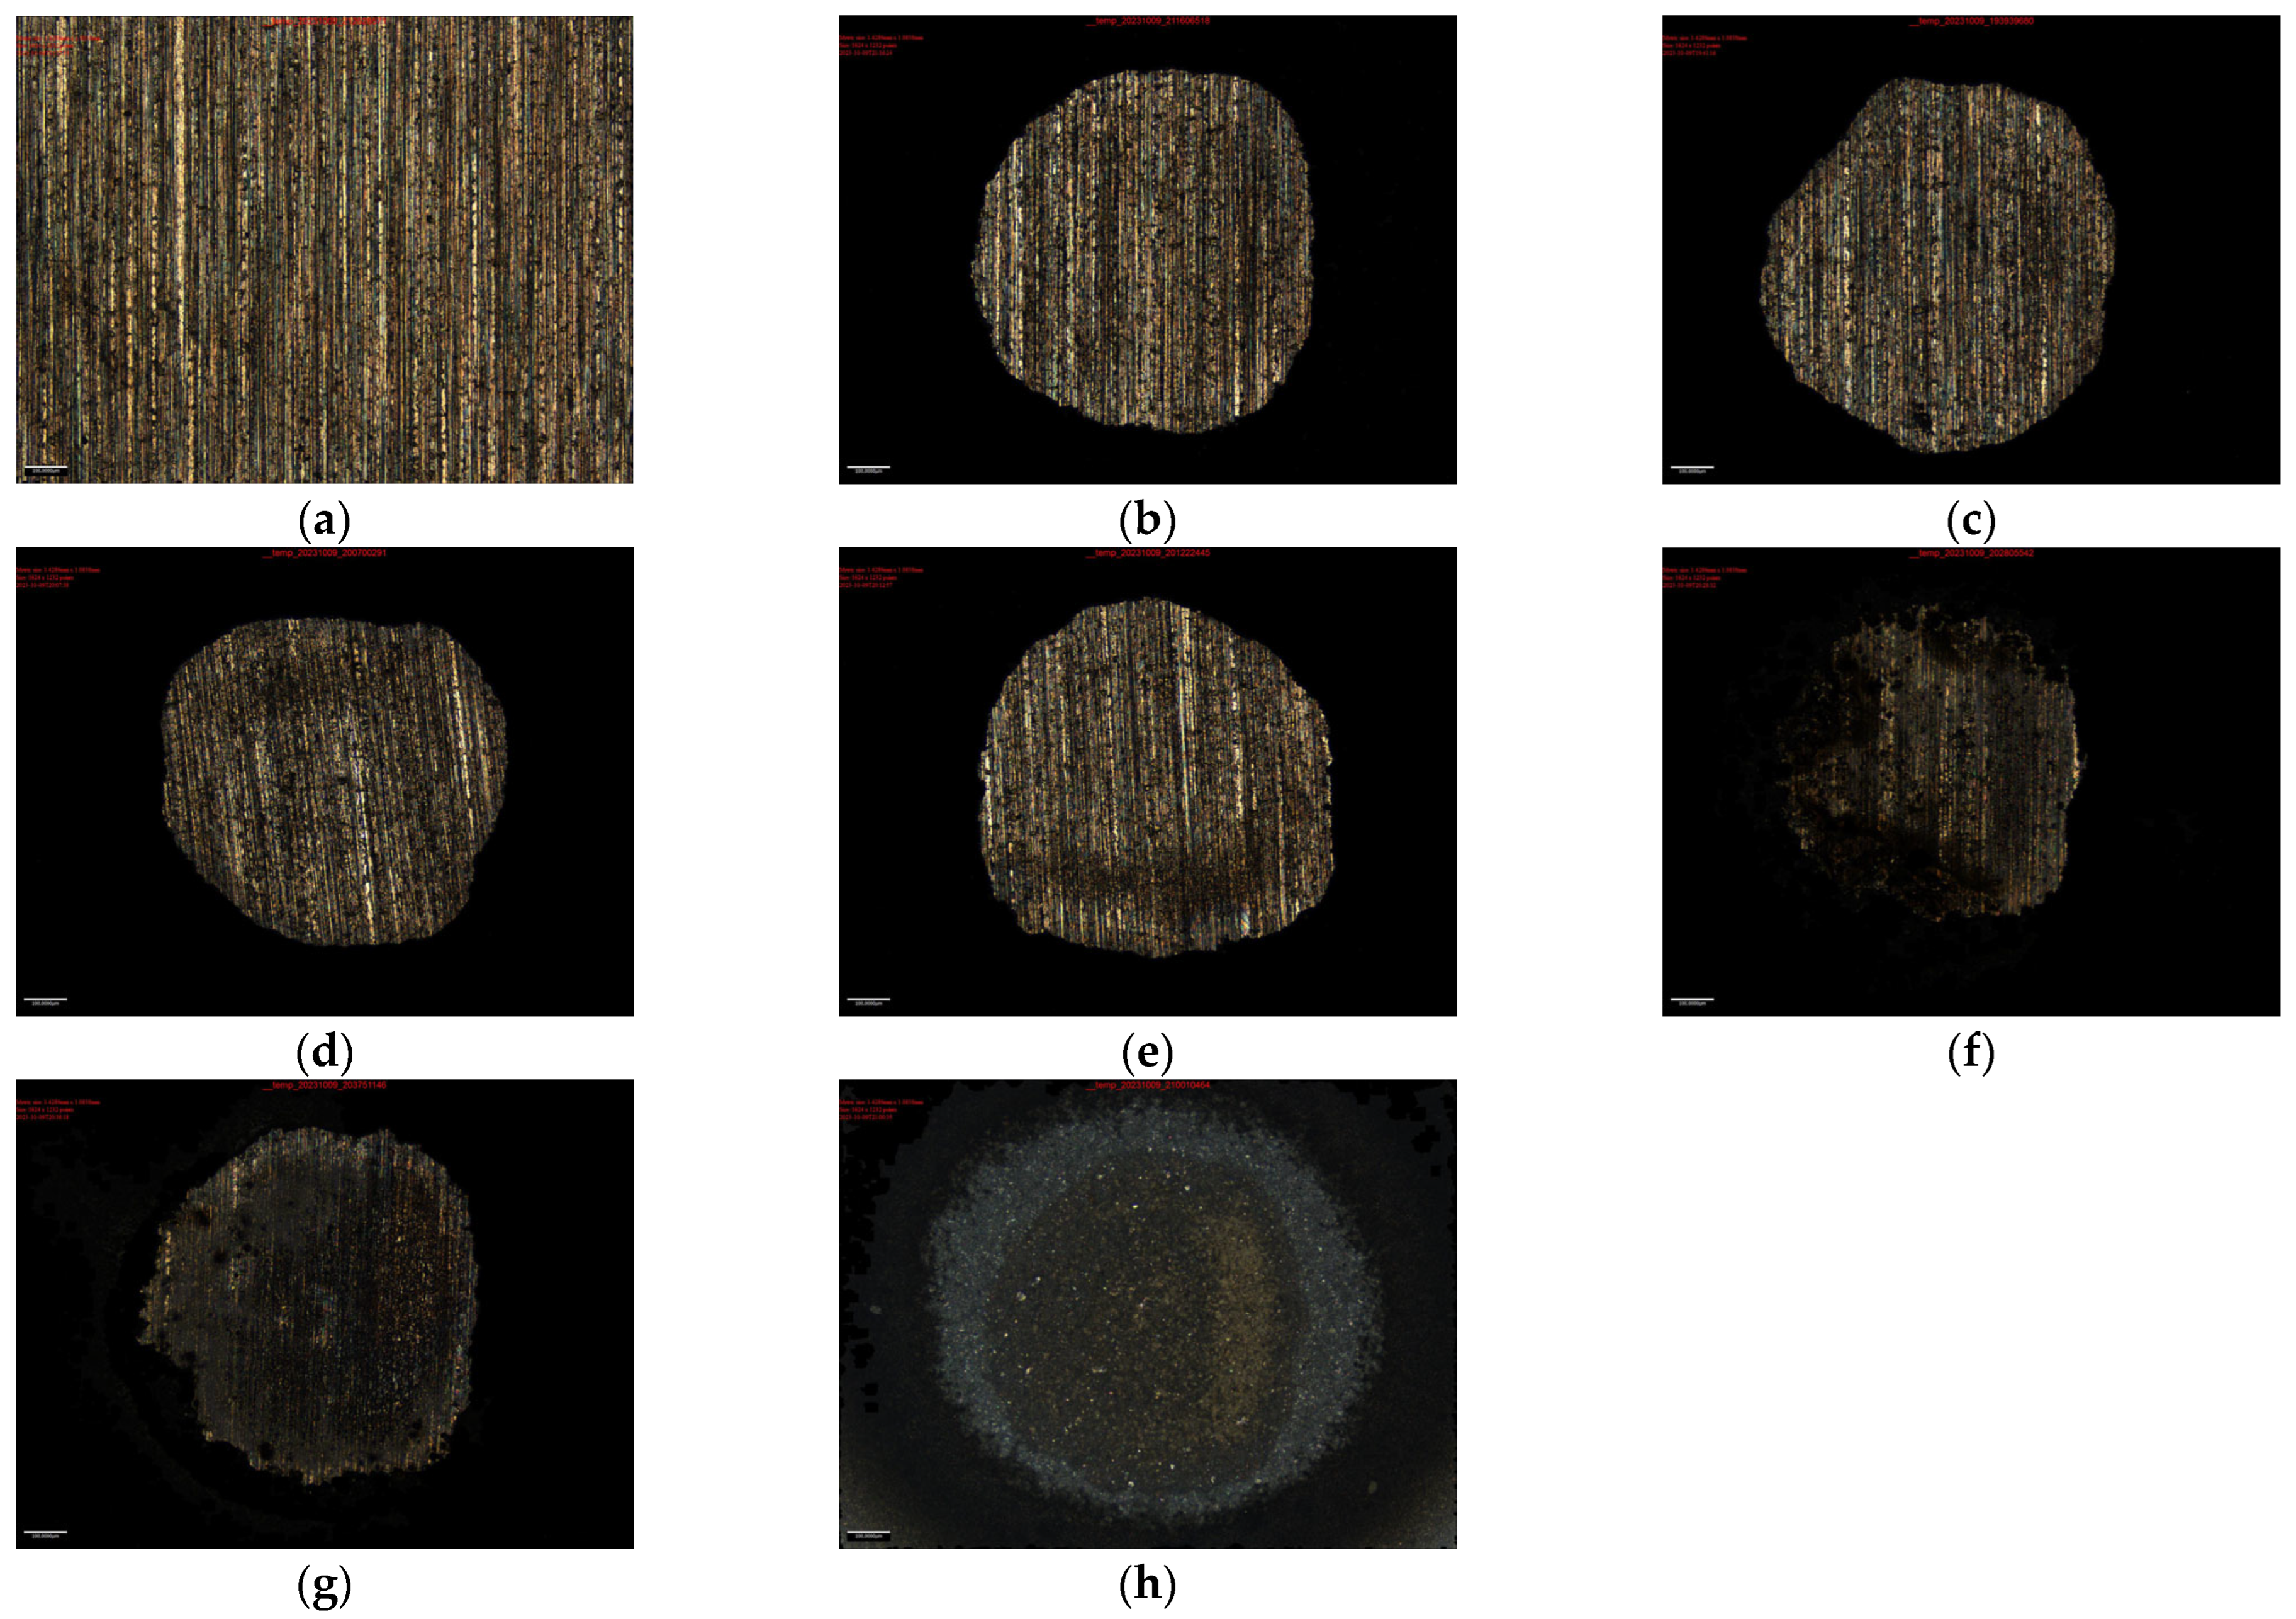
3.1.1. The Surface Morphology of Target Induced by Laser Paint Removal
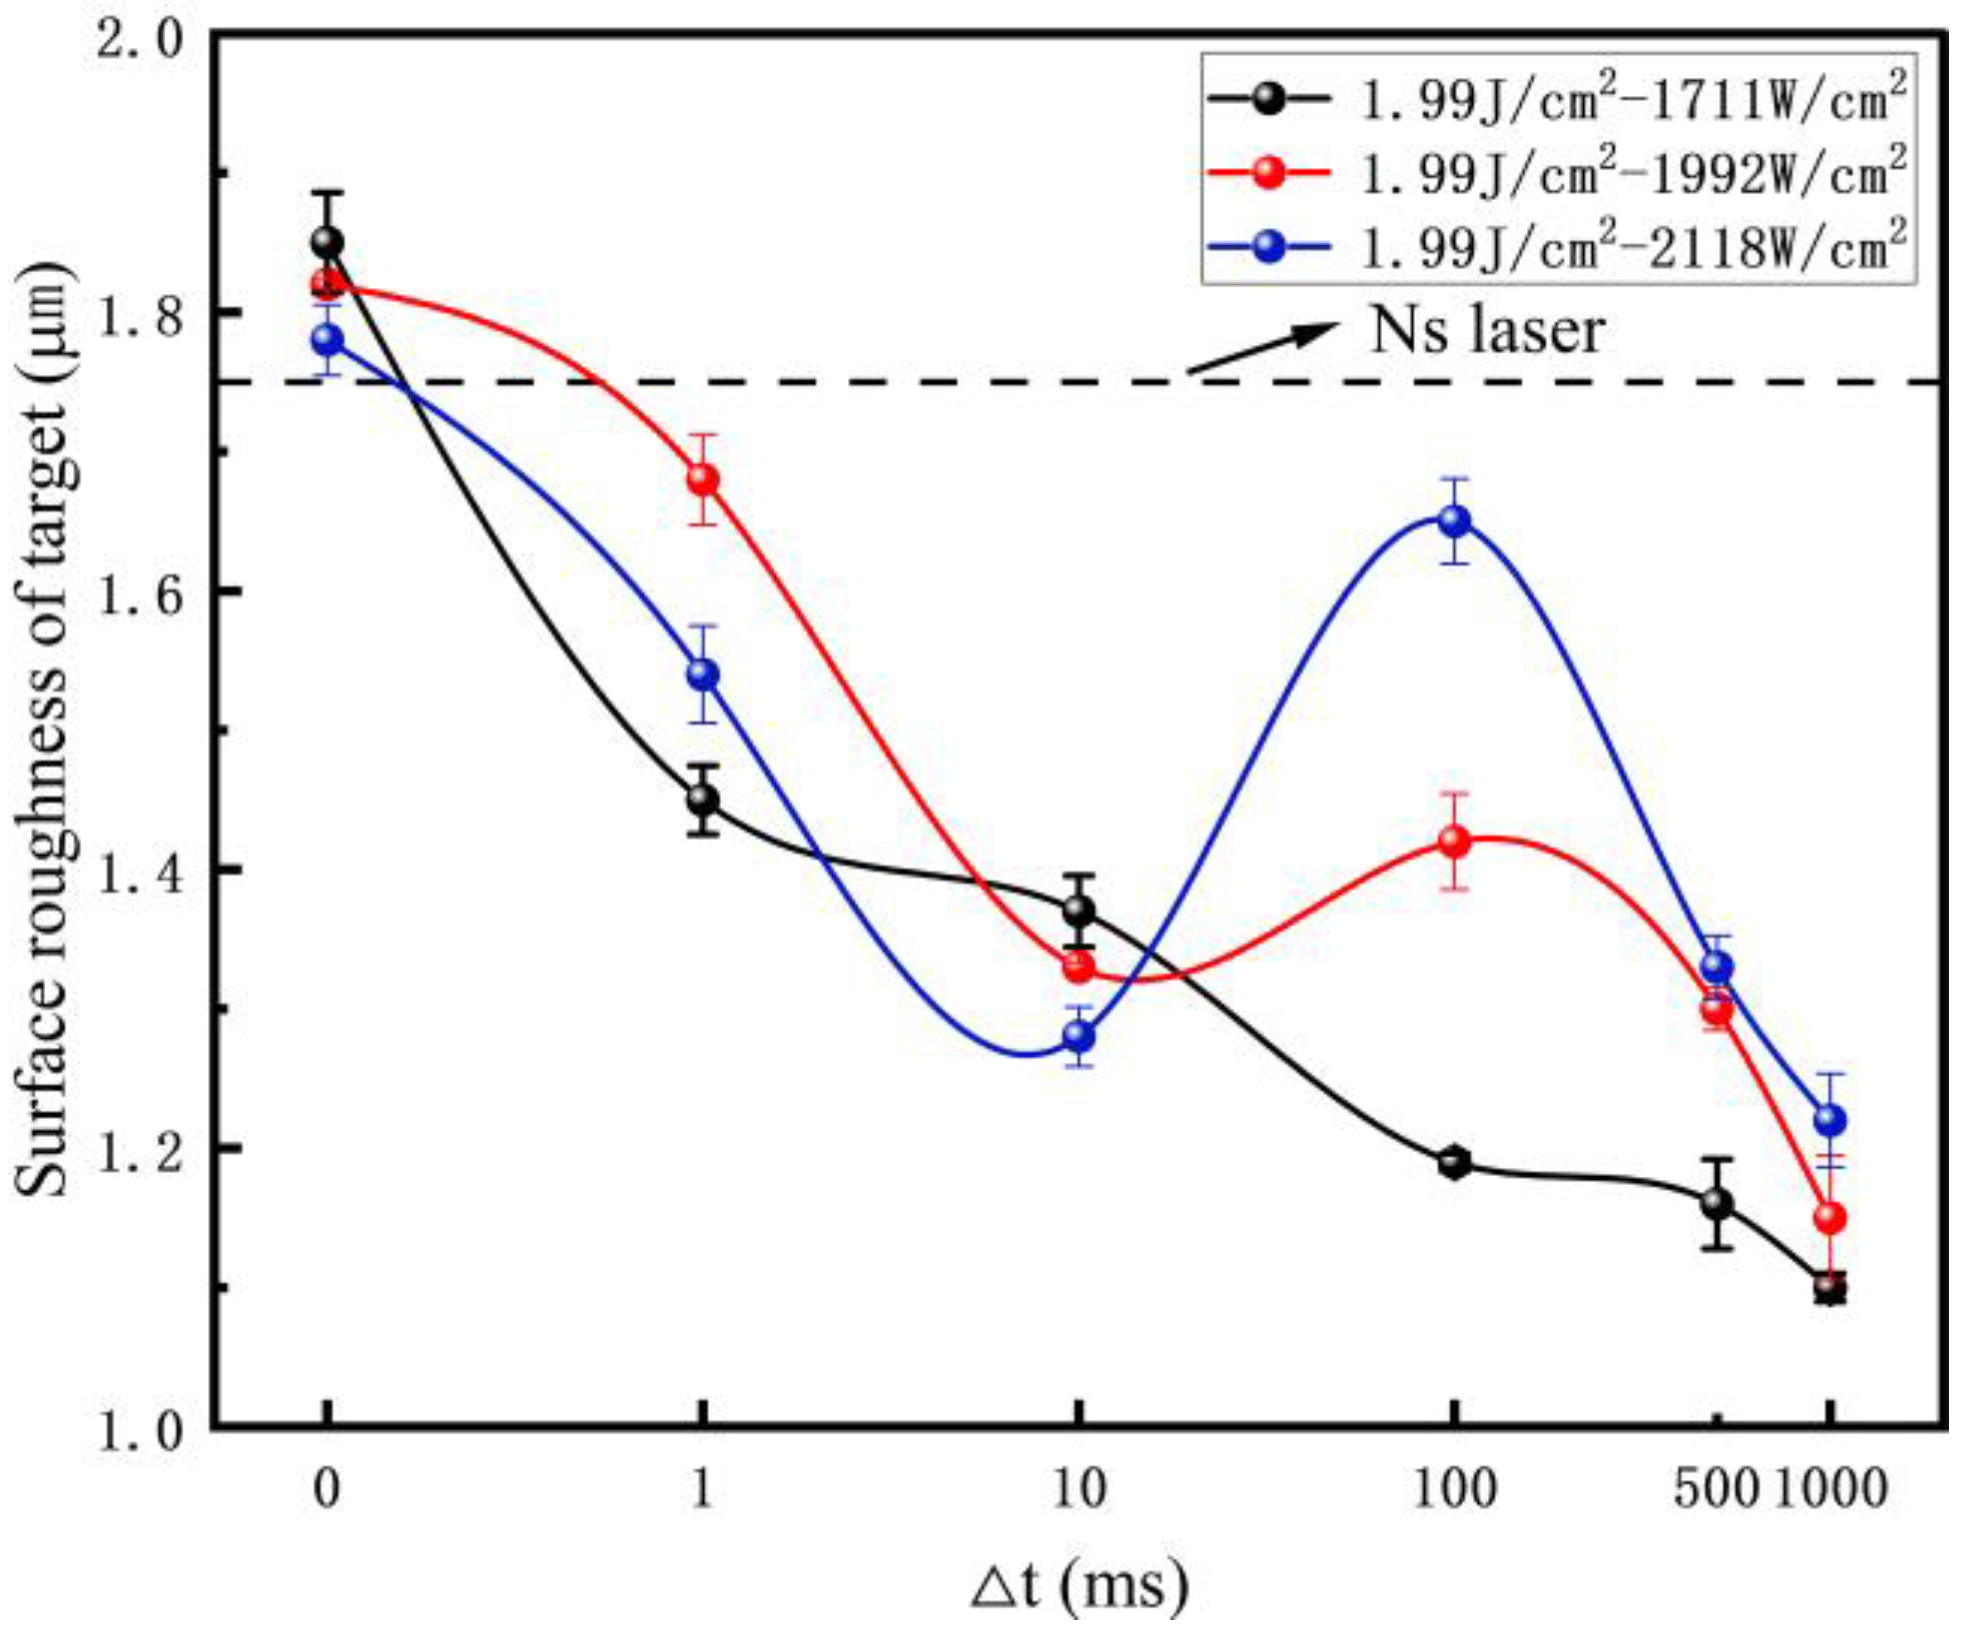
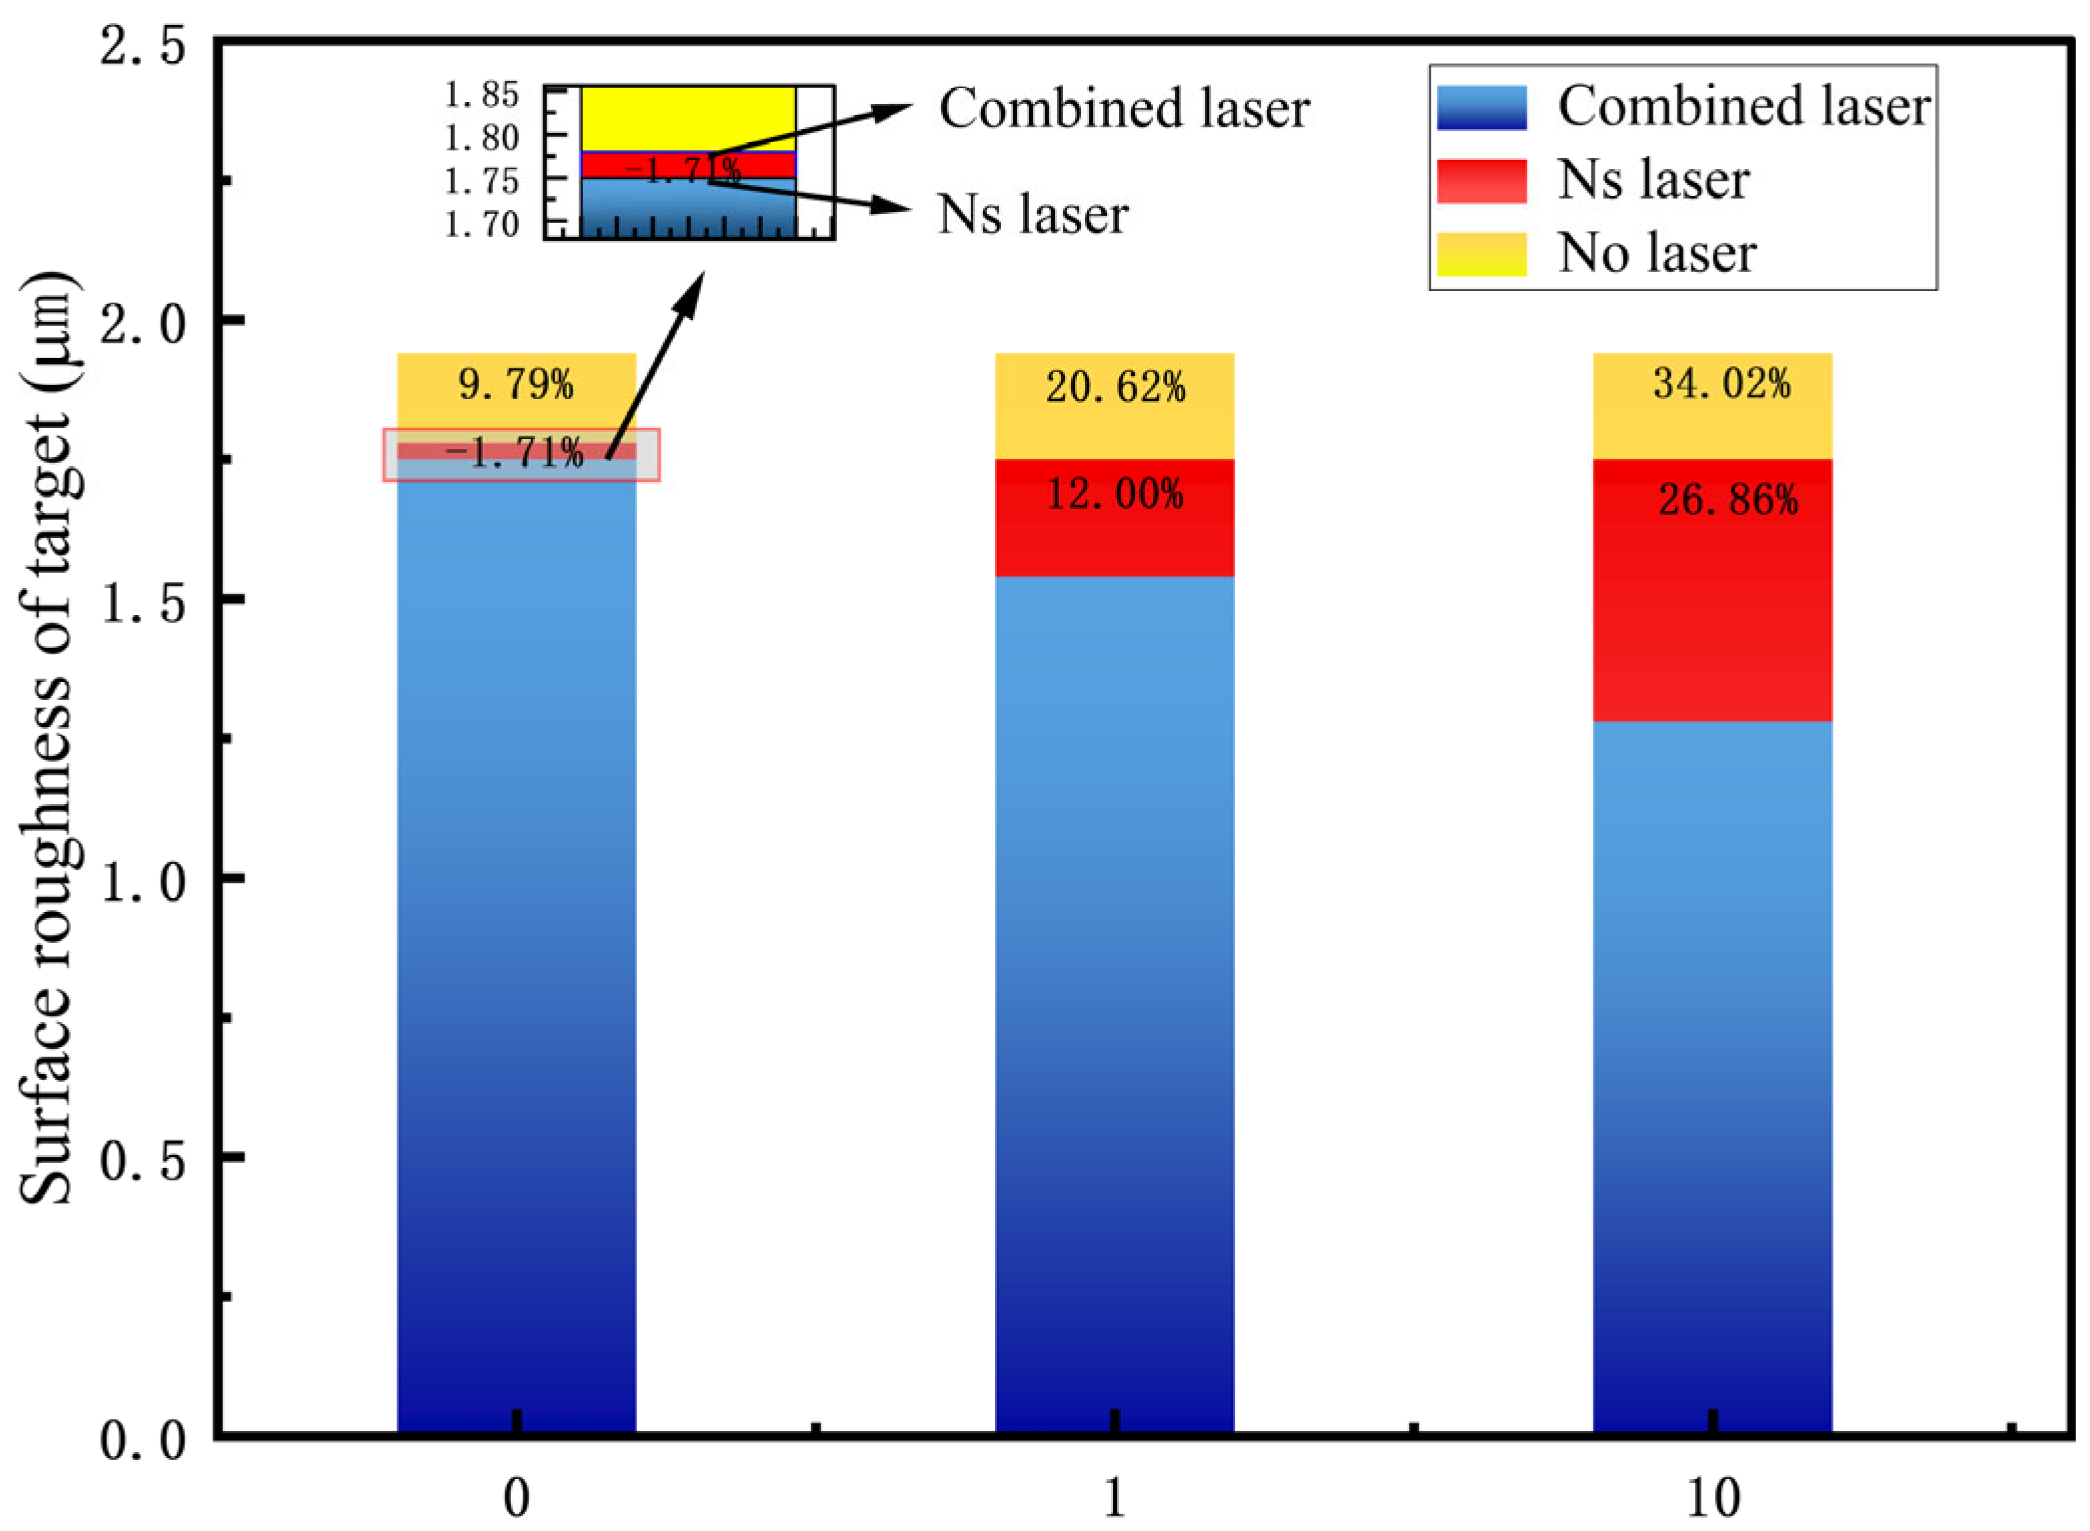
3.1.2. The Surface Roughness of the Target Induced by Laser Paint Removal
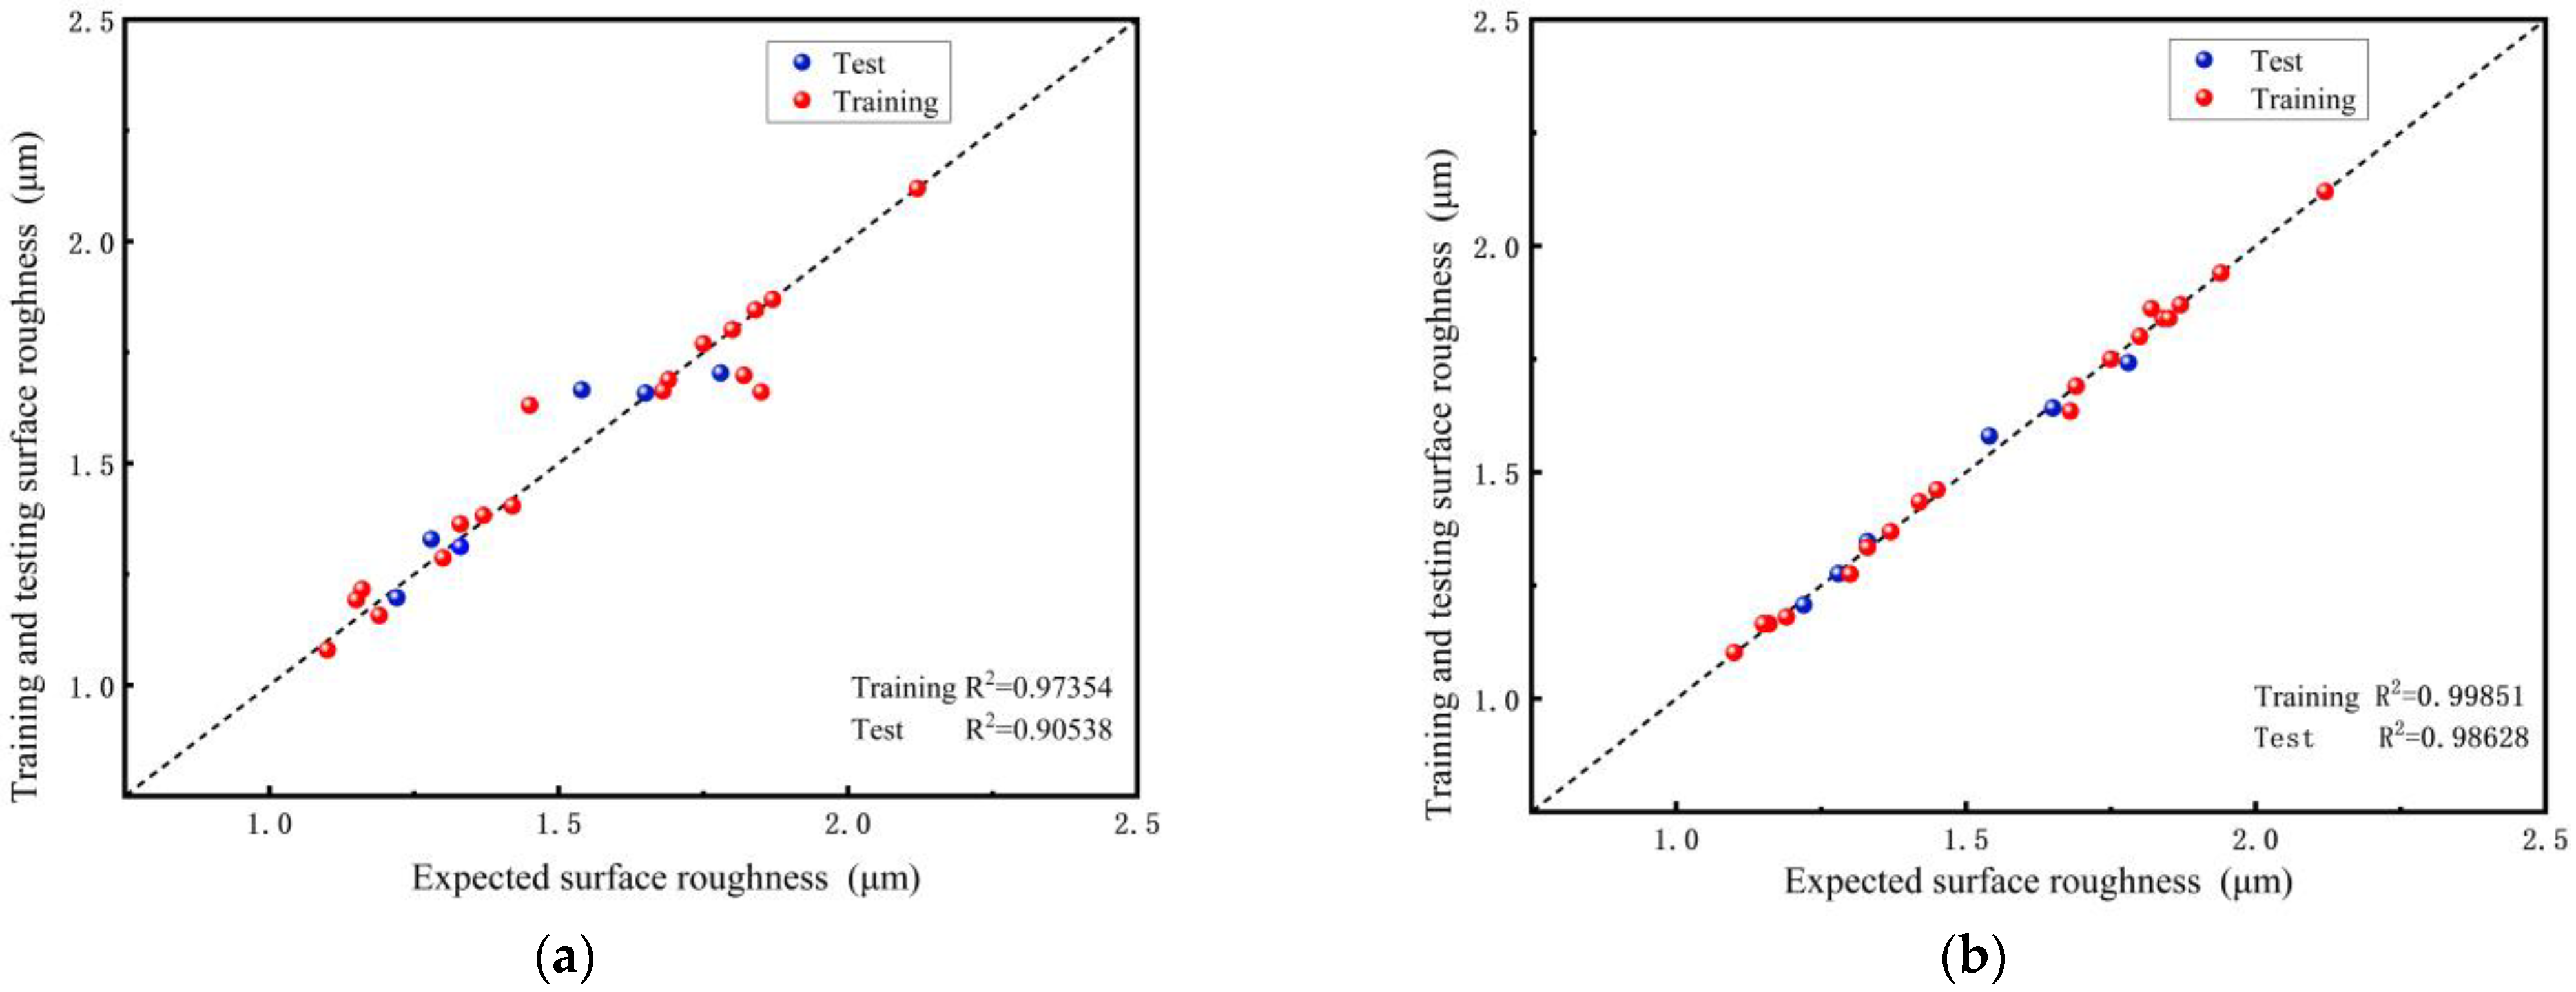
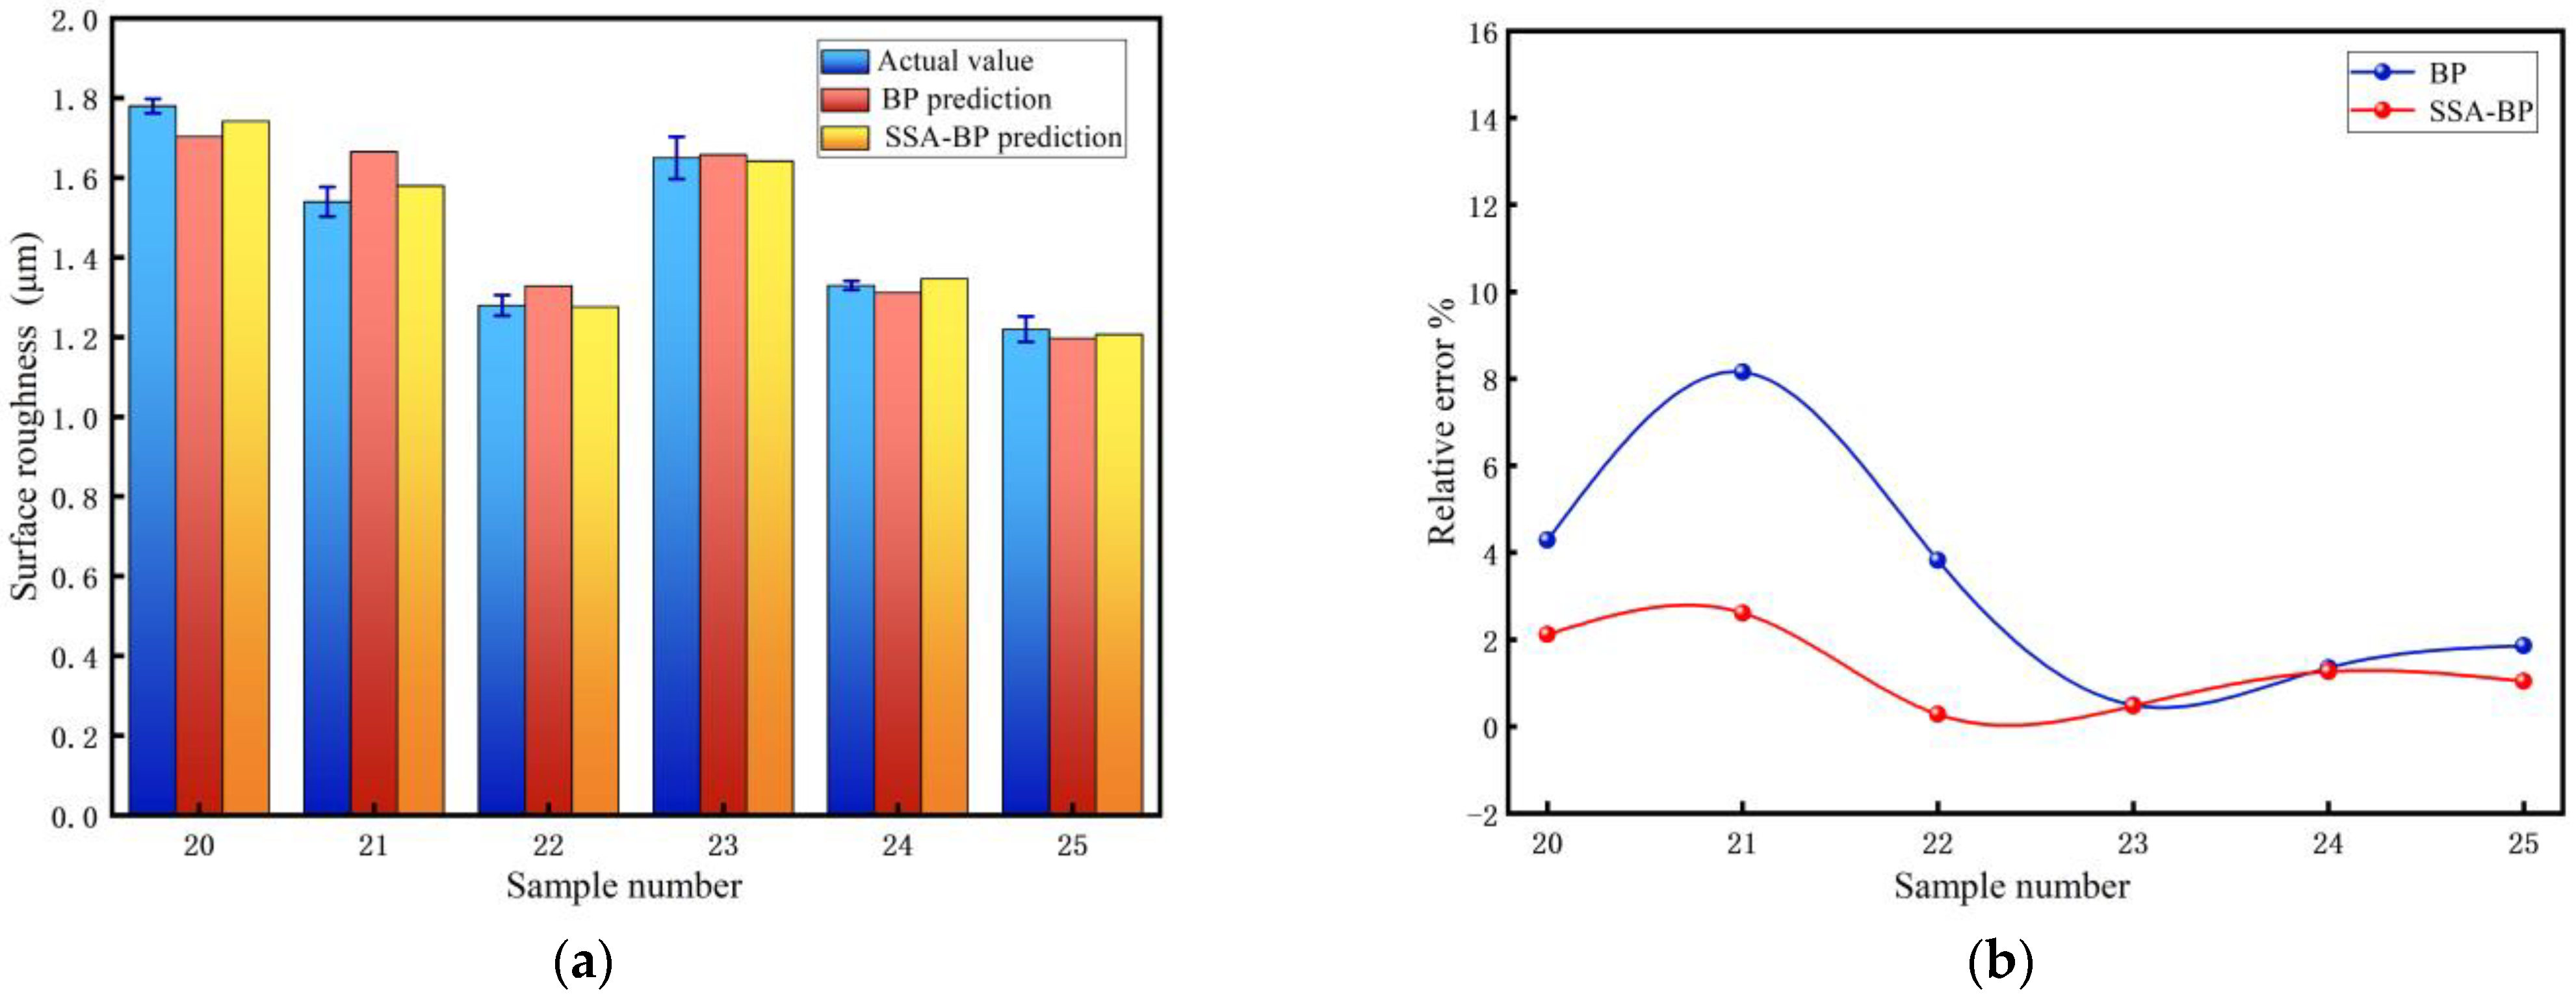
3.2. ANN Prediction for Surface Roughness
4. Conclusions
- (1)
- Compared to the single ns laser, the CL can reduce aluminum alloy surface roughness and completely remove the paint film while ECL = 1.99 J/cm2 − 2118 W/cm2, △t = 1 ms. The surface roughness reduction is from 1.75 µm to 1.54 µm, a decrement of 12.00% and a 20.62% roughness reduction compared to the original target.
- (2)
- The surface roughness predictions of SSA-BPNN fit better with the test set than BPNN. The R2, RMSE, MAE and MAP are 0.98628, 0.024, 0.020 and 1.30%, respectively. It is indicated that the SSA-BPNN has higher prediction accuracy and a higher reliability for surface roughness. This provides a theoretical reference for both surface quality enhancement and laser parameter optimization in industrial applications.
Author Contributions
Funding
Institutional Review Board Statement
Informed Consent Statement
Data Availability Statement
Acknowledgments
Conflicts of Interest
References
- Shi, Y.; Chen, W.; Wang, J.; Zhang, C.; Zhang, C.J.; Li, H. CO2 laser cleaning of cross-linked polymer coating on metal mesh. Appl. Opt. 2022, 61, 8671–8677. [Google Scholar] [CrossRef] [PubMed]
- Han, Y.; Peng, X.; Wan, S.; Cao, Z.; Chen, H.; Wang, L.; Jiang, G.; Cheng, X.; Wei, C.; Shao, J. Microsecond-pulsed CO2 laser cleaning of high damage threshold fused silica. Int. J. Mech. Sci. 2024, 279, 109481. [Google Scholar] [CrossRef]
- Dong, H.; Li, Y.; Lu, S.; Zhang, W.; Jin, G. Nanosecond Laser Cleaning of Aluminum Alloy Oxide Film. Curr. Opt. Photonics 2023, 7, 714–720. [Google Scholar]
- Jasim, H.A.; Demir, A.G.; Previtali, B.; Taha, Z.A. Process development and monitoring in stripping of a highly transparent polymeric paint with ns-pulsed fiber laser. Opt. Laser Technol. 2017, 93, 60–66. [Google Scholar] [CrossRef]
- Zhang, T.; Liu, T.; Zhao, S.; Zhang, Z.; Liu, Y.; Zhong, C. Numerical simulation and experimental study of cleaning mechanisms in multipulse laser paint removal of acrylic polyurethane composite paint layers on aluminum alloy. Opt. Laser Technol. 2025, 181, 112048. [Google Scholar] [CrossRef]
- Liu, B.; Wang, C.; Mi, G.; Wang, J.; Zhang, W.; Zhang, X. Oxygen content and morphology of laser cleaned 5083 aluminum alloy and its influences on weld porosity. Opt. Laser Technol. 2021, 140, 107031. [Google Scholar] [CrossRef]
- Wang, Q.; Guan, Y.; Cong, B.; Qi, B. Laser cleaning of commercial Al alloy surface for tungsten inert gas welding. Laser Appl. 2016, 28, 022507. [Google Scholar]
- Zhou, C.; Li, H.; Chen, G.; Wang, G.; Shan, Z. Effect of single pulsed picosecond and 100 nanosecond laser cleaning on surface morphology and welding quality of aluminium alloy. Opt. Laser Technol. 2020, 127, 106197. [Google Scholar] [CrossRef]
- Andrews, S.; Sehitoglu, H. A computer model for fatigue crack growth from rough surfaces. Int. J. Fatigue 2000, 22, 619–630. [Google Scholar] [CrossRef]
- Klotz, T.; Miao, H.Y.; Bianchetti, C.; Lévesque, M.; Brochu, M. Analytical fatigue life prediction of shot peened Inconel 718. Int. J. Fatigue 2018, 113, 204–221. [Google Scholar] [CrossRef]
- Liu, Y.; Liu, W.; Zhang, D.; Tian, Z.; Sun, X.; Wei, Z. Experimental investigations into cleaning mechanism of ship shell plant surface involved in dry laser cleaning by controlling laser power. Appl. Phys. A 2020, 126, 866. [Google Scholar] [CrossRef]
- Kumar, A.; Bhatt, R.B.; Behere, P.G.; Afzal, M.; Kumar, A.; Nilaya, J.P.; Biswas, D.J. Laser-assisted surface cleaning of metallic components. Pramana 2014, 82, 237–242. [Google Scholar] [CrossRef]
- Zhao, H.; Qiao, Y.; Du, X.; Wang, S.; Zhang, Q.; Zang, Y.; Liu, X. Laser cleaning performance and mechanism in stripping of Polyacrylate resin paint. Appl. Phys. A 2020, 126, 360. [Google Scholar] [CrossRef]
- Zhu, G.; Wang, S.; Cheng, W.; Ren, Y.; Wen, D. Corrosion and wear performance of aircraft skin after laser cleaning. Opt. Laser Technol. 2020, 132, 106475. [Google Scholar] [CrossRef]
- Wang, Z.; Zeng, X.; Huang, W. Parameters and Surface Performance of Laser Removal of Rust Layer on A3 Steel. Surf. Coat. Technol. 2003, 166, 10–16. [Google Scholar] [CrossRef]
- Chen, G.; Kwee, T.; Tan, K.; Choo, Y.; Hong, M. Laser cleaning of steel for paint removal. Appl. Phys. A 2010, 101, 249–253. [Google Scholar] [CrossRef]
- Zhu, G.; Wang, S.; Cheng, W.; Wen, D.; Ren, Y. Investigation on the Surface Properties of 5A12 Aluminum Alloy after Nd: YAG Laser Cleaning. Coatings 2019, 9, 578. [Google Scholar] [CrossRef]
- Zhang, G.; Hua, X.; Li, F.; Zhang, Y.; Chen, S.; Cheng, J. Effect of laser cleaning process parameters on the surface roughness of 5754-grade aluminum alloy. Int. J. Adv. Manuf. Technol. 2019, 105, 2481–2490. [Google Scholar] [CrossRef]
- Li, Y.; Wang, C.; Mi, G. Influence of cleaning modes on the microstructure and performance of 5083 alloy substrate. J. Mech. Sci. Technol. 2021, 35, 3943–3949. [Google Scholar] [CrossRef]
- Zhang, D.; Xu, J.; Li, Z.; Li, K.; Wang, C.; Shan, D.; Guo, B. Removal mechanism of blue paint on aluminum alloy substrate during surface cleaning using nanosecond pulsed laser. Opt. Laser Technol. 2022, 149, 107882. [Google Scholar] [CrossRef]
- Zhao, Z.; Liu, X.; Chen, Z.; Tian, Y.; Chen, M.; Liu, L.; Song, F. Evaluation of laser cleaning effect for the removal of paint on aluminum alloys. Int. J. Adv. Manuf. Technol. 2023, 126, 3193–3203. [Google Scholar] [CrossRef]
- Anthofer, A.; Kögler, P.; Friedrich, C.; Lippmann, W.; Hurtado, A. Laser decontamination and decomposition of PCB-containing paint. Opt. Laser Technol. 2017, 87, 31–42. [Google Scholar] [CrossRef]
- Provines, J.; Rickard, R.; Sharp, S. Evaluation of a continuous laser ablation coating removal device for steel bridges. Transp. Res. Rec. 2022, 2676, 767–778. [Google Scholar] [CrossRef]
- Musavi, S.H.; Davoodi, B.; Eskandari, B. Evaluation of surface roughness and optimization of cutting parameters in turning of AA2024 alloy under different cooling-lubrication conditions using RSM method. J. Cent. South Univ. 2020, 27, 1714–1728. [Google Scholar] [CrossRef]
- Kong, D.; Zhu, J.; Duan, C.; Lu, L.; Chen, D. Surface roughness prediction using kernel locality preserving projection and Bayesian linear regression. Mech. Syst. Signal Process. 2021, 152, 107474. [Google Scholar] [CrossRef]
- Zhang, T.; Guo, X.; Fan, S.; Li, Q.; Chen, S.; Guo, X. AMS-Net: Attention mechanism based multi-size dual light source network for surface roughness prediction. J. Manuf. Process. 2022, 81, 3193–3203. [Google Scholar] [CrossRef]
- Xia, C.; Pan, Z.; Polden, J.; Li, H.; Xu, Y.; Chen, S. Modelling and prediction of surface roughness in wire arc additive manufacturing using machine learning. J. Intell. Manuf. 2022, 33, 1467–1482. [Google Scholar] [CrossRef]
- Wang, L.; Silva, L.; Süß-Wolf, R.; Franke, J. Prediction of surface roughness of laser selective metallization of ceramics by multiple linear regression and artificial neural networks approaches. J. Laser Appl. 2020, 32, 042013. [Google Scholar] [CrossRef]
- Cao, C.; Zhao, Y.; Song, Z.; Dai, D.; Liu, Q.; Zhang, X.; Meng, J.; Gao, Y.; Zhang, H.; Liu, G. Prediction and Optimization of Surface Roughness for Laser-Assisted Machining SiC Ceramics Based on Improved Support Vector Regression. Micromachines 2022, 13, 1448. [Google Scholar] [CrossRef]
- Zhang, P.; Cui, Z.; Wang, Y.; Ding, S. Application of BPNN optimized by chaotic adaptive gravity search and particle swarm optimization algorithms for fault diagnosis of electrical machine drive system. Electr. Eng. 2022, 104, 819–831. [Google Scholar] [CrossRef]
- Zhu, G.; Xu, Z.; Jin, Y.; Chen, X.; Yang, L.; Xu, J.; Shan, D.; Chen, Y.; Guo, B. Mechanism and application of laser cleaning: A review. Opt. Lasers Eng. 2022, 157, 107130. [Google Scholar] [CrossRef]


| Sample Number | Ens/J/cm2 | PC/W/cm2 | Δt/ms |
|---|---|---|---|
| 1 | 0 | 0 | 0 |
| 2 | 1.99 | 0 | 0 |
| 3 | 0 | 3621 | 0 |
| 4 | 0 | 6564 | 0 |
| 5 | 0 | 8035 | 0 |
| 6 | 0 | 9733 | 0 |
| 7 | 0 | 10,865 | 0 |
| 8 | 1.99 | 1711 | 0 |
| 9 | 1.99 | 1711 | 1 |
| 10 | 1.99 | 1711 | 10 |
| 11 | 1.99 | 1711 | 100 |
| 12 | 1.99 | 1711 | 500 |
| 13 | 1.99 | 1711 | 1000 |
| 14 | 1.99 | 1992 | 0 |
| 15 | 1.99 | 1992 | 1 |
| 16 | 1.99 | 1992 | 10 |
| 17 | 1.99 | 1992 | 100 |
| 18 | 1.99 | 1992 | 500 |
| 19 | 1.99 | 1992 | 1000 |
| 20 | 1.99 | 2118 | 0 |
| 21 | 1.99 | 2118 | 1 |
| 22 | 1.99 | 2118 | 10 |
| 23 | 1.99 | 2118 | 100 |
| 24 | 1.99 | 2118 | 500 |
| 25 | 1.99 | 2118 | 1000 |
| Model | RMSE | MAE | MAPE |
|---|---|---|---|
| BP | 0.033 | 0.05 | 6.45% |
| SSA-BP | 0.024 | 0.020 | 1.30% |
| Sample Number | Actual Value/μm | Predicted Value/μm | Relative Error/% | Absolute Error/μm | |||
|---|---|---|---|---|---|---|---|
| BP | SSA-BP | BP | SSA-BP | BP | SSA-BP | ||
| 20 | 1.78 | 1.70365 | 1.74226 | 4.289 | 2.12 | −0.07635 | −0.03774 |
| 21 | 1.54 | 1.6656 | 1.58031 | 8.156 | 2.617 | 0.1256 | 0.04031 |
| 22 | 1.28 | 1.32904 | 1.27634 | 3.831 | 0.286 | 0.04904 | −0.00366 |
| 23 | 1.65 | 1.65823 | 1.64211 | 0.499 | 0.478 | 0.00823 | −0.00789 |
| 24 | 1.33 | 1.31196 | 1.34685 | 1.357 | 1.266 | −0.01804 | 0.01685 |
| 25 | 1.22 | 1.19728 | 1.20726 | 1.862 | 1.044 | −0.02272 | −0.01274 |
Disclaimer/Publisher’s Note: The statements, opinions and data contained in all publications are solely those of the individual author(s) and contributor(s) and not of MDPI and/or the editor(s). MDPI and/or the editor(s) disclaim responsibility for any injury to people or property resulting from any ideas, methods, instructions or products referred to in the content. |
© 2025 by the authors. Licensee MDPI, Basel, Switzerland. This article is an open access article distributed under the terms and conditions of the Creative Commons Attribution (CC BY) license (https://creativecommons.org/licenses/by/4.0/).
Share and Cite
Li, J.; Liang, R.; Li, H.; Liu, J.; Sun, J. Prediction of Aluminum Alloy Surface Roughness Through Nanosecond Pulse Laser Assisted by Continuous Laser Paint Removal. Photonics 2025, 12, 575. https://doi.org/10.3390/photonics12060575
Li J, Liang R, Li H, Liu J, Sun J. Prediction of Aluminum Alloy Surface Roughness Through Nanosecond Pulse Laser Assisted by Continuous Laser Paint Removal. Photonics. 2025; 12(6):575. https://doi.org/10.3390/photonics12060575
Chicago/Turabian StyleLi, Jingyi, Rongfan Liang, Han Li, Junjie Liu, and Jingdong Sun. 2025. "Prediction of Aluminum Alloy Surface Roughness Through Nanosecond Pulse Laser Assisted by Continuous Laser Paint Removal" Photonics 12, no. 6: 575. https://doi.org/10.3390/photonics12060575
APA StyleLi, J., Liang, R., Li, H., Liu, J., & Sun, J. (2025). Prediction of Aluminum Alloy Surface Roughness Through Nanosecond Pulse Laser Assisted by Continuous Laser Paint Removal. Photonics, 12(6), 575. https://doi.org/10.3390/photonics12060575