1. Introduction
As a third-order nonlinear optical phenomenon, stimulated Brillouin scattering (SBS) arises from the interaction between two optical waves and an acoustic wave in a medium, resulting in the generation of new phonon and photon states through electrostrictive coupling. Consequently, the interaction between sonic waves and light waves can be realized by the SBS effect, and the frequencies of produced phonons and photons are higher than before. Since its first experimental demonstration in 1964, the SBS effect has found widespread applications across numerous optical domains and has led to several groundbreaking advancements in photonic technologies, for example, distributed sensing based on the SBS effect [
1,
2] quick light and slow light [
3,
4], microwave photonics [
5,
6,
7], narrow-linewidth Brillouin laser [
8,
9] and other applications. However, the traditional optical waveguides currently used to realize the SBS effect often have a relatively long transmission distance. Conventional optical waveguide designs face significant limitations, not only in terms of resource efficiency but also in meeting the critical demands of device miniaturization and system integration. In contrast, silicon has emerged as the dominant platform for integrated photonics, owing to its native compatibility with complementary metal–oxide–semiconductor (CMOS) fabrication processes. This inherent advantage enables high-volume manufacturing of nanophotonic devices while maintaining precise dimensional control at sub-micron scales. A significant advancement came in 2013 when Eggleton’s team [
10] demonstrated a breakthrough suspended silicon waveguide architecture. Their design achieved micron-scale cross-sectional dimensions while maintaining an exceptional Brillouin gain coefficient of 1750 W
−1 m
−1. In the same year, Lu Yuangang et al. proposed a new waveguide including a chalcogenide As
2S
3 glass center and an air groove to increase the Brillouin gain. The Brillouin gain reached 2.88 × 10
4 W
−1 m
−1. It reached a higher Brillouin gain, however, the extremely hard nature of silicon makes the guidance of sonic waves in SOI (Silicon on Insulator) waveguides difficult [
11]. These geometric constraints fundamentally limit phonon–photon interactions, thereby restricting the achievable Brillouin gain in conventional waveguide systems. In contrast, lithium niobate (LiNbO
3, LN) has emerged as a promising alternative platform due to its strong electro-optic coefficients enabling active tuning, high optical nonlinearity for enhanced light–matter interactions, and CMOS-compatible fabrication processes for scalable integration. The material properties of LN crystal are outstanding in contrast to traditional silicon materials; for example, its transparent window has low loss, its electro-optical coefficient is superior, and its second-order nonlinearity is high. It has been widely used in many applications [
12,
13]. Because of its high nonlinear coefficient and broadband optical transmission, LN crystal has been widely used in the field of nonlinear optics. Periodically poled lithium niobate (PPLN) crystals and diffused waveguides leverage the material’s ferroelectric domain engineering capabilities. The periodic domain inversion in PPLN enables precise quasi-phase matching for nonlinear optical processes, while the diffused waveguide geometry provides effective light confinement [
14,
15,
16,
17,
18]. In order to better excite a strong photon–phonon interaction, researchers have proposed a variety of different optical waveguide model structures, including ridge waveguides, suspended waveguides, rings with Er
3+, and bullseye models. While these waveguide models enable forward stimulated Brillouin scattering (FSBS) at micro/nano scales, current racetrack-shaped ridge waveguide implementations typically require centimeter-scale dimensions. This scale fundamentally contradicts the requirements for photonic integration and miniaturization [
19].
Therefore, in this article, a special floating waveguide (a lithium niobate air-slit waveguide) is designed. Through forward Brillouin scattering, which is also called stimulated multi-mode Brillouin scattering, the optical field is combined with diverse optical spatial modes, resulting in an enhanced Brillouin gain, which reached 1.31 × 10⁵ W−1 m−1. Furthermore, this work presents a novel approach for achieving broadband frequency tuning in an ultra-compact waveguide system. By exploiting photon–phonon interaction dynamics, our approach enables active frequency tuning through controlled opto-acoustic mode conversion. It provides a new opportunity for the generation of Brillouin equipment and microwave signal sources.
2. Theory Model
Forward stimulated Brillouin scattering (FSBS) represents the direct interaction among the pump beam, Stokes light/anti-Stokes light, and sonic waves [
14,
15]. To be more specific, during the FSBS process, the optical fields propagate in the same direction, while the phonon and the optical field propagate perpendicularly to each other during the scattering process [
20,
21,
22]. Additionally, a criterion that phase matching must be followed; that is, the energy and momentum should satisfy the two formulas:
where
,
, and
, respectively, denote phonon frequency, pump frequency, and Stokes wave frequency. Through the direction in which the Stokes wave propagates, there are two types of SBS: BSBS and FSBS. When the FSBS propagates, the transmission direction of the pump beam and Stokes wave is same, while there is reverse direction in the BSBS.
For the FSBS process, it is assumed that pump light and Stokes light both propagate along the z-axis, so we describe their optical wave field as follows:
where
Ep (
z,
t) represents the pump light field, while
Es (
z,
t) represents the Stokes light field. The method of small signal approximation substitution was used for further study. When the pump signal power in the waveguide exceeds the Stokes signal power, the coupling between them should satisfy the conditions as follows [
23]:
where
Pp and
Ps denote the optical power of the pump and Stokes waves, respectively, while
α represents the linear propagation loss. The nonlinear loss coefficients, attributed to two-photon absorption (TPA) and free-carrier absorption (FCA), are denoted by
β and
γ, respectively. The Brillouin gain coefficient,
g, as defined in Equation (7), takes the following form [
24]:
Among them, the acoustic loss is ignored, Ω
m represents the intrinsic frequency that satisfies the overall characteristic equation of the sonic mode.
is the sound film loss factor when the sonic loss is considered, which is decided by the optical quality factor
Qm. Additionally, it shall follow the relationship
[
25], where the
m-th order sonic pattern is denoted by the subscript
m (
m = 1, 2, 3……) [
19].
Considering the sonic loss, we can simplify every SBS gain factor to the following equation [
25]:
where optical group velocity is represented by
Vgs,
ε represents conductivity, and
ρ is density. The parameter
f represents the total of the optical forces exerted by pump light and Stokes light, assuming the whole waveguide cross-sectional area is fully covered by
and
. This represents the overlapping integral of the total optical force [
26] and an individual m-order light eigenmode, denoting the optomechanical coupling intensity based on the levitated waveguide [
27].
Caused by the total light force, the sonic displacement field [
19] is supposed to satisfy the phase-matching requirements of Equations (1) and (2). In order to simplify the calculation approach, the desired sonic equation is obtained after neglecting elastic loss in the homogeneous media:
where the quantum photon tensor is represented as
Cijkl, and the displacement component and general light force of the phonon field are, respectively, described as
and
fi. In the equation,
denotes the derivative orientation along the
j-th space of
j, and the range of
j is as follows:
[
19]. Without the acting force
fi in Equation (9),we can acquire the displacement component
umi of the sound field in distinct situations. Hybrid Acoustic Waves (HAW) include transverse waves as well as vertical displacement components stimulated within the waveguide structure. For further clarification of Equation (9), we can rewrite Equation (9) as follows:
Among the parameters in the equation, optomechanical coupling affects Gm is , while the impact of other factors (comprising the group velocity of light, optical quality factor, energy flow of photons, and energy flow of phonons) on Gm uses parameter for description, wherein , . From the two parameters in the above expression, the overall factors are concerned with , the angular frequency, the speed of the group light wave, the energy currents of the light wave as well as the phonon wave, and the material of waveguide, for instance.
To study the suspended waveguide structure, the linear superposition of whole overlapping integrals between an individual optical force
[
19] as well as an individual m-order sound eigenmode within the process of optical–mechanical interaction is presented in Equation (11):
It is evident that the contribution of each individual overlap integral is determined by the optical force, while their relative phases are directly influenced by the interference effect. Two key points must be considered to solve Equation (9) and get the specific SBS gain coefficient in the nanometer optical waveguide: the PE effect as well as the moving boundary (MB) effect, namely
. The PE effect is the secondary response produced by acousto-optic interaction stimulated through the direction of electric field. We define the i-th part of electrostriction force as follows [
28]:
Additionally, we express the electrostriction tensor
as follows [
29]:
where,
Pijkl is the photonics tensor,
εr is the relative permittivity, while the vacuum permittivity is
. The gradient of
εr radiation pressure at the boundary is non-zero [
21]. We can deduct it from the Maxwell tensor of the two materials, and the result is as followed:
For waveguides invariant in the horizontal orientation, there is only the transverse force that contributes to the SBS gain coefficient.
3. Simulation Results
The proposed lithium niobate (LN) air-slit suspended waveguide can be fabricated using the following state-of-the-art techniques, combining thin-film LN processing and selective etching. Start with an X-cut or Z-cut LN-on-insulator (LNOI) wafer, where a single-crystal LN layer (thickness: ~215 nm) is bonded to a SiO
2/silicon substrate. Use plasma-enhanced chemical vapor deposition (PECVD) to deposit a SiO
2 hard mask atop the LN layer for patterning. Define the waveguide and air-slit structure via electron-beam lithography (EBL) or deep-UV lithography. Transfer the pattern to the SiO
2 hard mask using reactive ion etching (RIE) with CHF
3/Ar plasma. Etch the LN layer using argon (Ar
+) ion milling or inductively coupled plasma (ICP) RIE with SF
6/C
4F
8 gas to create the 2 nm air-slit. Control the slit width via timed etching or atomic layer deposition (ALD)-assisted lithography to achieve sub-5 nm precision. Remove the underlying SiO
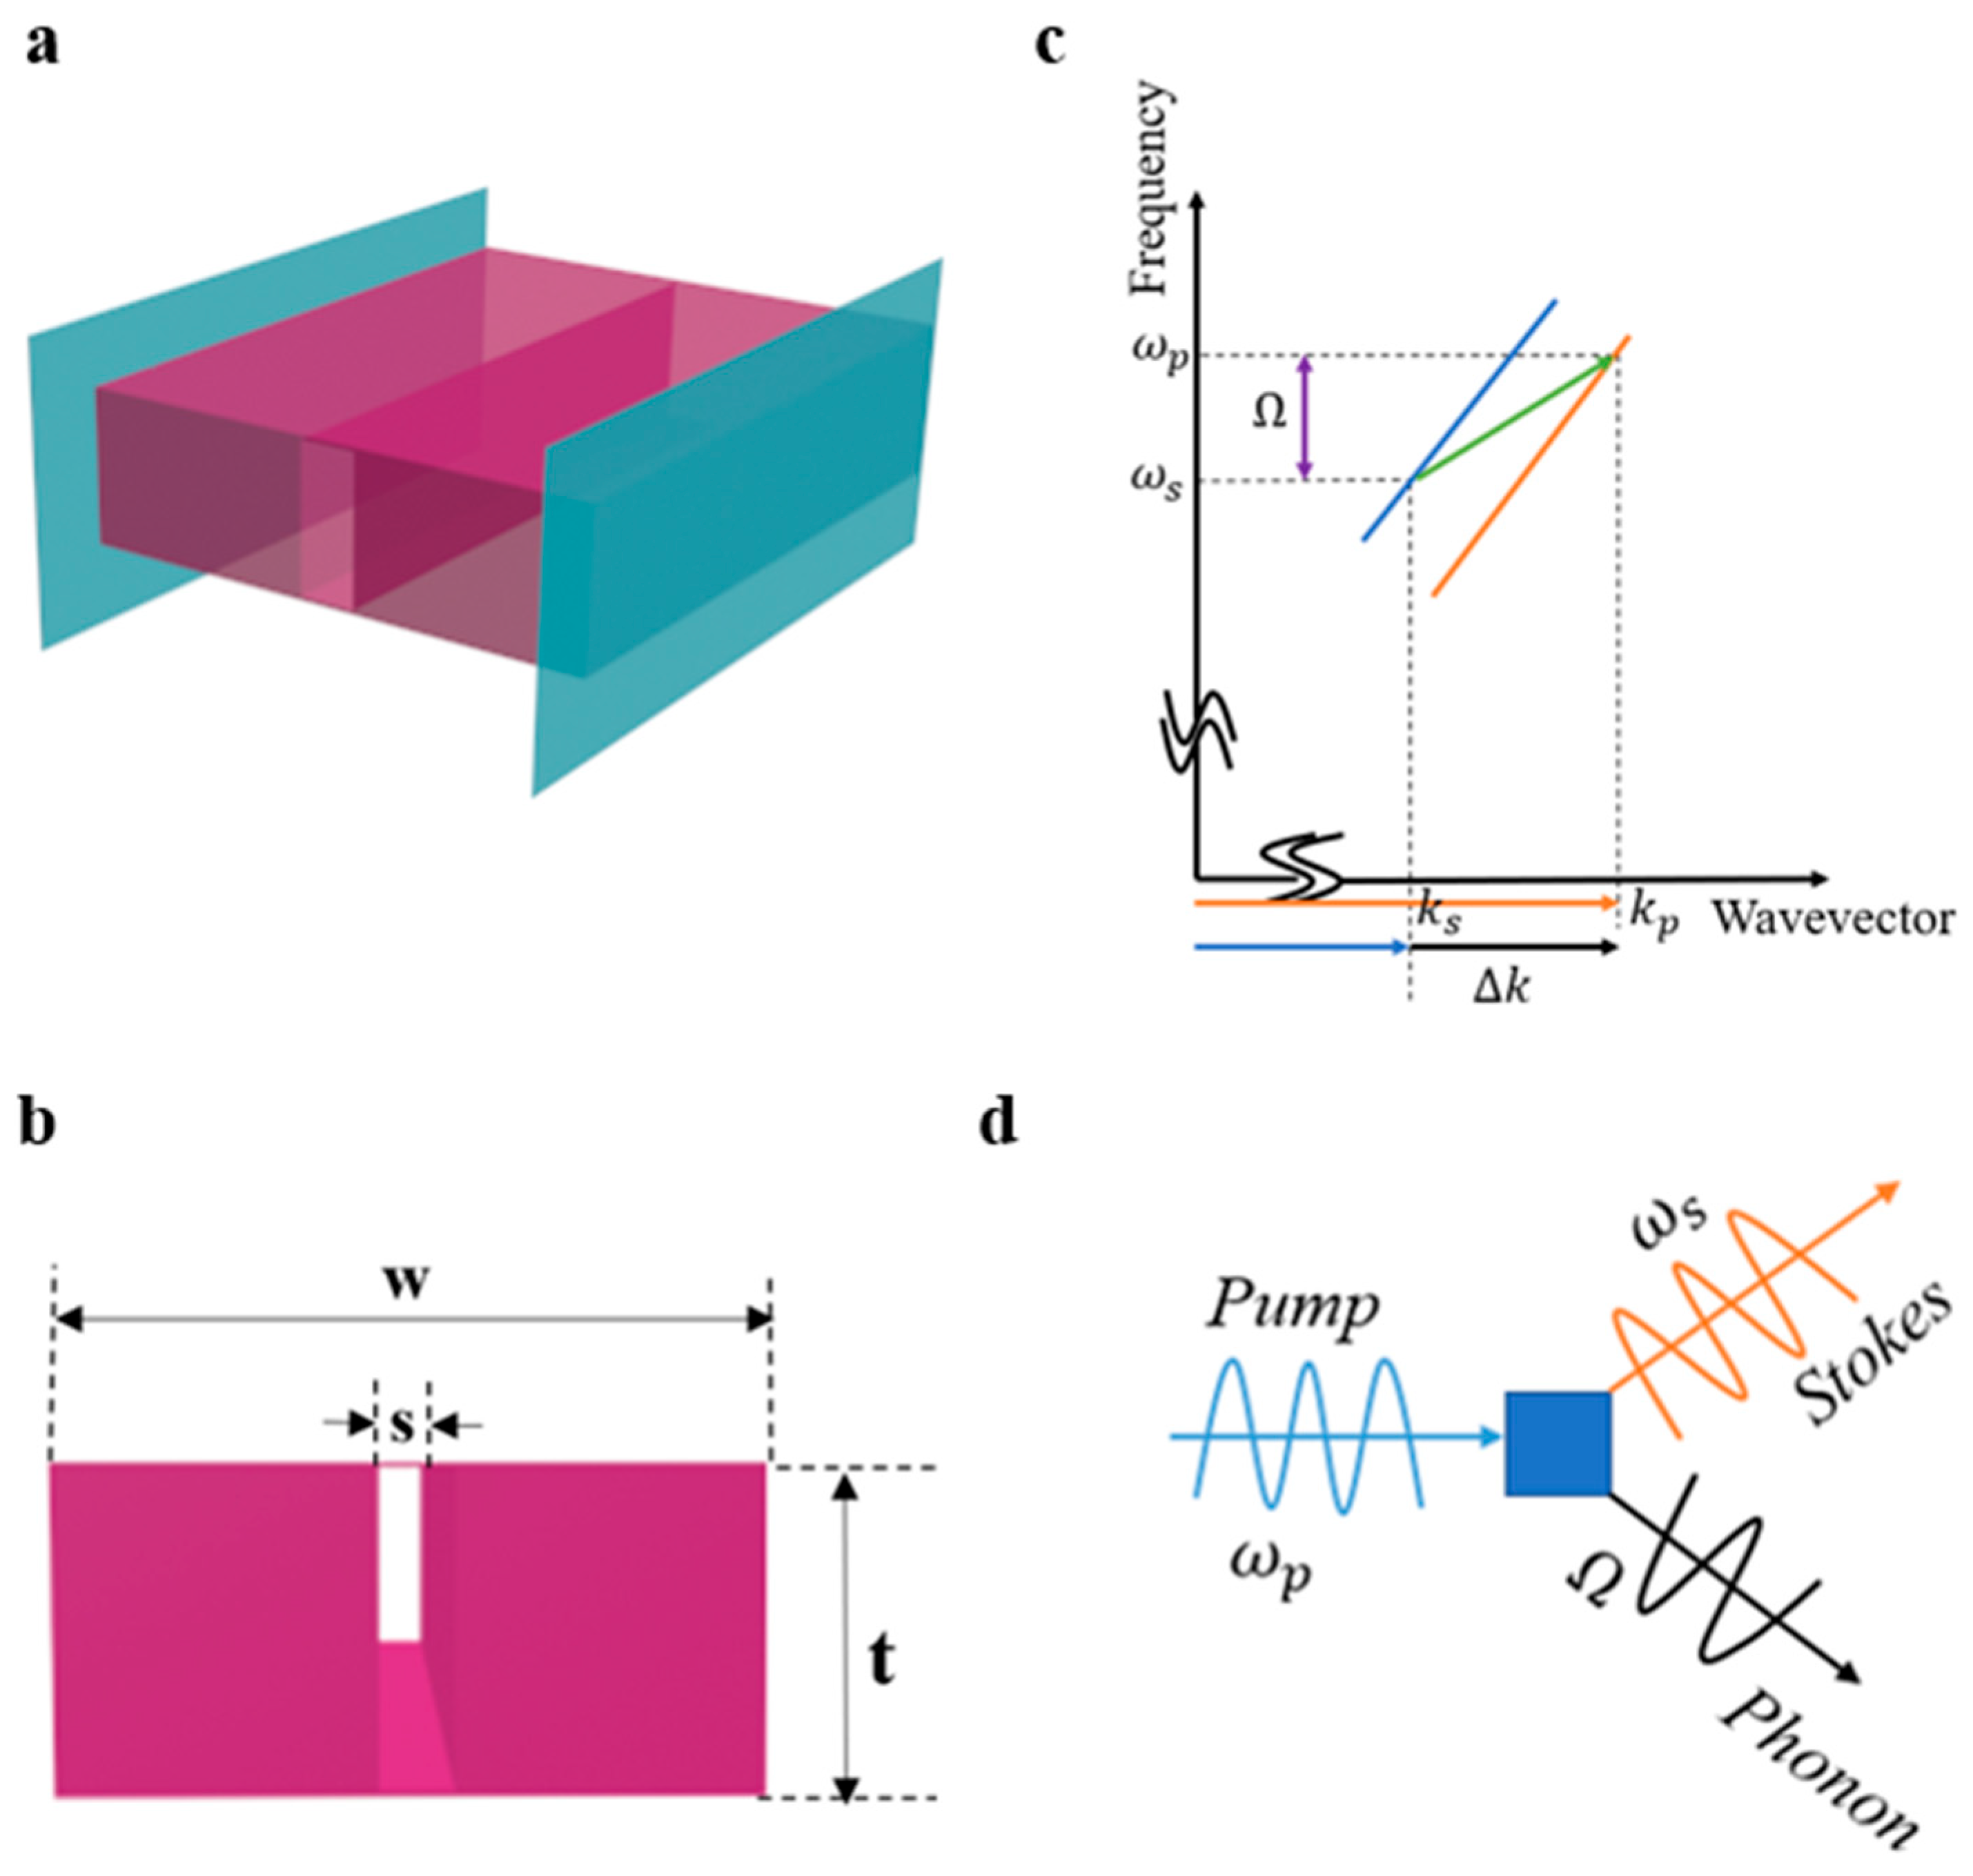
2 sacrificial layer using hydrofluoric acid (HF) vapor etching, leaving the LN waveguide suspended. Based on the formula previously obtained, we designed a floating waveguide with air-slits, using lithium niobate as the intermediate medium to realize the photon–phonon interaction.
Figure 1c presents the analysis of the impact of inter-mode FSBS [
30,
31,
32], while the structural schematic of the suspended waveguide device is depicted in
Figure 1a. Suspended structures take advantage of the high acoustic contrast of the solid–gas interface to limit the acoustic mode, thereby trapping vibrations in the solid material. Since this model is designed as a floating waveguide, it is necessary to add fixed constraints on both sides to allow it to float in the air, so this limits part of the moving boundary effect (MB effect). Therefore, we need to change part of the shape of the model to increase the generation of moving boundary effects. Therefore, we made improvements on the basis of the original model and added a 2 nm air-slit in the middle of the model, which greatly enhanced the generation of the moving boundary effect. The general process of Brillouin scattering is shown in
Figure 1d:
Take inter-mode scattering as an example to discuss. In inter-mode FSBS, there are distinct modes for pump waves and Stokes waves to get into the light waveguide. The frequency of the incident pump, the frequency of the Stokes wave, as well as the frequency of generated phonon should satisfy Equations (1) and (2). In the case of air-slits with s = 2 nm, w = 800 nm, assuming the optical quality factor Q = 1000 for simulation, the resulting electric field distribution is shown in
Figure 2a. The electric field is perfectly confined in the air crevices, generating a horizontal electric field force, so a huge FSBS gain can be produced.
Figure 2b shows a schematic diagram of the optical force distribution. Since lithium niobate
p11 = −0.027,
p12 = 0.09, and the signs of
p11 and
p12 are opposite, when the horizontal optical force pushes outward, the longitudinal optical force pushes inward. At the same time, since |
p12| > 3|
p11|, the longitudinal optical force dominates.
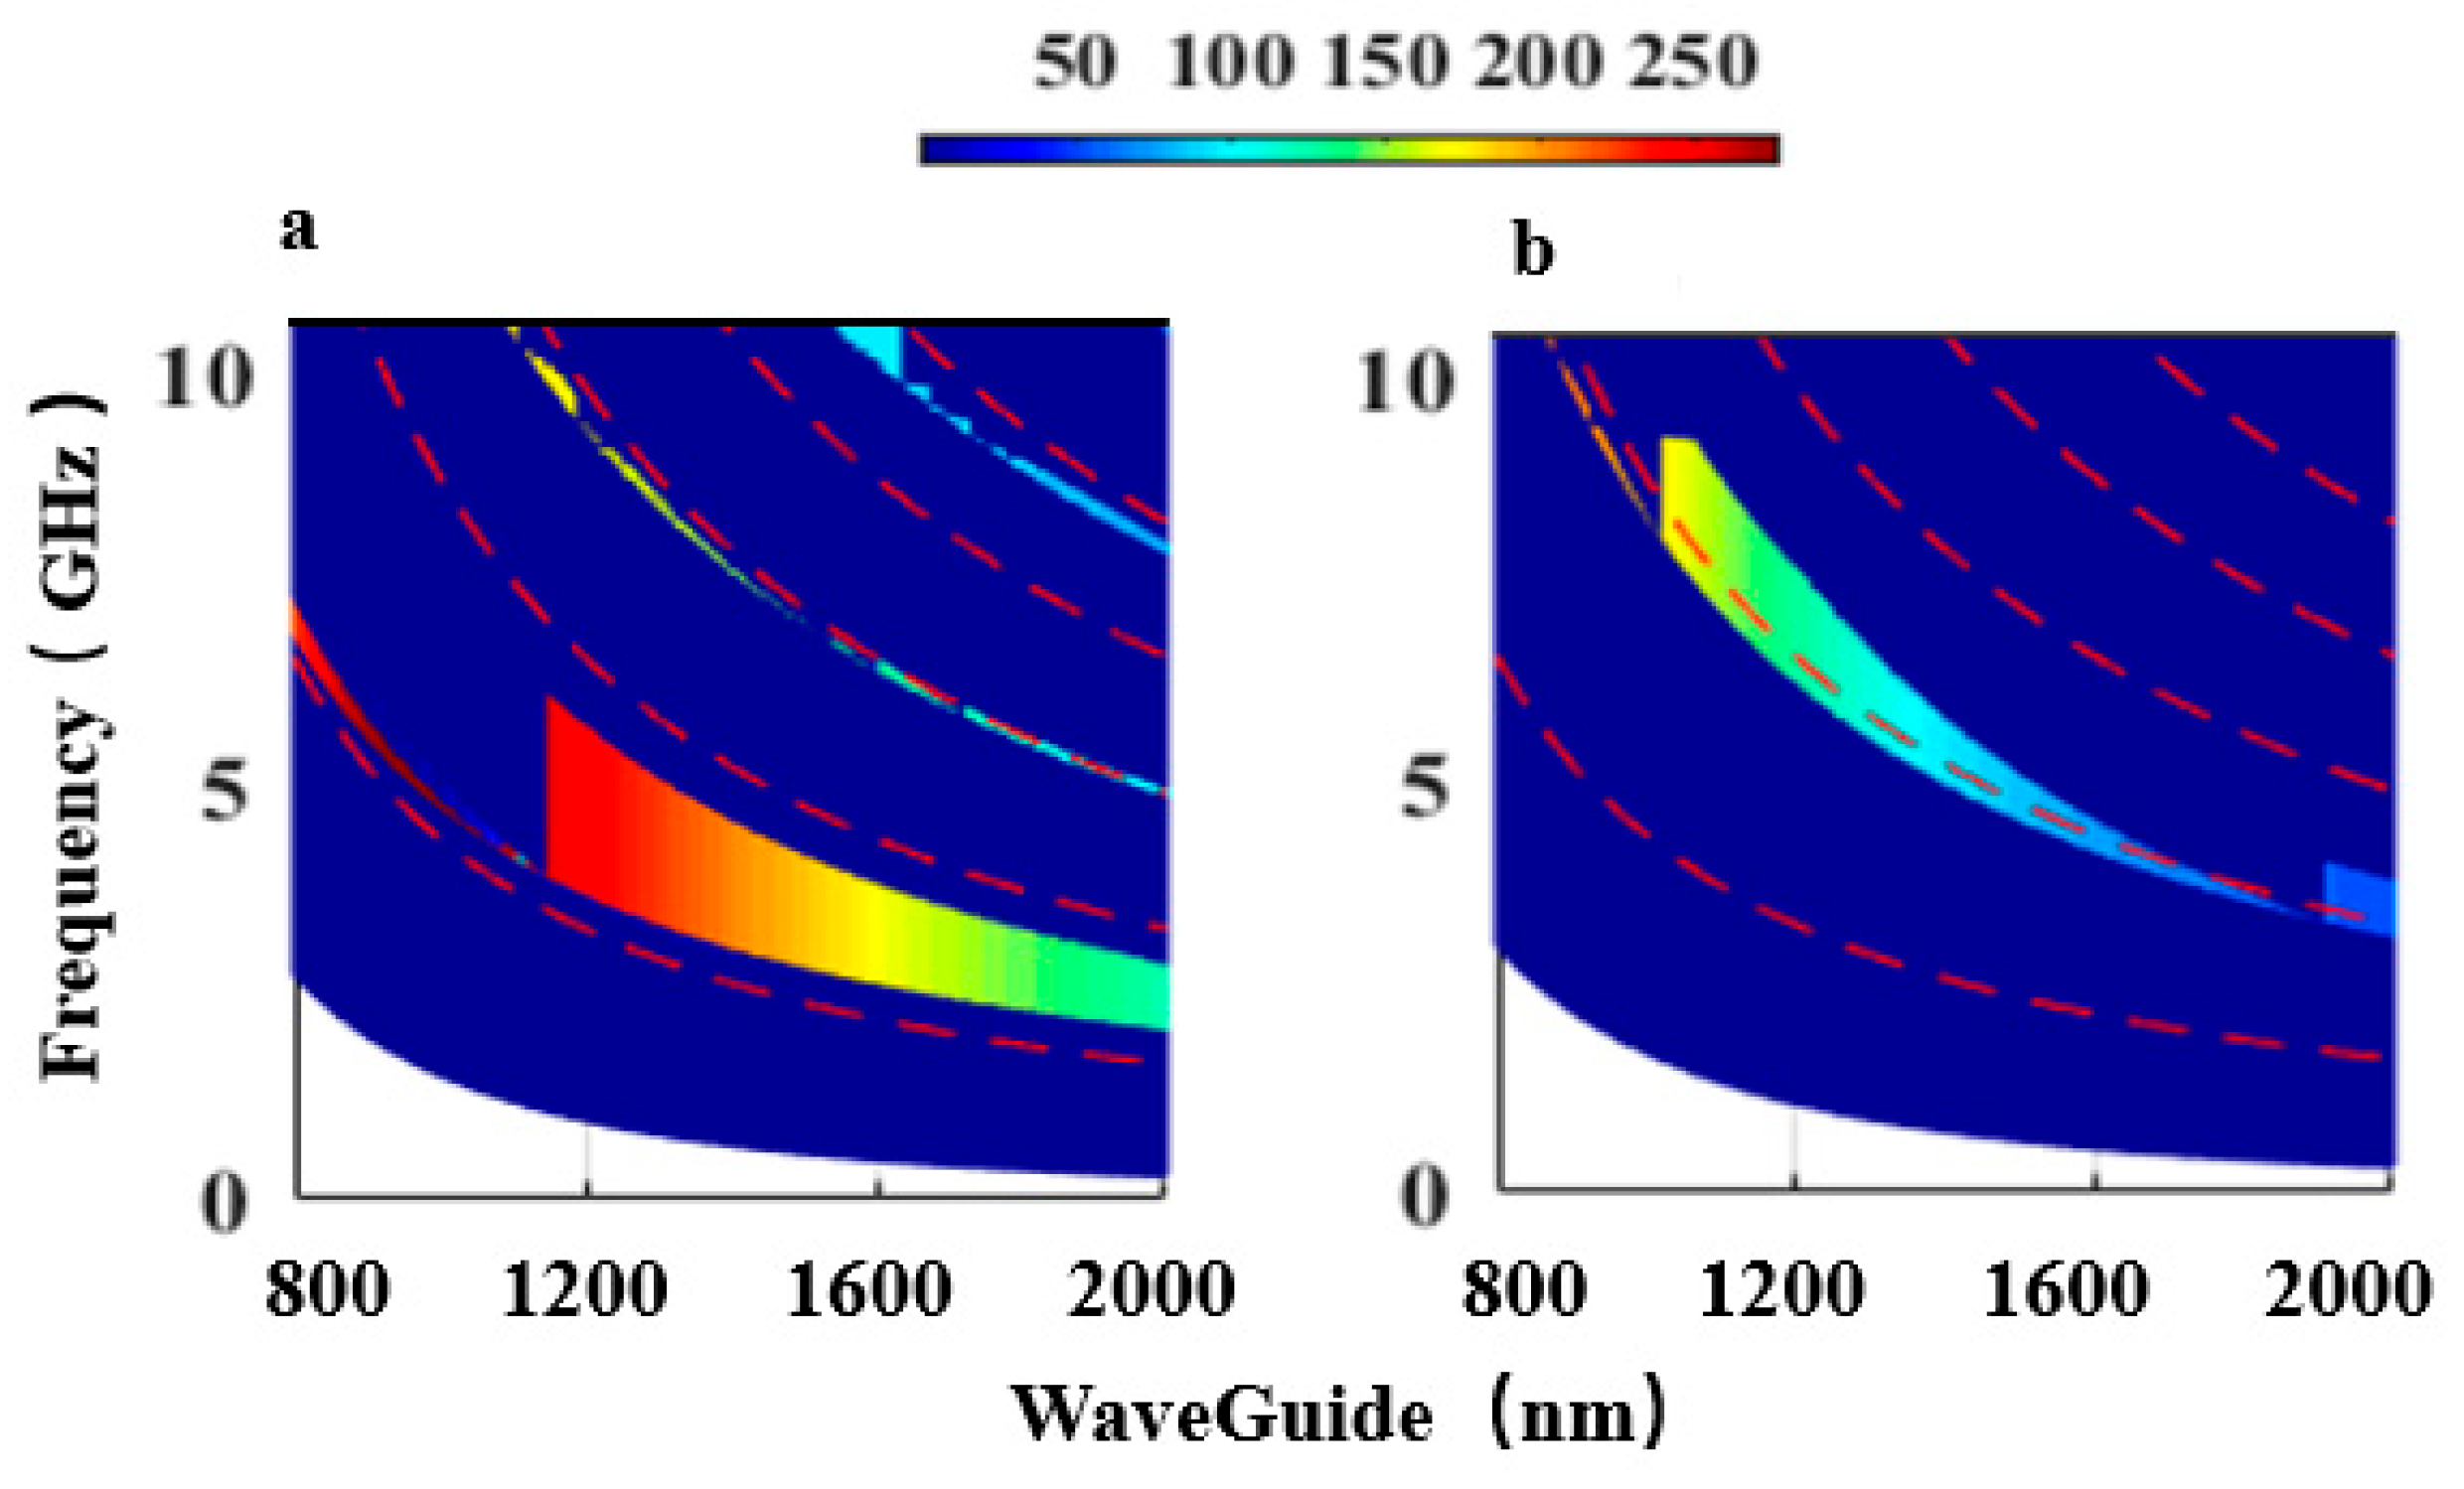
Figure 2c shows the five sonic modes (
p = 1, 2, 3, 4, 5) generated through the combined reaction of the MB effect and the PE effect when the waveguide length is 800 nm. The five modes are above the red dotted line. The reasons for this situation will be discussed later. It can be seen from
Figure 2a that the region above the red dotted line should correspond to the phonon frequency matched by the first-order acoustic mode, and a very large phase-matched coupling rate can be observed. Observing
Figure 2c and
Figure 2a at the same time, we can see that the coupling efficiency is very low in the second-order acoustic mode and the fourth-order acoustic mode. This is because in the second-order acoustic mode, moving boundary effects and photoelasticity appear. The self-cancellation of the effect results in a lower coupling rate. In the fourth-order acoustic mode, the complicated contour of the model causes the optical force distribution to be spatially mismatched; thus, the elastic mode spatially oscillates rapidly, which cancels out the overlapping integral to a great extent.
It can be seen from
Figure 3,the colored dotted lines (red, blue, purple) are the phase-matching frequency curves of the traditional waveguide, while the frequency-matching point produced by the new waveguide with air-slits lies above these matching curves. Waveguides of different sizes will produce regular Brillouin resonance. As a result of the spatially symmetric distribution of the light field, only phonons corresponding to the waveguide that have even displacement symmetry are supposed to generate valid Brillouin linkage. With variations in waveguide size, the curves in different colors in
Figure 3 depict distinct resonance features. As depicted in
Figure 3, size variations in the floating waveguide enable frequency resonance across the 1–10 GHz range and realize nonlinear tunability. According to
Figure 2b, it can be guessed that there are still frequencies above 10 GHz that can achieve resonance. Meanwhile, when the optical quality factor Q = 1000 and the waveguide width w = 800 nm, the forward Brillouin gain test is carried out, as shown in
Figure 2d. It can be seen that in the E
1 mode the Brillouin gain the gain has reached 1.31 × 10
5 W
−1 m
−1. At this time, the huge Brillouin gain is primarily attributed to the MB effect, while the PE effect generates very little gain, almost zero. It can be observed from
Figure 2c that the electric field is evenly distributed on both sides of the air-slit at this time, and its modal distribution and optical force distribution are very consistent, resulting in a huge Brillouin gain. In the E
2 optical mode, the gain at this time is zero, and we speculate that this frequency is an exception point (EP). We measured the line width here, and the measured line width here reached 2.1 GHz, which verified our conjecture. The phonon laser mode tends to be unstable when approaching the EP, where the second mode spectrum may lead to chaotic laser emission; the mode is merged and becomes completely non-orthogonal [
30]. In the high-order modes of E
3, E
4, and E
5, due to the complexity of the model structure, it cancels most of the overlapping integrals, causing the Brillouin gain to decrease.
Figure 4a illustrates the limited element analysis of the sonic–optic coupling rate varying with the degree of the waveguide. The dashed line in red depicts the frequency under different acoustic wave models, which is a function of the width of each modular-order waveguide
p. To be estimate, Ω
p = pV
l/(2w) has been utilized Among them, the sound speed in lithium niobate is V
l = 6570 m/s, and parameter
p is defined as the integer of the modular order. However, due to the existence of air-slits, this estimation method will introduce a certain error, and the obtained result will be slightly lower than the actual phonon phase-matching frequency. By observing
Figure 4b, we find that the obtained result is consistent with the prediction.
Figure 4b the picture represents the situation without air-slits. Comparing the two pictures, it can be seen that although the tunable frequency ranges of the two pictures are the same, the coupling ratio of the two pictures is far greater than that without air-slits. At the same time, in terms of gain, the gain without air-slits only reaches 12.9 W
−1 m
−1, which is 1000 times less than the gain with air-slits.
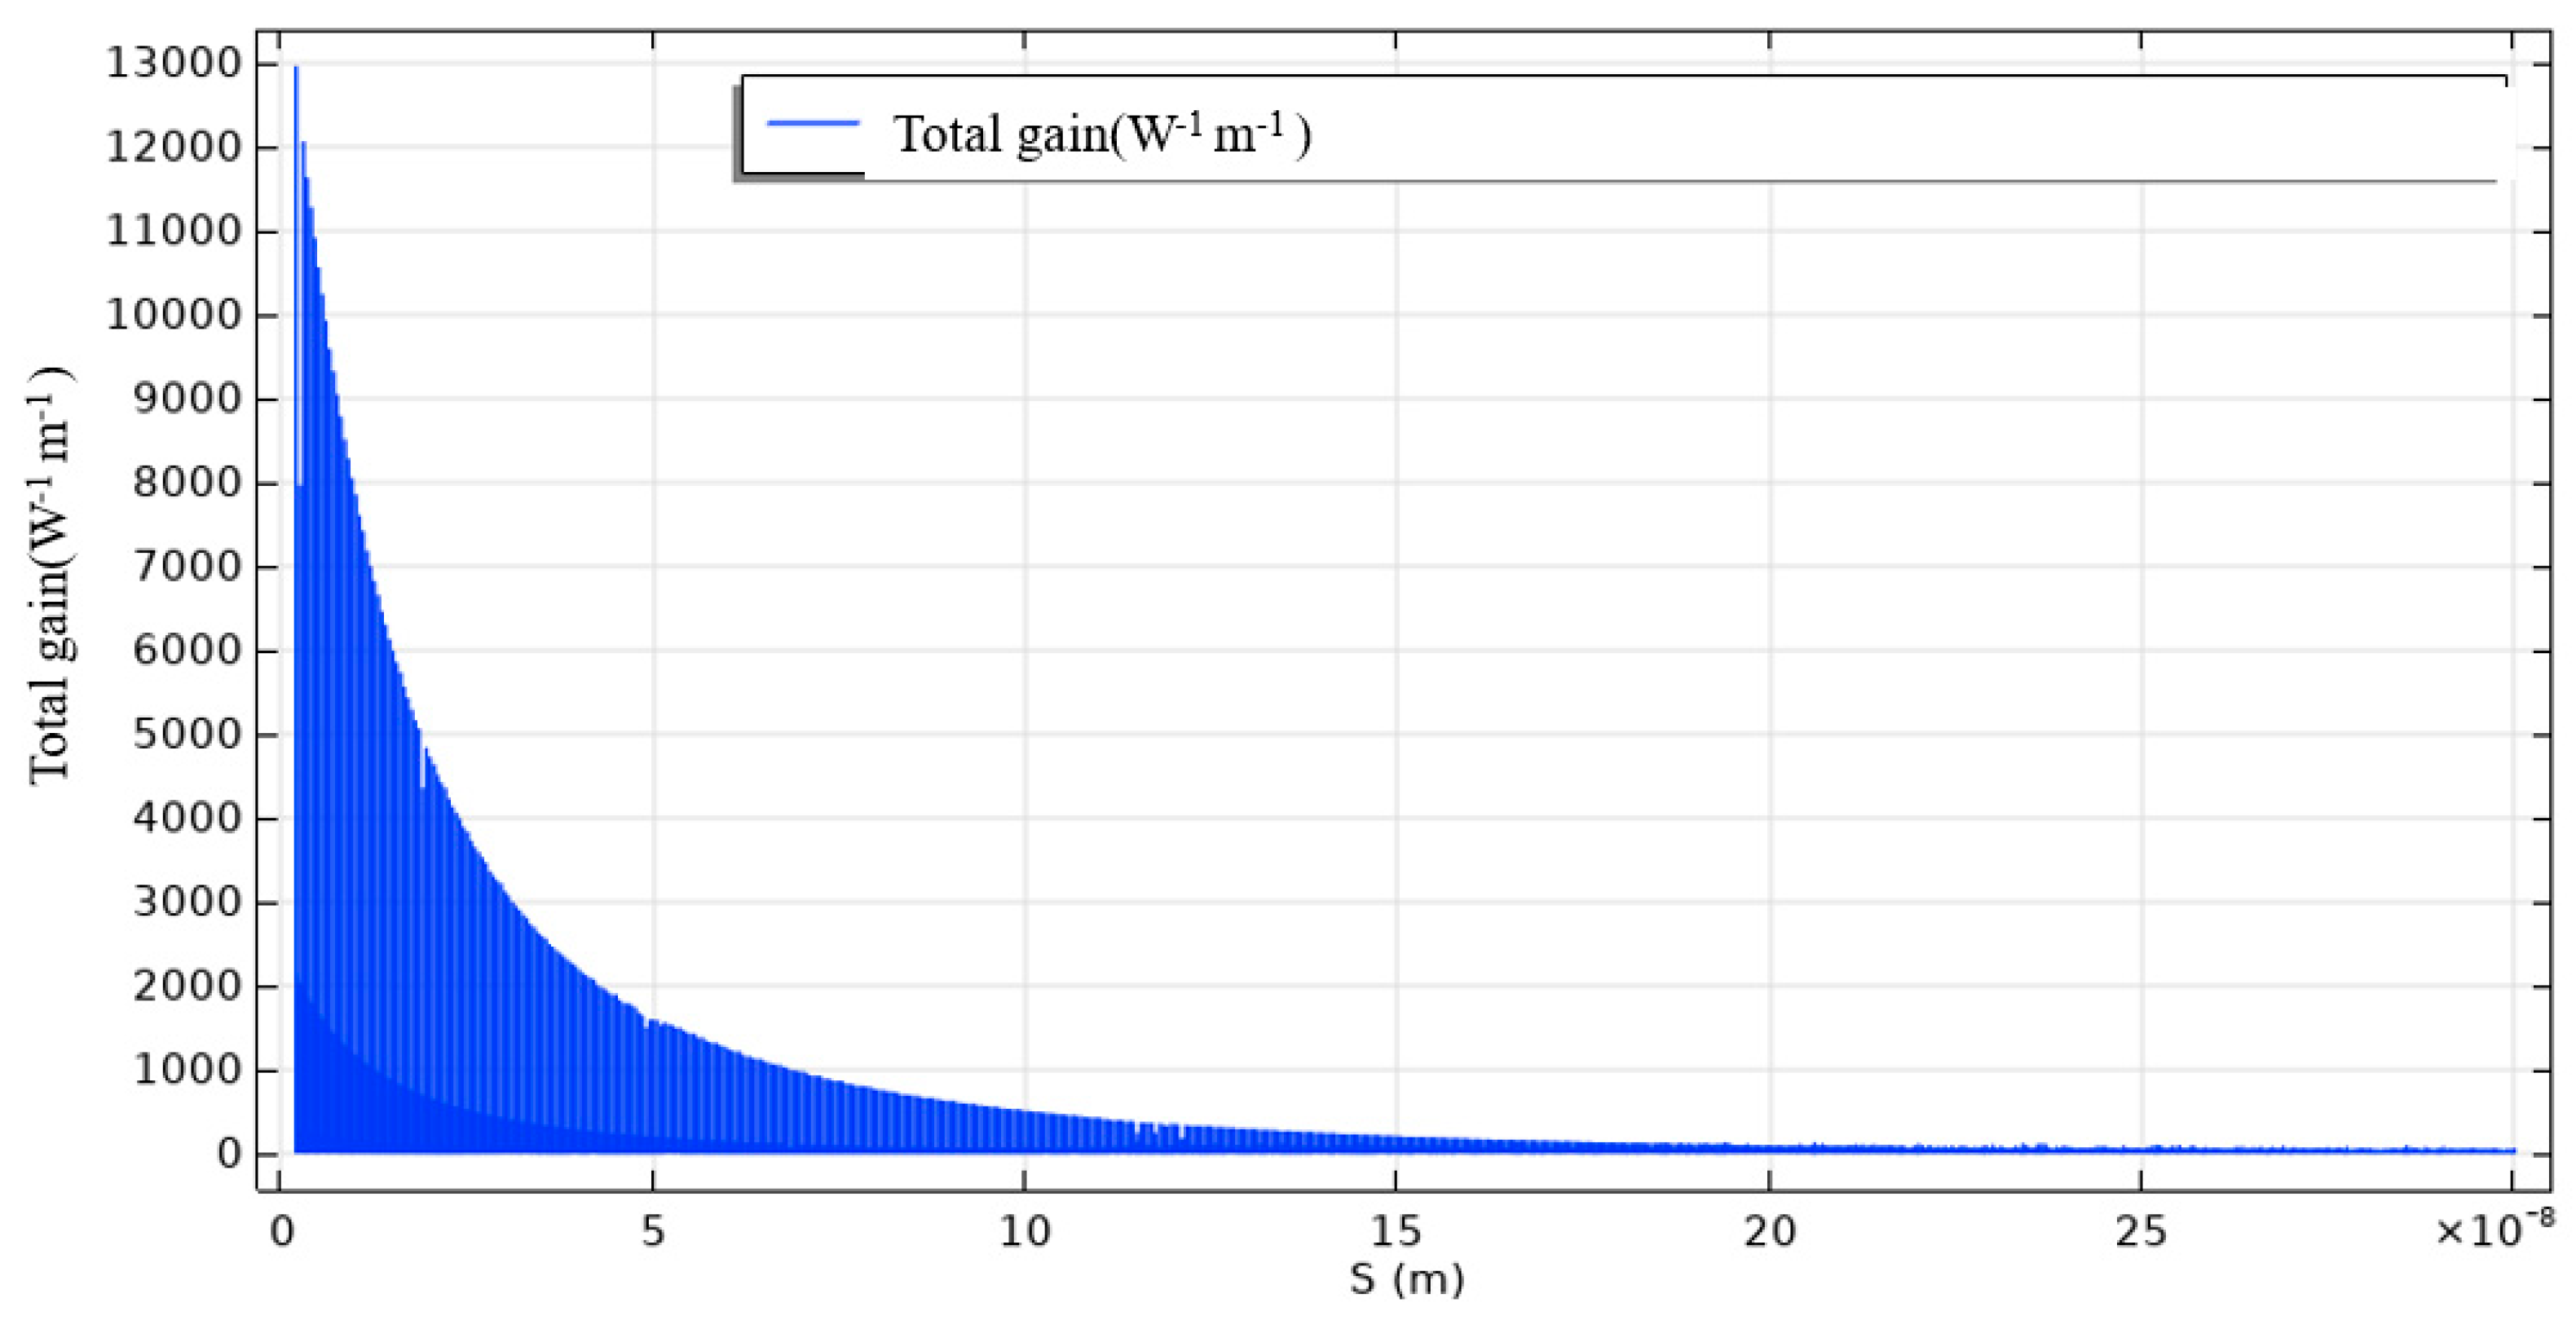
In addition, another method to achieve frequency tunability has been proposed. Due to the particularity of our design structure, the length of the air-slit affects the size of the Brillouin gain, as shown in
Figure 5. As the air-slit decreases, the Brillouin gain gradually becomes lower.
