1. Introduction
The ultrashort pulse generation technology based on the Ti:Sapphire laser was first developed in 1986 and has several architecture variations, one of which is the bow-tie configuration [
1,
2]. This laser type allows efficient and stable laser operation with high tuning and short pulse duration, making it widely regarded as one of the most versatile and reliable options for a variety of applications. At present, many of these applications are well-known in a variety of fields, from fundamental scientific research to industrial manufacturing.
There is an abundance of literature on the theoretical treatment and applications of this laser type, in which existing studies focus on dispersion compensation [
3,
4], astigmatism compensation [
5,
6], thermal effects [
7,
8], stability regions [
9,
10,
11], and cavity variations [
12,
13,
14]. However, there is a gap in the literature regarding the optimization studies applied to a cavity, as well as a lack of detailed explanations of the development process. Also, many articles have showcased stability curves and Kerr lens sensitivity curves [
15,
16,
17,
18,
19,
20,
21,
22], highlighting the theoretical discussion of decreasing the laser confocal parameter. Thus, in practice, this parameter is achieved by fixing one of the mirrors, resulting in a delicate stability region and prolonged working time. This article aims to fill this gap by presenting a compilation of optimization studies and a demonstration of the reproducible development process with the goal of enabling new technicians and researchers to implement this laser type in significantly shorter time frames.
In this review, the development of a compact benchtop cavity capable of generating ultrafast laser pulses with low pulse energy and high repetition rate is presented, utilizing a minimal number of optical elements. The fundamental principles of femtosecond lasers are first elucidated in a comprehensive and well-referenced manner. Subsequently, the analysis focuses on a simplified bow-tie configuration for Kerr lens mode-locked (KLM) operations, accompanied by correction calculations. An in-depth examination of cavity modes for both continuous-wave (CW) and mode-locked (ML) operations is provided, including the necessary correction calculations. The experimental setup is then meticulously described, with a particular emphasis on the critical details essential for cavity alignment and stabilization. This precision is paramount for achieving optimal laser performance and superior pulse quality. It is worth noting that the methodology outlined in this study extends beyond Ti:Sapphire cavities. It can be effectively adapted to replicate similar cavities with variations in specific optical elements or in the solid-state gain medium. This adaptability is particularly relevant in light of recent advancements in Kerr lens mode-locked (KLM) Yb-based diode-pumped solid-state lasers (Yb-DPSSLs) [
23].
It is possible to develop lasers with a high repetition rate of more than 1 GHz by combining a compact design with ring cavities, whose repetition rate is twice as high as linear architectures. Thus, it is possible to generate high-precision frequency combs, which are used in a range of fields, including telecommunications, spectroscopy, and metrology [
24,
25,
26]. There are also femtosecond laser applications with a high repetition rate in thin film nanomachining [
27] and there are articles that show potential in nanomedicine, nanobiotechnology and imaging [
28,
29,
30] since high repetition rates provide a low-energy pulse of about a few nanojoules.
2. Overview of Solid-State Lasers Principles
In a laser, an optical cavity houses a gain medium where a beam undergoes amplification and feedback. The gain medium’s spectral distribution depends on the type of broadening, which is characterized by a gain coefficient. Laser stability requires that, after completing a round trip in the cavity, the field reproduces geometrically in both phase and amplitude. In a simple linear cavity of length L, this translates to longitudinal modes separated by the free spectral range . For a ring resonator, the free spectral range is defined by . The modes wavelengths are determined by the linewidth of the atomic transition in the gain medium.
Laser action occurs when modes with gain exceeding losses amplify in intensity. To minimize losses in solid-state lasers, several factors must be considered: the high reflectivity of the mirrors, appropriate partial reflectivity of the output mirror, reduction in reflection in intra-cavity elements (including the gain medium), the distance between mirrors, the curvature radius of the mirrors, astigmatism compensation, and thermal lensing effects.
In continuous wave (CW) operation, numerous longitudinal modes can coexist within the cavity, each with random relative phases. These modes interfere randomly, resulting in a continuous intensity output characterized by periodicity corresponding to the cavity’s round-trip time. In contrast, mode-locking (ML) occurs when multiple longitudinal modes oscillate with well-defined phase relationships, unlike the random phases in CW operation. This phase coherence leads to constructive interference, briefly forming high-peak intensity pulses. The spacing between these pulses, , equals the free spectral range. Essentially, mode-locking concentrates electromagnetic energy, which would typically disperse over an extended duration, into exceptionally short pulses oscillating within the cavity.
There are two methods to synchronize the phases of longitudinal modes for mode-locking: active mode coupling, using an oscillating external voltage applied to an acousto-optic or electro-optic modulator, and passive mode coupling, achieved through a saturable absorber (such as a semiconductor saturable absorber mirror, SESAM) or the optical Kerr effect, where a self-focusing material is placed in an aperture, as focused on in this work.
Over time, ML lasers reach a stable state, although limiting factors such as dispersion and gain bandwidth play a role. These factors result in a stable circulating pulse within the resonator. Qualitatively, pulse formation is understood as a balance between pulse shortening due to nonlinear effects, which diminish as the pulse shortens, and the finite gain bandwidth of the active medium, which acts as a pulse-lengthening factor that intensifies as the pulse shortens. Control over factors like astigmatism, dispersion, and thermal lensing is crucial for creating the conditions necessary for generating high-peak intensity pulses, especially in mode-locking, where precise phase relationships are essential. This control ensures that mode-locking maintains its regime over time, making it more effective than continuous wave operation in certain contexts. These factors will be discussed in detail in the following sections.
2.1. Astigmatism
In ring-cavity solid-state lasers employing Brewster-angle cut and tilted gain media to minimize surface-reflection loss, an interesting phenomenon occurs. The two transverse components of the Gaussian beam, x (normal to the plane of the cavity) and y, propagate through the gain medium at different effective distances. Furthermore, due to the tilt of the cavity’s curved mirrors by an angle 2, they focus parallel rays differently in the two transverse planes. This results in distinct effective focal lengths for the x and y components, inducing astigmatism. Consequently, elliptical Gaussian beams emerge within the folded cavity.
The presence of astigmatism manifests as an elliptical beam, causing power loss during continuous-wave operation and potentially leading to challenges in pulsed mode, such as unstable modes. To rectify astigmatism, adjustments must be made to the angles of reflection for the concave mirrors. The equation governing these adjustments considers two different angles and mirrors of the same radius:
where
n is the refractive index of the crystal,
l is the length of the crystal, and
R is the radius of the two concave mirrors [
6].
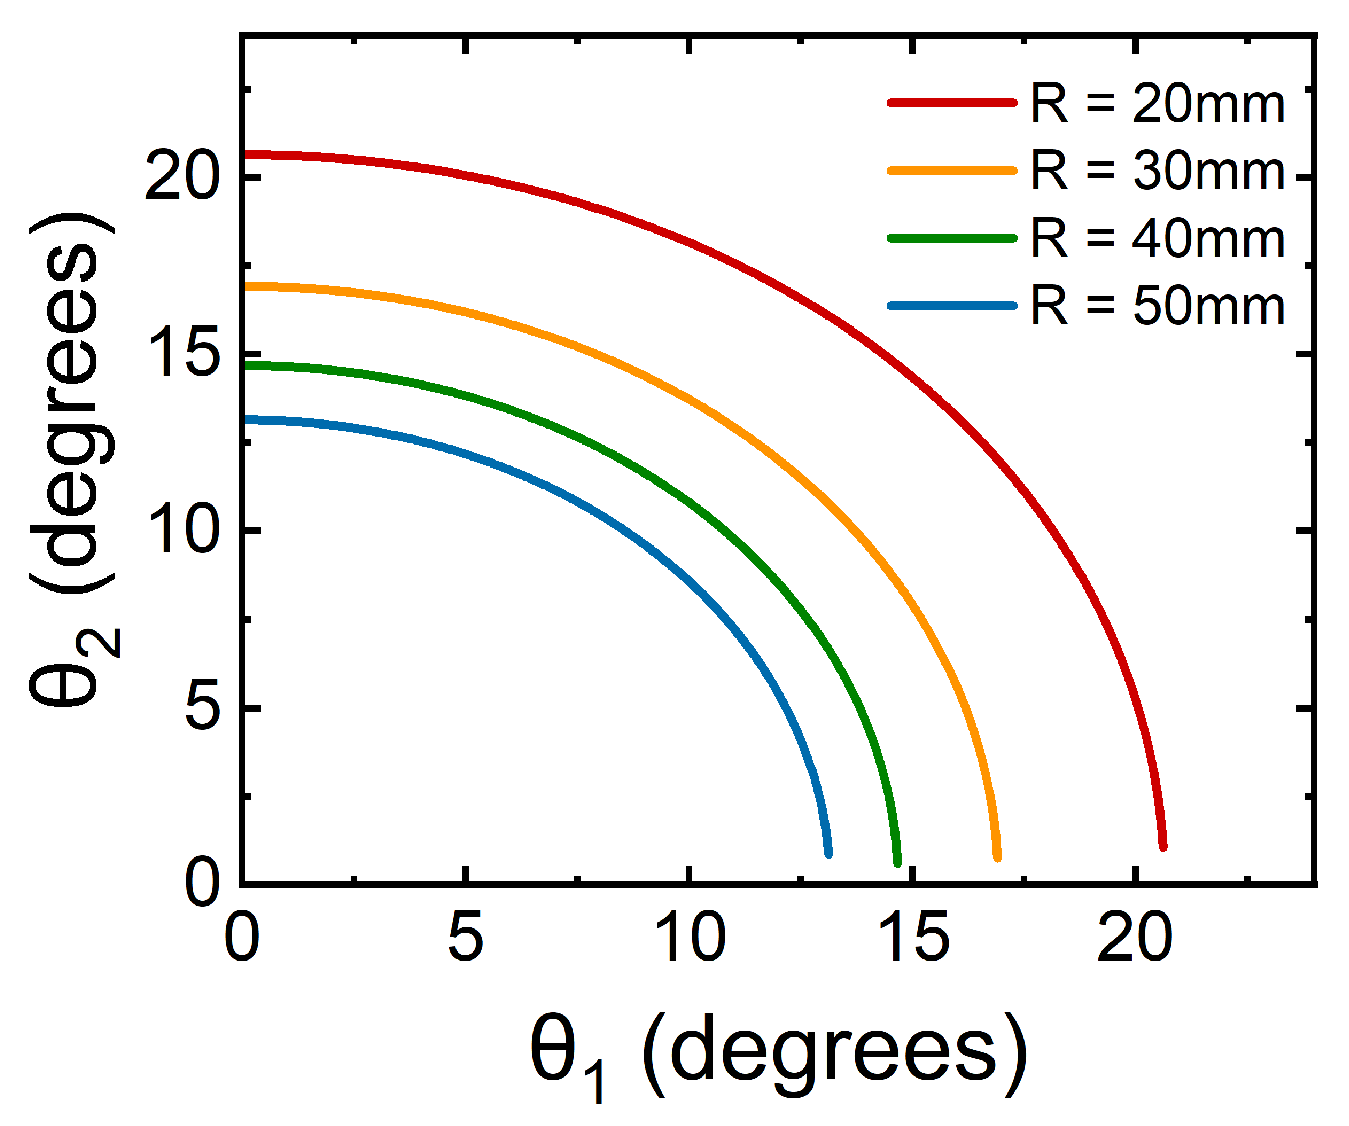
Figure 1 visually illustrates the relationship between
and
for a 3 mm Ti:Sapphire crystal, highlighting the influence of mirrors with varying radii. For a cavity with mirrors of the same radius and set at the same reflection angle, the angle can be calculated using the following approximation [
5]:
2.2. Dispersion
Dispersion is a fundamental phenomenon that describes the dependence of a wave’s velocity on its frequency or wavelength. When light traverses through a transparent material’s lattice structure, it interacts with its particles, experiencing absorption and re-emission, thus delaying its propagation. The Kramers–Kronig relations illustrate the intertwined nature of the absorption interactions and the propagating wave speed, introducing the complex refractive index. In this context, the real part represents the material’s refractive index (related to the speed of light propagation), and the imaginary part represents the material’s extinction coefficient (related to absorption).
As a pulse propagates through a dispersive material, it can experience spectral phase distortion. In practice, analyzing the spectral phase is often preferred over the temporal phase, as it allows for steady-state analysis. Consequently, the study and characterization of pulses are typically conducted in the spectral domain, facilitating a more straightforward understanding of their behavior. This can be described by expanding the spectral phase
in a Taylor series around the center frequency
. The zero-order term represents the absolute phase, the first-order term is referred to as the group delay (GD), and the second-order term corresponds to the group-delay dispersion (GDD). Typically, only a few expansion terms suffice to characterize well-behaved pulses, while more complex pulses may require an increased number of terms. The GDD measures the group delay of each different pulse frequency
, often referred to as chirp. Ultrashort pulses exhibit a broadband spectrum, making this effect significant and introducing phase distortion that increases their duration [
31]. This temporal broadening arises from the different dispersion experienced by different frequencies, as the GDD of the material is given by the following:
where
is the optical path in the cavity of wavelength
. It is important to acknowledge that optical components within a cavity can introduce positive dispersion into the system. In some cases, the pulse broadening by a material can also be measured in GDD per millimeter, termed group velocity dispersion (GVD). The GDD and GVD of a material can be measured using techniques like Frequency-Resolved Optical Gating (FROG) with a known femtosecond pulse.
Maintaining a stable pulse within the optical cavity is crucial, so this dispersive effect must be corrected. To counteract this effect, it becomes necessary to introduce negative dispersion within the cavity. This requirement is typically fulfilled by employing pairs of prisms, diffraction gratings, or specialized dispersion compensation mirrors. These optical elements effectively counterbalance the positive dispersion imposed by other components, thus ensuring the desired pulse properties and overall system performance.
2.3. Thermal Lensing
High intensities significantly increase the crystal temperature, leading to a thermal lens effect—a phenomenon where variations in temperature or stress alter the refractive index. This thermal lensing substantially affects the crystal’s focal length, which in turn, disrupts the alignment of the optical cavity. Furthermore, elevated crystal temperatures can drive the system beyond its optimal operational range, thereby reducing efficiency [
8]. In the case of ultrashort pulse lasers, the high intracavity laser intensities impose pronounced thermal effects, even exceeding those caused by the pump, which can critically influence laser performance. Insufficient temperature control may result in diminished performance, failure to achieve the desired operational regime, or even permanent damage to the crystal rod. Understanding the impact of thermal lensing on crystals such as Ti:Sapphire requires comprehensive modeling approaches. Various methods exist to model thermal lensing, including those that account for temperature-dependent thermal conductivity and anisotropies [
8,
32,
33,
34]. Advanced models tailored for high-power amplified systems are also available [
35]. Additionally, experimental techniques have been developed to measure and mitigate thermal effects in Brewster-cut Ti:Sapphire crystals, enabling the suppression of thermal lensing in high-repetition-rate laser systems and the correction of wavefront aberrations for ultrahigh-intensity and metrology applications [
36].
To overcome these challenges and ensure stable laser operation, effective thermal management strategies are essential. These strategies often involve the implementation of advanced cooling systems to regulate the temperature of the crystal and maintain it within optimal operating parameters. In the cases discussed here, where ultrashort pulse oscillators are pumped within the range of 1 to 10 W, temperature control measures are effective in mitigating thermal effects, ensuring they remain negligible and maintaining the system’s performance and integrity. For scenarios involving high-power pump lasers exceeding 10 W, it is crucial to incorporate thermal lens effect modeling into the oscillator design, utilizing the models referenced above.
The cooling mechanisms employed in most solid-state lasers primarily involve liquid cooling systems. These systems effectively manage the thermal energy generated during laser operation. In the case of larger lasers, the excess heat is typically dissipated through two main methods: liquid-to-air heat exchange, where the heat is released into the surrounding air, or liquid-to-liquid heat exchange, where the waste heat is transferred to an external cooling loop [
8]. However, for smaller-scale lasers, a different approach is often taken. Here, the thermal energy generated by the pump source and the laser medium is efficiently removed through conduction and subsequently dissipated into the environment via forced air cooling.
In specific laser configurations, the active medium is directly affixed to a heat sink to ensure effective conduction cooling. To achieve optimal thermal conduction, it is imperative to establish intimate thermal contact between the laser medium and the heat sink. This can be accomplished through various means such as mechanical clamping, soldering, or bonding of the laser rod to the heat sink. In instances where mechanical clamping is employed, it is important to note that a temperature gradient may develop across the interface between the laser rod and the clamp. To mitigate this issue, a thin layer of indium foil is often applied between the laser crystal and the copper heat sink. However, for smaller crystals, typically those less than 10 mm in size, the use of an indium layer is generally unnecessary and may even pose risks during mounting and alignment procedures, potentially resulting in the inadvertent melting of the indium layer and damage to the crystal.
3. Bow-Tie Cavity Design
Analyzing the geometric stability conditions of a resonant cavity holds paramount importance, particularly in the context of laser systems where precise beam control is essential. These conditions are crucial for ensuring the laser operation and desired beam characteristics within the cavity, especially when aiming to model and maintain a small beam spot size. The geometric stability ensures that the laser beam retains its quality and characteristics, allows the modes control, and improves the efficiency of optical components, minimizing losses due to misalignment or other aberrations and maximizing the laser’s output power and energy.
An indispensable tool for evaluating and optimizing the geometric stability of a resonant cavity is the Ray Transfer Matrix method. This method provides a comprehensive framework for assessing laser beam propagation through various optical elements within the cavity using ABCD matrices. In this approach, one of the beam waists traverses beneath the crystal, while the other passes between the flat mirrors, as shown in Equation (
4). It is particularly valuable for analyzing non-orthogonal optical systems, allowing for a detailed examination of beam behavior in both the sagittal and tangential planes.
The analysis of the bow-tie design cavity involves a model employing two curved mirrors, functioning as lenses, and two flat mirrors, shown in
Figure 2. To scrutinize this ring cavity effectively, it can be conceptualized as a periodic linear lens sequence [
37]. This cavity commences at the location between the planar mirrors, undergoes focusing at the crystal, and eventually returns to the same initial position in a repetitive linear manner, conforming to boundary conditions that maintain its original spot, as illustrated in
Figure 3. This condition indicates periodic refocusing of the original beam.
For the fundamental Gaussian mode (
), the approximate solution of the wave equation of the beams leads to an essential relationship involving the complex parameter
, which describes the Gaussian variation of beam intensity along the optical axis and the curvature of the phase front, as well as
, a real parameter that characterizes the curvature of the wavefront intersecting the axis at position
z, and
, representing the spot size or beam radius:
In this context, the evolution of a Gaussian beam through an optical system can be assessed using the ABCD law [
39]:
Through the ABCD Law, it is possible to derive the results for the radius of curvature of the wavefront and the beam radius, denoted as
R and
w, respectively, as functions of the system matrix coefficients:
In the evaluation of a sequence of ABCD matrices, the stability of periodic sequences must satisfy the inequality
, as derived from Sylvester’s theorem for the beam radius equation [
22]. These ABCD matrices represent various optical elements such as free space between components, the curvature of mirrors, and the length of crystals. By evaluating these matrices, the conditions for the existence and stability of the beam radius are determined.
For instance, consider a cavity with two curved mirrors having a radius
30 mm and a 3 mm-thick Ti:Sapphire crystal. For a 1.0 GHz cavity, the allowable distance between the curved mirrors ranges from 3.13 mm to 3.16 mm. For a 500 MHz cavity, the distance ranges from 3.13 mm to 3.30 mm, and for a 100 MHz cavity, it ranges from 3.13 mm to 3.51 mm, as illustrated in
Figure 4.
This analysis ensures the beam remains stable within the cavity, meeting the required stability criteria for different parameters. This allows for the evaluation of how various parameters influence the production of a laser beam. For example, it enables the determination of the appropriate radius of curvature for mirrors relative to the cavity length and the optimal positioning of mirrors within the cavity mounting. By assessing these factors, one can optimize the design and alignment of optical components to achieve the desired beam properties and stable cavity operation.
4. Experimental Setup
The optical components used in the laser cavity are a Ti:Sapphire crystal as a gain medium, a focus lens (L1) with a focal length
f = 50 mm for focusing the beam on the crystal, two concave dispersive mirrors M1 and M2 of radius
R = 30 mm, a plane dispersive mirror (P1) and a flat output mirror (OC), with 98% reflection for 660–920 nm, arranged in a ring shape shown in the
Figure 7.
Figure 8 presents the assembled bow-tie cavity, demonstrating the integration of components. The 3 mm thick crystal, shown in
Figure 9, used in this laser system has the linear index of refraction
= 1.772 for 532 nm and
for 800 nm and exhibits an absorption in the blue-green spectrum with a maximum at 500 nm and an emission in the near-infrared range with a maximum at 800 nm, with the spectrum measured in
Figure 10. The crystal is cut at the Brewster angle forming an angle of 60.4° between the pumping incidence surface and the side. The pump used is a frequency-doubled Nd:YAG laser with emission at 532 nm. For the spherical mirrors and crystal used in the system, the astigmatism compensation angle is approximately
= 24°.
The crystal is precisely cut at the Brewster angle to optimize the transmission of the linearly polarized pump beam. This configuration ensures that the pump beam, prior to entering the cavity, traverses two mirrors to align its path with the optical table, followed by its passage through polarizers. The goal is to enhance transmission through the crystal while minimizing unwanted reflections. For meticulous adjustments, a power meter is employed to measure the power of the reflected pump beam, enabling precise calibration of the polarizer to achieve the lowest power output.
In order to mitigate the positive GDD exhibited by the crystal, which averages at +180
, Dispersion-Compensating Mirrors (DCMs) were employed, which are multilayer structures designed to provide a larger delay for longer wavelengths, enabling the generation of laser pulses with minimal distortion. The DCMs are characterized by a GDD of −70 (±30)
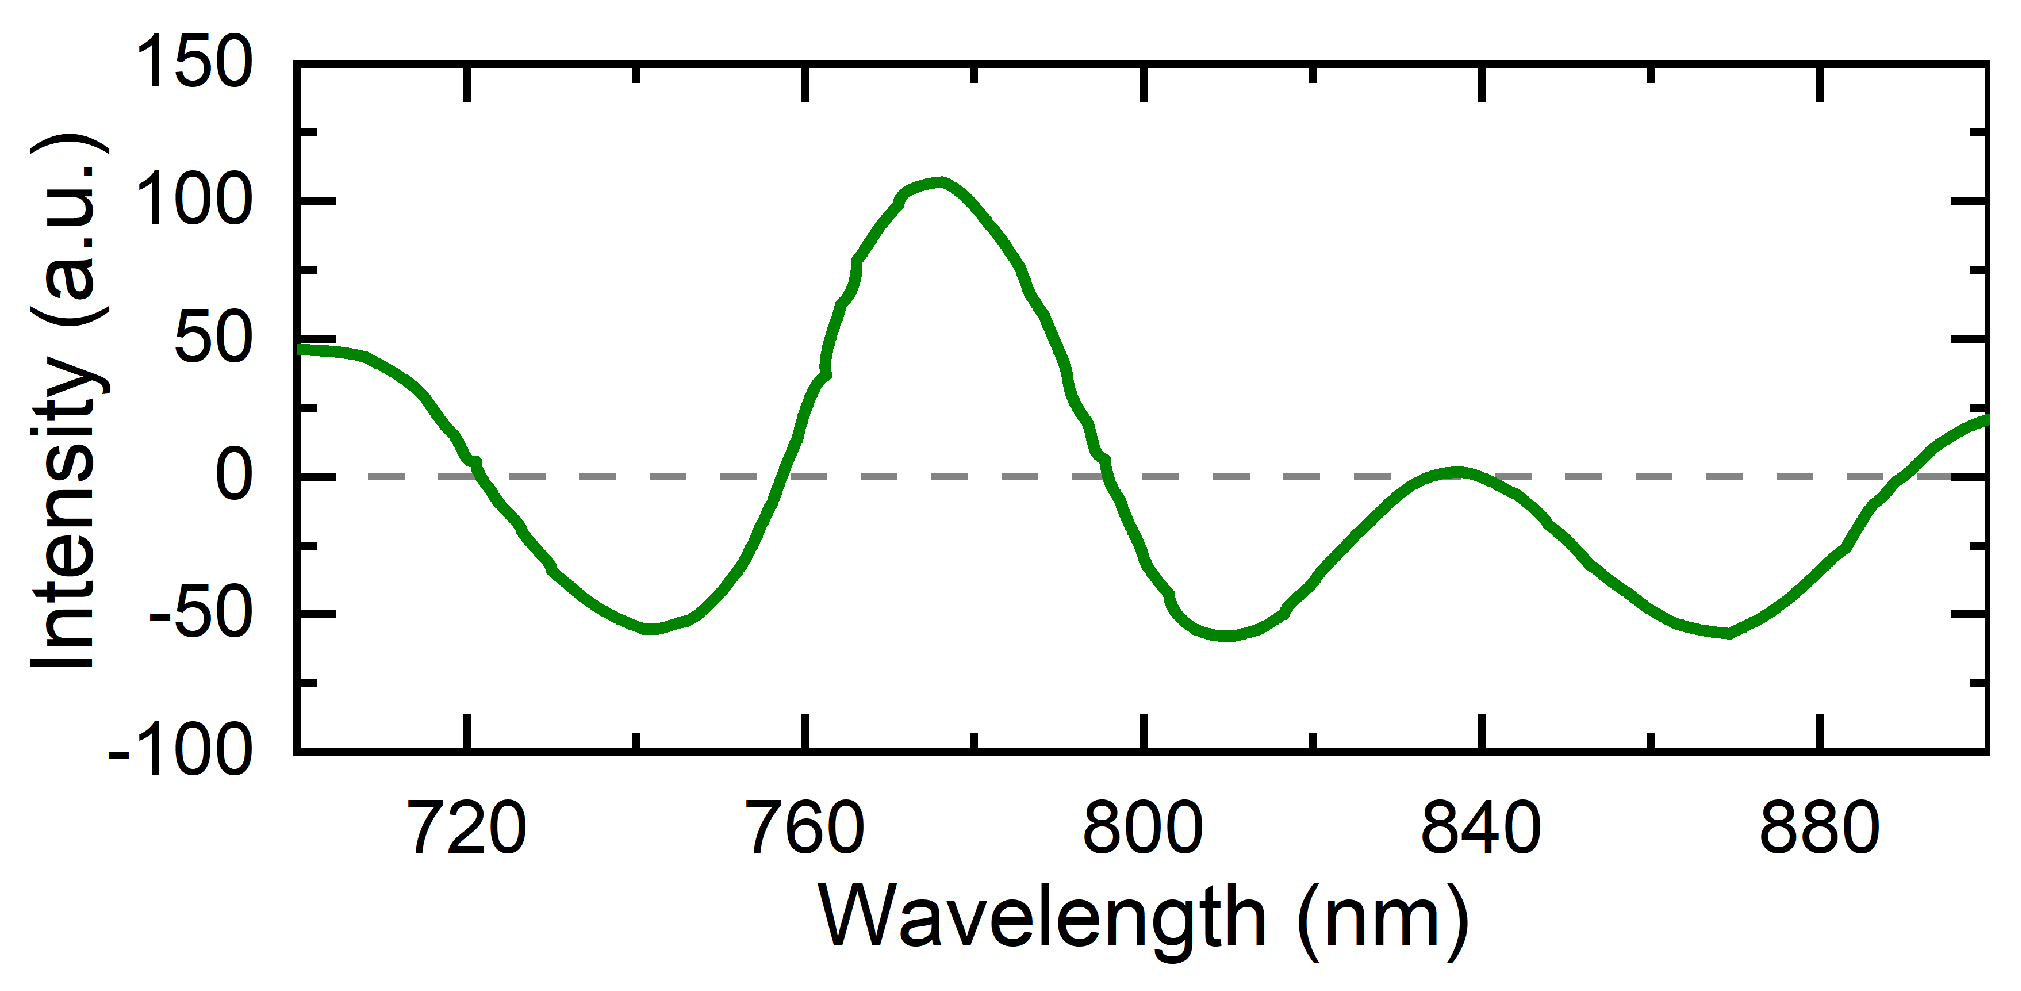
, marked by substantial oscillations across various wavelengths. White-light interferometry (depicted in
Figure 11) validates the presence of significant GDD variations. Using mirror pairs with intentionally designed opposing oscillations, the resulting combined GDD exhibits a smooth spectral profile, effectively rectifying any oscillatory behavior [
3,
11]. The results demonstrate the absence of significant dispersion issues or tuning difficulties in achieving the modelocked regime. DCMs effectively provide compensation [
24,
25] without requiring an increase in the number of optical elements or the size of the cavity.
To mitigate the impact of thermal effects, cooling systems can be affixed to support the crystal. The crystal was securely clamped to a copper plate, as depicted in
Figure 9. A conduction cooling strategy was implemented by employing a Peltier thermoelectric cooling module coupled with an air-cooled heatsink. This arrangement effectively ensured a thermally stable operating temperature range for the crystal, maintaining temperatures within the 18 °C to 28 °C range while minimizing temperature fluctuations to less than 2 °C [
40]. This temperature stability, in turn, resulted in a consistent laser efficiency over time, as depicted in
Figure 12.
As an option, a PZT ceramic can induce the modelock regime by attaching it to the P1 mirror. Control electronics can be developed that allow the repetition rate to be stabilized in relation to an internal generator, with a fine-tuning of up to 30 kHz with input for an external oscillator. This setup also allows wavelength tuning in the 770 nm to 810 nm range [
24,
41].
5. Laser Fine-Tuning for Optimal Performance
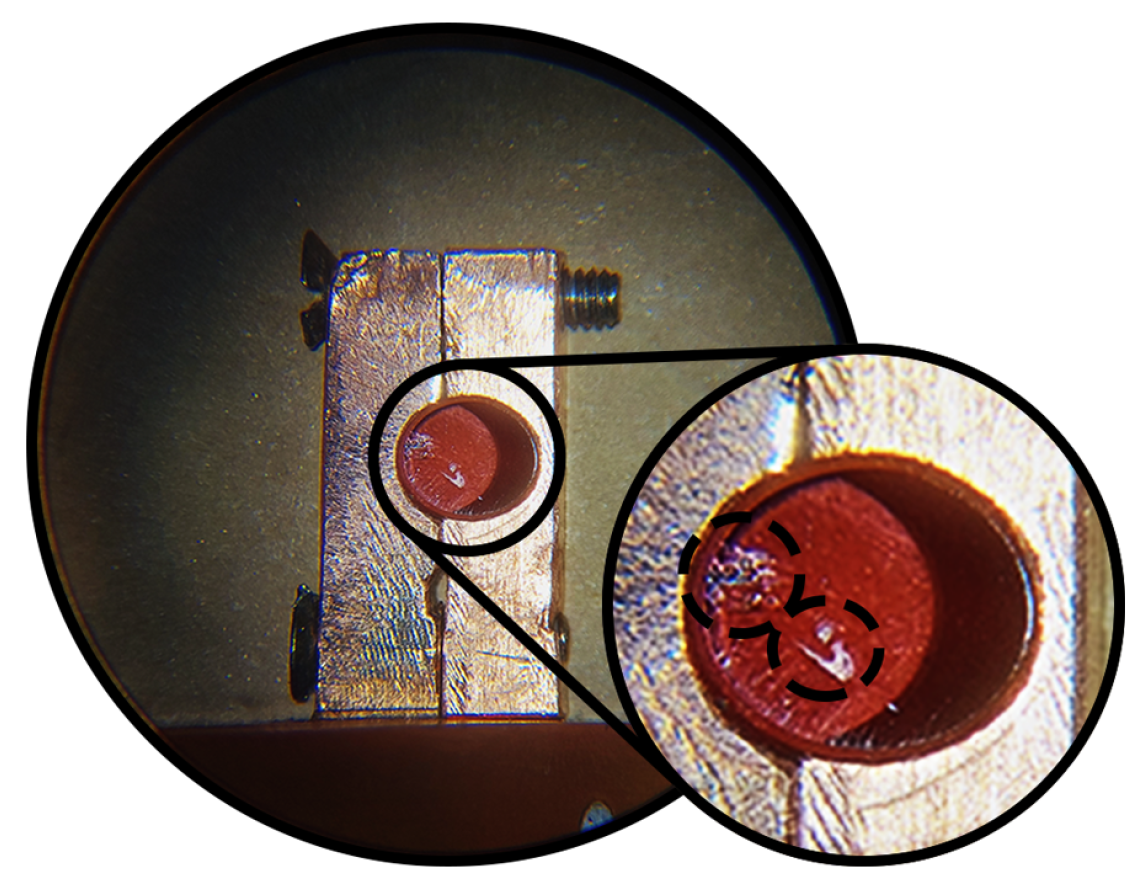
To ensure optimal performance, the optical components were evaluated for cleanliness and surface grooves prior to assembly, following the manufacturer’s recommended cleaning procedures when available. Maintenance and cleaning of the laser system are of paramount importance, especially during the mode-locking operation. In the mode-locking operation, the laser system becomes significantly more sensitive to contaminants and dirt compared to the CW operation. Therefore, meticulous attention is required when aligning the components and ensuring that the cavity remains isolated from contamination and dirt. Utilizing indium in small crystals, as discussed earlier, may result in crystal damage due to overheating, as illustrated in
Figure 13. For crystal defects or grooves, polishing was performed using Diamond Lapping Film (0.1–10 μm). For plane mirrors that exhibit grooves, the scratched regions are avoided for laser incidence. No scratched spherical mirrors and scratched lenses were used to ensure accurate reflection and propagation without scattering. Component cleaning procedures were performed by blowing the surface with a pure duster or using appropriate lens cleaning wipes with solvents such as acetone, methanol or isopropanol.
All optical components must be at the same height as the pumping beam. Slits or rulers can serve as references for this purpose. The pump and intracavity laser need to be centered on spherical mirrors and lenses to avoid aberrations, whereas flat mirrors do not require precise centering. The height of the pumping beam was standardized at h = 120 mm.
The initial alignment is essential to ensure that the laser beam is at the same height as the optical table, without any bending. This alignment is crucial for the correct and optimal execution of subsequent steps. To achieve coplanarity, it is recommended to utilize a pair of circular precision pinholes placed at the designated height along the beam path. Each optical component should be aligned by positioning it in such a way that the beam passes through the center of the two pinholes. By maintaining consistent heights for the pump beam, intracavity beam, and output beams throughout the entire cavity, there will be no need for vertical realignment, except for minor adjustments that may be required.
Initially, the optical components were mounted on translation stages to allow precise positional adjustments. The curved mirrors and the crystal were positioned at distances near the laser stability parameters obtained through prior analyses, with angles set according to the calculated optimal values, serving as initial guides for assembly. During the assembly and alignment process, distances between the mirrors and the crystal were measured using a digital caliper with the pump turned off. Care was taken to handle only the supports of the optical components to prevent damage. Although this method provides reasonable precision, it may not be feasible in all setups. In such cases, alternative methods can be employed, such as observing luminescence reflections from the crystal on mirrors M1 and M2. High precision at this stage is not critical, as theoretical calculations may exhibit some variation in practice. Further adjustments are required to optimize laser performance, and these refinements involve monitoring the beam spot, power levels, and spectral output, as detailed below.
5.1. Achieving and Optimizing the Laser Action
The mirrors must be aligned in such a way that they reflect the laser beam correctly, as illustrated in the laser schematic
Figure 7. Moreover, it is crucial to ensure that the round-trip reflections of the laser beam fall on the same point, which can be achieved by centering the optical components on the height of the pump. This alignment process requires the meticulous adjustment of the mirrors to minimize losses and optimize system efficiency.
Once the reflections are centered correctly, the laser emission threshold can be achieved through the angle adjustments made in the mirror mounts. The laser can be observed to emit different transverse electromagnetic (TEM) modes, but the desired outcome is the
mode, which exhibits a Gaussian circular pattern and requires careful tuning of the mirrors [
5]. The observation of the
mode is indicative of good alignment.
After achieving laser action, optimizing the laser involves finding the ideal reflection distances and angles. This involves scanning the positions of the crystal and M2 mirror and making angular corrections through the mirror mounts. The incidence of the intracavity beam on the mirrors indicates the alignment quality: misaligned beams are off-center on the spherical mirrors, as shown in
Figure 14a, whereas aligned beams are centered on the curved mirrors, as depicted in
Figure 14b. This can be easily corrected with flat mirror correction, in order to bring the beam closer to the center of the spherical mirrors.
Alignment progress can be monitored using a powermeter to observe increases (indicating good alignment) or decreases (indicating poor alignment) in output beam power. During optimization, laser emission is more prominent, and other reflections around the spot tend to be weaker, as illustrated in
Figure 15. However, the behavior of the output beam can vary depending on the emission wavelength, if the laser emission varies to a wavelength closer to the NIR, it may not be perceptible to the naked eye. Therefore, the powermeter measurement remains the most reliable indicator of alignment progress.
Astigmatism can experimentally deviate from the value predicted by the equation due to changes in temperature and other parameters. This can be adjusted by analyzing if the output beam profile is circular and the power measurement is rising. To optimize astigmatism compensation, it is necessary to scan around the estimated reflection angle and explore variations to achieve better results. In our case, angles slightly smaller than the estimated 24° provided optimal results.
After determining the optimal power for various angle and position tests, it is crucial to record the positions and distances of the optical components for future reference, if necessary.
5.2. Achieving the Modelock Regime
In order to achieve the modelock regime, a scanning procedure was carried out to optimize the focus from the continuous wave regime to the pulsed regime. This involved adjusting the positions of the M2 mirror and the crystal, bringing them closer to the M1 mirror, with the intention of decreasing the confocal parameter of the cavity. During the scanning process, small variations in power density were induced through mechanical vibrations in the P1 mirror or in the OC mirror, and the behavior of the spectrum of the output beams was observed.
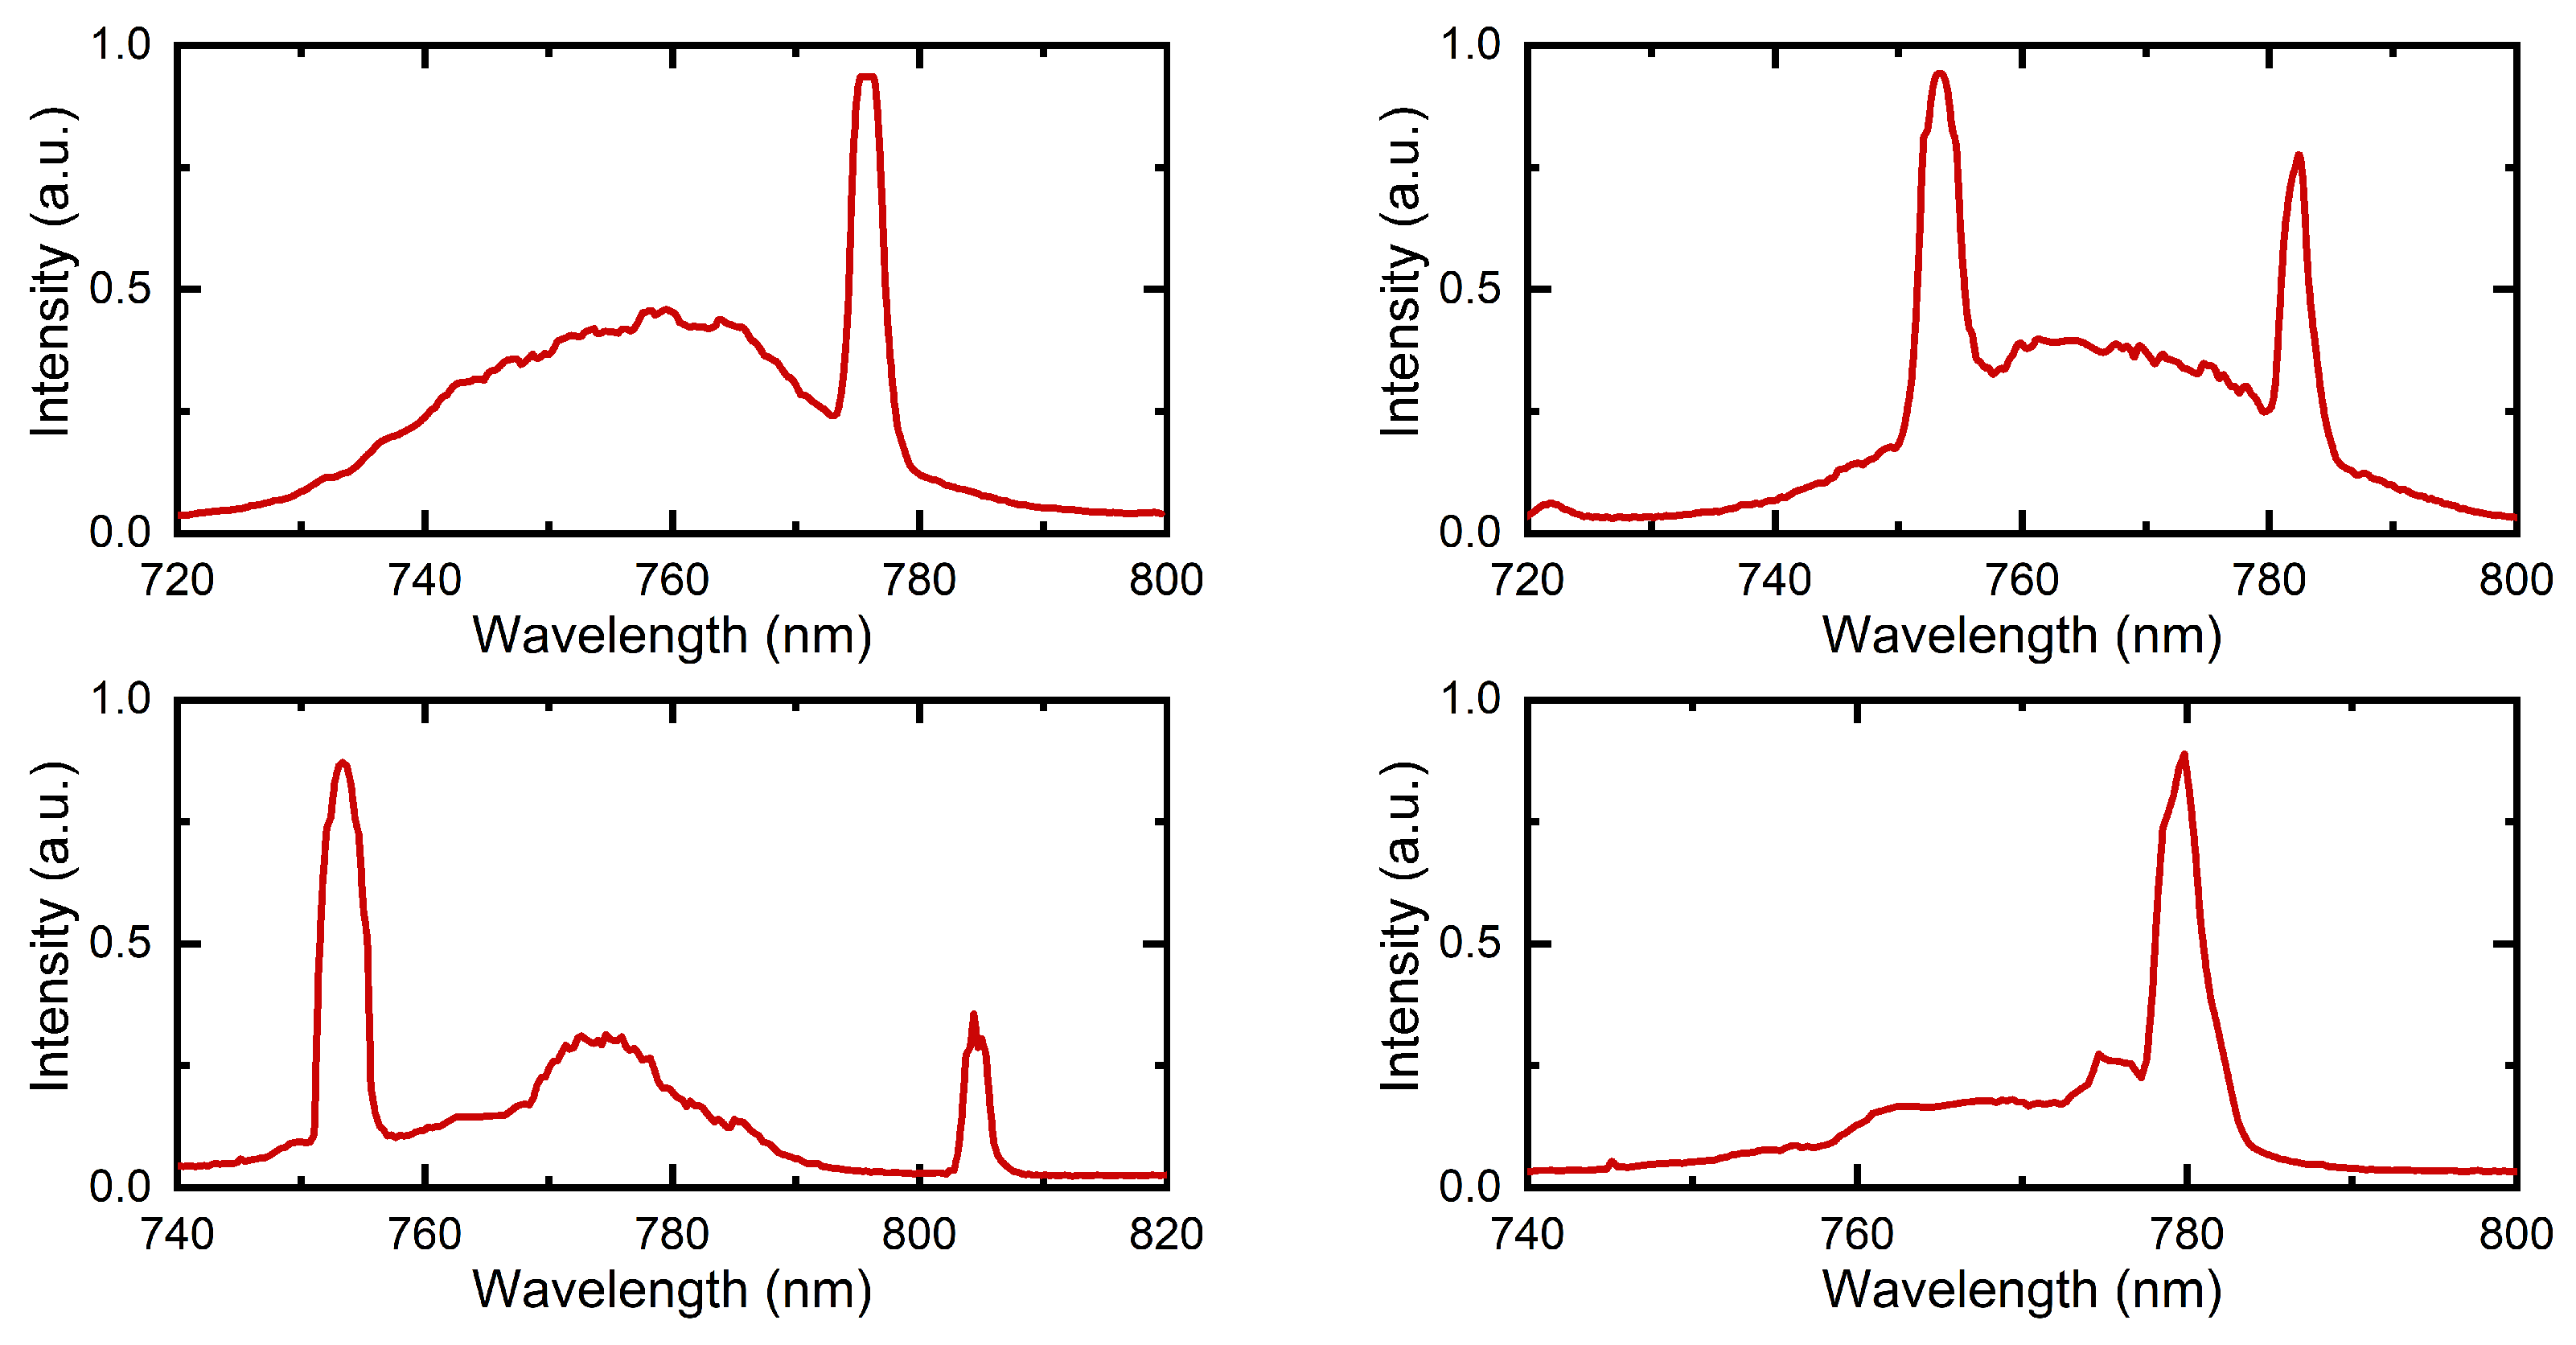
The scanning process is cyclical and begins with the laser optimized with the best power. Initially, bringing the M2 mirror slightly closer to the crystal was sufficient to observe instabilities between the regimes during the process, as represented in
Figure 16. These instabilities may appear in more than one position along the scan, but they will only be present if the cavity is properly aligned to achieve the pulsed regime. Therefore, after approaching mirror M2 and identifying the instability region closest to the crystal, the crystal was moved closer to mirror M1 so that the broad band in the spectrum is still observed. The intention of the alignment at this moment is to bring the mirror M2 and the crystal closer to mirror M1 in the region where the instability in the spectrum is observed, bringing the cavity closer and closer to the stability limit. Once the approximation limit is reached, it is necessary to make corrections in the plane mirrors and in the pumping focus lens (without changing the position of the spherical mirrors and the crystal) in order to make the broadband more stable and without CW peaks. By increasing the distance from the pumping lens to the crystal, the focus of the lens moves closer to the M1 mirror, which allows you to continue to zoom in on the crystal and the M2 mirror as well. The scanning process is then continued with the M2 mirror, bringing it closer to the M1 mirror, and repeating the previous steps. Please note that the process must be carried out carefully and slowly.
It is important to note that the laser output beam power decreases significantly during the process. When the laser achieves stable broadband emission without any continuous wave laser peaks and only one output laser beam is present, it indicates the attainment of the mode-locked regime. In regions of instability within the cavity’s broadband spectrum, the laser beam appears as a “hazy beam”, which differs from the standard beam observed in continuous wave lasers.
6. Experimental Results
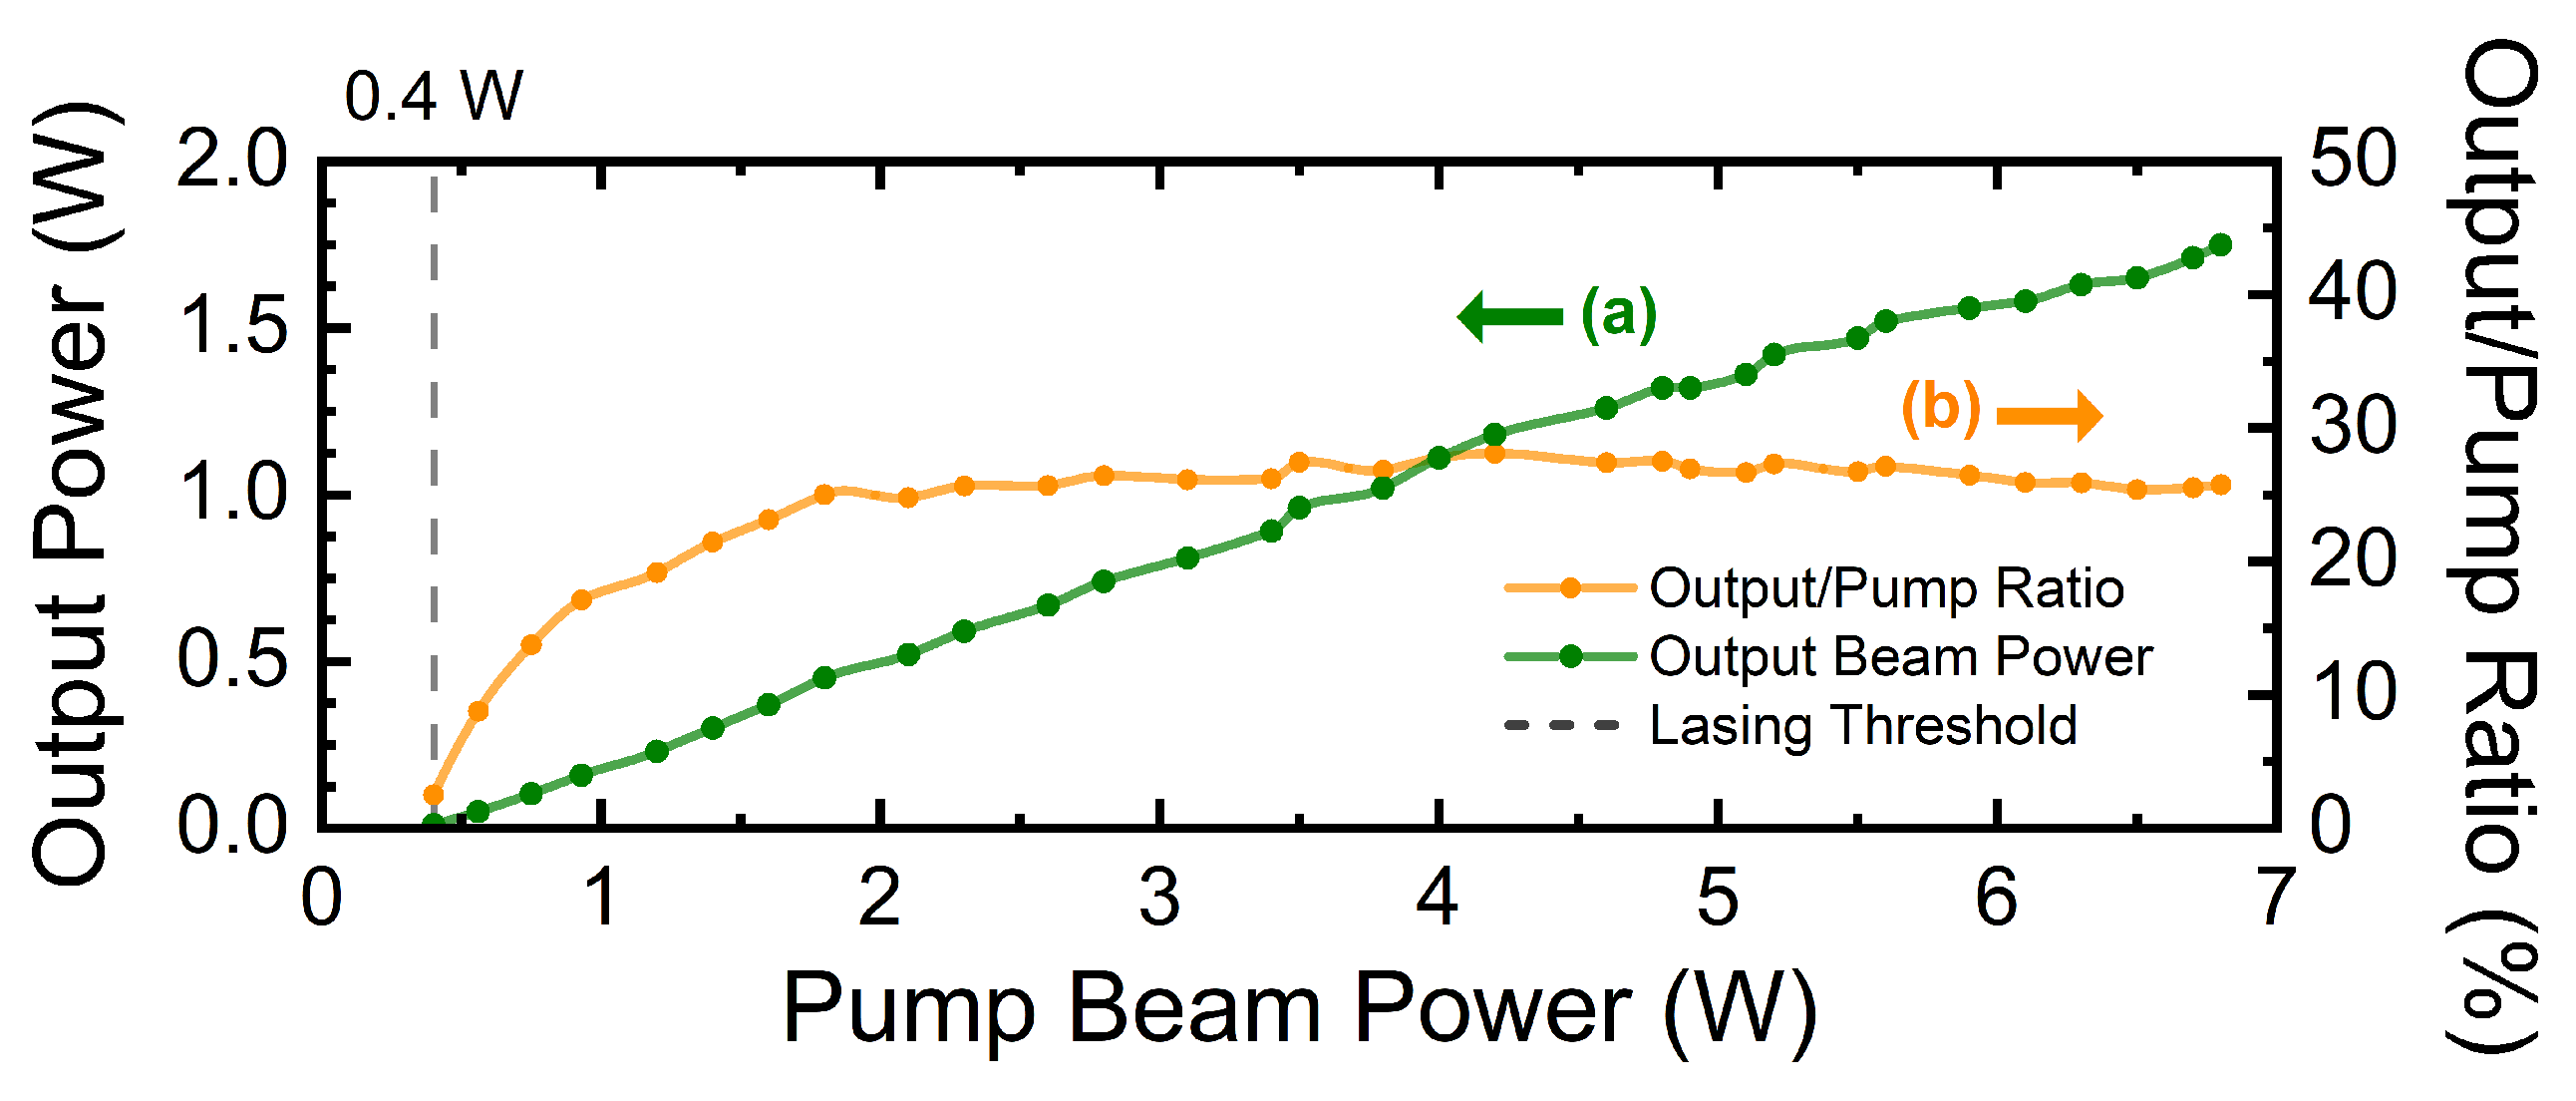
After aligning the mirrors to achieve laser action, the alignment was optimized in continuous wave operation. In the optimized configuration, the lasing threshold was reached at a pump beam power of 0.4 W, and the output-to-pump power ratio was approximately 25% for pump powers above 2 W, as shown in
Figure 17. The output-to-pump ratio for CW operation indicated that the CW alignment was optimized to facilitate mode-locking alignment. With the output-to-pump power ratio indicating good performance in CW mode, a specific pump power was set for alignment in the mode-locking regime. It is important to note that the pump power must remain fixed because any variation would necessitate realigning the system to achieve mode-locking.
By further optimizing the alignment for mode-locked laser action, it was possible to achieve the mode-locking regime at a pump power of 7.4 W, generating output pulses with an average power of 0.94 W. The output-to-pump ratio achieved was 12.7%, the same as reported in [
41] and greater than the approximately 8% reported in [
24,
42,
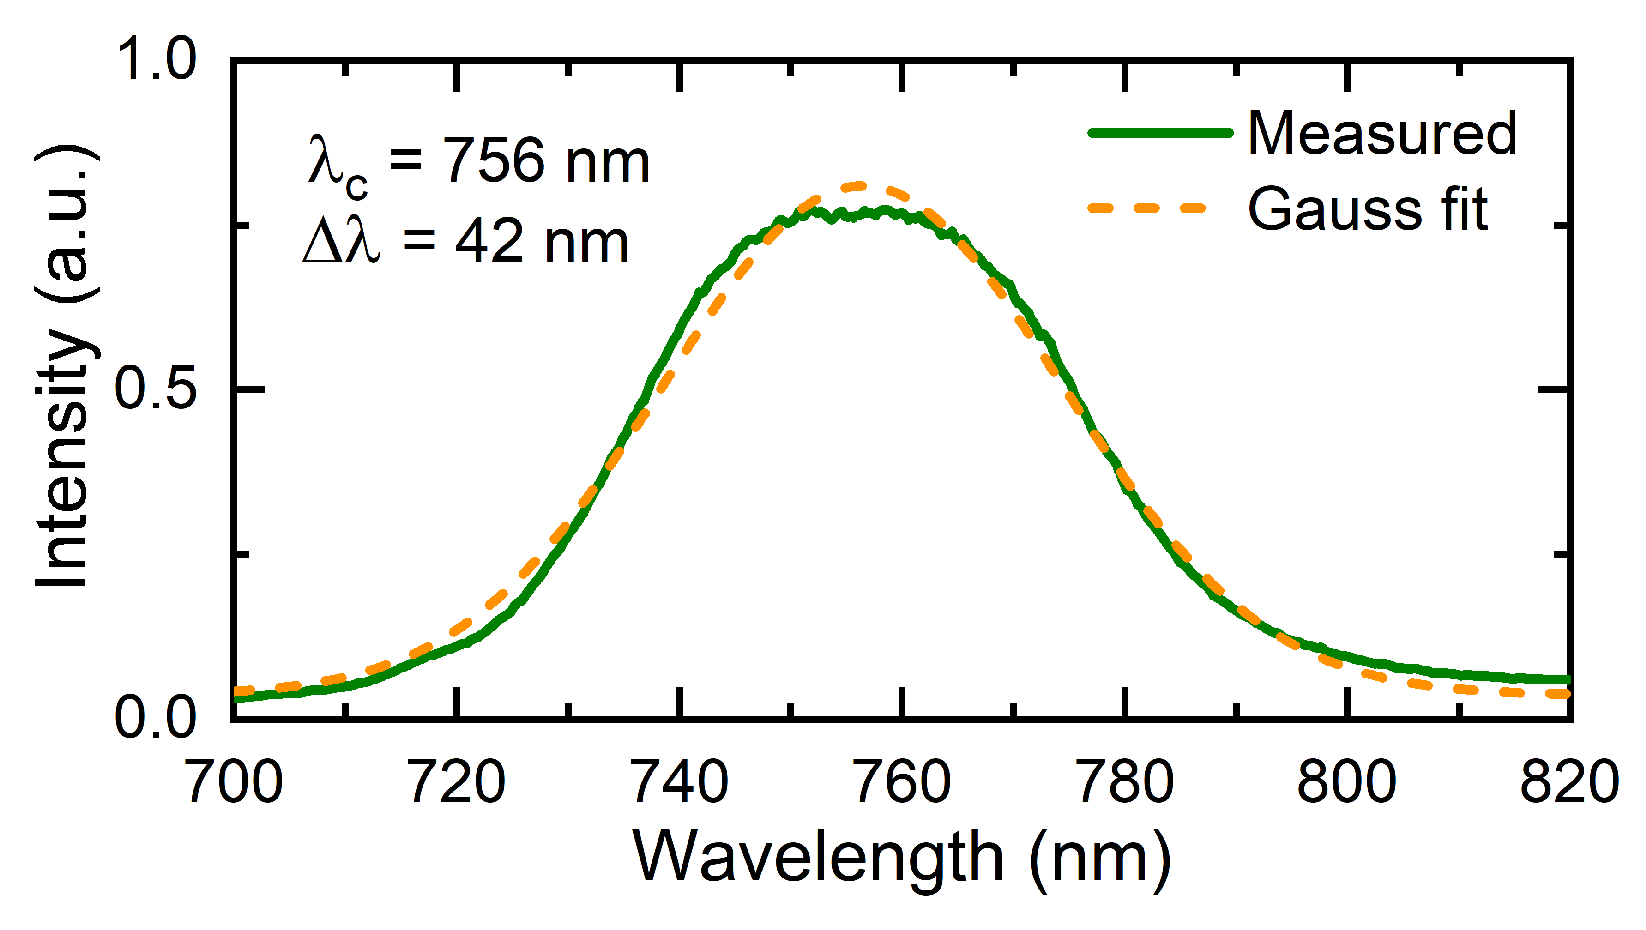
43] for the Ti:Sapphire rings cavities. The spectrum measured with a spectrometer, as shown in
Figure 18, exhibited a Gaussian shape with
, centered at 756 nm with a full width at half maximum (FWHM) of 42 nm, indicating the potential for Gaussian transform-limited pulses of 20 fs. The intensity autocorrelation trace, measured using the Frequency-Resolved Optical Gating (FROG) technique and shown in
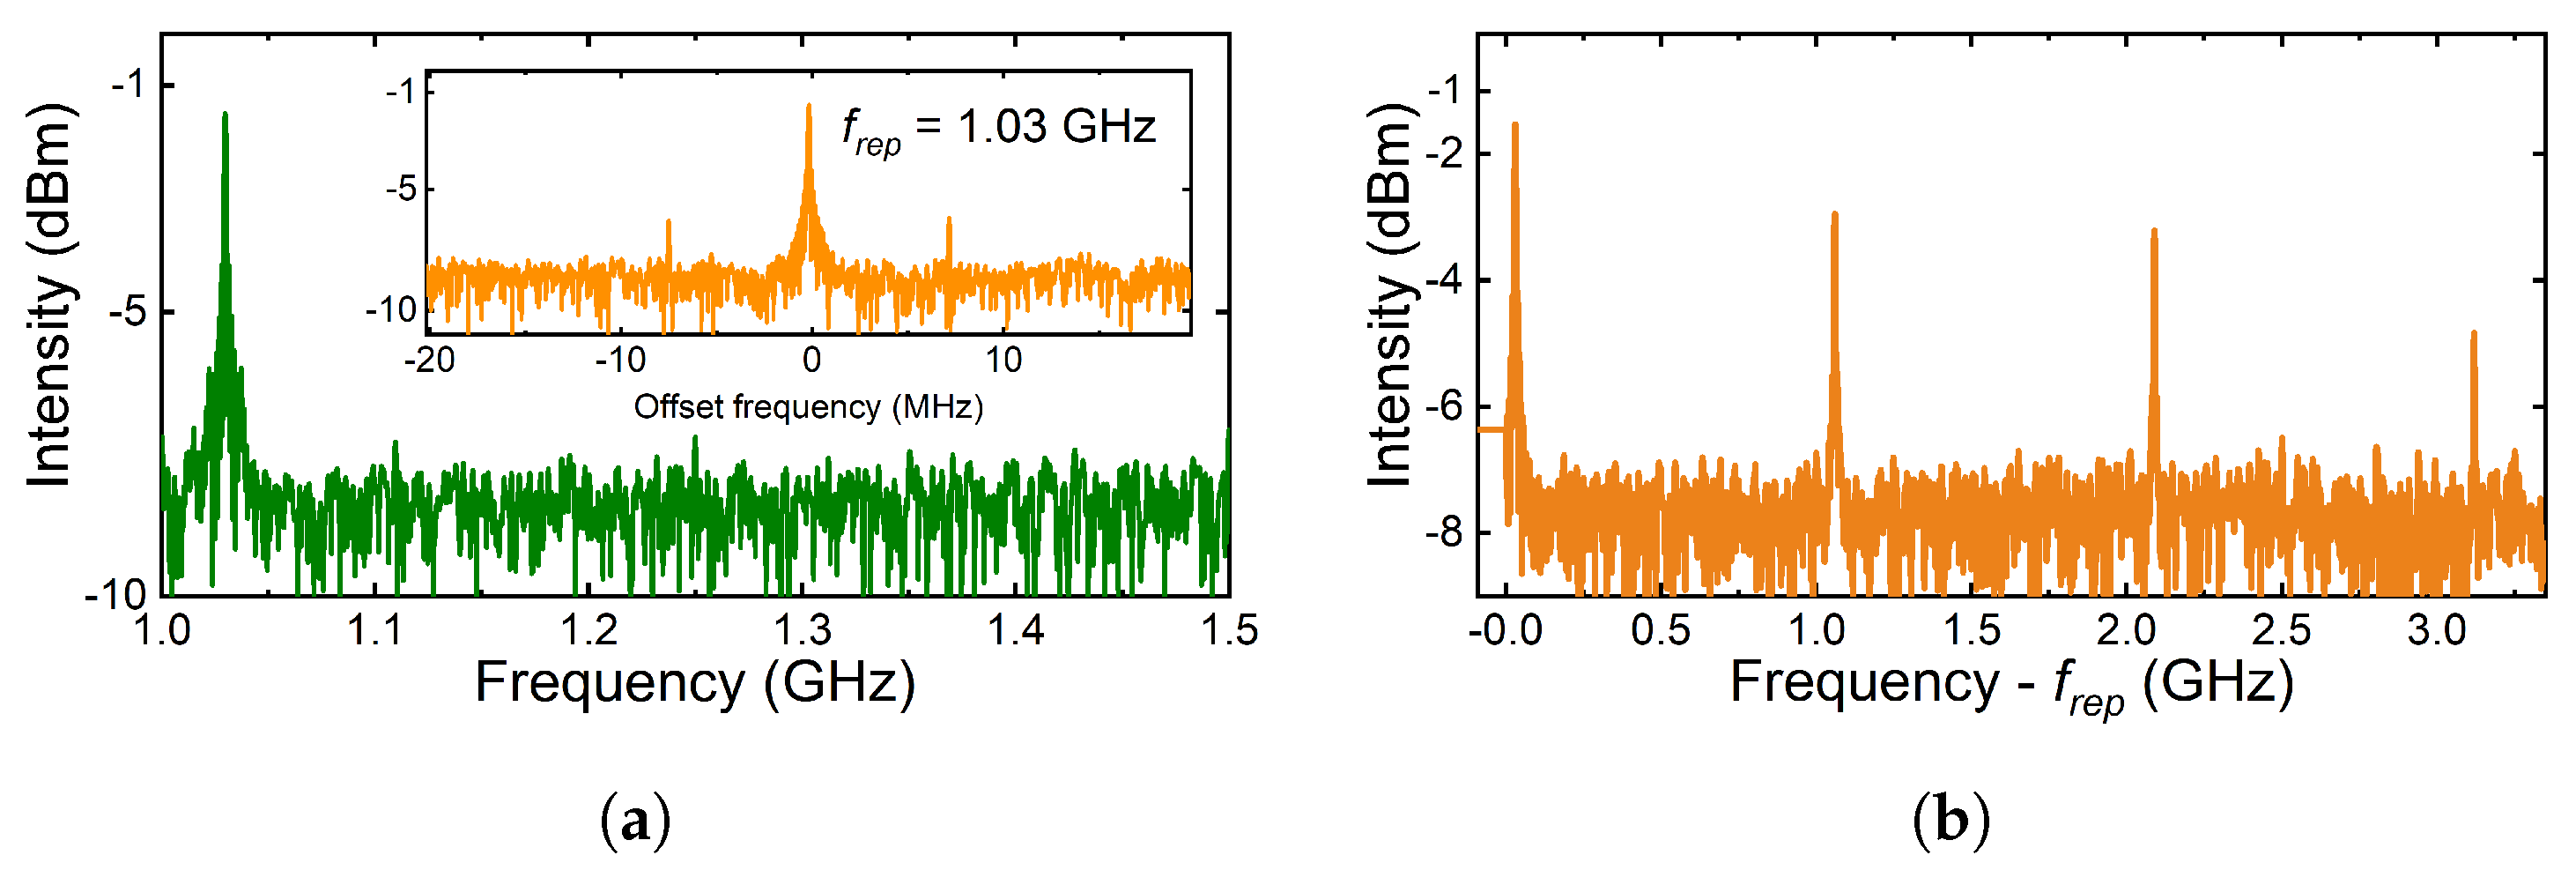
Figure 19, indicated a pulse duration of 61 fs. These results show a time-bandwidth product of 1.34, suggesting a pulse with low dispersion that can be further improved by using better DCMs or by integrating pulse compression systems. The radio-frequency (RF) spectrum, depicted in
Figure 20, indicated a pulse repetition rate of 1.03 GHz.
7. Discussion and Conclusions
The bow-tie configuration of this compact cavity, combined with the use of dispersion-compensating mirrors, is a critical factor in achieving pulse repetition rates on the order of GHz. This design reduces the size of the cavity while maintaining excellent beam quality and stability. The choice of pump laser significantly influences oscillator performance, cost, and size. Frequency-doubled diode-pumped solid-state lasers (DPSSLs) remain the most common pump sources for Ti:Sapphire oscillators due to their high output power, beam quality, and durability. However, their complexity, large dimensions, and water cooling requirements contribute to increased size and cost. Recent advancements have demonstrated the potential of alternative pump sources, such as frequency-doubled tapered diode lasers [
44], optically pumped semiconductor (OPS) lasers [
45], and semiconductor laser diodes (LDs) [
46,
47,
48]. These alternatives offer advantages such as compactness, efficiency, and lower costs. For instance, green-LD pumps, with emission closer to the Ti:Sapphire absorption peak, have shown promising results in delivering higher efficiency compared to blue-LD pumps. Dual-color LD systems aim to mitigate pump-induced losses from blue-LD pumps, but challenges remain, including limited output power and complex kinetic processes that necessitate further optimization [
48,
49]. While these pump alternatives excel in compactness, affordability, and efficiency, their limited output power restricts their suitability to applications with moderate energy needs or exploratory research. For high-energy-demanding applications or precision experiments requiring high pulse energies, DPSSLs remain the safest choice. Ultimately, the pump source must align with the specific goals and requirements of the Ti:Sapphire oscillator. However, Yb-doped diode-pumped solid-state lasers (Yb-DPSSLs), which use Yb-doped crystals instead of Ti:Sapphire, can achieve higher output powers, expanding the potential for applications requiring more energy [
23]. Meanwhile, DCMs play a critical role in achieving ultrashort pulse durations by counteracting dispersion effects without requiring additional optical elements like prisms. The thermal lens effect can be mitigated through the use of cooling systems, such as water-based, cryogenic, or Peltier coolers. In this work, a Peltier-based temperature control system was employed, providing enhanced system stability and ensuring long-term crystal preservation. This approach offers a cost-effective and compact solution for thermal management [
40]. However, for high-power pump lasers exceeding 10 W, incorporating thermal lens calculations into the cavity design becomes essential to maintain optimal performance. An experimental approach to cavity design was presented, outlining a methodology to effectively translate simulated stability regions and optimal Kerr parameter ranges into practical guidelines for assembly and alignment. Fine-tuning the alignment results in a mode-locked laser generating 61 fs pulses with an average power of 0.94 W and a 1 GHz repetition rate, yielding an approximate pulse energy of 1 nJ and a peak power of 15 kW. By leveraging these design elements, the compact cavity offers a versatile and reliable platform for ultrafast laser applications, with the potential for further improvements and customization. Enhancements such as improved DCM-crystal tuning and integrated pulse compression systems can achieve sub-10 fs pulses [
41]. Additionally, variations such as photonic-circuit-integrated lasers offer advantages of high portability and minimal power consumption [
50]. By addressing experimental and practical aspects often not fully detailed in the literature, the alignment and stabilization procedures detailed in this work, combined with the provided tools, discussions, and guidelines, serve as a resource for researchers and engineers seeking to develop high-performance compact cavities in a more time-efficient manner.
