Article

Machine Learning-Assisted Optimization of Femtosecond Laser-Induced Superhydrophobic Microstructure Processing

1
Science and Technology on Advanced High Temperature Structural Materials Laboratory, Beijing Institute of Aeronautical Materials, Beijing 100095, China
2
Center for Advanced Laser Technology, School of Electronics and Information Engineering, Hebei University of Technology, Tianjin 300401, China
3
Binzhou Polytechnic, Binzhou 256603, China
4
Shandong Key Laboratory of Advanced Engine Piston Assembly, Binzhou Bohai Piston Co., Ltd., Binzhou 256602, China
*
Author to whom correspondence should be addressed.
Photonics 2025, 12(6), 530; https://doi.org/10.3390/photonics12060530
Submission received: 7 May 2025 / Revised: 18 May 2025 / Accepted: 21 May 2025 / Published: 23 May 2025
(This article belongs to the Special Issue Ultrafast Optics: From Fundamental Science to Applications)

Abstract

Superhydrophobic surfaces have garnered significant attention due to their pivotal roles in various fields. Femtosecond laser technology provides a feasible means for inducing superhydrophobic microstructures on material surfaces. However, due to the unclear influence mechanisms of process parameters, as well as the high cost and time-consuming nature of experiments, identifying the optimal femtosecond laser processing parameters within the process space remains a significant challenge. To address this issue, a process optimization framework that couples machine learning and genetic algorithms was proposed and successfully applied to the optimization of femtosecond laser-induced groove structures on TC4 alloy surfaces. Firstly, based on 64 sets of experimental data, the effects of the power, scanning speed, and scanning interval on the micro-groove structures and their wetting properties were discussed in detail. Furthermore, by utilizing this small sample dataset, various machine learning algorithms were employed to establish a prediction model for the contact angle, among which support vector regression demonstrated the optimal predictive accuracy. Three additional dimensional variables, i.e., the number of effective pulses, energy deposition rate, and roughness, were also added to the original dataset vectors as extra dimensions to participate in and guide the model training process. The prediction model was further coupled into a genetic algorithm to achieve the quantitative design of femtosecond laser processing. Compared to the best hydrophobicity in the original dataset, the contact angle of the designed process was improved by 5.5%. The proposed method provides an ideal solution for accurately predicting wetting properties and identifying optimal processes, thereby accelerating the development and application of femtosecond laser-induced superhydrophobic microstructures.

1. Introduction

Superhydrophobic surfaces have attracted extensive research interest due to their wide range of applications, including anti-icing [1], self-cleaning [1,2], and anti-corrosion [3] applications; oil–water separation [4,5]; etc. In particular, as a material widely utilized in fields such as the biomedical and aerospace fields, titanium alloys are subject to stringent performance requirements, including resistance to corrosion and ice formation [6,7]. In this regard, the enhancement of hydrophobic performance can provide favorable conditions for constructing ice-resistant and corrosion-resistant titanium alloy surfaces. How to fabricate superhydrophobic surfaces poses a major challenge. Chemical etching can rapidly endow various material surfaces with superhydrophobic properties based on specific reagents; however, it relies on a long-term process flow and complex chemical reactions [8]. Vapor deposition is another reliable approach for the fabrication of superhydrophobic surfaces, although the precise control of surface morphology and chemical composition still requires optimization [9]. Recently, femtosecond laser-induced microstructures have emerged as the most promising method for fabricating superhydrophobic surfaces, especially due to the method’s unique advantage of being able to fabricate a variety of customized microstructures in a single step [10,11,12,13].
An outstanding issue is how to select the optimal parameters within a vast process space to attain the optimal superhydrophobicity, since the wetting performance relies on a narrow range of different parameters that are still not well understood [14,15]. Some scholars have focused on establishing a qualitative dependence relationship between femtosecond laser processing parameters and the wetting performance to guide the parameter screening. For example, Tang et al. fabricated grid-like microstructures on a Si surface using femtosecond lasers and systematically discussed the influence of the scanning speed and scanning interval on the wetting performance [16]. Similarly, Sun et al. used femtosecond lasers to fabricate microcone structures on acrylic polyurethane coatings [17]. They also investigated the relationship between the microstructures created on the coatings under different laser parameters and the corresponding hydrophobicity. These extensive and systematic studies have provided the necessary theoretical basis for the formulation of femtosecond laser processes, although such guidance is more limited to the qualitative level. Moreover, the exploration of process parameters, which relies on standardized experiments, is hindered by the long experimental cycle and high cost, making it difficult to cover the entire process space. How to achieve the efficient and low-cost quantitative design of femtosecond laser process parameters to maximize wetting performance is an urgent problem to be solved.
Directly predicting and optimizing the wetting performance of femtosecond-induced microstructures based on models is an ideal solution [18]. Several researchers initially expected to attain the aforementioned objectives by constructing physical models. Kusumaatmaja et al. constructed a physical model to describe the dynamic and thermodynamic behaviors of droplets by coupling the continuum free energy equation, the Navier–Stokes equations, etc. [19]. Li et al. conducted a thermodynamic analysis of a pillar microtexture, a typical structure widely discussed in experiments, based on a physical model, and the roles of pillar height, width, spacing, and drop size were systematically investigated [20]. Furthermore, the quantitative design criteria for the superhydrophobic surface of this specific structure were proposed. Moradi et al. put forward a thermodynamic model aimed at predicting the contact angle (CA) of micro-/nanosinusoidal and parabolic patterns generated via laser ablation [21]. However, physical models are generally only applicable to a few specific microstructures. Moreover, their heavy dependence on extensive human efforts and domain expertise makes them difficult to popularize. To identify laser-induced microstructures with an excellent hydrophobicity in the midst of large design spaces within realistic time frames, a model that can accurately predict wetting performance and that is compatible with various microstructures is required. Machine learning can rapidly establish accurate quantitative models between inputs and outputs based on statistical data laws, and this has been widely applied in material development and laser processing technology optimization [22,23]. Zhang et al. established a model for a laser-drilling process using various machine learning algorithms, enabling the precise prediction of features such as the taper under different parameters like laser power and frequency [24]. Machine learning models were further integrated into optimization algorithms to optimize multi-dimensional laser process parameters. Therefore, machine learning offers a potential solution for establishing a process model of laser-fabricated superhydrophobic surfaces and achieving process optimization.
In this study, a data-driven machine learning model was proposed for predicting the wetting performance of different laser-induced microstructures and quantitatively optimizing the related processes. By discussing the variations in wetting performance under different powers, scanning speeds, and scanning intervals, the influence of femtosecond laser process parameters on the wetting performance were clarified. The experimental data were integrated and deeply mined to form a small-sample dataset. Machine learning was employed to establish a prediction model for the relationship between femtosecond laser processes and the wetting performance, and the influences of factors such as algorithm selection and the dimensionality of input variables were discussed in detail. Furthermore, the optimal machine learning model was coupled with the genetic algorithm to optimize the femtosecond laser process parameters, resulting in an effective improvement in the wetting performance. The proposed method provides a universal solution for the process design and optimization of fabricating superhydrophobic surfaces using femtosecond lasers, and it can be extended and applied to other laser micro–nano processing fields.

2. Experimental and Simulation Methods

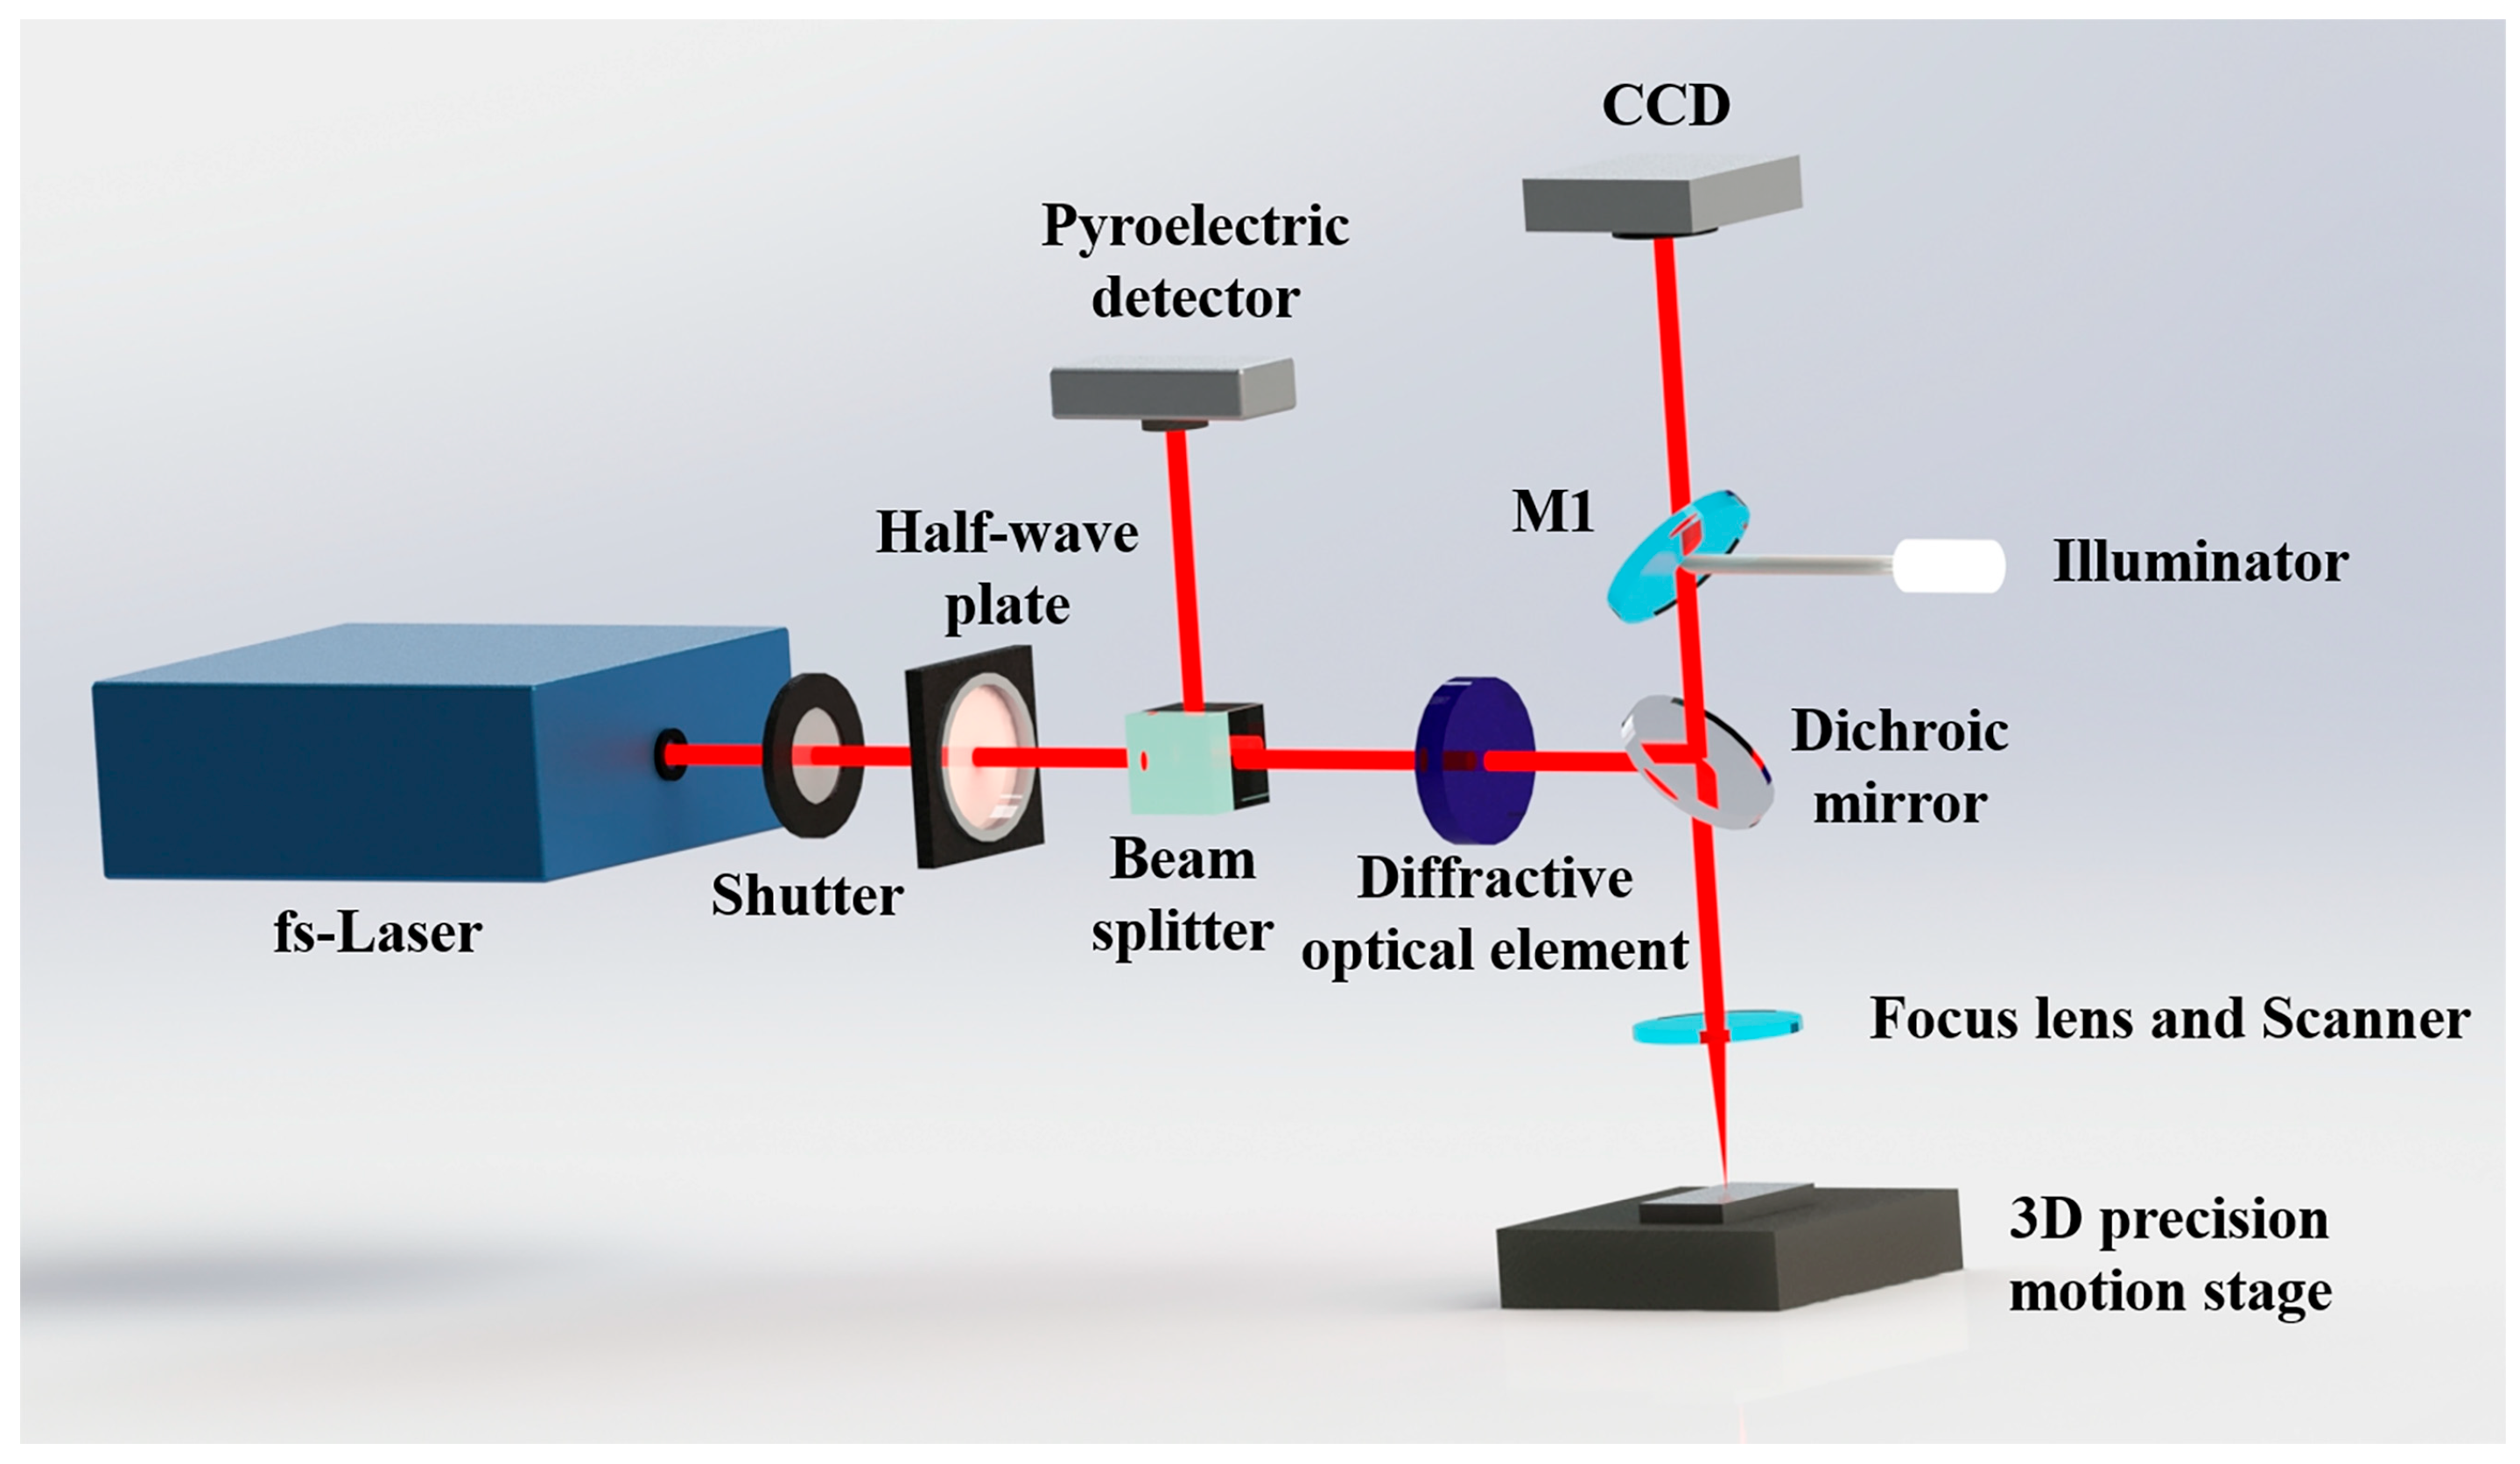
2.1. Experimental Procedures

A femtosecond laser was used to perform linear scanning on the surface of a TC4 alloy to fabricate micro-groove structures, which covered the entire surface in a zigzag pattern. The TC4 samples were cut into test pieces with a size of 15 mm × 15 mm. Different micro-groove structures were obtained by varying the laser power, scanning speed, and scanning spacing. The laser power was specifically set to 2, 4, 6, or 8 W. The scanning speed was specifically set to 10, 50, 100, or 200 mm/s, and the scanning spacing was between 30 and 60 μm with a 10 μm step size. Therefore, a total of 64 sets of surface micromachining with different femtosecond laser process parameters were carried out.
The pulse width and wavelength of the femtosecond laser were 260 fs and 1030 nm, respectively. The laser energy followed a Gaussian distribution, and the spot size was approximately 40 μm. During the laser micromachining process, the laser beam was directly focused on the surface of the sample. A half-wave plate and a beam splitter were combined to restrict the input energy. Meanwhile, a pyroelectric detector was employed together with a beam splitter for the real-time monitoring of the laser power. Figure 1 shows the setup of the femtosecond laser system.
After laser processing, a laser scanning confocal microscope (LSCM, LEXT OLS5100, Olympus, Tokyo, Japan) was used to characterize the geometric profile of the micro-groove structures and measure their roughness. A scanning electron microscope (SEM, ZEISS Sigma300, Jena, Germany) was employed to characterize the surface morphology. A CCD camera (XDC-10A, Hayear, Jiaxing, China) was employed to take a transverse snapshot of the droplets within the processed area, and the ImageJ 2024 software was utilized to measure the droplet contact angle (CA). The CA of each microstructure was measured three times, and the average CA was used to characterize the wettability. The volume of the distilled water droplet was 2 μL.

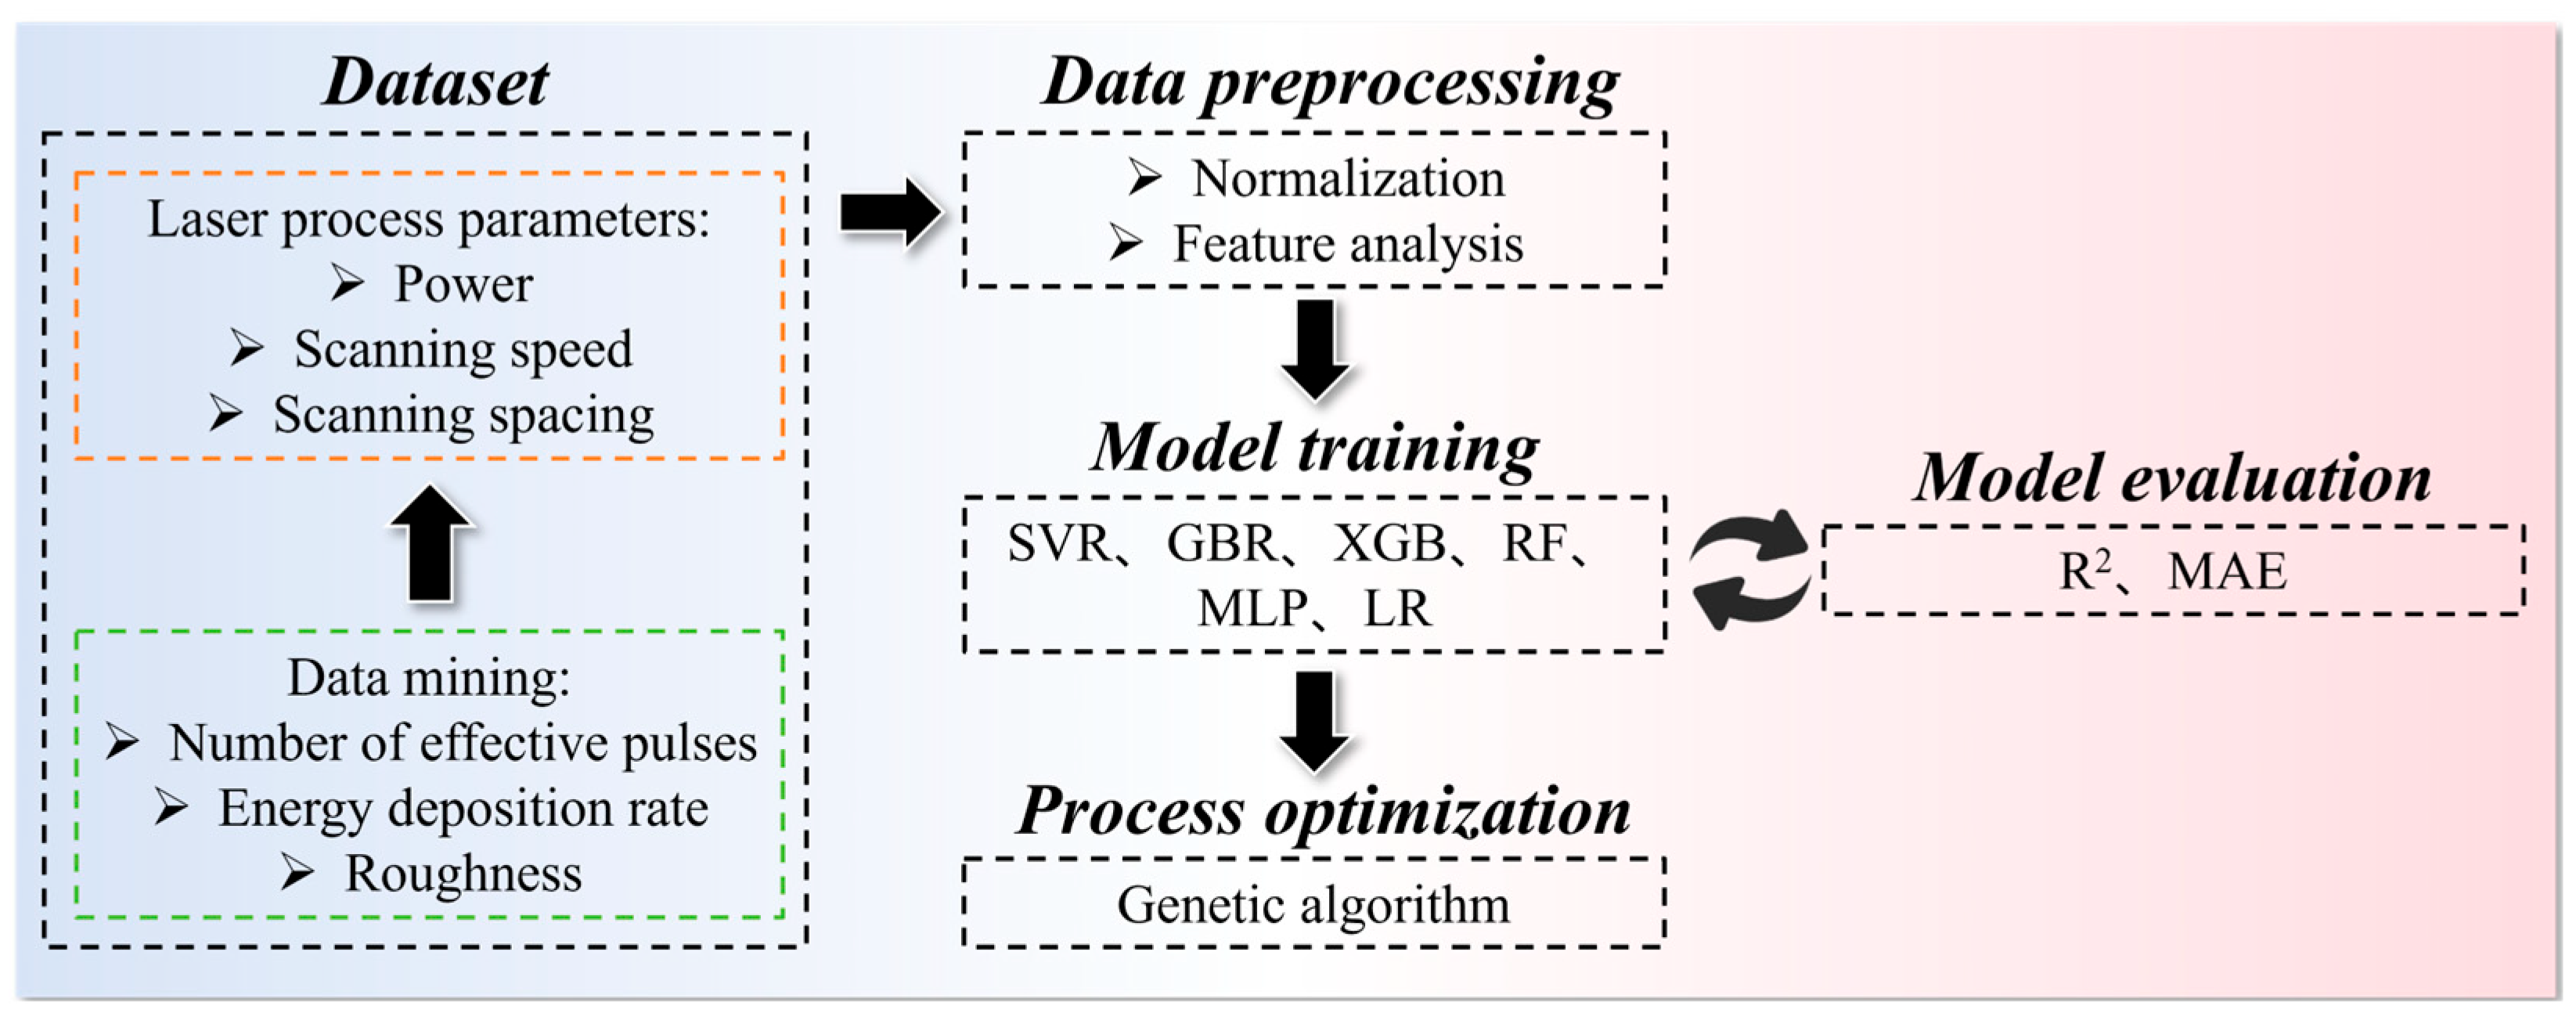
2.2. Modeling the Femtosecond Laser Process Using Machine Learning

The experimental results were integrated to form a systematic dataset, which included three dimensions of laser processing parameters and the corresponding CA. Figure 2 shows the framework for constructing the machine learning model. In addition to the laser processing parameters, three additional variables, i.e., the effective number of pulses, energy deposition rate, and roughness, were added to the dataset and used as inputs. The number of effective pulses represents the actual number of pulses acting on a certain point during the linear scanning process, and its calculation method can be found in ref. [25]. The energy deposition rate was obtained by calculating the energy deposition density per unit time. These two physical quantities characterize the energy deposition characteristics under different laser parameters and are closely related to the formation of microstructures. The roughness was directly measured by LSCM; it is a key factor influencing the wetting properties of microstructures. Therefore, there were a total of six dimensions to the input and one dimension to the output. The distribution of all the data is shown in Table 1.
Multiple machine learning algorithms were employed to develop prediction models for the wetting properties of laser-induced microstructures, including support vector regression (SVR), gradient boosting regression (GBR), random forest (RF), etc. Before training the machine learning models, all the data were standardized to eliminate the differences in the orders of magnitude among the variables. The dataset was divided into a training set and a testing set at an 8:2 ratio. After 100 rounds of training, the average value and standard deviation of the predictions were calculated to represent the final results. During the training process, the grid optimization algorithm was used to find the optimal combination of hyperparameters.
After model training, the accuracy of each algorithm was evaluated using the square of the correlation coefficient (R2) and the mean absolute error (MAE), which were calculated as follows [26]:
M A E = 1 n Σ i = 1 n f x i y i
R 2 = n i = 1 n f ( x i ) y i i = 1 n f ( x i ) i = 1 n y i 2 n i = 1 n f ( x i ) 2 ( i = 1 n f ( x i ) ) 2 n i = 1 n y i 2 ( i = 1 n y i ) 2
where n is the number of samples and f(xi) and yi denote the predicted value and the measured value of the i-th data point, respectively.
To optimize the laser parameters for achieving the best hydrophobic performance, the prediction model was further coupled with the genetic algorithm. The initial population size was set to 50, and the number of iterations was set to 1000, with the optimization objective of maximizing the contact angle. During the generation of offspring, mutations and crossovers were set to generate new individuals.

3. Results and Discussion

3.1. Effect of Laser Process Parameters on Microstructures

Figure 3 shows the surface geometric morphologies under different powers when the scanning speed was 100 mm/s and the scanning spacing was 60 μm. The color represents the size distribution of the grooves, with red indicating higher protrusions and blue signifying greater depths of indentation. Figure 3(a,a1) depict two different views of the same micro-groove structure (2 W). The curve represents the contour line obtained from a linear scan along the longitudinal direction of Figure 3a1. Similarly, Figure 3b–d also display the aforementioned information for different laser-induced micro-groove structures. Femtosecond laser linear scanning induced a regular arrangement of micro-groove structures on the surface of TC4, with a flat hilltop morphology at the top. The peak-to-valley height (PV) was defined to quantitatively characterize the size of the micro-grooves. As the laser power increased, the PV value increased from 1.44 μm to 2.12 μm. Due to the high scanning speed, the laser ablation path per unit time was quite long. Moreover, the spot overlap rate was relatively low along the laser scanning direction, resulting in a small number of effective pulses acting on the unit area of the material surface. Therefore, the overall depth of the micro-grooves was relatively small. Additionally, as the laser power increased, the energy at each spatial position of the Gaussian distribution also increased, including that in the edge region. This led to a slight increase in the bottom width of the micro-grooves and a significant narrowing of the ridge at the top.
To quantitatively characterize the differences in micro-groove features under various laser processing parameters, statistical analyses were conducted on the PV values and surface roughness, as shown in Figure 4. Notably, the influence mechanism of the laser power exhibited distinct variations across different scanning intervals. Specifically, in large scanning intervals (50 μm and 60 μm), an elevated laser power induced significant increases in the PV values and surface roughness, as demonstrated in Figure 3. On the contrary, in small scanning intervals (30 μm and 40 μm), an elevated laser power demonstrated minimized PV values and surface roughness. When the scanning line spacing was smaller than the laser spot diameter, adjacent laser scan lines exhibited significant overlap, creating a thermal synergistic effect that enhanced material consolidation. In this regard, the material surface exhibited a unique topography characterized by densely distributed micro-pits and protrusions rather than regular micro-groove structures, resulting in a significantly reduced surface roughness. As the scan line spacing was further increased to exceed the diameter of the laser spot, the interaction between two adjacent scan lines gradually diminished, resulting in both the PV value and the roughness being predominantly determined by the depth of the micro-grooves. Four sets of characteristic parameters were selected to discuss the influence of scanning speed, as shown in Figure 4c,d. For all samples, both the PV value and the roughness continuously increased as the scanning speed decreased. As the scanning speed decreased, the distance traveled by the laser spot per unit time became shorter, resulting in a higher spot overlap rate. This led to a more significant material removal effect and induced larger micro-groove dimensions. It is noteworthy that, in the 8 W~30 μm sample, due to the maximum power and the smallest scan line spacing, the sample exhibited the most severe ablation. The surface of the sample was uniformly removed as a whole, precluding the formation of regular groove morphologies, and hence, the PV value could not be statistically determined.
The dimensions of the micro-grooves and the surface roughness are key factors influencing wettability. Figure 5 illustrates the CA values under different laser processing conditions. When the scanning speed was 10 mm/s, a higher laser power was more favorable for achieving a larger contact angle, while the influence of the scanning interval was minimal. At a scanning speed of 50 mm/s, a small scanning interval required a high power, whereas a large scanning interval necessitated a lower power. As the scanning speed further increased, a lower power setting (4 W) became the optimal choice for obtaining a larger CA. Among the 64 experimental groups, the maximum CA was 143 degrees.
The effect of various laser parameters on wettability exhibited a complex and intricate pattern, making it challenging to summarize into universally applicable theoretical principles. Here, starting from the characteristics of laser-induced micro-groove structures, the typical features and mechanisms of both hydrophilic and hydrophobic structures were elucidated. On samples with micro-groove structures of a low aspect ratio, liquid droplets tended to wet the bottom of the microstructures, with the CA being dominated by the Wenzel model [27]. As shown in Figure 6, due to the excessively large spacing between the microstructures, the surface was unable to effectively support the droplets. Consequently, the droplets penetrated into the gaps between the microstructures under the influence of gravity, resulting in a lower CA.
All micro-groove structures with larger contact angles shared similar characteristics, i.e., they possessed a higher aspect ratio and the surface was covered with a substantial amount of melt particles resulting from ablation. Vasiliev et al. also arrived at a similar conclusion, positing that the primary reason for the change in material wettability was the redeposition of ablation products onto the material surface, which, in conjunction with the groove structures, formed a micro–nano porous layer that enhanced the surface hydrophobicity of the material [28]. As shown in Figure 7, the liquid droplets did not wet all the gaps of such surface microstructures, but instead formed countless air pockets at the solid–liquid interface, which hindered the droplets from infiltrating deeper into the structure, resulting in a larger CA. These more fundamental discussions provide qualitative theoretical guidance for enhancing the hydrophobic performance of femtosecond laser-induced microstructures.

3.2. Selection of the Machine Learning Algorithm and the Prediction Results

To further achieve the quantitative optimization of femtosecond laser processing, it was first necessary to establish a predictive model linking the process parameters to the CA. A variety of potential machine learning algorithms were attempted, including support vector regression (SVR), gradient boosting regression (GBR), XGBoost (XGB), random forest (RF), multilayer perceptron (MLP), and logistic regression (LR). Figure 8a,b show the R2, MAE, and standard deviation after 100 random partitions. Whether for the training set or the testing set, LR exhibited the smallest R2 and the largest MAE, indicating the poorest prediction accuracy. Although XGB, RF, and MLP achieved R2 values exceeding 98% on the training set, their R2 values on the testing set were all below 90%, indicating a significant overfitting issue. In contrast, the R2 of the SVR training and testing sets both exceeded 90%, at 93.3 ± 2.1% and 90.1 ± 4.6%, respectively. The difference between the two was only 3.2%, and there was no overfitting problem. Additionally, in terms of the MAE, the SVR model had the best overall performance, with training and testing sets of 2.55 ± 0.89 degrees and 4.57 ± 1.11 degrees, respectively. Therefore, the SVR algorithm was chosen as the hydrophobic performance prediction model and used for subsequent process optimization.
Additionally, in order to investigate the influence of additional variables on the prediction performance of the model, the dataset with or without the additional variables was used to train and test the SVR models, respectively. Figure 8c,d show the training results after 100 random partitions. The R2 of the model based solely on pure process parameters was lower than 80%, and the MAE was as high as over 7 degrees. In contrast, for the model with the introduction of three additional variables, i.e., the number of effective pulses, energy deposition rate, and roughness, the R2 values all exceeded 90%, and the MAE did not exceed 5 degrees. Moreover, the lack of any one-dimensional variable will lead to a decline in the prediction accuracy. For example, when the number of effective pulses was removed from the dataset, the R2 of the training set and the testing set decreased to 87.2 ± 5.5% and 81.9 ± 6%, respectively, while the MAE increased to 5.2 ± 2.8 degrees and 6.7 ± 2.6 degrees. Generally speaking, machine learning models often take pure process data as the input without considering any additional information, as was the case in our previous work [24]. This approach transforms performance prediction and process design into purely mathematical and statistical processes. Improving the model’s accuracy relies on the expansion of the data volume. Here, the introduction of variables closely related to the final target performance (CA) enriched the data available for training and enhanced the model’s prediction accuracy. Therefore, it indirectly reduced the amount of data required by the model and lowered the cost of optimizing femtosecond laser-induced superhydrophobic structures. Figure 9 shows the prediction results of the SVR model incorporating all variables; all the predicted points are located near the straight line with a slope of 1, indicating that the deviation between the predicted values and the experimental values was very small. Moreover, there are no singular points far away from the experimental values, which demonstrates the stability of the model.

3.3. Femtosecond Laser Process Optimization by Coupling SVR Model and GA

The optimal SVR model was further combined with the GA to find the femtosecond laser process parameters that can maximize the CA. The second-generation non-dominated sorting genetic algorithm (NSGA II) was chosen because it has the capability of swiftly determining the optimal process parameters [29,30]. After 1000 iterations, the optimal process was selected for experimental validation. Figure 10 shows the CA distribution of the optimal process relative to the original data, which exhibited a better hydrophobic performance than all the processes in the original data, with the CA reaching 151 degrees. The sample number was defined in the order of scanning speed–power–scanning interval. Specifically, samples 1–16 had a uniform scanning speed of 10 mm/s, among which samples 1–4 had a power of 2 W, samples 5–8 had a power of 4 W, samples 9–12 had a power of 6 W, and samples 13–16 had a power of 8 W. When the scanning speed and power were the same, the samples were sorted by increasing scanning interval, i.e., the scanning intervals for samples 1–4 were 30, 40, 50, and 60 μm, respectively. Similarly, samples 17–64 were arranged according to the aforementioned rules. A further comparison was made between the design process and the optimal process in the original dataset, as shown in Figure 10b, where there are significant differences between the two. In terms of laser process parameters, the power decreased by 26%, while the scanning speed and scanning pitch increased by 21.6% and 13.3%, respectively. More importantly, the power, scanning speed, and scanning spacing of the designed process were not integers or values from orthogonal experimental points; specifically, they were 7.3 W, 37 mm/s, and 34 μm. Limited by the experimental volume and cycle, the design of experimental schemes is often restricted to specific values, such as 7 W, 40 mm/s, and 30 μm, without paying attention to more detailed parameters. Therefore, it is difficult to obtain the optimal process through experimental exploration, as it requires at least hundreds of groups of experiments.
The surface microstructure fabricated by the optimal process was characterized, as shown in Figure 11. After femtosecond laser processing, the surface exhibited an obvious micro-groove structure, and a large number of nanoscale particles were attached to the surface. Under this process, the energy deposition efficiency and the number of effective pulses increased significantly, indicating that the actual energy received by the target material increased. Therefore, the machined groove structure had larger dimensions. In particular, the groove protrusions were more prominent, with a roughness of approximately 2.4 μm. When a liquid comes into contact with a solid, it does not always fully wet the rough surface of the solid. A small amount of gas may be trapped inside the grooves, making it difficult for the liquid droplets to penetrate the microstructures, and thus, the CA increases significantly. Cassie and Baxter proposed that, during the solid–liquid wetting process, the microstructures on the solid surface can trap gas, forming micro-airbags that act as an isolation layer, preventing the liquid from fully wetting and spreading on the solid surface [31]. However, this does not mean that the deeper the grooves and the wider the protrusions, the better. According to the Cassie–Baxter model, when the contact area between a liquid droplet and a solid surface decreases, the liquid droplet will exhibit a higher apparent contact angle on the surface, indicating a greater hydrophobicity. Therefore, the groove spacing, depth, and protrusion size have a complex coupling influence mechanism on the hydrophobic performance, which needs to be considered comprehensively. Machine learning and the GA provide a feasible way to efficiently find the optimal parameter.

4. Conclusions

In this study, the influence of femtosecond laser process parameters on the micro-groove structure and its hydrophobic performance is discussed in detail. Furthermore, a femtosecond laser process optimization framework that couples machine learning and the GA was proposed, and the optimal process with a larger CA than the original dataset was obtained. The main conclusions are as follows:
(1)
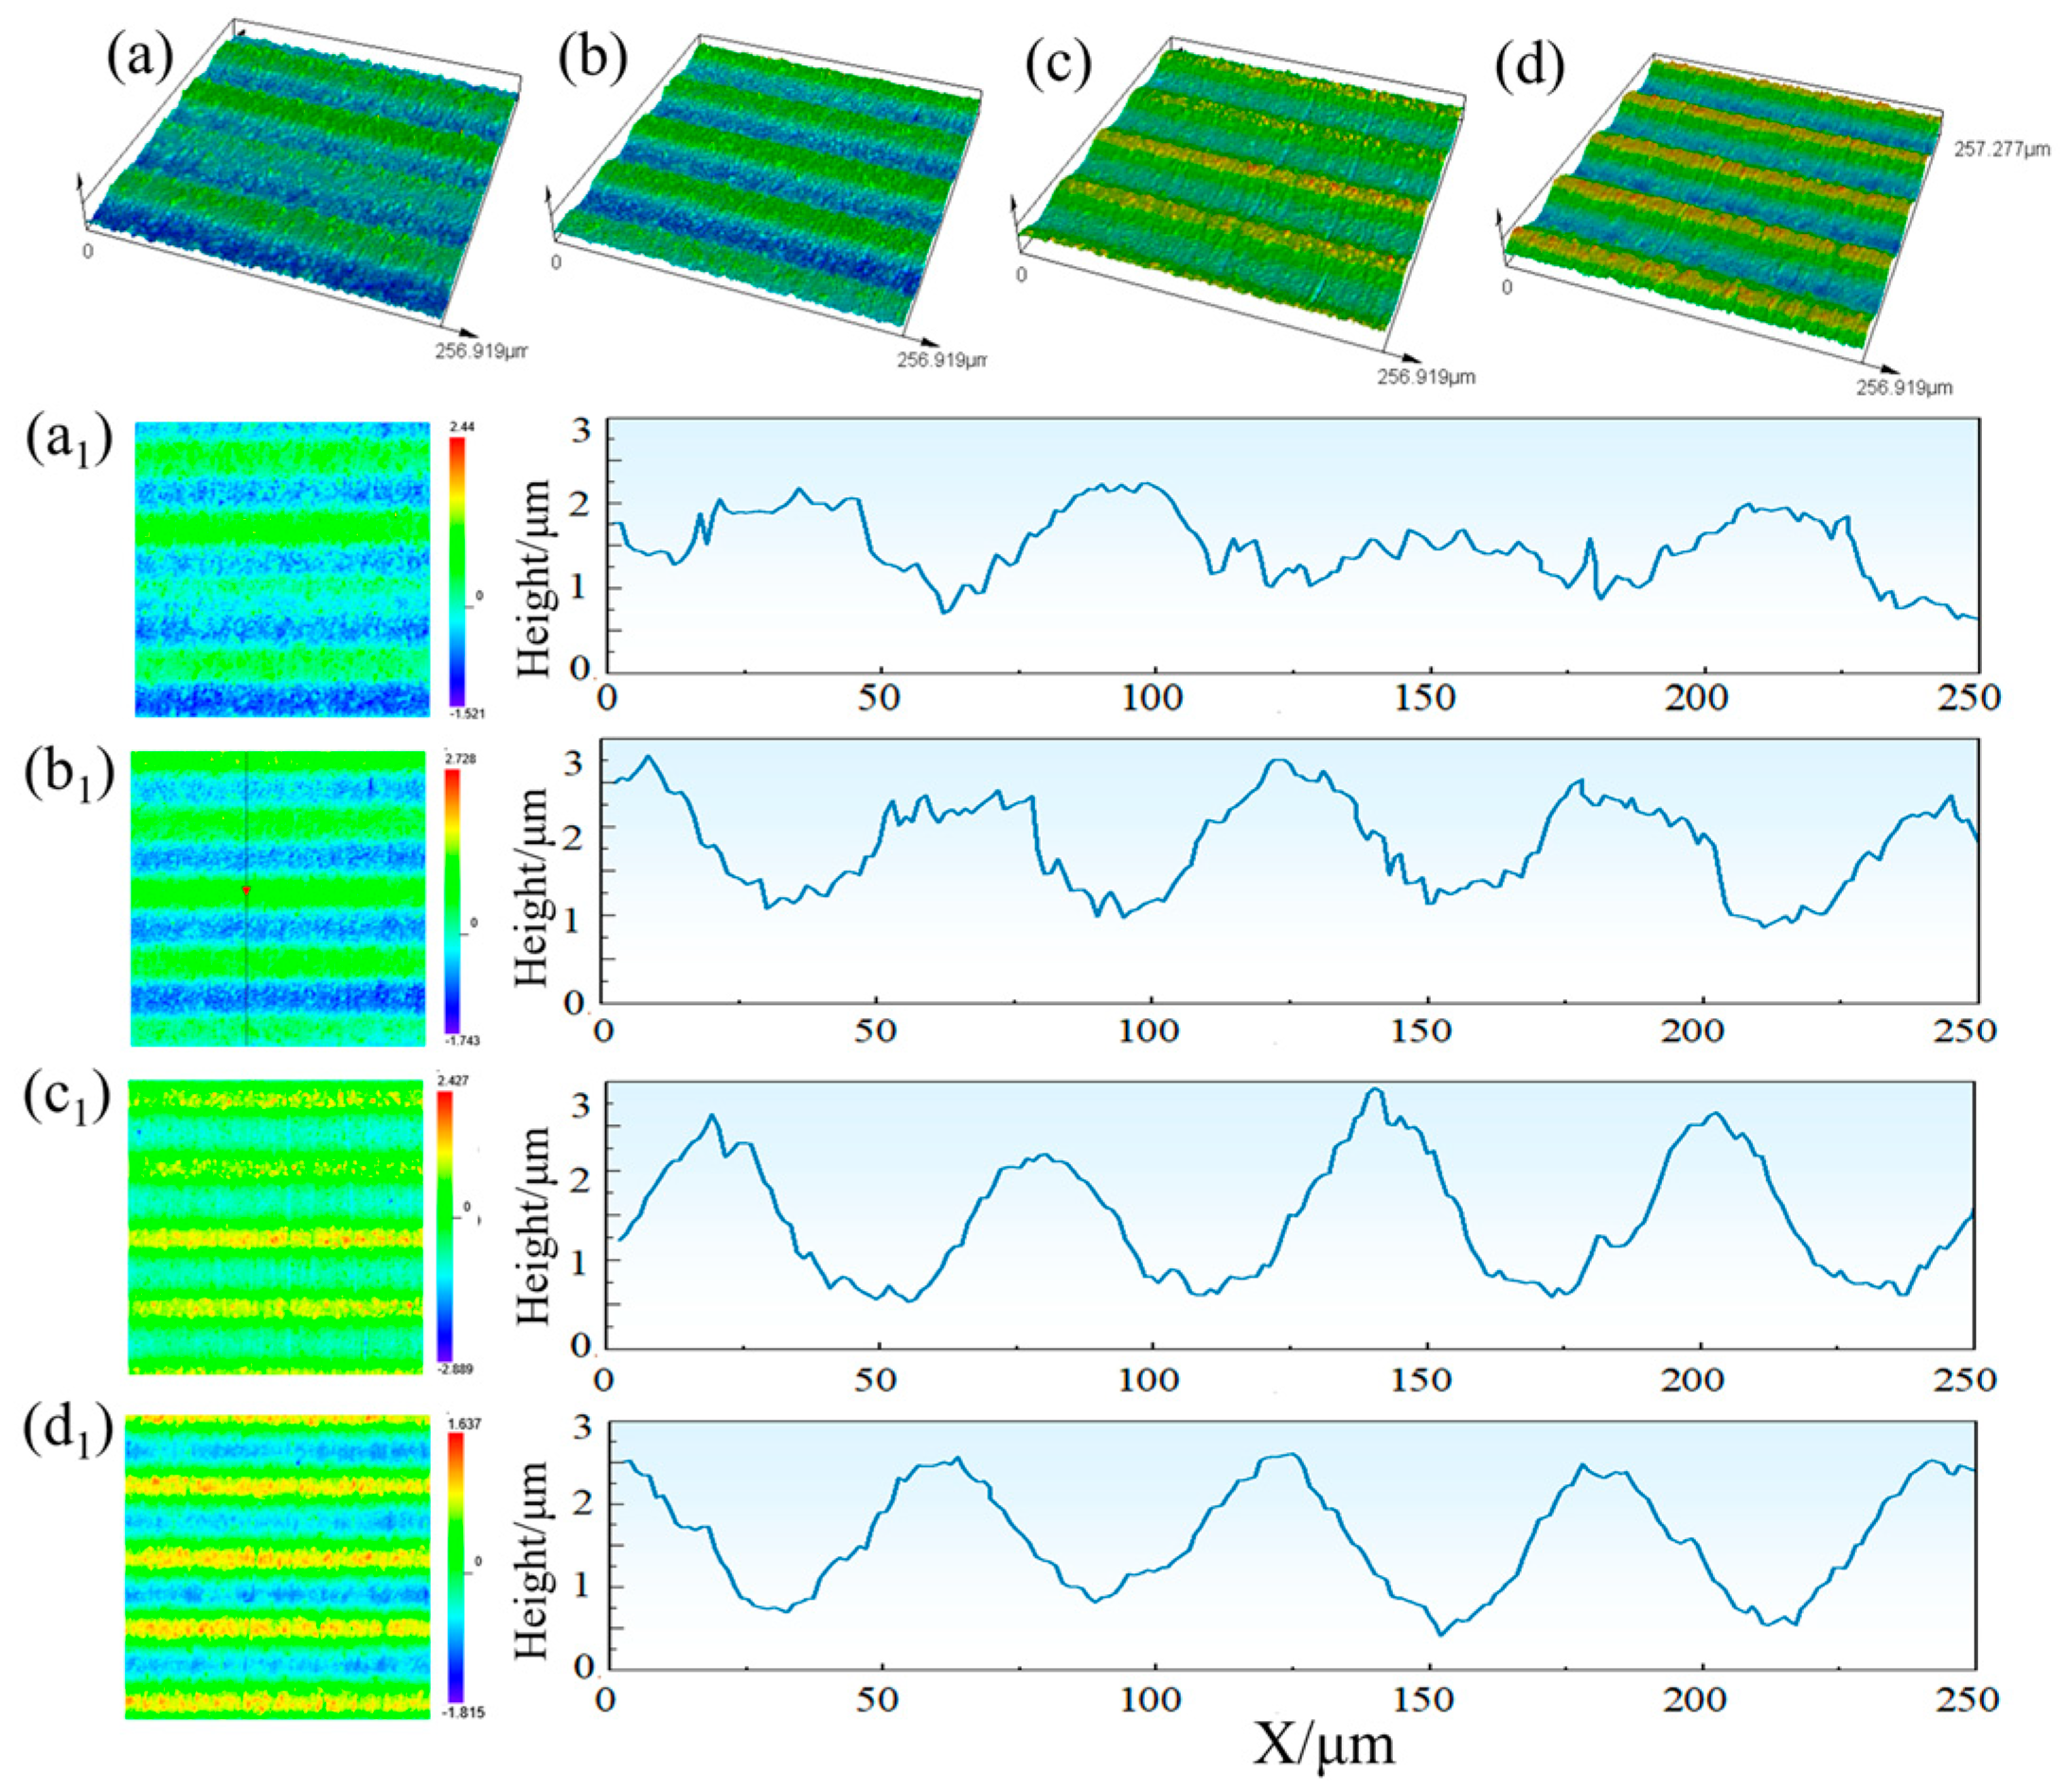
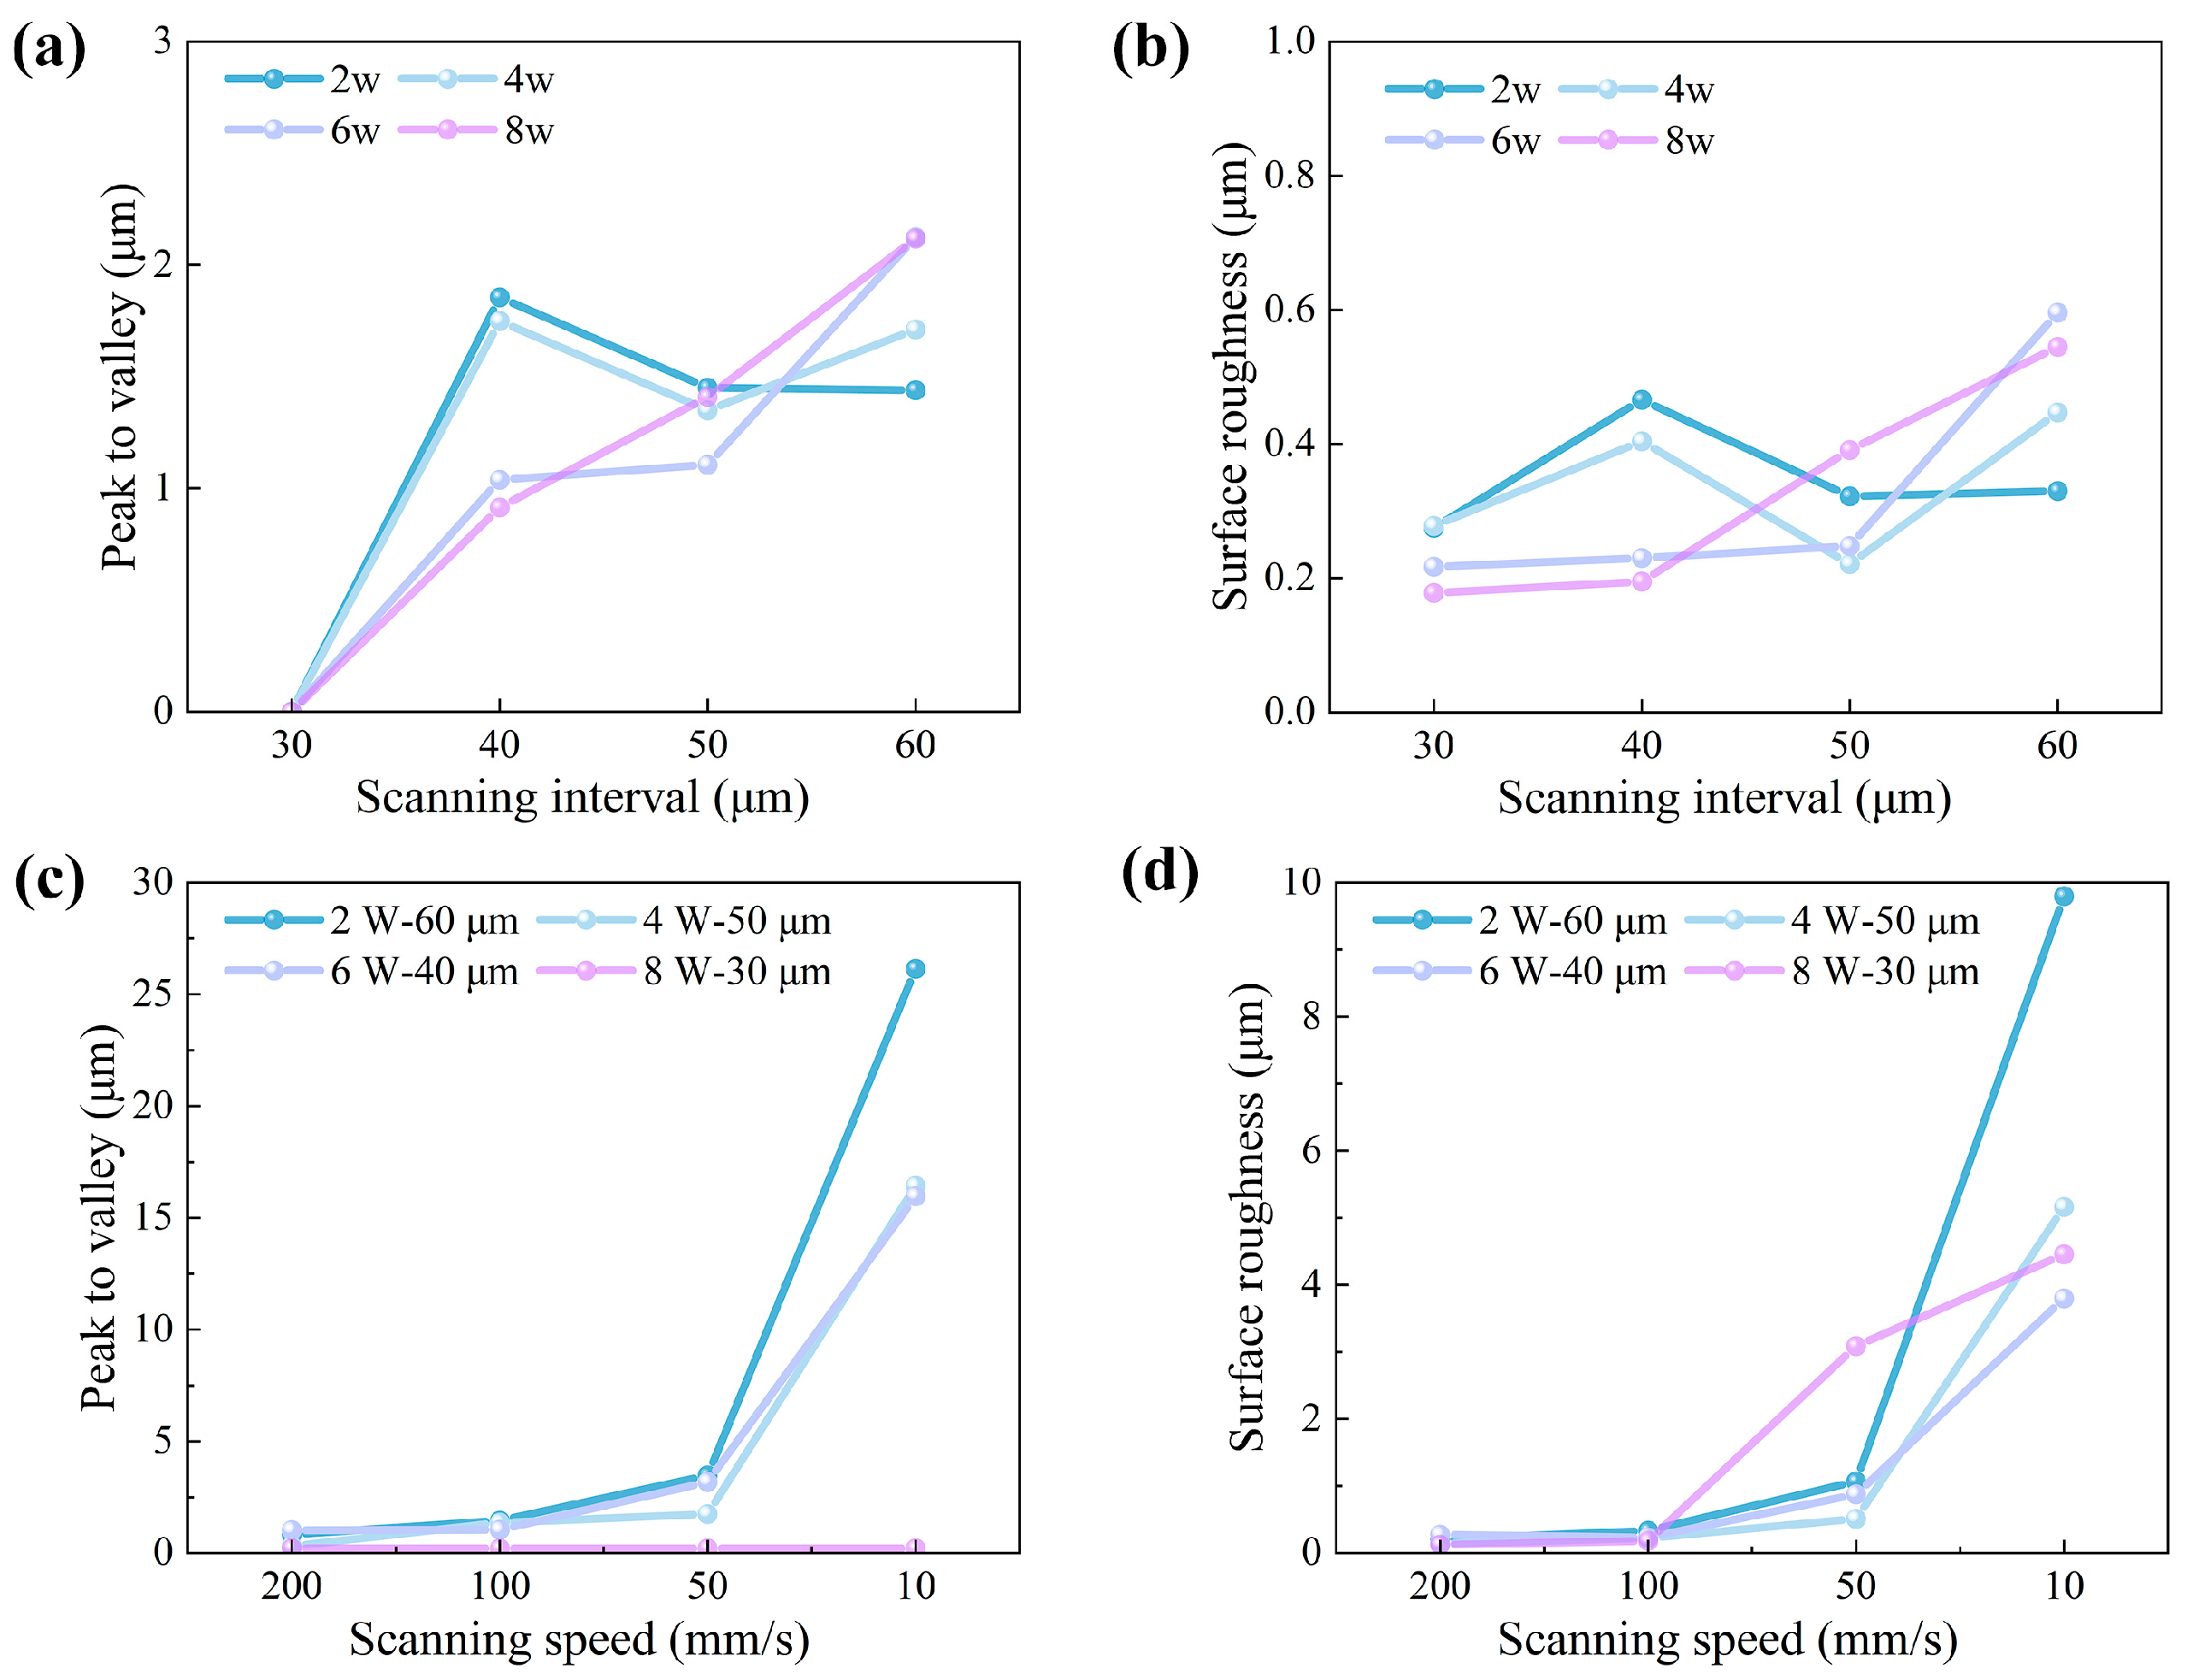
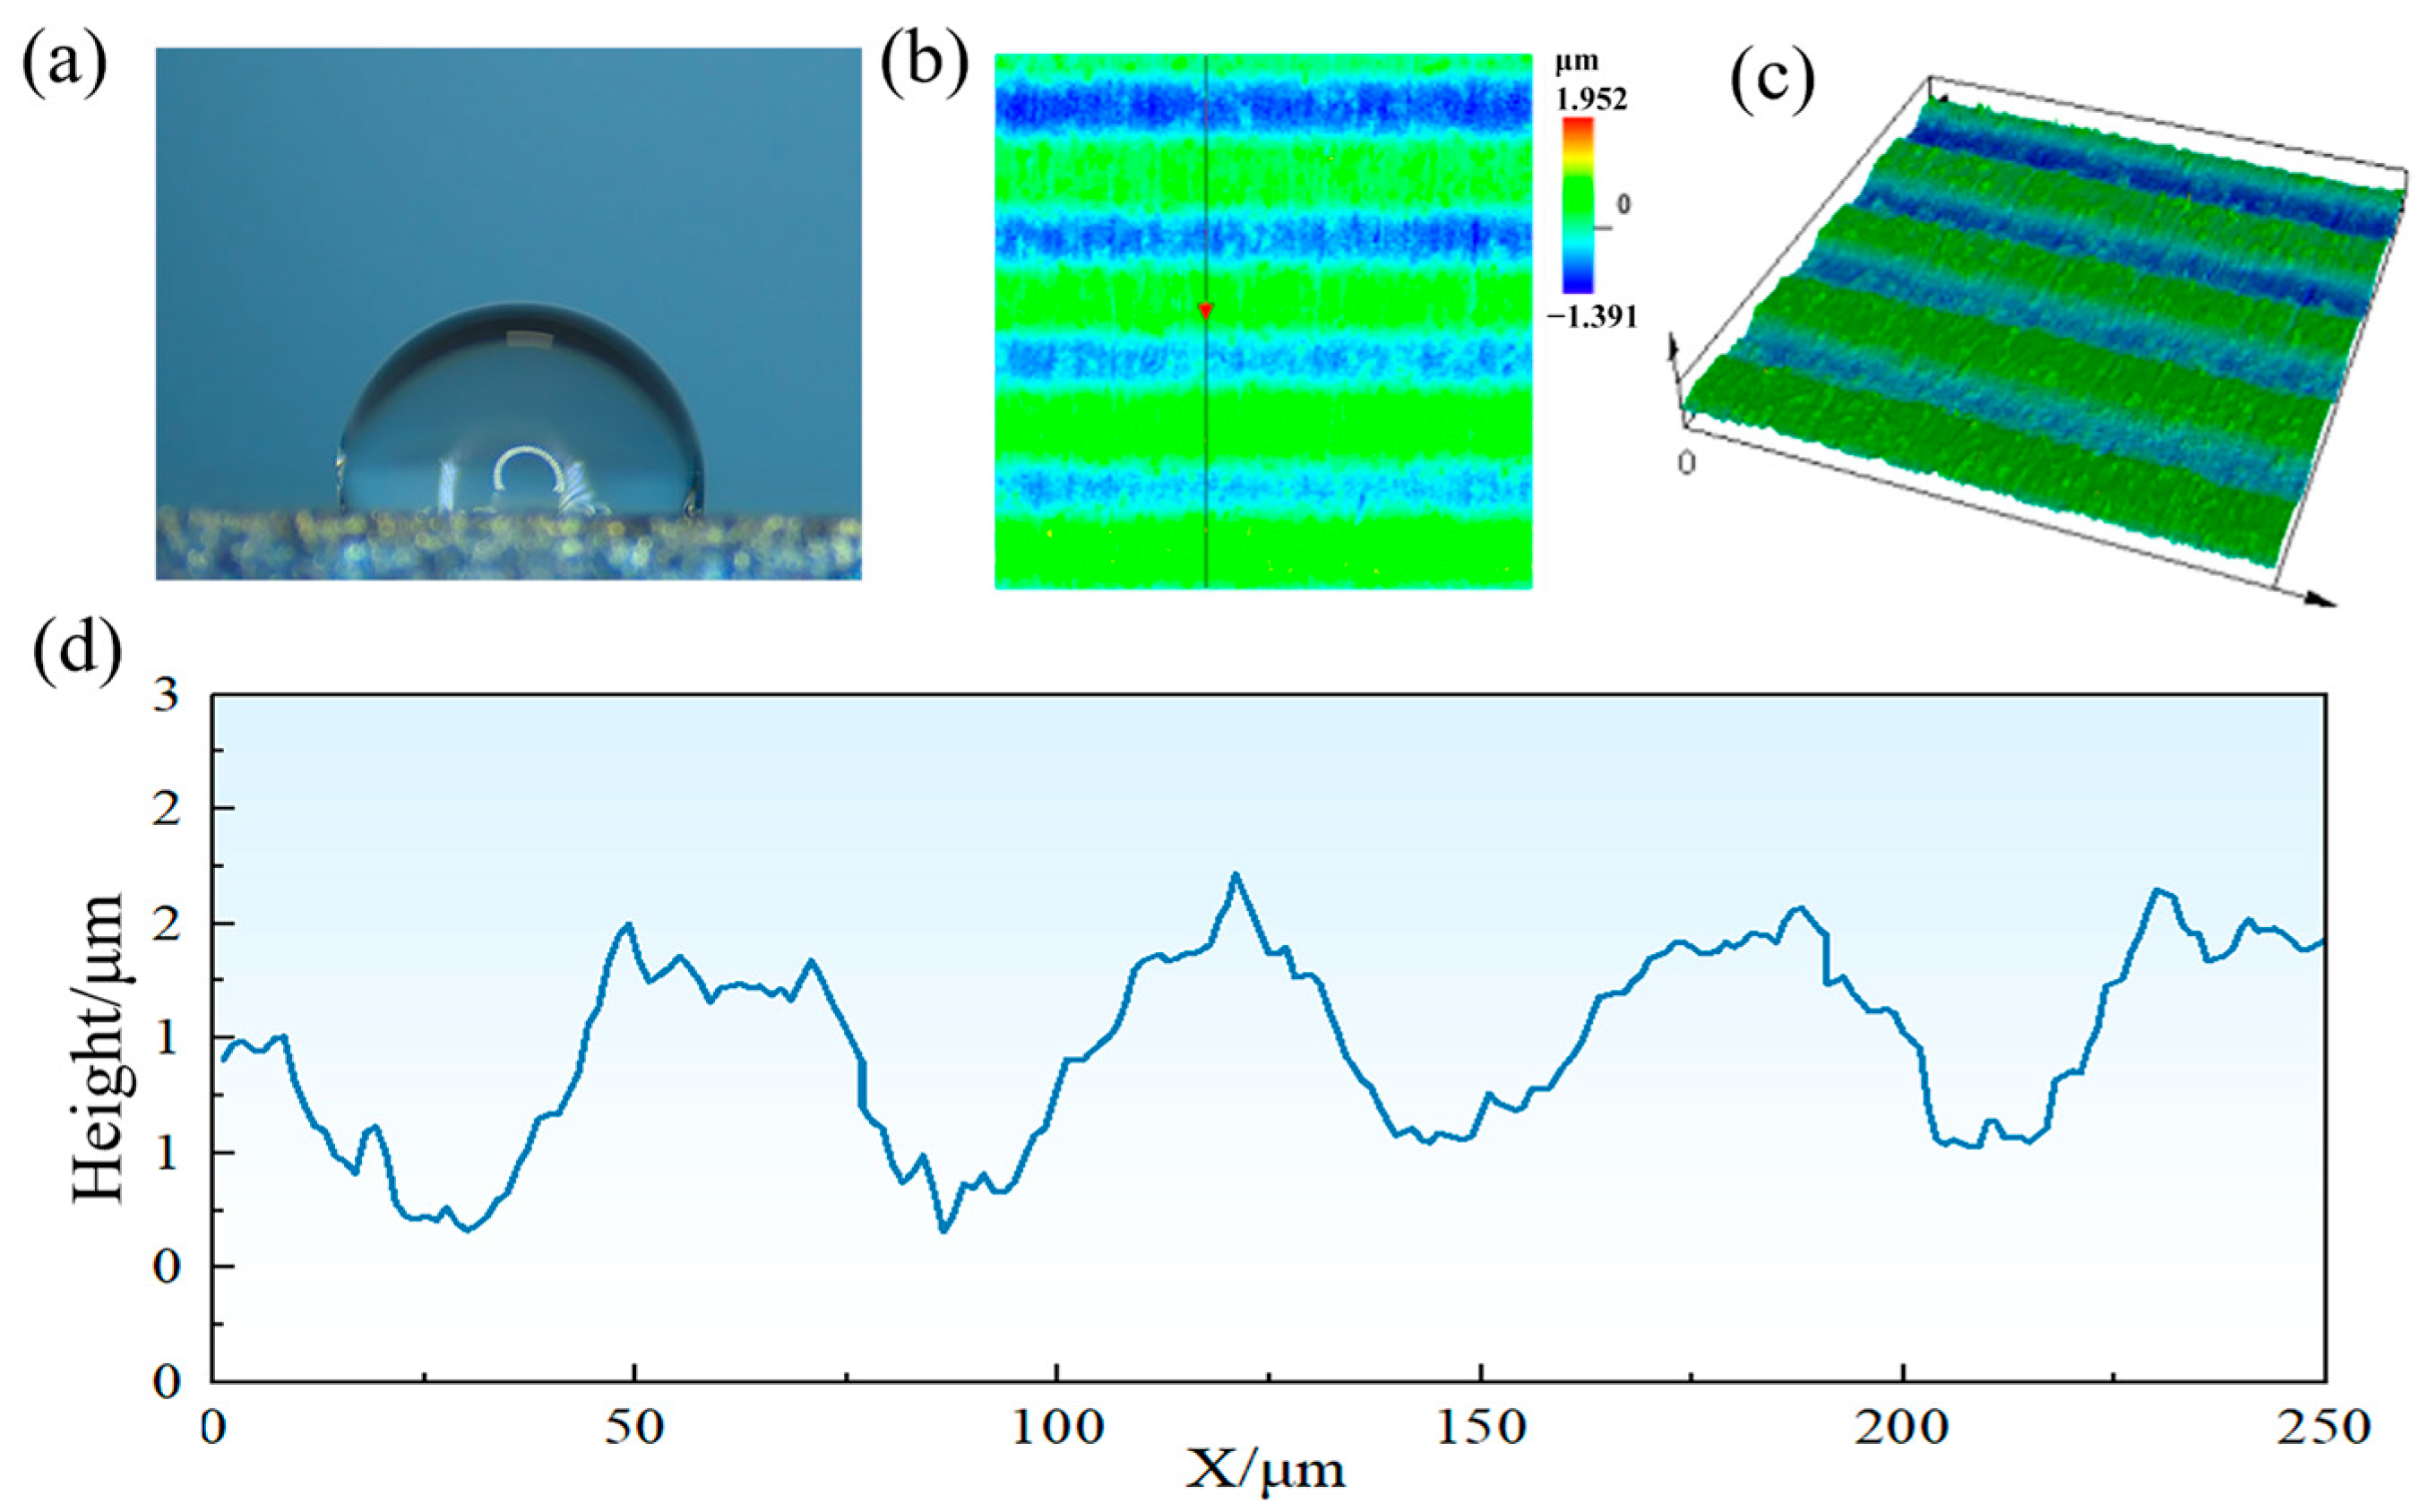
Femtosecond laser linear scanning produced regular micro-groove structures on the TC4 surface. The power, scanning speed, and scanning spacing exhibited complex coupling influence patterns on the geometric dimensions and roughness of these structures. At high scanning speeds, a high power led to larger PV values and a greater roughness on the surface, while the opposite pattern occurred at low scanning speeds. The PV value and roughness of the micro-groove structures increased as the scanning speed decreased.
(2)
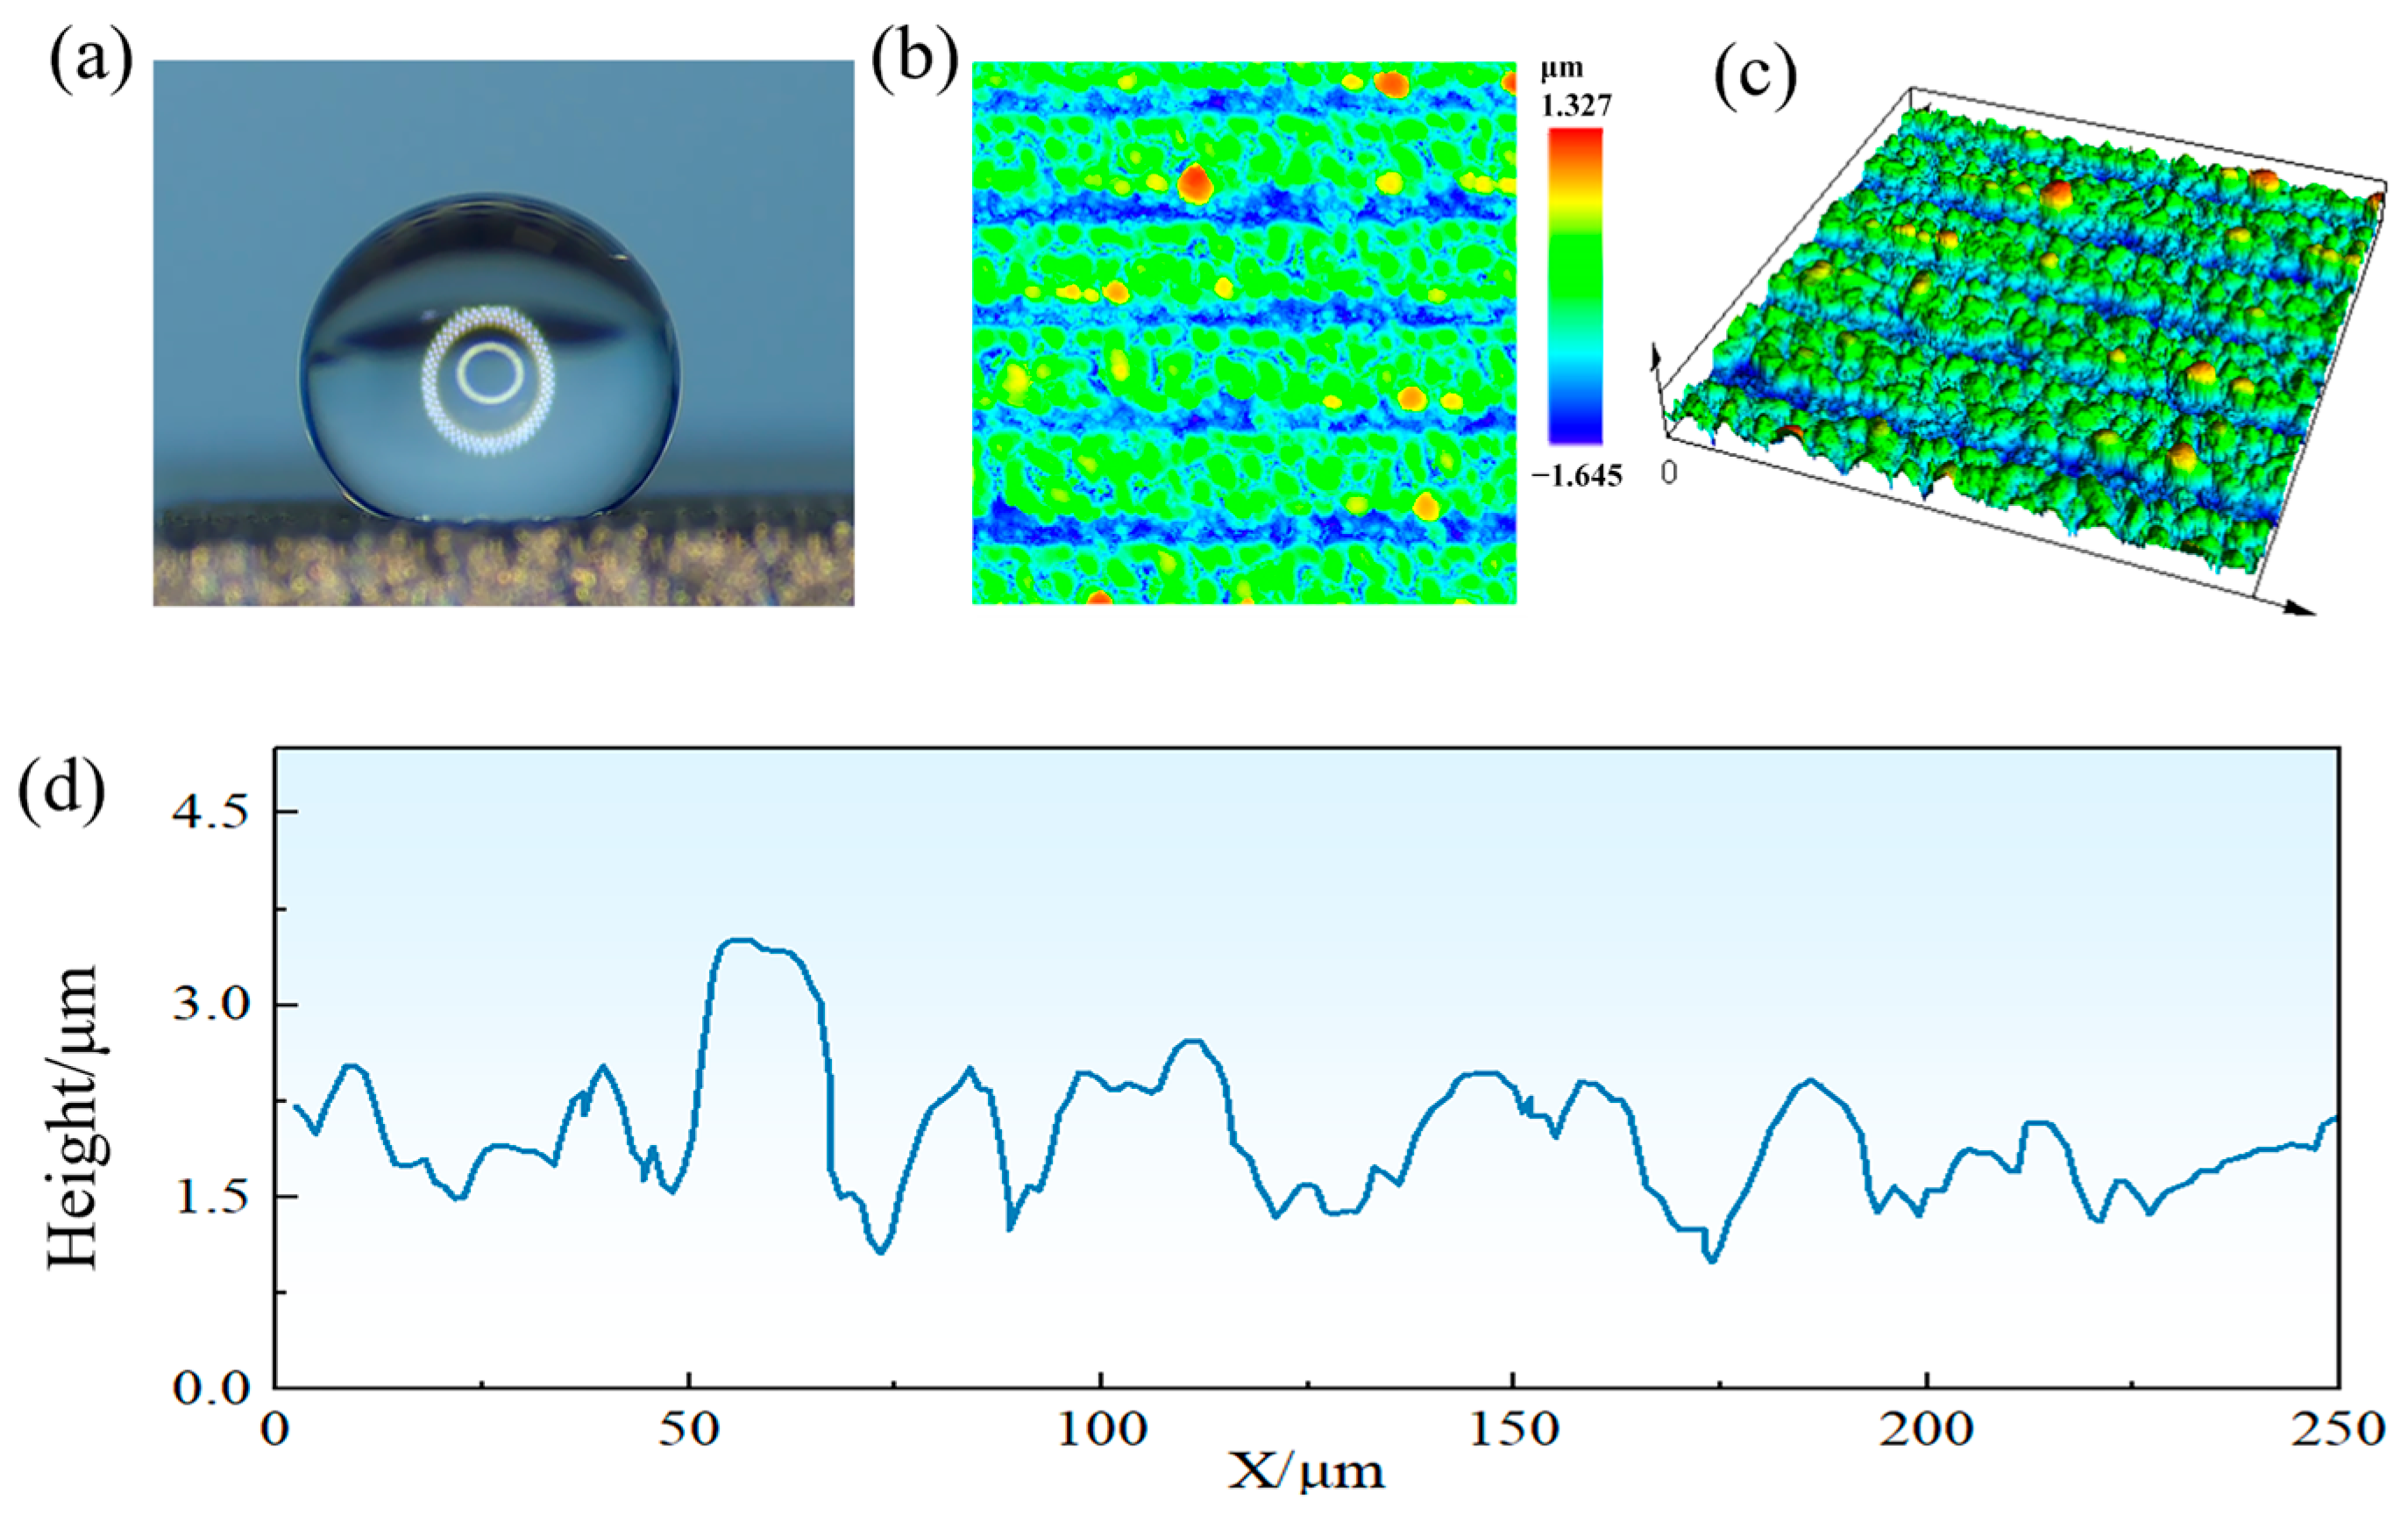
Based on the characteristics of laser-induced micro-groove structures, the shallow layer mechanisms of hydrophilicity and hydrophobicity can be qualitatively summarized. For micro-groove structures with a low aspect ratio, an excessively large spacing prevents the surface from effectively supporting the liquid droplets, which then penetrate into the gaps of the micro-structures, resulting in a small CA. In contrast, micro-grooves with a large aspect ratio couple with the nanoscale particles attached to the surface to form a porous structure, which supports the liquid droplets and reduces their contact with the surface, thus exhibiting an excellent hydrophobic performance.
(3)
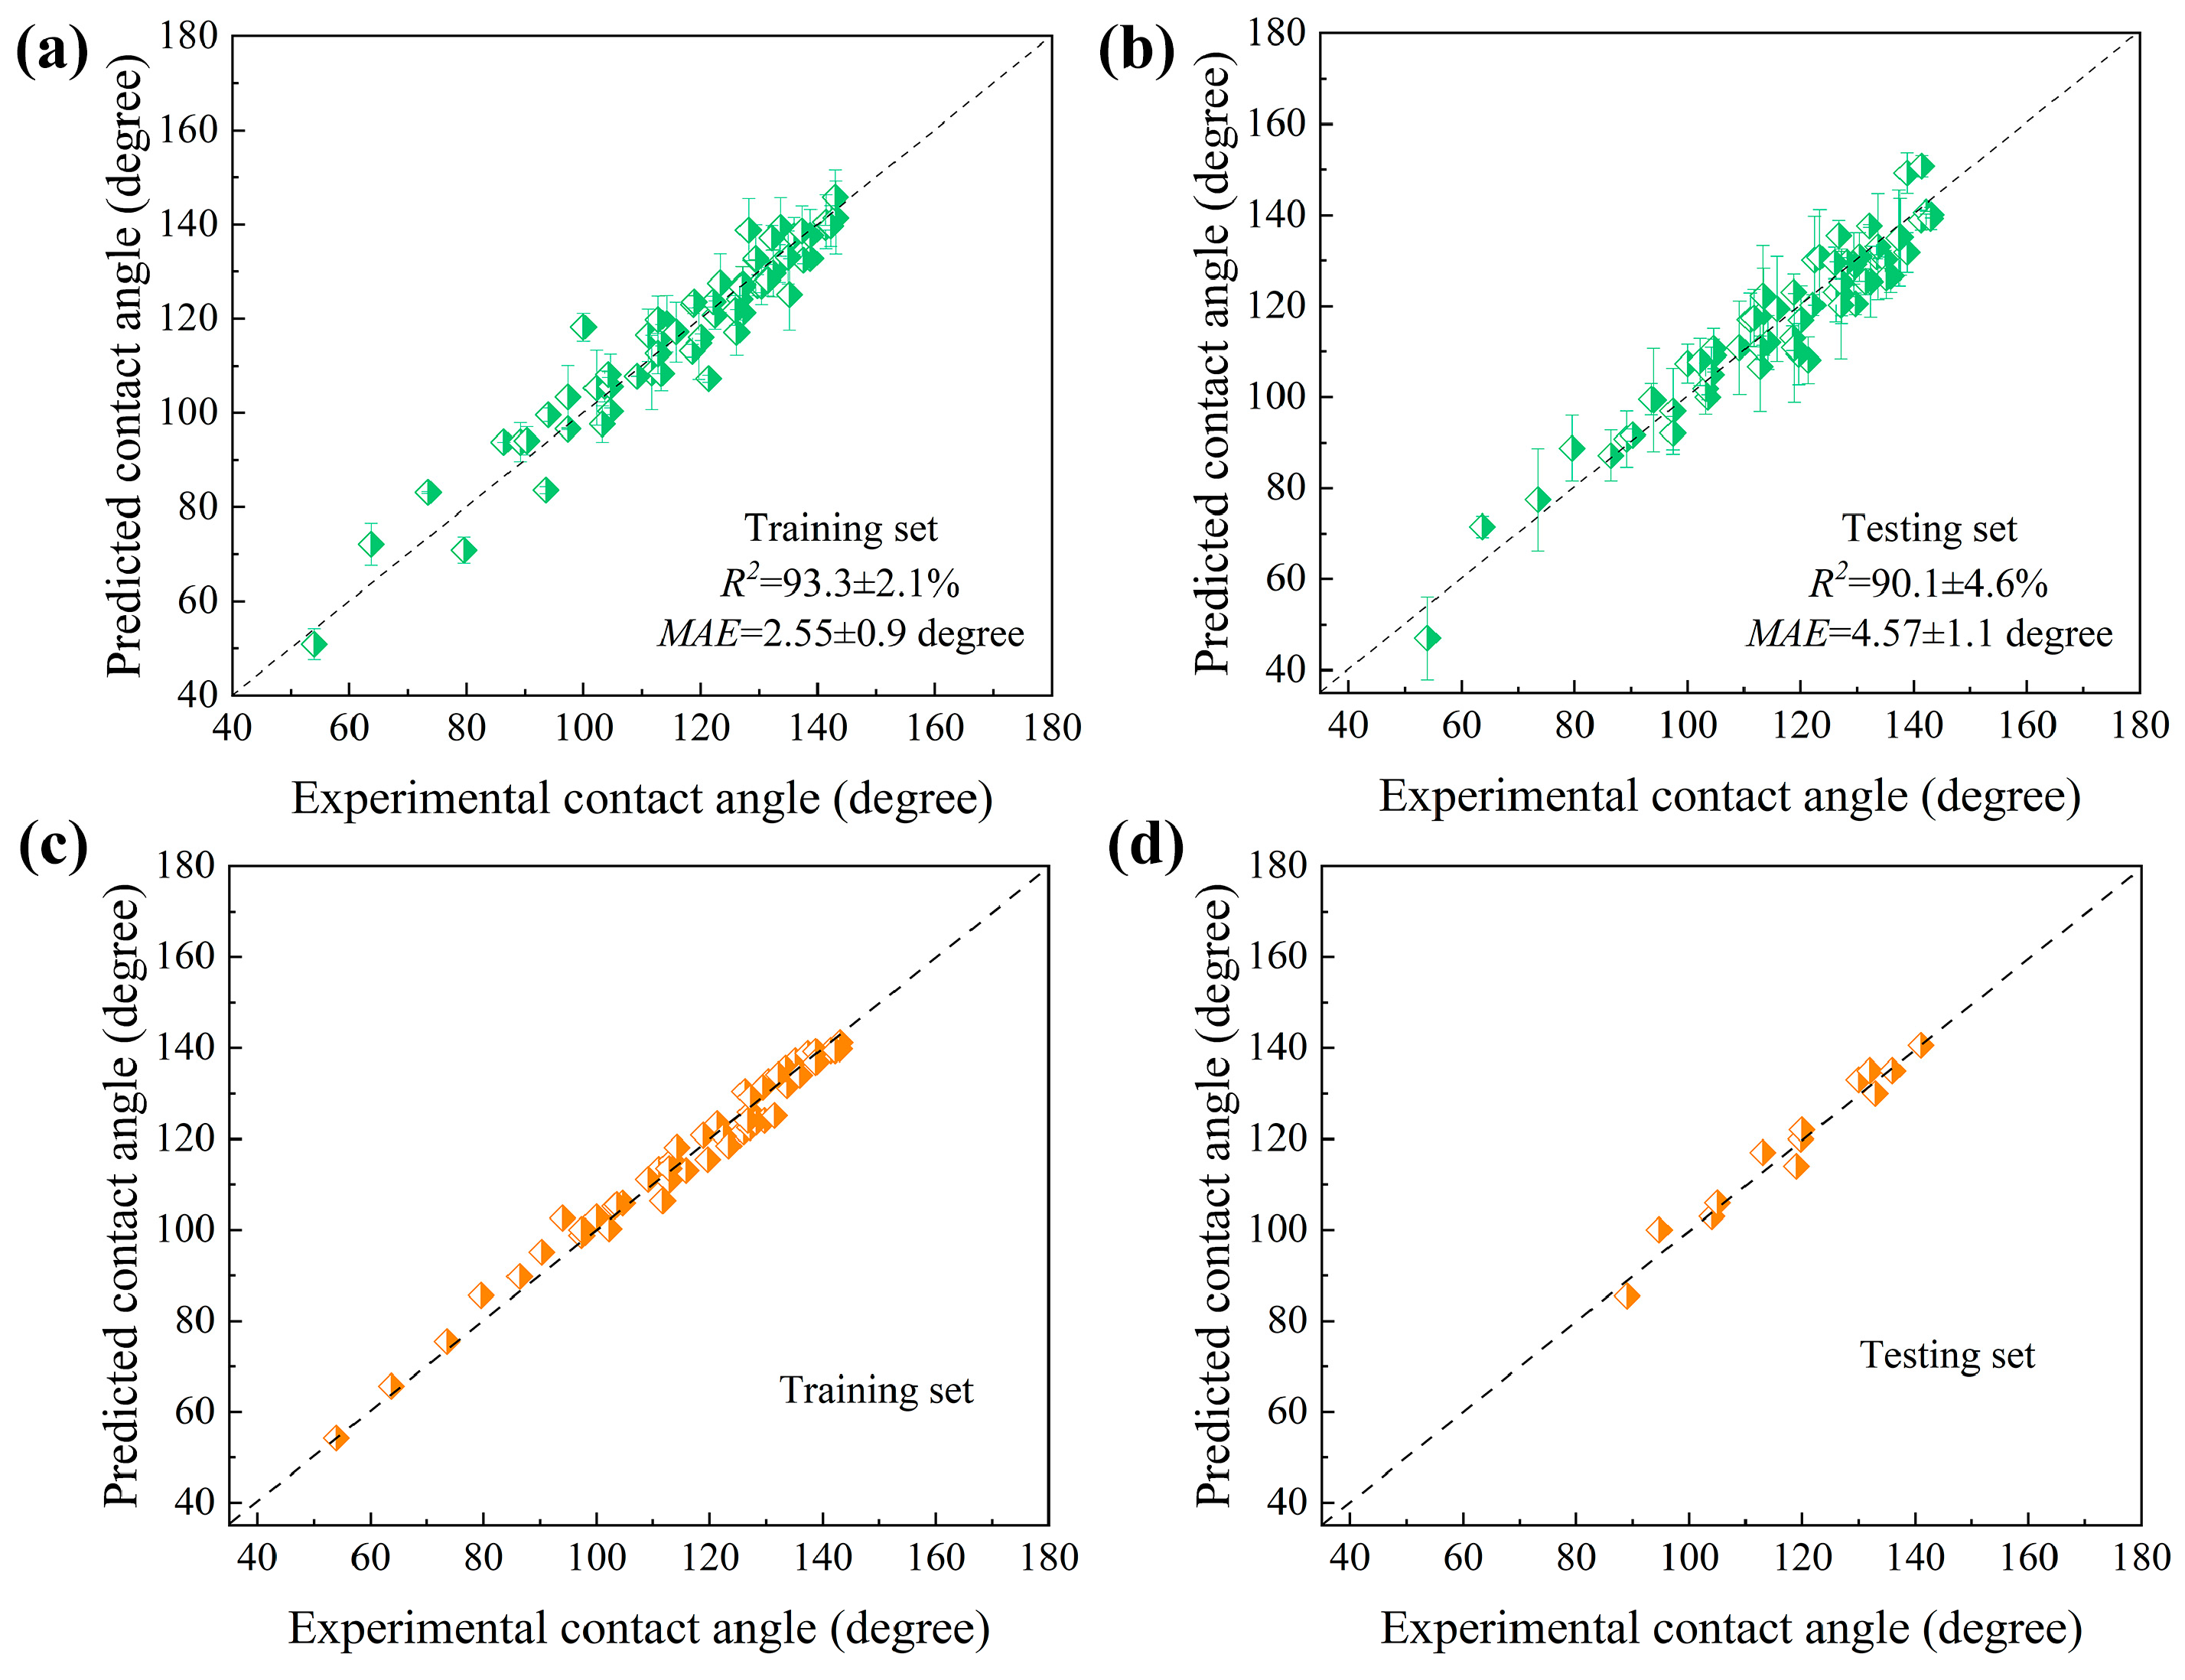
Prediction models for the relationship between femtosecond laser process parameters and the contact angle were successfully established using various machine learning algorithms. The SVR algorithm exhibited the optimal prediction accuracy. For the training set and the testing set, the R2 and MAE were 90.1 ± 4.6%, 3.3 ± 2.1%, 2.55 ± 0.89 degrees, and 4.57 ± 1.11 degrees, respectively. Compared with using only pure process parameters, the introduction of additional variables such as the number of effective pulses, energy deposition rate, and roughness enriches the dataset available for training, improves the model accuracy, and provides a solution for constructing a reliable prediction model with a small sample size.
(4)
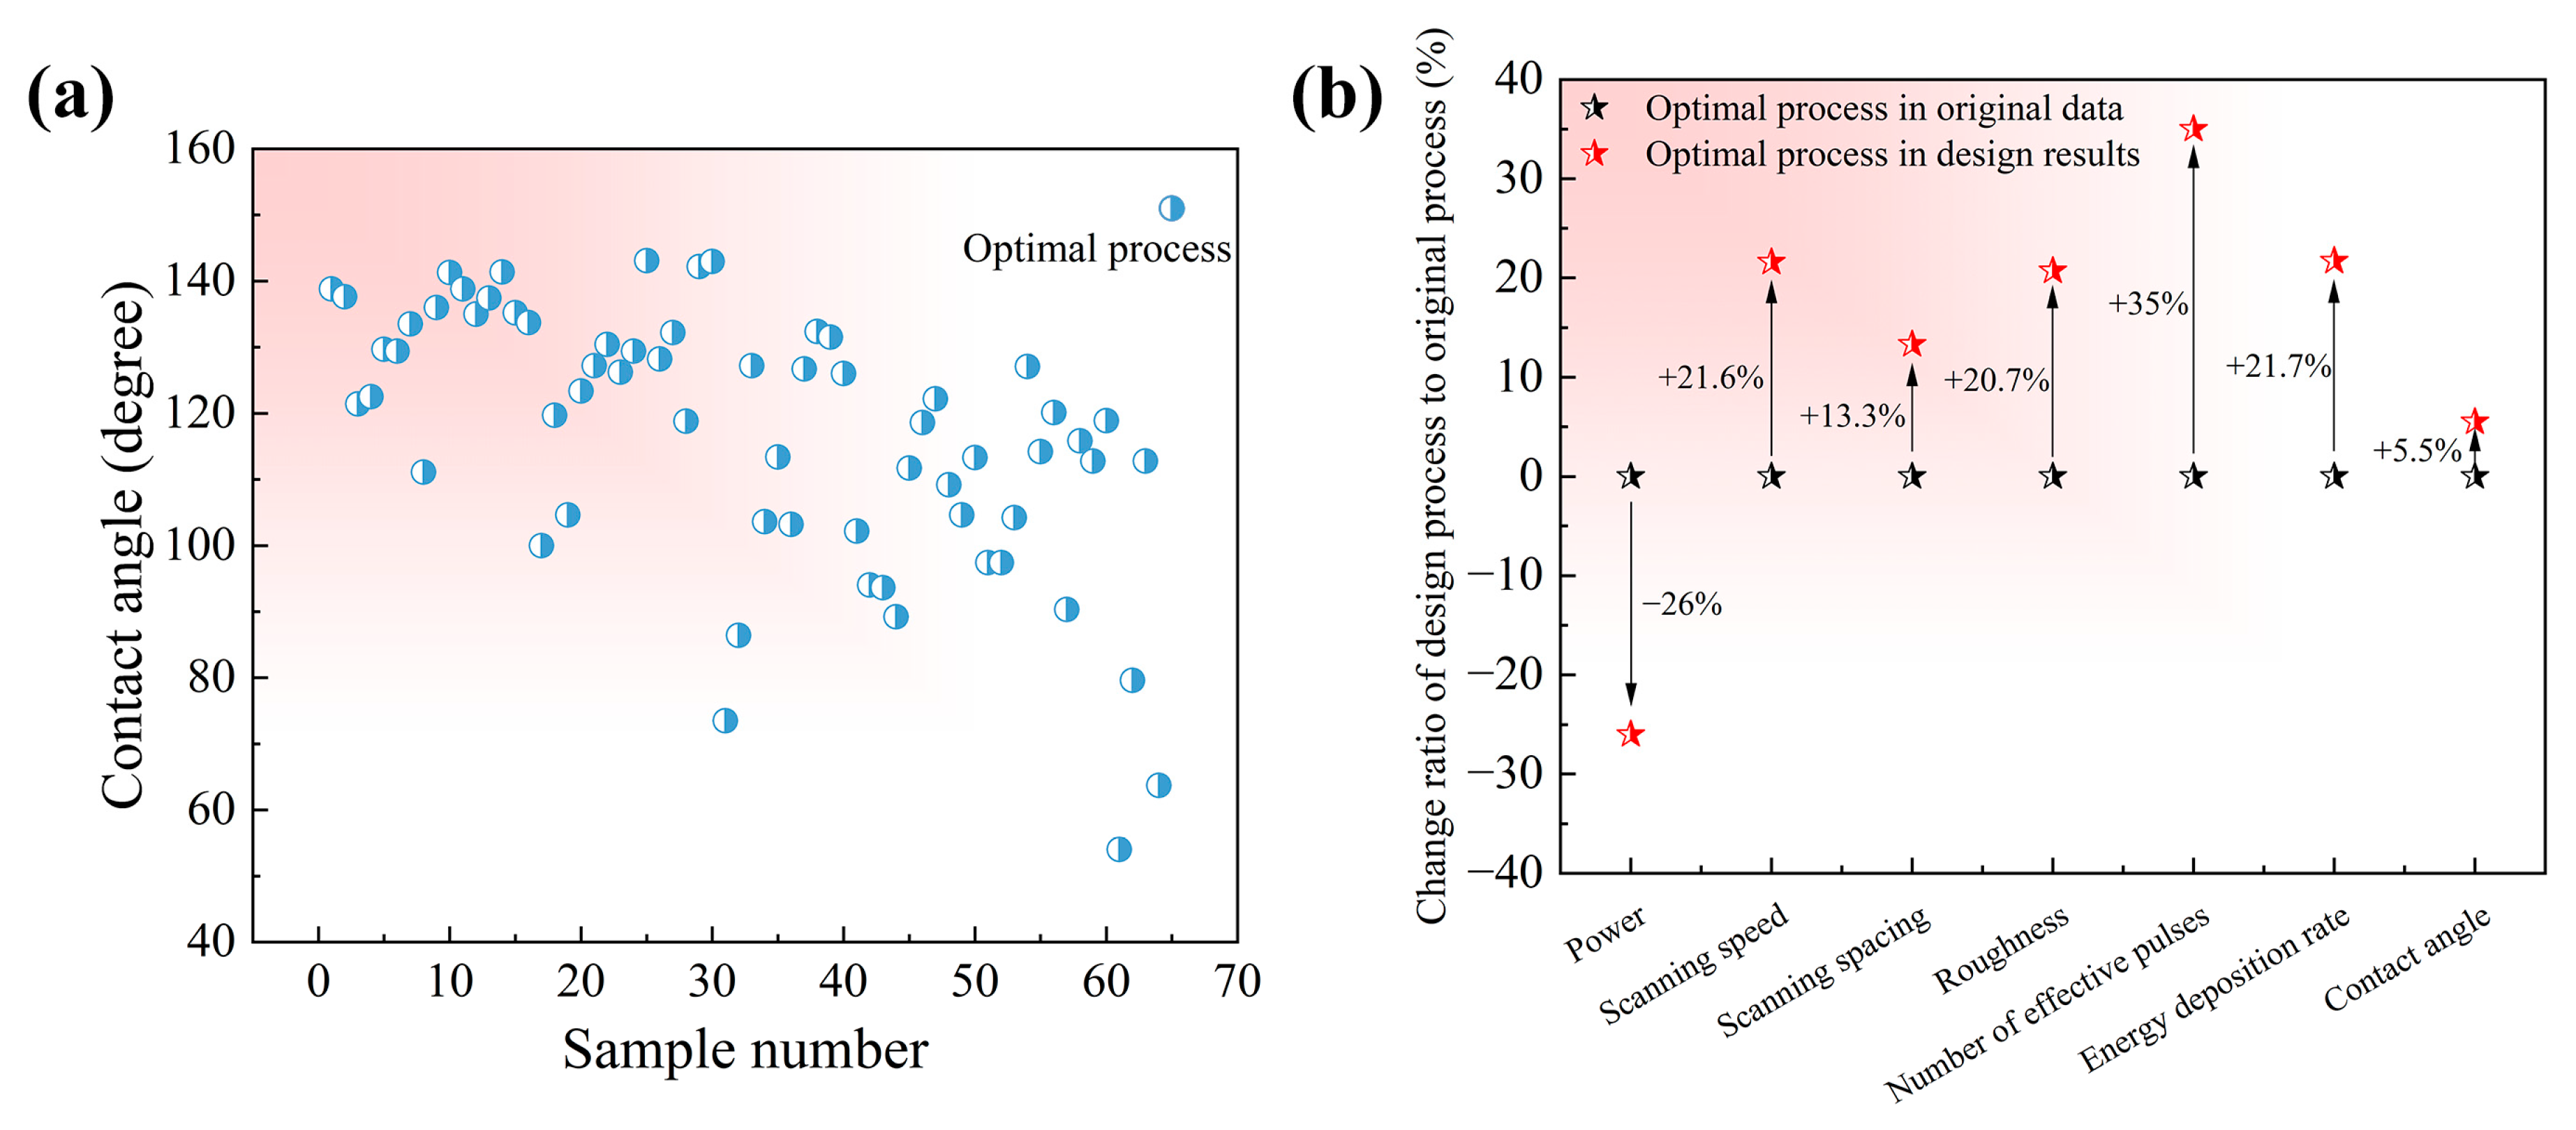
The combination of the machine learning model and the GA efficiently achieved the optimization of multi-dimensional laser processes, effectively improving the hydrophobic performance. Compared with the optimal performance in the original dataset, the CA of the designed process increased by 5.5%, reaching 151 degrees. Moreover, the designed process was significantly different from the optimal process in the original dataset, and the complex parameter combination made it difficult to obtain this process scheme by experimental exploration. The framework combining machine learning and the GA provides a feasible method for process optimization in the complex problem of femtosecond laser-induced superhydrophobic structures, and can be extended to other laser material processing fields.

Author Contributions

Funding acquisition, Z.Z.; methodology, L.W. and Z.Z.; software, Y.G.; formal analysis, J.W. and Y.J.; data curation, X.T.; investigation, Y.G.; resources, S.L. (Shuo Liu); writing—original draft preparation, L.W. and J.X.; writing—review and editing, Z.Z. and J.X.; supervision, Z.Z. and S.L. (Shiying Liu). All authors have read and agreed to the published version of the manuscript.

Funding

This work was funded by the Science Research Project of Hebei Education Department (BJ2025185) and the Natural Science Foundation of Hebei Province (E2024202066).

Institutional Review Board Statement

Not applicable.

Informed Consent Statement

Not applicable.

Data Availability Statement

The data presented in this study are available from the corresponding author upon request.

Conflicts of Interest

Author Jun Wang, Yan Jia, Zhen Zhang and Shiying Liu were employed by the company Binzhou Bohai Piston Co., Ltd. The remaining authors declare that the research was conducted in the absence of any commercial or financial relationships that could be construed as a potential conflict of interest.

References

  1. Qi, Y.; Yang, Z.; Huang, W.; Zhang, J. Robust superhydrophobic surface for anti-icing and cooling performance: Application of fluorine-modified TiO2 and fumed SiO2. Appl. Surf. Sci. 2021, 538, 148131. [Google Scholar] [CrossRef]
  2. Wang, K.; Yu, S.; Li, W.; Song, Y.; Gong, P.; Zhang, M.; Li, H.; Sun, D.; Yang, X.; Wang, X. Superhydrophobic and photocatalytic synergistic Self-Cleaning ZnS coating. Appl. Surf. Sci. 2022, 595, 153565. [Google Scholar] [CrossRef]
  3. Wu, C.; Liu, Q.; Chen, R.; Liu, J.; Zhang, H.; Li, R.; Takahashi, K.; Liu, P.; Wang, J. Fabrication of ZIF-8@ SiO2 micro/nano hierarchical superhydrophobic surface on AZ31 magnesium alloy with impressive corrosion resistance and abrasion resistance. ACS Appl. Mater. Interfaces 2017, 9, 11106–11115. [Google Scholar] [CrossRef] [PubMed]
  4. Zhou, R.; Lin, S.; Shen, F.; Khew, S.Y.; Hong, M. A universal copper mesh with on-demand wettability fabricated by pulsed laser ablation for oil/water separation. Surf. Coat. Tech. 2018, 348, 73–80. [Google Scholar] [CrossRef]
  5. He, Y.; Yin, K.; Wang, L.; Wu, T.; Chen, Y.; Arnusch, C.J. Femtosecond laser structured black superhydrophobic cork for efficient solar-driven cleanup of crude oil. Appl. Phys. Lett. 2024, 124, 171601. [Google Scholar] [CrossRef]
  6. Wang, C.; Liu, X.; Huang, H.; Wang, S.; Li, B.; Wang, X.; Deng, H.; Shen, G. FEM-ANN coupling dynamic prediction of residual stresses induced by laser shock peening of TC4 titanium alloy. Opt. Laser Technol. 2024, 179, 111395. [Google Scholar] [CrossRef]
  7. Zha, S.; Zhang, H.; Yang, J.; Zhang, Z.; Qi, X.; Zu, Q. Fatigue Threshold and Microstructure Characteristic of TC4 Titanium Alloy Processed by Laser Shock. Metals 2025, 15, 453. [Google Scholar] [CrossRef]
  8. Das, S.; Kumar, S.; Samal, S.K.; Mohanty, S.; Nayak, S.K. A review on superhydrophobic polymer nanocoatings: Recent development and applications. Ind. Eng. Chem. Res. 2018, 57, 2727–2745. [Google Scholar] [CrossRef]
  9. Kamal, S.A.A.; Ritikos, R.; Rahman, S.A. Wetting behaviour of carbon nitride nanostructures grown by plasma enhanced chemical vapour deposition technique. Appl. Surf. Sci. 2015, 328, 146–153. [Google Scholar] [CrossRef]
  10. Wang, L.; Yin, K.; Deng, Q.; Huang, Q.; Arnusch, C.J. Multiscale hybrid-structured femtosecond laser-induced graphene with outstanding photo-electro-thermal effects for all-day anti-icing/deicing. Carbon 2024, 219, 118824. [Google Scholar] [CrossRef]
  11. Myronyuk, O.; Baklan, D.; Rodin, A.M. UV resistance of super-hydrophobic stainless steel surfaces textured by femtosecond laser pulses. Photonics 2023, 10, 1005. [Google Scholar] [CrossRef]
  12. Yang, Q.; Yu, M.; Chen, Z.; Ai, S.; Kentsch, U.; Zhou, S.; Jia, Y.; Chen, F.; Liu, H. A novel approach towards robust construction of physical colors on lithium niobate crystal. Opto-Electron. Adv. 2025, 8, 240193. [Google Scholar] [CrossRef]
  13. Yin, S.-Y.; Guo, Q.; Liu, S.-R.; He, J.-W.; Yu, Y.-S.; Tian, Z.-N.; Chen, Q.-D. Three-dimensional multichannel waveguide grating filters. Opto-Electron. Sci. 2024, 3, 240003. [Google Scholar] [CrossRef]
  14. Miao, B.; Wang, L.; Zhang, T.; Zhang, Z.; Wang, C. Fabrication of micro-nano gradient wettability surface by nanosecond laser and thermal oxidation. Appl. Phys. A 2025, 131, 202. [Google Scholar] [CrossRef]
  15. Zhang, Z.; Yang, Z.; Zhao, Z.; Liu, Y.; Wang, C.; Xu, W. Multimodal deep-learning framework for accurate prediction of wettability evolution of laser-textured surfaces. ACS Appl. Mater. Interfaces 2023, 15, 10261–10272. [Google Scholar] [CrossRef]
  16. Tang, Y.; Yang, R.; Feng, B.; Lin, D.; Guo, W.; Cai, Y. Fabricating superhydrophobic surfaces of silicone rubber with laser abalation. Appl. Surf. Sci. 2025, 701, 163286. [Google Scholar] [CrossRef]
  17. Sun, X.; Pan, R.; Xu, J.; Zhang, S.; Zhou, T.; Shi, Y.; Liu, W.; Chen, P.; Chen, S. Enhanced superhydrophobicity of acrylic polyurethane coatings by femtosecond laser ablation. Prog. Org. Coat. 2024, 197, 108874. [Google Scholar] [CrossRef]
  18. Zhang, Z.; Jia, M.; Zhang, T.; Yu, Y.; Yang, Z.; Wang, Y.; Wang, C.; Lv, Z.; Xu, W. Efficient prediction of long-term wettability evolution in laser-textured surfaces using short-term data and cyclic deep learning. Opt. Laser Technol. 2025, 184, 112558. [Google Scholar] [CrossRef]
  19. Kusumaatmaja, H.; Yeomans, J. Modeling contact angle hysteresis on chemically patterned and superhydrophobic surfaces. Langmuir 2007, 23, 6019–6032. [Google Scholar] [CrossRef]
  20. Li, W.; Amirfazli, A. Microtextured superhydrophobic surfaces: A thermodynamic analysis. Adv. Colloid. Interface Sci. 2007, 132, 51–68. [Google Scholar] [CrossRef]
  21. Moradi, S.; Englezos, P.; Hatzikiriakos, S.G. Contact Angle Hysteresis of Non-Flattened-Top Micro/Nanostructures. Langmuir 2014, 30, 3274–3284. [Google Scholar] [CrossRef]
  22. Wang, C.; Xu, W. Overview: Integration and Development of Physical Models and Artificial Intelligence in Alloy Design. Acta Met. Sin. 2025, 61, 541–560. [Google Scholar]
  23. Murzin, S.P. Digital Engineering in Diffractive Optics for Precision Laser Processing. Photonics 2025, 12, 306. [Google Scholar] [CrossRef]
  24. Zhang, Z.; Liu, S.; Zhang, Y.; Wang, C.; Zhang, S.; Yang, Z.; Xu, W. Optimization of low-power femtosecond laser trepan drilling by machine learning and a high-throughput multi-objective genetic algorithm. Opt. Laser Technol. 2022, 148, 107688. [Google Scholar] [CrossRef]
  25. Liu, S.; Zhang, Z.; Yang, Z.; Wang, C. Femtosecond laser-induced evolution of surface micro-structure in depth direction of nickel-based alloy. Appl. Sci. 2022, 12, 8464. [Google Scholar] [CrossRef]
  26. Shen, C.; Wang, C.; Wei, X.; Li, Y.; van der Zwaag, S.; Xu, W. Physical metallurgy-guided machine learning and artificial intelligent design of ultrahigh-strength stainless steel. Acta Mater. 2019, 179, 201–214. [Google Scholar] [CrossRef]
  27. Khan, S.A.; Boltaev, G.S.; Iqbal, M.; Kim, V.; Ganeev, R.A.; Alnaser, A.S. Ultrafast fiber laser-induced fabrication of superhydrophobic and self-cleaning metal surfaces. Appl. Surf. Sci. 2021, 542, 148560. [Google Scholar] [CrossRef]
  28. Vasiliev, M.M.; Shukhov, Y.G.; Rodionov, A.A.; Sulyaeva, V.S.; Markovich, D.M.; Starinskiy, S.V. Why do metals become superhydrophilic during nanosecond laser processing? Design of superhydrophilic, anisotropic and biphilic surfaces. Appl. Surf. Sci. 2024, 653, 159392. [Google Scholar] [CrossRef]
  29. Sen, B.; Hussain, S.A.I.; Mia, M.; Mandal, U.K.; Mondal, S.P. Selection of an ideal MQL-assisted milling condition: An NSGA-II-coupled TOPSIS approach for improving machinability of Inconel 690. Int. J. Adv. Manuf. Technol. 2019, 103, 1811–1829. [Google Scholar] [CrossRef]
  30. Han, H.; Yu, R.; Li, B.; Zhang, Y. Multi-objective optimization of corrugated tube inserted with multi-channel twisted tape using RSM and NSGA-II. Appl. Therm. Eng. 2019, 159, 113731. [Google Scholar] [CrossRef]
  31. Cassie, A.; Baxter, S. Wettability of porous surfaces. Trans. Faraday Soc. 1944, 40, 546–551. [Google Scholar] [CrossRef]
Figure 1. The experimental setup of the femtosecond laser system.
Photonics 12 00530 g001
Figure 2. Schematic diagram of the proposed machine learning framework.
Photonics 12 00530 g002
Figure 3. Microstructure surface profile induced by different laser powers: (a) 2 W, (a1) front view and linear scanning contour of (a), (b) 4 W, (b1) front view and linear scanning contour of (b), (c) 6 W, (c1) front view and linear scanning contour of (c), and (d) 8 W, (d1) front view and linear scanning contour of (d).
Photonics 12 00530 g003
Figure 4. The PV values and roughness of microstructures induced by different laser processes: (a) PV of different powers and scanning intervals, (b) roughness of different powers and scanning intervals, (c) PV of different scanning speeds, and (d) roughness of different scanning speeds.
Photonics 12 00530 g004
Figure 5. Wettability of microstructure surface induced by different laser parameters: (a) 10 mm/s, (b) 50 mm/s, (c) 100 mm/s, and (d) 200 mm/s.
Photonics 12 00530 g005
Figure 6. Surface morphology and water contact angle of hydrophilic sample: (a) droplet morphology, (b) front view of surface morphology, (c) oblique view of surface morphology, and (d) 2D profile of linear scan in (b).
Photonics 12 00530 g006
Figure 7. Surface morphology and water contact angle of hydrophobic sample: (a) droplet morphology, (b) front view of surface morphology, (c) oblique view of surface morphology, and (d) 2D profile of linear scan in (b).
Photonics 12 00530 g007
Figure 8. The prediction accuracies of different machine learning models: (a) R2 of different algorithms, (b) MAE of different algorithms, (c) R2 of different data inputs, and (d) MAE of different data inputs.
Photonics 12 00530 g008
Figure 9. Prediction results of CA for 100 different partitions by SVR: (a) training set of mean result, (b) testing set of mean result, (c) training set of optimal result, and (d) testing set of optimal result.
Photonics 12 00530 g009
Figure 10. (a) Comparison of the CA of the original dataset and designed results; (b) comparison of the optimal process in the original dataset and design results.
Photonics 12 00530 g010
Figure 11. Surface morphology and water contact angle of micro-groove structures obtained by optimal laser parameters: (a) droplet morphology, (b) front view of surface morphology, (c) oblique view of surface morphology, and (d) 2D profile of linear scan in (b).
Photonics 12 00530 g011
Table 1. Values of the inputs and outputs from the experimental datasets.
VariablesMaximumMinimumAverageStandard Deviation
InputsLaser power (W)82//
Scanning speed (mm/s)20010//
Scanning spacing (μm)6030//
Effective number of pulses50.25//
Energy deposition rate (μJ/μm2·s)40761019//
Roughness (μm)9.90.1//
OutputsContact angle (degree)14354116.919.7
Disclaimer/Publisher’s Note: The statements, opinions and data contained in all publications are solely those of the individual author(s) and contributor(s) and not of MDPI and/or the editor(s). MDPI and/or the editor(s) disclaim responsibility for any injury to people or property resulting from any ideas, methods, instructions or products referred to in the content.

