1. Introduction
Underwater optical imaging is a crucial component of underwater target detection systems, with significant applications in various fields such as marine resource exploration, maritime search and rescue, and aquaculture [
1,
2,
3]. Typically, light propagation underwater is subject to absorption and scattering by water particles, leading to diminished brightness, sharpness, and resolution in underwater imaging and thus severely impacting the detection and identification of underwater targets [
4,
5,
6]. Polarization imaging technology has garnered considerable attention in recent years, with researchers from numerous universities and technology companies integrating it into underwater detection systems to effectively mitigate the impact of scattering media on imaging quality, thereby enhancing target detection accuracy [
7,
8,
9].
In recent years, polarization imaging technology has been successfully applied in diverse fields encompassing atmospheric detection [
10], astronomical exploration [
11], Earth resource exploration [
12], and military reconnaissance [
13]. Its applications extend beyond air or vacuum environments, playing a pivotal role in marine engineering and underwater scientific research as well. For instance, this technology is utilized in marine biological monitoring, assessments of marine biodiversity, underwater archaeology, and maritime rescue and navigation. Compared to those in vacuum and atmospheric environments, underwater polarization imaging environments present heightened complexity. This complexity arises from the stark contrast in refractive index values between seawater and air, coupled with the abundance of organic and inorganic substances in seawater. The presence of numerous suspended particulates in seawater leads to the pronounced absorption and scattering of light, resulting in substantial attenuation of light propagation. Regrettably, conventional methods have proven inadequate in effectively enhancing the quality of underwater imaging [
14,
15,
16].
Polarization imaging has emerged as a promising approach to effectively mitigate underwater scattering and bolster target detection contrast within scattering media, improving image quality. Consequently, underwater polarization imaging has garnered considerable attention as a hotspot of research. Chenault et al. utilized milk solutions to emulate underwater scattering environments and discerned targets through polarization calculations, showcasing the capacity of polarization information to improve imaging quality in scattering media [
17]. Qiu et al. detected targets in turbid underwater settings by employing the cross-polarized intensity, leveraging polarization information to augment target contrast underwater. Their research indicated that imaging with circularly polarized light yields superior signal-to-noise ratios [
18]. Ni et al. isolated background stray light from target polarized light, revealing that light sources emitting distinct polarization states can be effectively used to detect various underwater scenes [
19]. Pan et al., through in situ experiments, investigated the capability for bottom-up detection of underwater targets using polarization imaging [
20]. These findings underscore the potential of underwater polarization imaging to enhance the accuracy of underwater target detection. In addition to polarization-based approaches, adaptive optics technology has shown strong potential for improving image quality in scattering environments by compensating for optical aberrations in real time. Galaktionov et al. demonstrated that a phase-only spatial light modulator could effectively focus a laser beam through a moderately scattering medium, achieving improved resolution and focal intensity [
21]. Furthermore, Bonora et al. proposed an underwater imaging system based on adaptive optics, highlighting the feasibility of wavefront correction in marine environments [
22]. Although AO has not yet been widely applied in compact deep-sea systems, these techniques suggest an important direction for the future optimization of underwater imaging platforms. However, for deep-sea imaging systems operating at depths reaching several thousand meters, the deformation induced by water pressure poses a challenge due to its impact on imaging quality, particularly affecting the precision of polarized signal detection. Consequently, there is an imperative for the development of optical imaging systems which can achieve stable performance in deep-sea conditions, exhibiting minimal polarization effects while delivering high-quality imaging.
To address these gaps, we also reviewed the existing underwater imaging systems implemented in previous works, including polarization-based and adaptive optics-based platforms. Unlike conventional systems with narrow fields of view and low resistance to pressure-induced distortion, our approach integrates a wide-angle oil-immersion lens with enhanced mechanical integrity and polarization response, offering a novel balance of clarity, field coverage, and robustness in deep-sea conditions. The result is a deep-sea underwater imaging system characterized by high imaging quality and low polarization effects. In this study, firstly, the principles underlying underwater polarization imaging are elucidated. Then, leveraging these principles, an oil-immersion lens with an expansive 80° field of view is crafted, facilitating clear imaging. Lastly, the polarization properties of this optical imaging system are examined, and the detection accuracy of polarization states is evaluated under various polarized state incidence and field of view conditions.
2. Principle of Underwater Full-Polarization Imaging
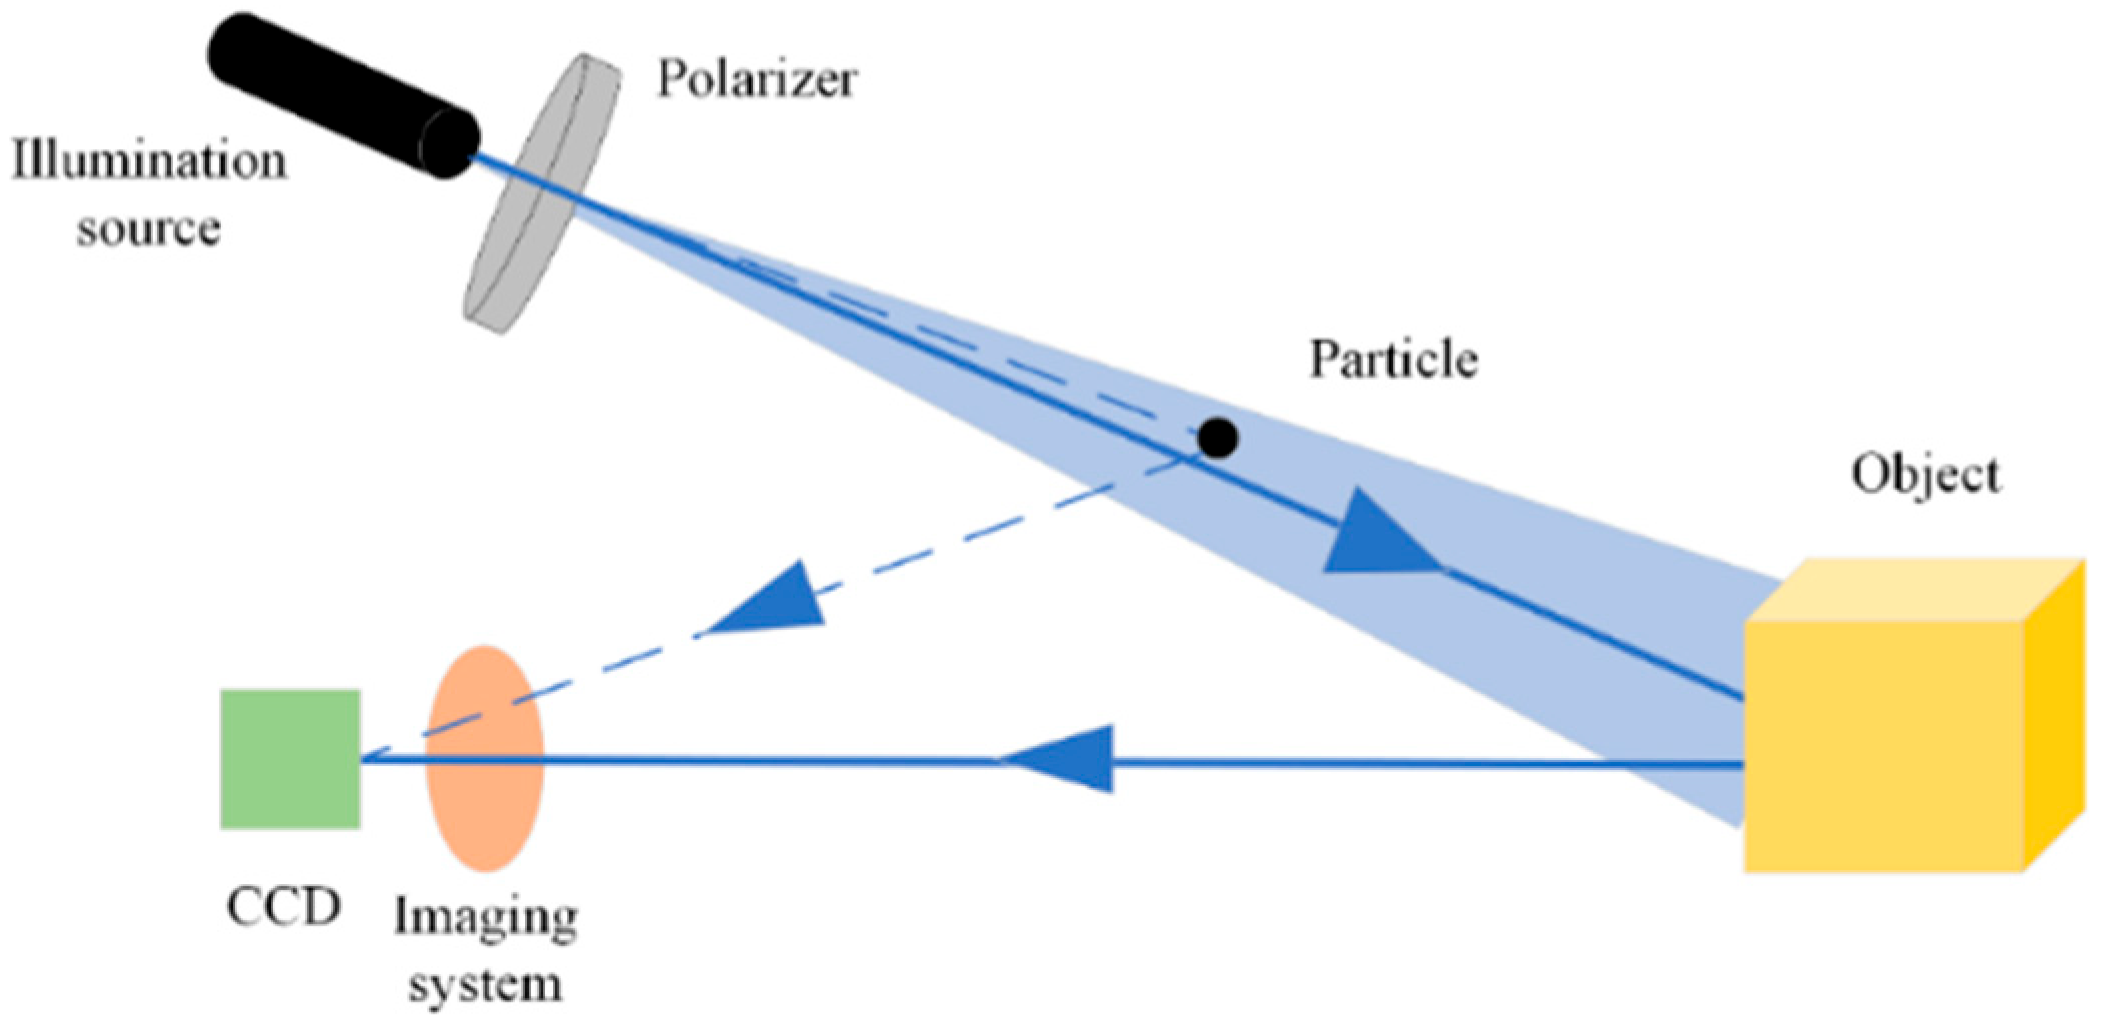
Underwater polarization imaging is an active technique utilized for underwater imaging. The operational principle of underwater full-polarization imaging is illustrated in
Figure 1. Given the attenuation of light signals due to the scattering and absorption effects of water particles, active illumination employing laser-emitted monochromatic light—often in the blue spectrum—is typically adopted. In marine environments, blue light experiences reduced attenuation compared to other visible light wavelengths, facilitating longer propagation distances and mitigating scattering effects from seawater molecules. Following laser emission, linearly polarized light is generated through a polarizer. In addition, some underwater active light sources may emit circularly polarized light. The simple addition of a quarter-wave plate behind the polarizer, with the fast-axis direction of the plate at a 45° angle to the transmission-axis direction of the polarizer, can be applied to generate circularly polarized light. During the process of irradiating the target, some light beams undergo scattering, which attenuates the light energy and affects the imaging quality of the target. Subsequently, light reflected from the object is captured by an imaging system and received by a CCD sensor, which analyzes the polarization properties of the received signal to enable polarization imaging.
The Stokes vector describes the polarization properties of light beams, which can represent fully polarized light, partially polarized light, or unpolarized light. The 4 × 4 Mueller matrix represents the polarization properties and scattering properties of optical materials, serving as the action matrix of the Stokes vector. As fully polarized light beams are depolarized into partially polarized light beams during their propagation underwater, the Mueller–Stokes method is used to calculate the polarization changes in underwater light beams from the emission end of the light source to the receiving end of the detector. The Stokes vector consists of four parameters:
where
S represents the Stokes vector,
S0 represents the total light intensity,
S1 represents the intensity difference between the horizontal and vertical polarization components,
S2 represents the intensity difference between the 45° and 135° polarization components, and
S3 represents the intensity difference between right and left circularly polarized light. The Stokes vector thus characterizes the polarization changes that occur during the light beam transmission process. The Stokes covariates must satisfy
The computational formula for underwater polarized light beams can be expressed as
where
Si represents the polarization state of the emitted laser beams, which are usually linearly polarized light or circularly polarized light;
So represents the polarization state of the received light beams;
Mo is the Mueller matrix of the object surface;
Ms is the Mueller matrix of the optical system; and
Min and
Mout are the scattering matrices of the incident medium and the reflecting medium, respectively. Typically, the underwater scattering matrix can be written as
The degree of polarization (
DOP) of the received light beam is typically computed to reconstruct the shape of the target object. The
DOP is an important parameter describing polarized light, representing the proportion of polarized light intensity with regard to the total light intensity. When the polarized light is fully polarized, the degree of polarization is 1; when the polarization is completely unpolarized, the degree of polarization is 0; when the degree of polarization is between 0 and 1, it indicates partially polarized light. With the Stokes vector, the
DOP is given by
The degree of linear polarization is given by
The degree of circular polarization is given by
3. Design of Underwater Polarization Imaging System
To enhance the utilization of underwater polarization signals and increase the distance of polarization detection, a wide-field-of-view underwater imaging system is designed. The pressure of deep-sea water can cause deformation of imaging systems, thereby reducing imaging quality and decreasing the accuracy of polarization measurements. Therefore, silicone oil with a refractive index of 1.34 (very close to that of water) is used to fill the space between the lenses. Silicone oil has high transmittance and minimal variation in its refractive index with decreasing seawater temperature. Consequently, oil-immersion camera lenses can withstand the increase in water pressure with increased diving depth, exhibiting reduced deformation. With reduced lens deformation, the overall optical performance change of the camera lens is minimized, resulting in minimal changes in imaging resolution and quality. The designed wavelength range of the system is between 400 nm and 600 nm, with a field of view of 80°. To achieve better imaging quality, non-spherical designs are adopted for all optical lenses, with their technical parameters shown in
Table 1.
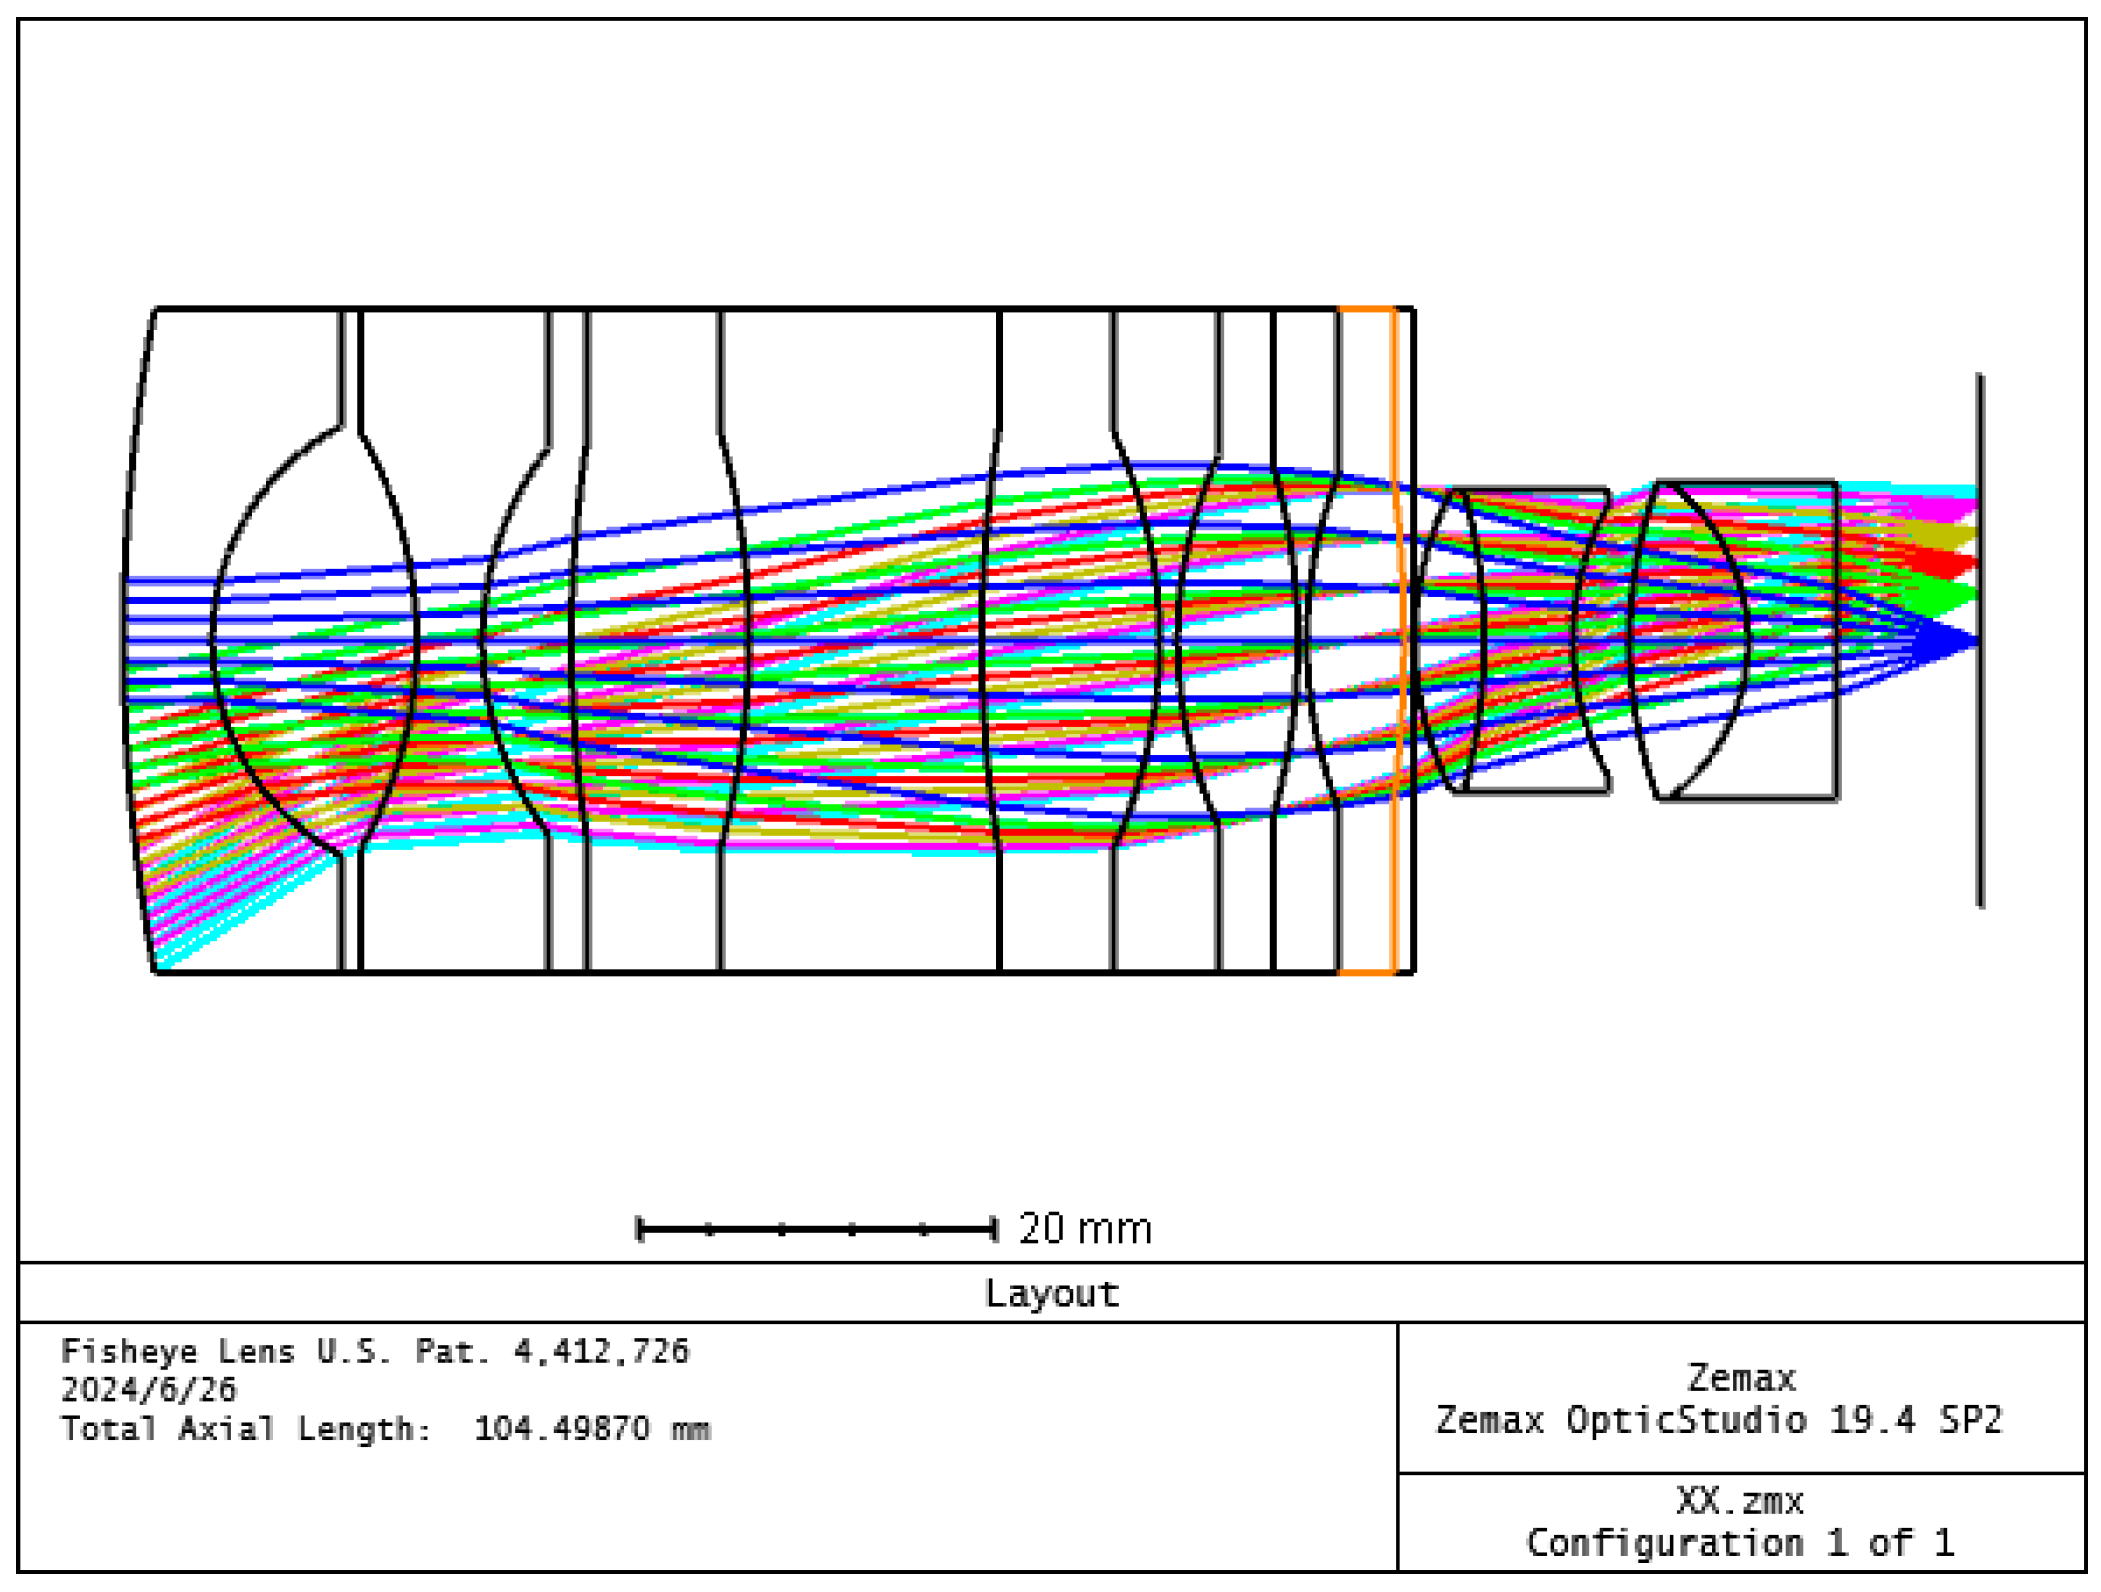
The optimized structure of the optical system is illustrated in
Figure 2, consisting of 10 lenses, including two bonded surfaces. The refractive index of the silicone oil medium between each pair of lens surfaces is 1.34; the wavelength selection is 450°, corresponding to blue light; the focal length is 9.8 mm; the F number is 1.4; the field of view is 80°; the aberration in the incidence angle of 40° is less than 3%; a 2/3-inch target surface is selected; and the imaging resolution is 4 k. The line colors in the optical path trace map correspond to various fields of view, as specified in
Table 2.
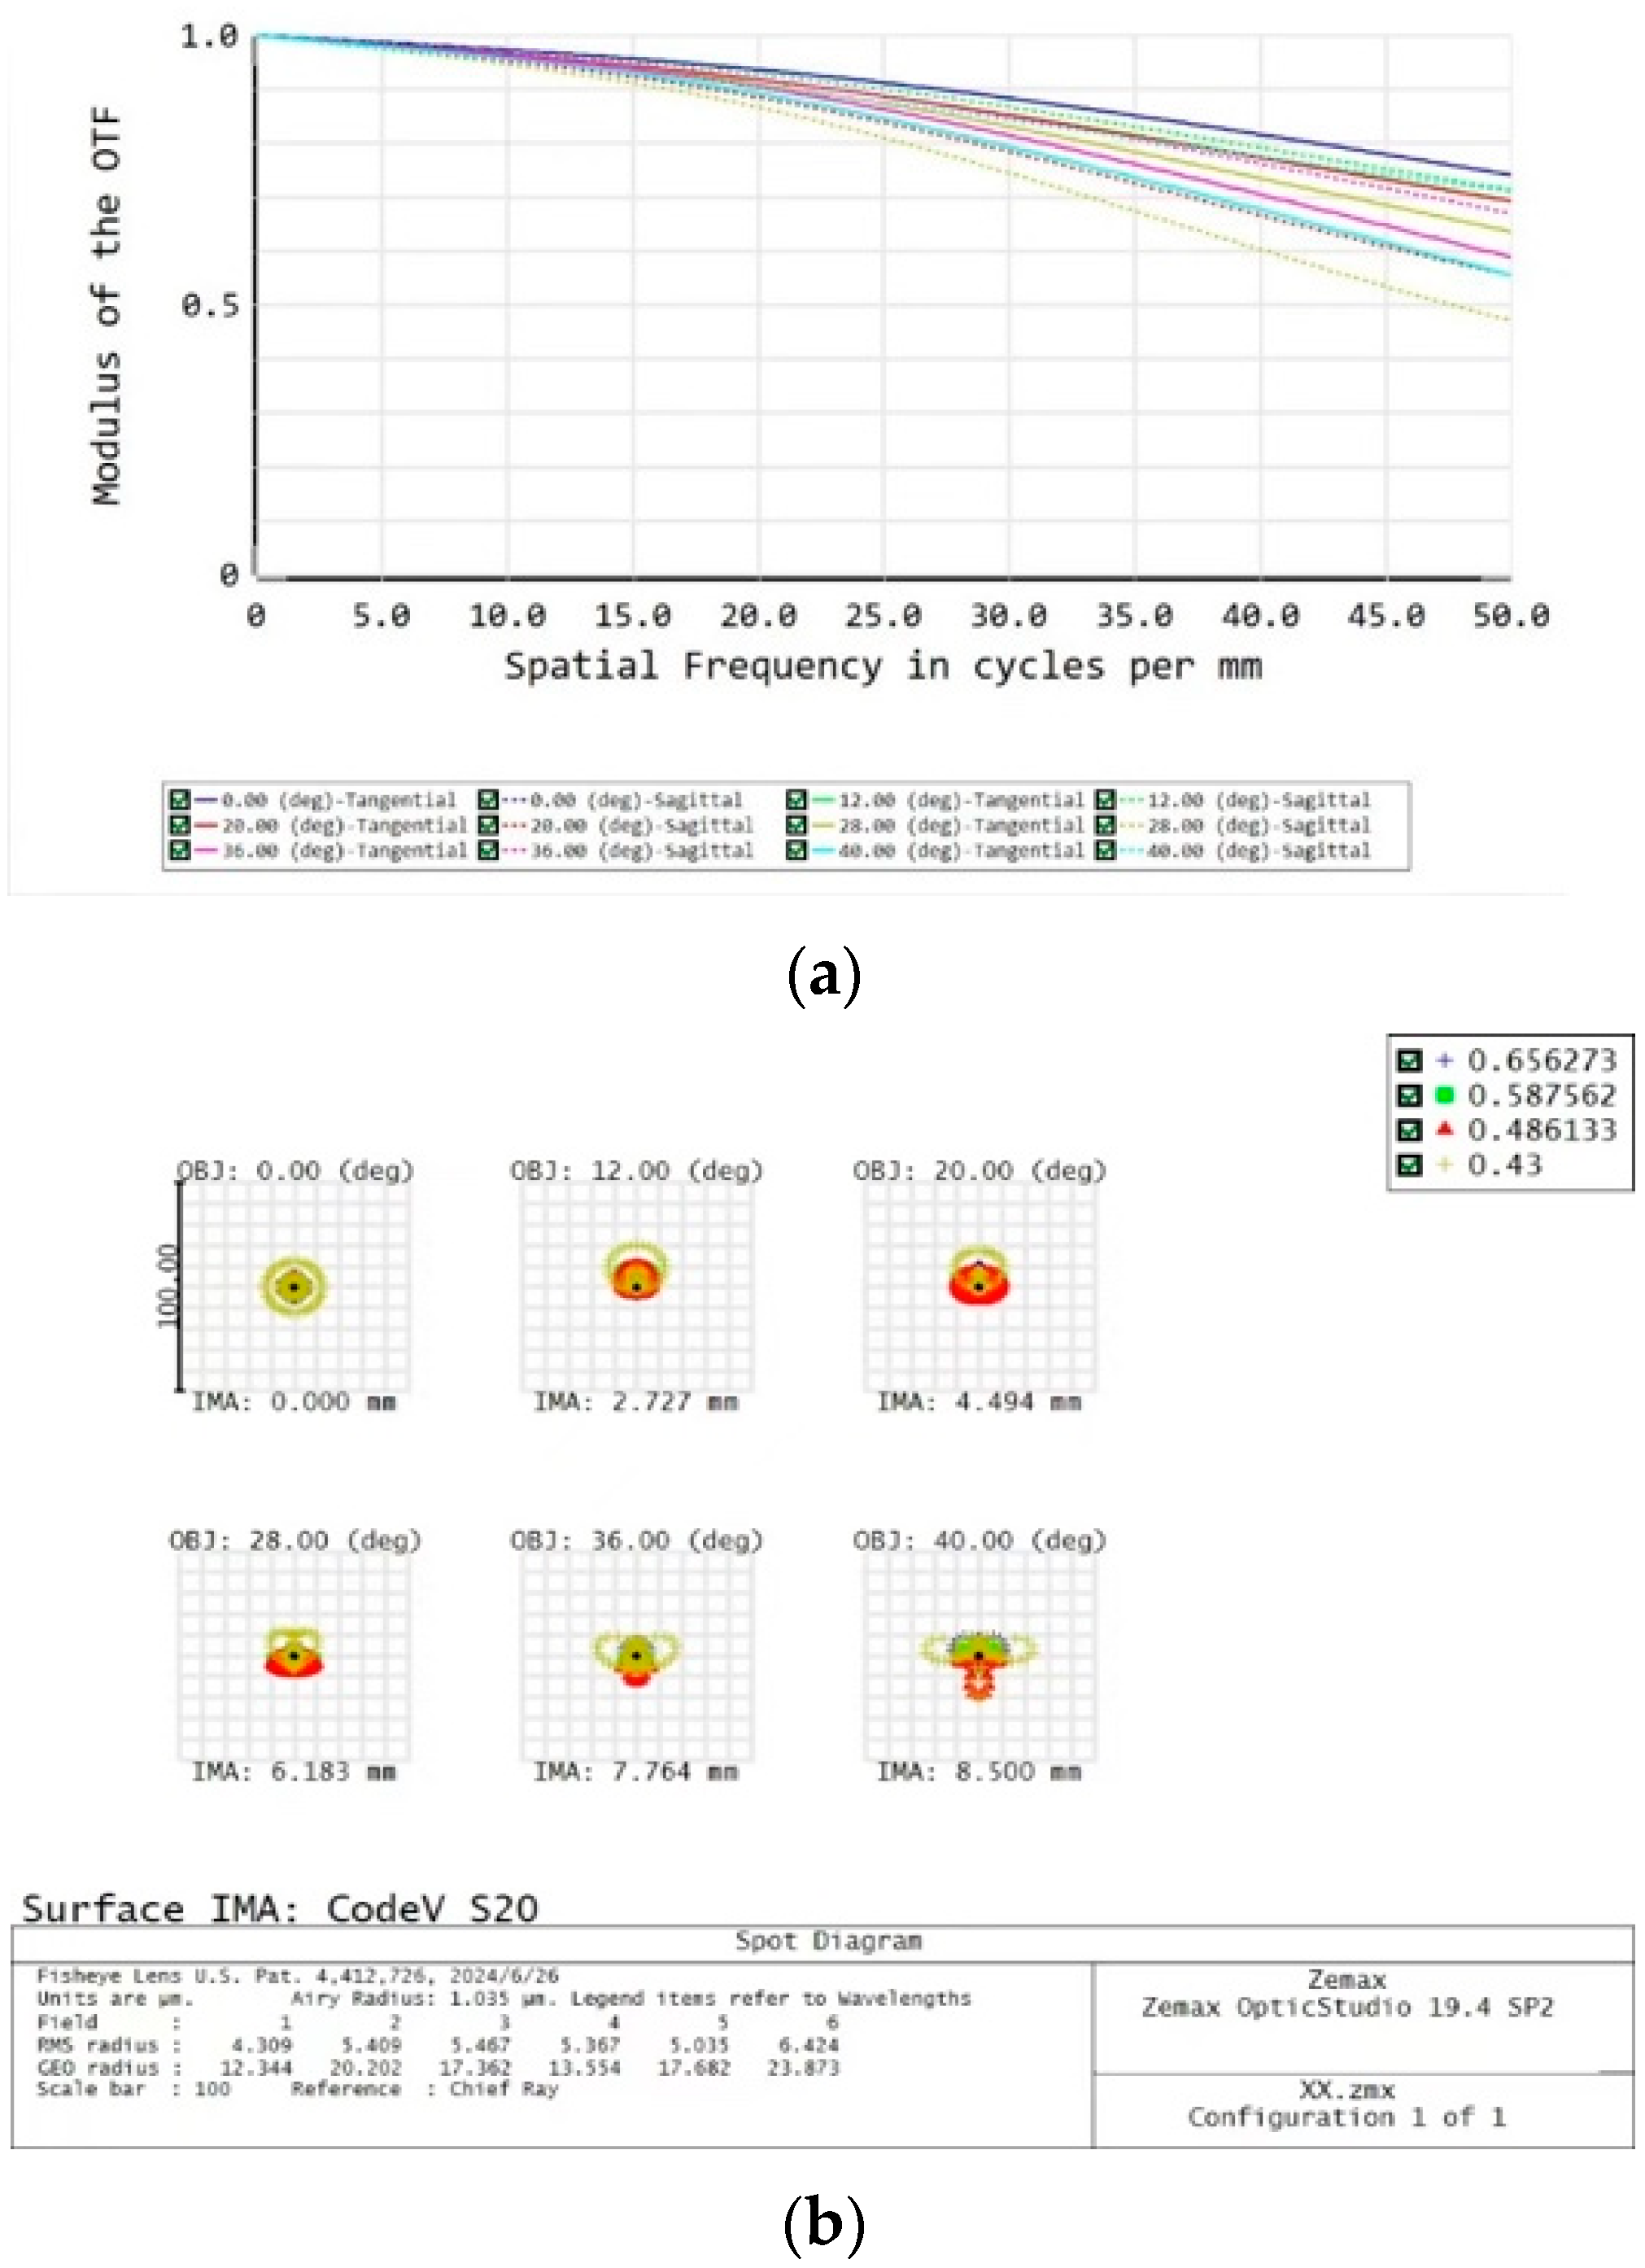
An evaluation of an optical imaging system is usually expressed using a modulation transfer function, which is the ratio of the image’s modulation to the object’s modulation as a function of spatial frequency. Thus, a larger MTF indicates better imaging quality of the system. For the modulation transfer function diagram shown in
Figure 3a, the horizontal coordinate is the spatial frequency and the vertical coordinate is the reduction in the actual sharpness percentage. In the calibration of the resolution of this lens, 1 is the ideal value; however, while the curve can approach a value of 1, it can never be equal to 1. The different colors of the curves represent the same fields of view specified in
Table 2 for the optical path trace diagram. The solid line is the direction of the meridian, and the dashed line is the direction of the arc vector. The modulation transfer function (MTF) curve of the optical system exceeds 0.48 at 50 lp/mm and approaches the diffraction limit, meeting the design requirements.
Figure 3b presents the dot column diagram. OBJ indicates the field of view, and IMA is the corresponding image height produced by the specified field of view. The images show that under the four bands, the dispersion spot diameter is relatively small. Most of the energy is gathered within the size of the image element. The detector’s minimum resolvable interval of two image element sizes is 0.0064 mm. The dot column diagram shows that the minimum on-axis dispersion spot RMS radius is 0.0043 mm, the maximum diffuse spot RMS radius off-axis is 0.0064 mm, and the image quality meets the imaging clarity requirements for the detector. The spot diagrams of the optical system at 22° show that the root-mean-square radius at four wavelengths (430 nm, 486 nm, 588 nm, and 656 nm) is less than one pixel, meeting the imaging size requirements for the detector.
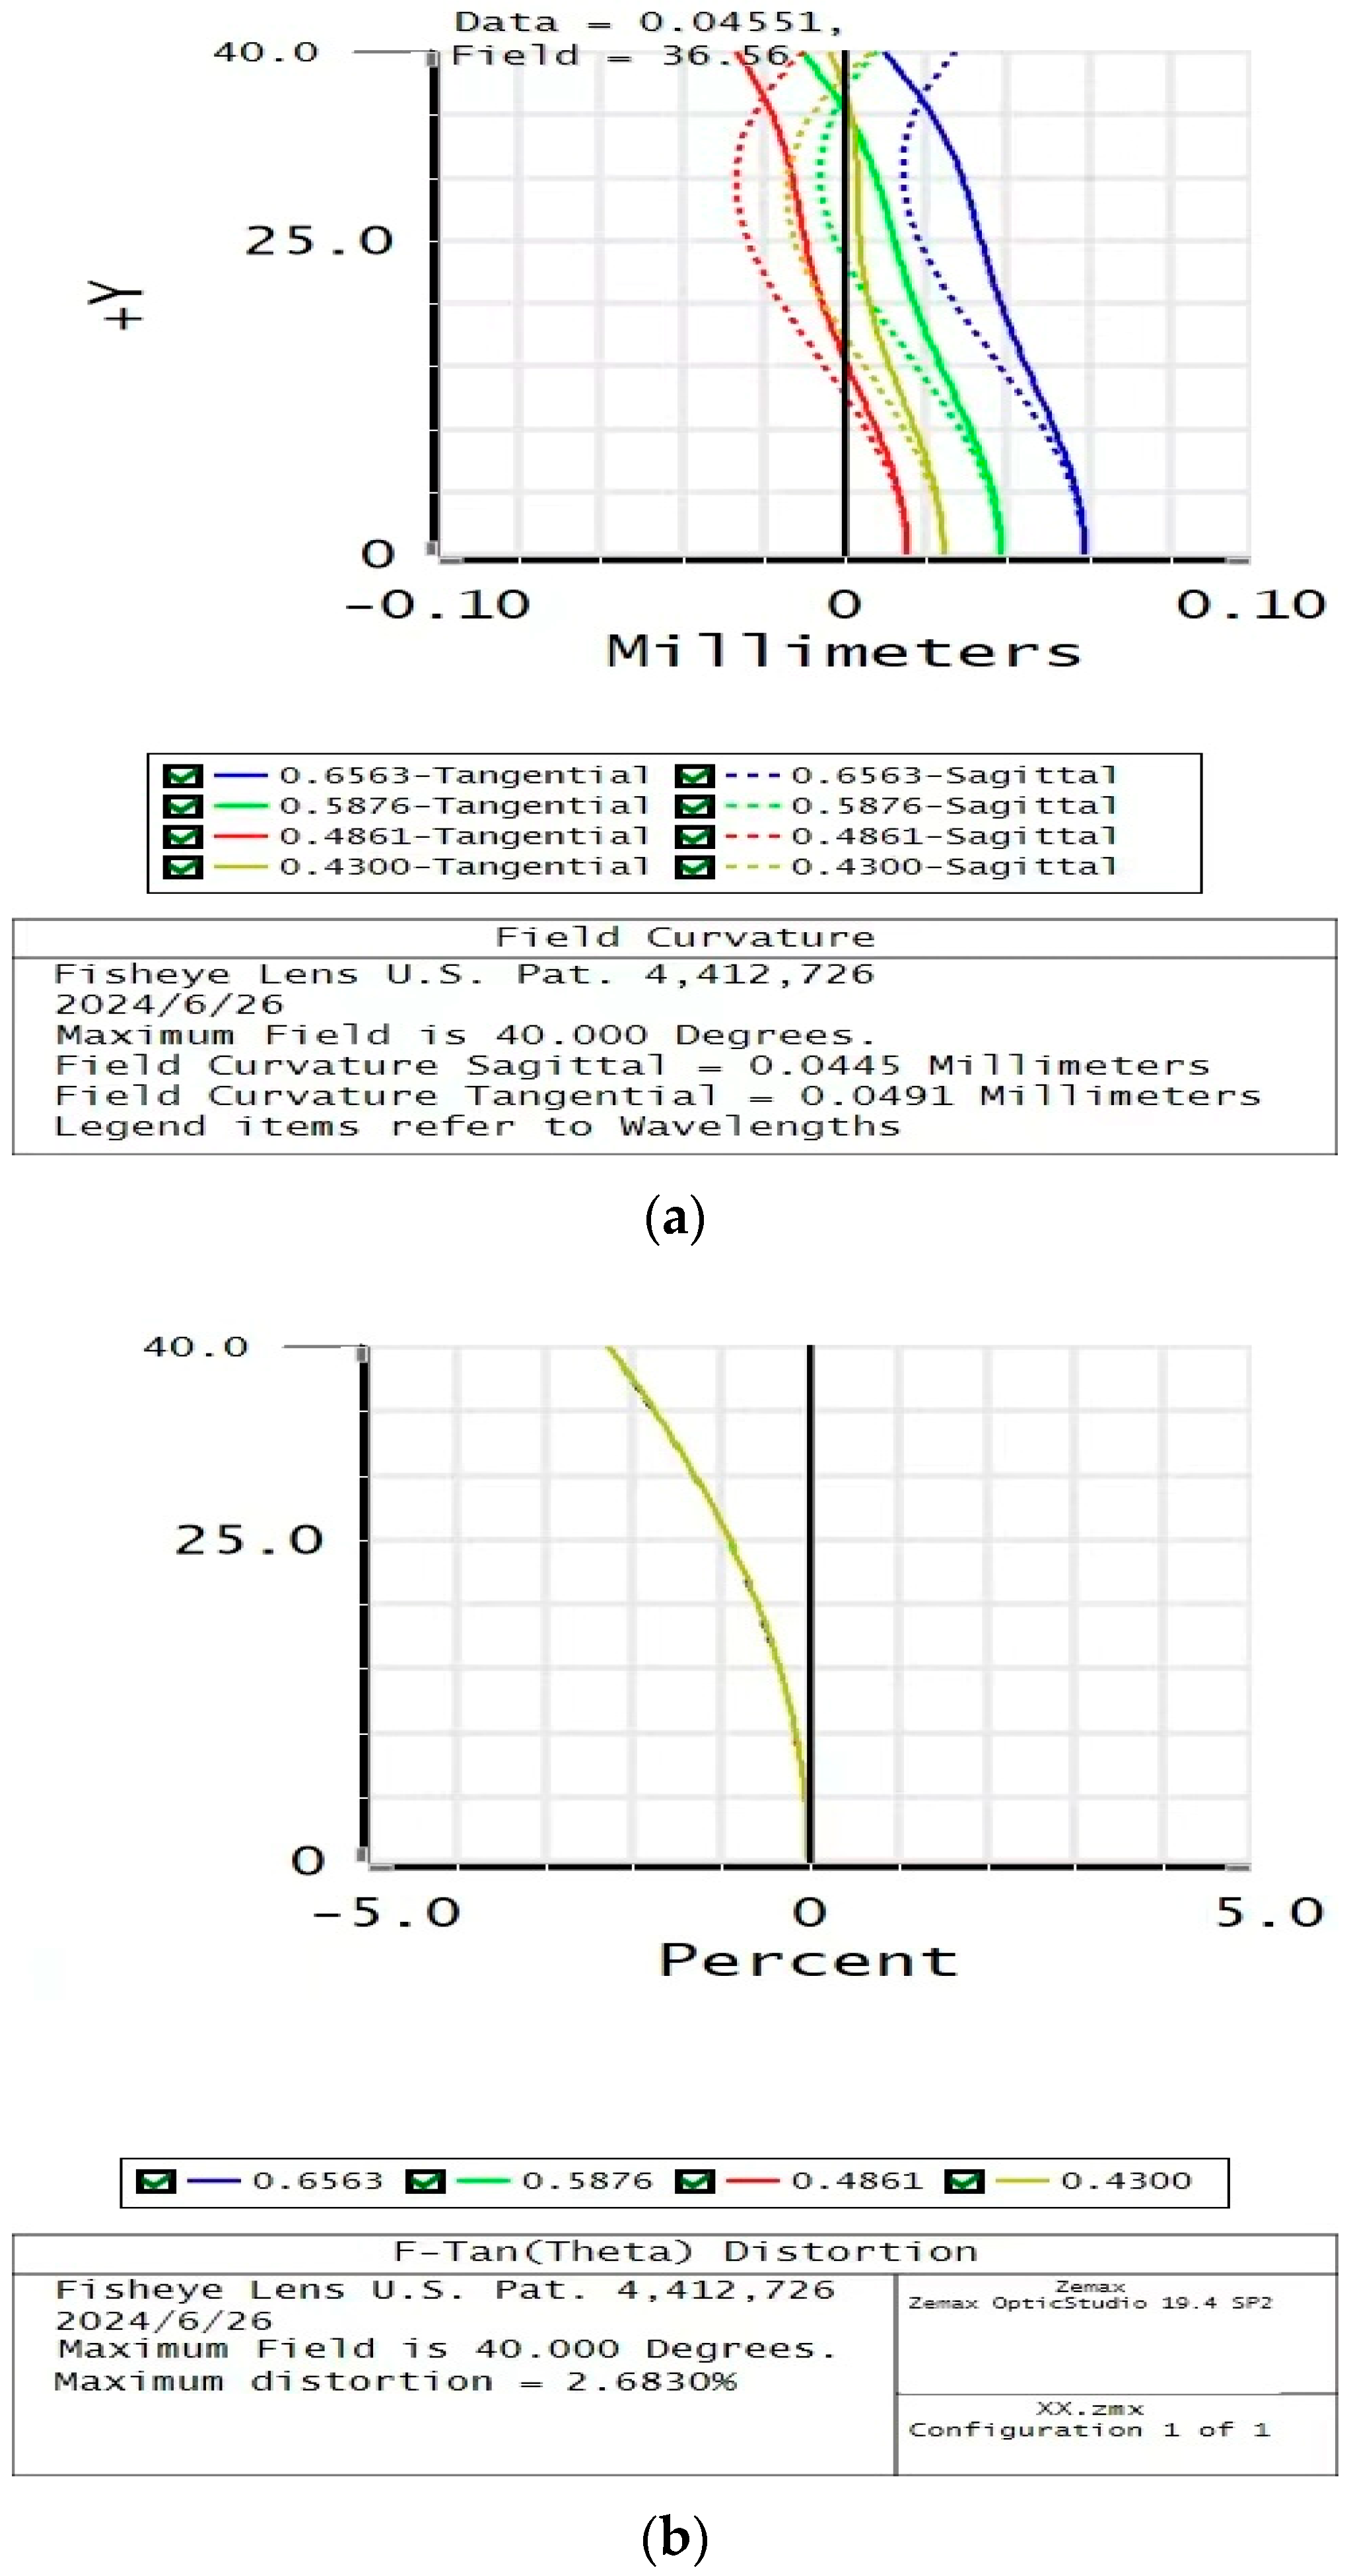
The field curvature and distortion of the optical system are shown in
Figure 4. In
Figure 4a, the ordinate is the field angle, and the corresponding abscissa is the magnitude of the field curvature. In
Figure 4b, the ordinate is the field angle, and the corresponding abscissa is the magnitude of the distortion. As illustrated, the optical system exhibits excellent correction of the field curvature. Additionally, the distortion curve is well controlled in the full field of view, maintaining distortion levels below 3%, which aligns with imaging standards. Consequently, the system achieves a high standard of imaging quality.
To quantitatively assess the robustness of the proposed optical system against typical assembly and manufacturing tolerances, a Monte Carlo tolerance analysis was conducted using Zemax. Given that the system contains up to ten optical elements, cumulative misalignments—such as lens decentering, tilt, and spacing errors—can potentially degrade the image quality. The simulation incorporated realistic tolerance values, including a ±20 µm lateral decenter and ±0.2° angular tilt per lens. As illustrated in
Figure 5, the RMS spot radius increased from 9.42 µm under nominal conditions to 10.00 µm after tolerances were applied, representing only a 6% increase in spot size. This minimal degradation indicates excellent resistance to alignment errors and suggests that the designed resolution remains effectively preserved.
To evaluate performance variability, 100 Monte Carlo trials were performed.
Figure 6 summarizes the results, with the best-case RMS spot radius reaching 9.20 µm, the worst-case radius reaching 10.58 µm, and a mean value of 9.88 µm. The standard deviation across all trials was within 0.83 µm. These results demonstrate that the optical system maintains consistently high imaging performance across realistic tolerance distributions, validating the robustness of the design for deep-sea operational environments.
4. Analysis of Polarization Properties of Optical System
The optical system itself exhibits certain polarization properties, which alter the polarization state of incident light. These alterations are influenced by the field of view, object height, and wavelength. To obtain more accurate polarization signals, it is necessary to analyze the impact of the polarization properties of the optical system on the accuracy of polarization degree measurements. Calculations of polarization properties typically employ polarization ray tracing algorithms, recording the polarization state changes along each ray path. The polarization characteristics of optical systems are usually obtained by using the optical design software Zemax (OpticStudio v2021, Zemax LLC., Kirkland, WA, USA), which employs a polarized light tracing algorithm and calculates the change in the polarization state on each light path. First, the different types of polarized light sources and the Mueller matrix of the incident light are defined. The Mueller matrices for linearly and circularly polarized light need to be obtained through a transformation. The Zemax software represents linearly polarized light using Jones vectors:
where
Ex and
Ey are the electric field components. Then, the Jones matrix is converted into the Mueller matrix:
where
J is the Jones matrix and
J* is its conjugate transpose.
The Stokes vector is used to represent circularly polarized light, which is the same as in Formula (1).
The Mueller matrix for circularly polarized light can be calculated using the Stokes vector elements.
Each optical element is then set up in the form of its Mueller matrix, which describes the change in the polarization state as light passes through the element. If there is more than one optical element in the system, Zemax concatenates the Mueller matrices of each optical element to form a Mueller matrix for the whole system and finally calculates the polarization states of linearly and circularly polarized light.
Extensive studies have indicated that 480 nm blue light experiences the weakest attenuation underwater [
23]. While 532 nm green light is often preferred for its lower scattering in turbid water, 480 nm blue light offers the lowest total attenuation in clear seawater, making it advantageous for maximizing signal transmission over distances. In addition, the image sensor used in this system exhibits enhanced spectral sensitivity near the blue region, further supporting the selection of 480 nm as the working wavelength [
24]. Consequently, our analysis of the optical system’s polarization properties is concentrated within this specific wavelength range. Utilizing the polarization ray tracing functionality of optical design software, the polarization-related transmittance map and Mueller matrix map at the exit pupil position of the optical system are calculated, and the system’s influence on both intensity and polarization is thus analyzed.
To align with the system’s target application, simulations were conducted using 480 nm illumination under both linear and circular polarization. The analysis covers incident angles corresponding to an 80° field of view, with results evaluated at the exit pupil.
Figure 7,
Figure 8 and
Figure 9 depict the computed transmittance and Mueller matrix distributions, revealing the system’s polarization response across the field.
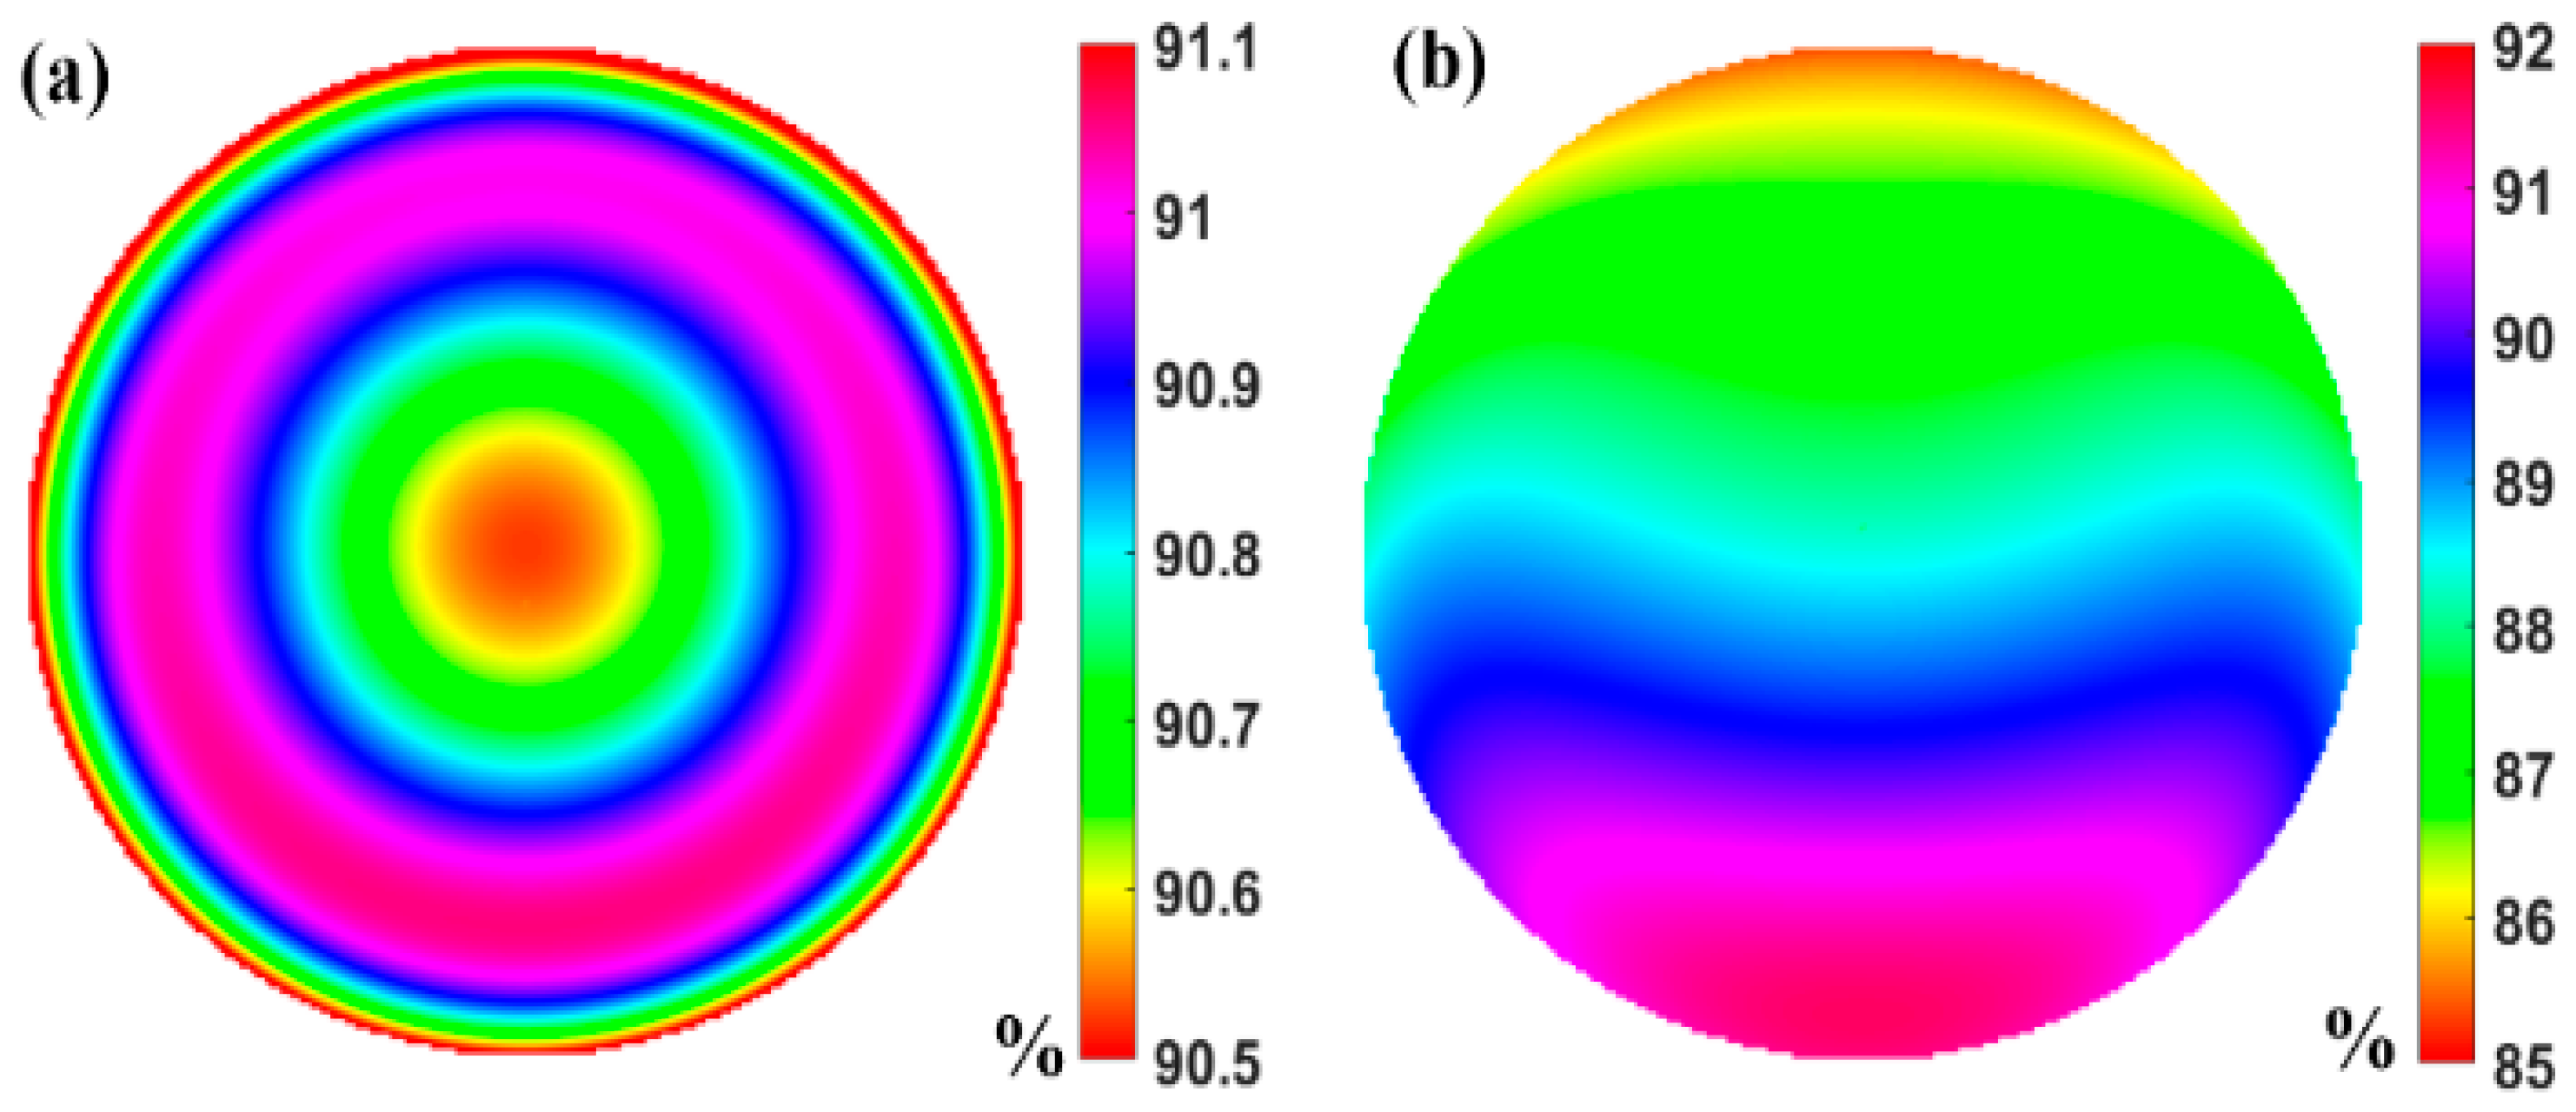
The transmittance distribution related to polarization at the exit pupil position is shown in
Figure 7, where the intensity values represent the average transmittance of both s- and p-polarized light throughout the entire system.
Figure 7a illustrates the luminous intensity distribution of the central field of view, exhibiting a rotationally symmetric distribution pattern with values gradually increasing and then decreasing again from the center to the edge. This results in a relatively uniform intensity distribution across the pupil with an average transmittance of 90.78%.
Figure 7b illustrates the intensity distribution of the edge field of view, showing a gradual decrease in luminous intensity from the lower edge of the pupil to the upper edge. This decrease is attributed to the larger incident angles at the upper edge, leading to lower transmittance of s- and p-polarized light and, thus, a reduced light intensity. The average transmittance of the edge field of view is 88.73%, which is 2.03% lower than that of the central field of view. The variation in transmittance with the field of view is relatively small, indicating that the influence of the filling oil medium on the overall transmittance of the system is minimal. Additionally, the optical system was found to have minimal losses of light energy, thereby exhibiting strong receptivity to polarization signals.
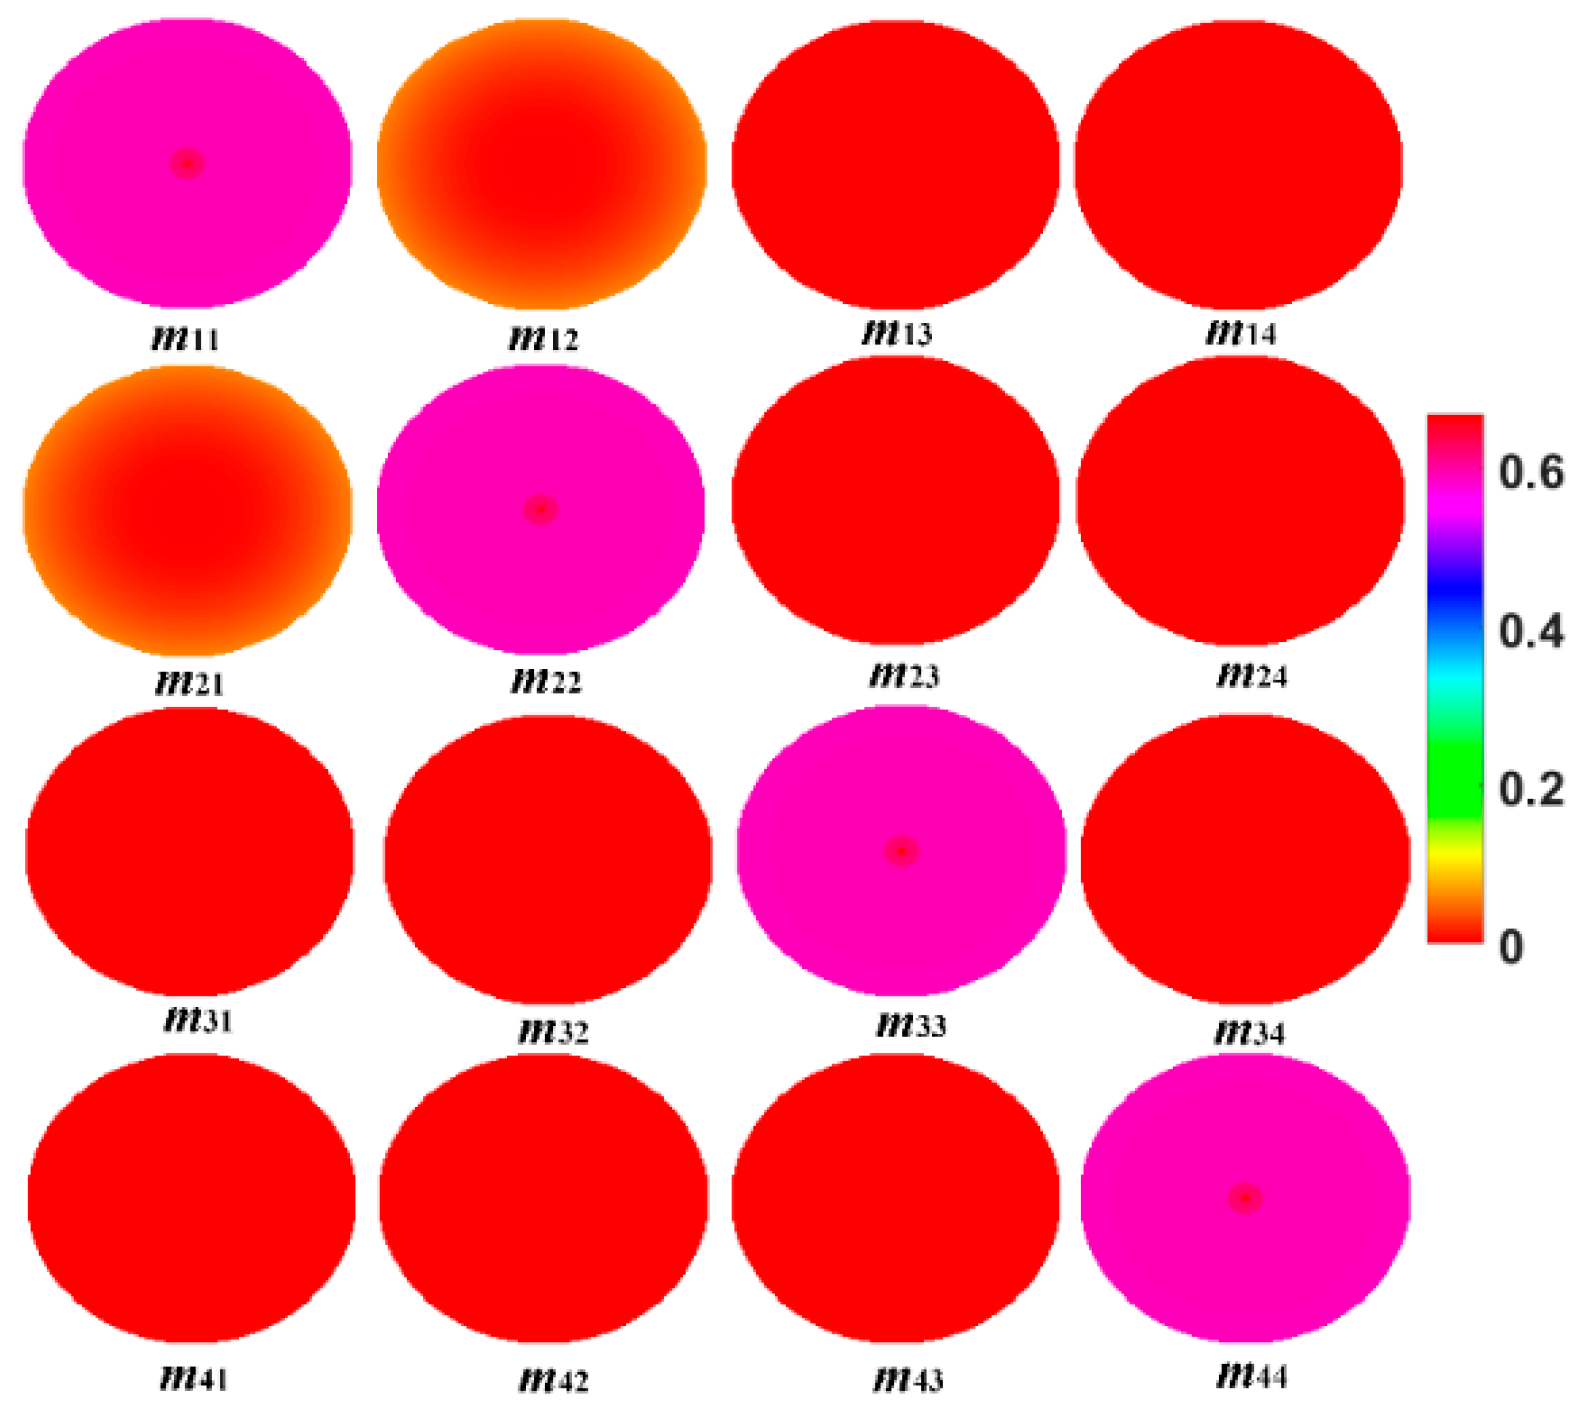
The Mueller matrix consists of 16 elements, each with its own unique pupil distribution pattern. The Mueller matrix map for the central field of view is shown in
Figure 8. The four elements in the first row represent the influence of the optical system on the total intensity of the incident beam. The intensity distribution of elements m13 and m14 is almost zero, indicating that the 45° linearly polarized light and circularly polarized light components of the incident beam have little effect on the total light intensity. The values of elements along the main diagonal in
Figure 8 are the largest, indicating that the elements of the Stokes vector are minimally affected by other polarization states. Therefore, the optical system exhibits minimal changes to the incident beam within the central field of view.
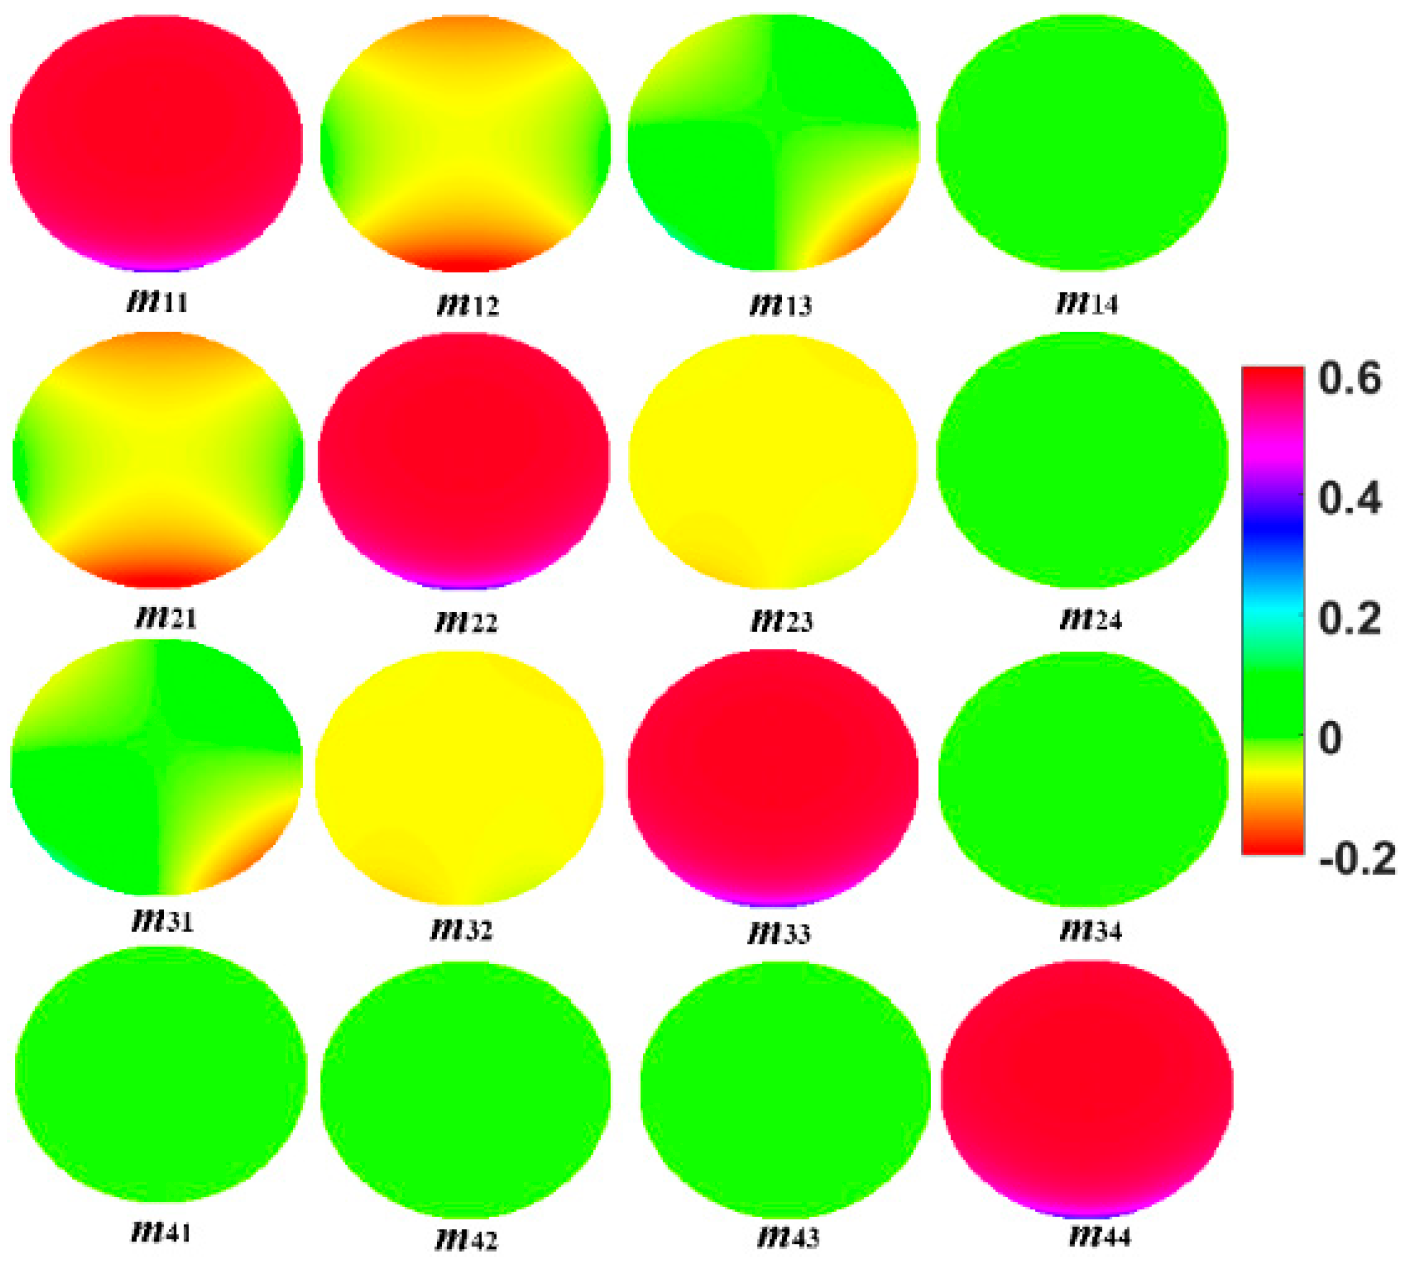
The Mueller matrix map for the exit pupil in the edge field of view is shown in
Figure 9. The elements along the main diagonal exhibit the same distribution pattern and represent the maximum value among all elements. This indicates that the Stokes vector is mainly influenced by the element values along the main diagonal after acting on this pupil. From the pupil of element m11 in
Figure 9, it can be seen that the values at the lower edge are lower, mainly due to the influence of the incident angle of the beam. From the first row of elements in
Figure 9, it can be seen that both m12 and m13 change the first element of the incident Stokes vector, with m13 mainly affecting the luminous intensity distribution of the edge of the pupil. In
Figure 8, except for the elements along the diagonal, the elements all have values close to 0. However, in
Figure 9, each element has a certain value, which directly affects the values of each element in the outgoing Stokes vector, with the most significant impact being on elements S1 and S3 undergoing minimal changes.
Compared to that for the central field of view, the Mueller matrix map for the edge field of view exhibits greater variation, leading to a more pronounced impact on the polarization properties of the incident light field. Next, the polarization measurement errors caused by different polarization states incident upon the optical system are analyzed. The light emitted by the light source consists of horizontally polarized light and circularly polarized light. Assuming that these two polarization states pass through the scattering medium in accordance with Equation (3), the Stokes vector entering the optical system is given by
The polarization properties of optical systems influence the
DOP measurement accuracy, resulting in measurement error d:
where the values of both vectors range from −1 to 1. These two vectors are substituted into the optical system separately, and the measurement errors in the polarization degree of the incident light beams are calculated using Equation (5). Therefore, removing the influence on the polarization state of received signals can improve the
DOP measurement accuracy.
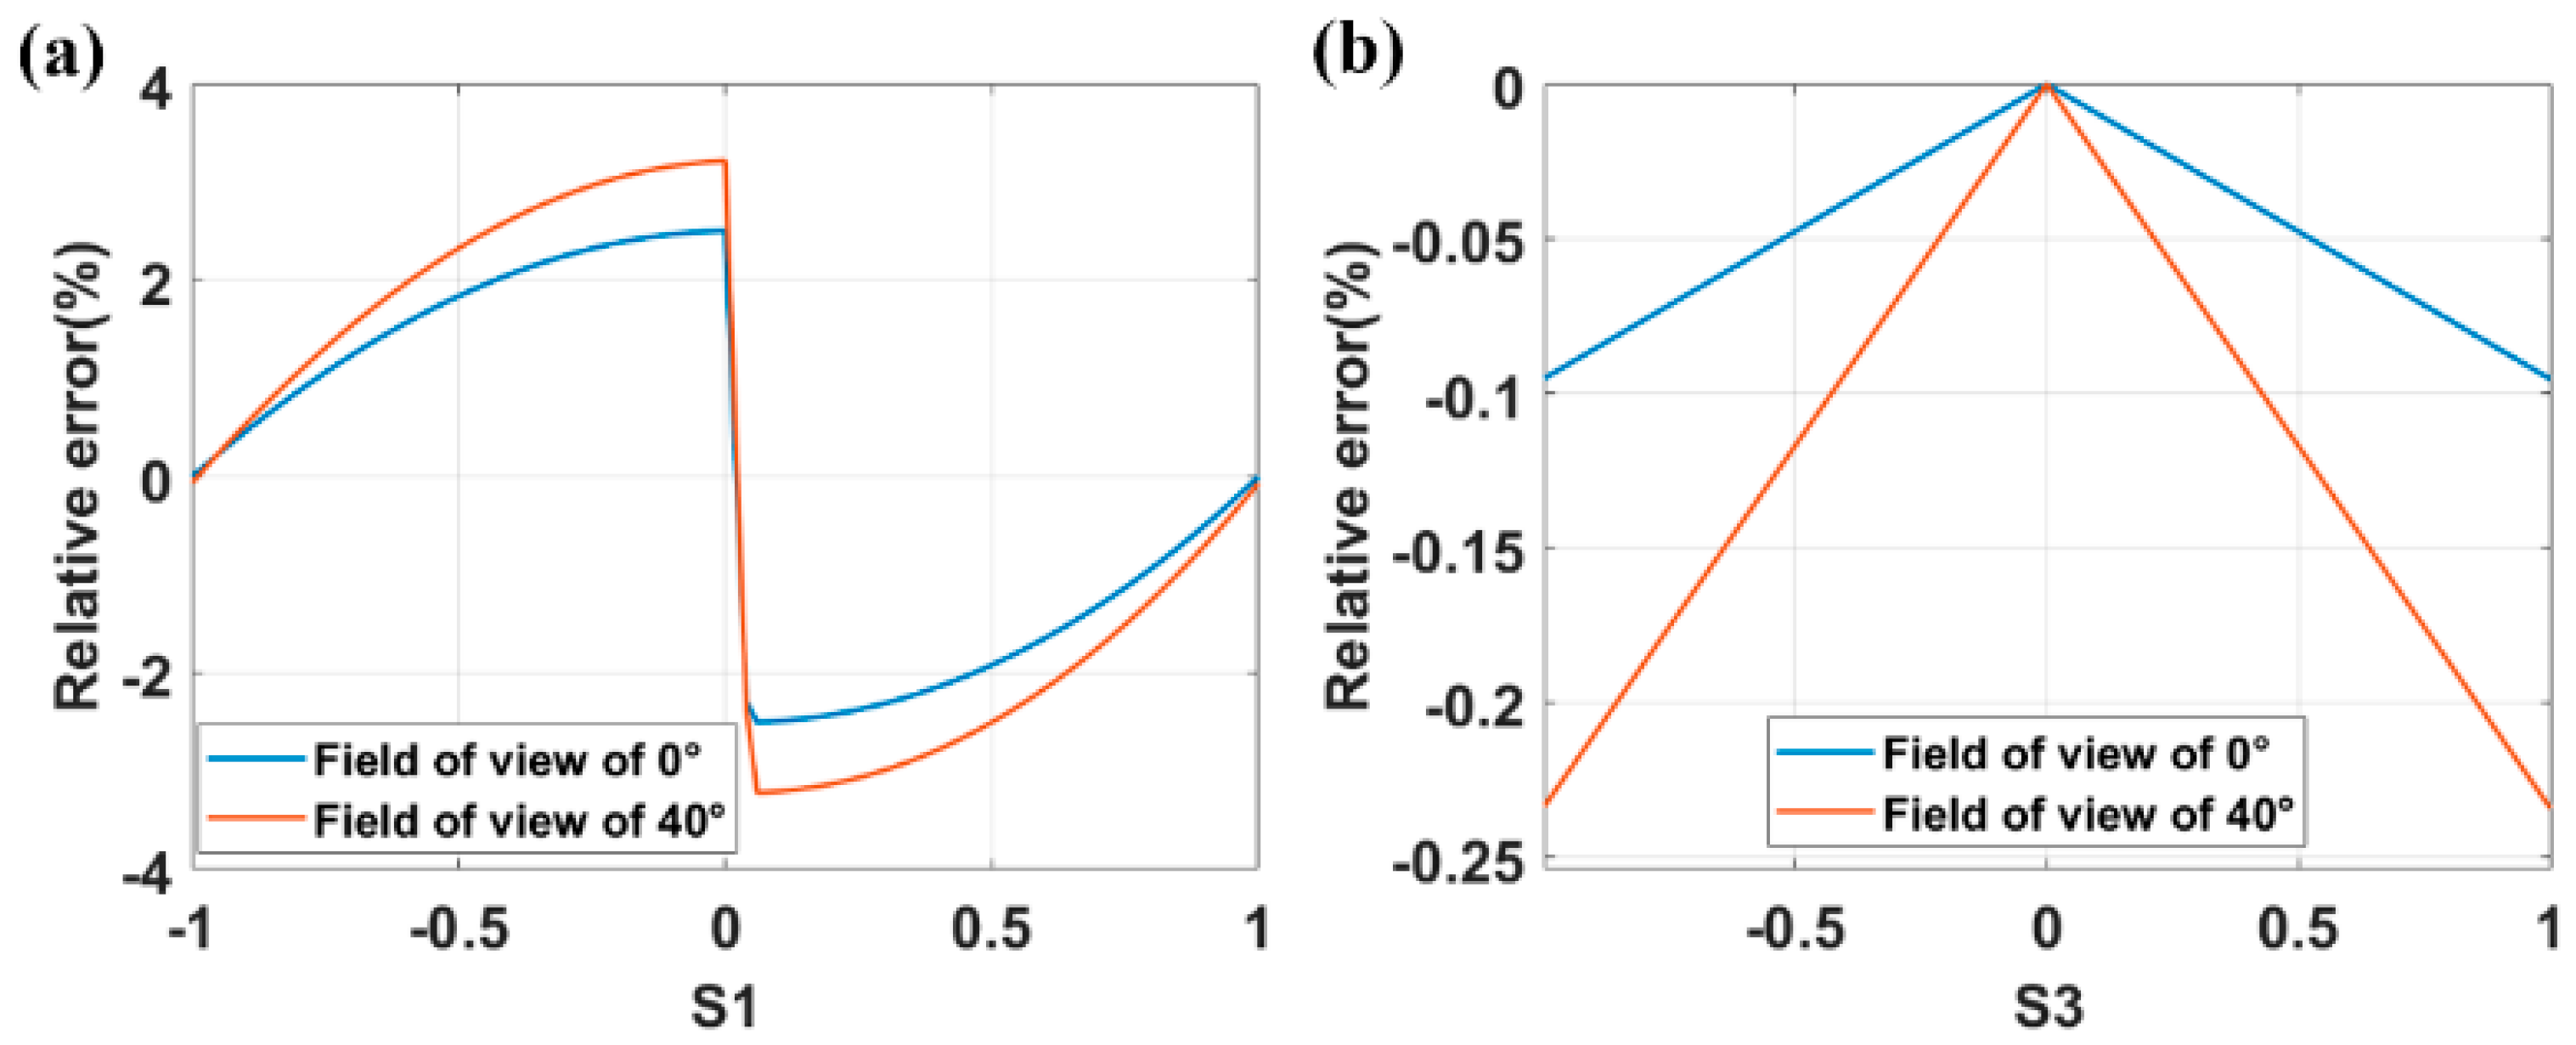
As shown in
Figure 10a, when the Stokes vector incident on the optical system corresponds to linearly polarized light, the relative error curve of the polarization degree changes with parameter S1. When the values of S1 are 0, −1, and 1, the polarization state of the incident light corresponds to completely unpolarized light, vertically polarized light, and horizontally polarized light, respectively, resulting in a relative error of zero for the polarization degree. However, as the polarization state of the incident beam approaches that of completely unpolarized light, the relative error increases. Comparing the two curves in
Figure 10a, the polarization degree measurement errors induced by the edge field of view are greater than those induced by the central field of view. This indicates that the measurement error increases with the field of view but remains below 3.5%. The errors in the polarization degree for S3 values ranging from −1 to 1 when circularly polarized light is incident are shown in
Figure 10b. When circularly polarized light is scattered into completely unpolarized light, the relative error in the polarization degree is 0. However, as the polarization state of the incident circularly polarized light approaches that of completely polarized light, the relative error gradually increases, showing a linear trend. Comparing the two polylines in
Figure 10b, the errors in the central field of view are significantly lower than those in the edge field of view. When completely polarized light is incident, the relative error reaches its maximum, and the central field of view is 1.32% more accurate than the edge field of view. Comparing the two subgraphs in
Figure 10, within the range of variation in the Stokes parameters, the polarization degree error caused by circularly polarized light is significantly lower than that caused by linearly polarized light. However, as the polarization degree of the incident light beam approaches 1, the measurement error is lower for linearly polarized light. Therefore, for situations with strong underwater scattering, using circularly polarized light allows for more accurate measurements of the polarization degree. From the analysis above, it can be concluded that the optical system designed in this study exhibits weak polarization properties and different measurement accuracies for different beam polarization states. Hence, it is essential to select the actively polarized light beams emitted by the light source according to the scene.
6. Discussion
Although the proposed optical system was modeled using Zemax, deviations between the simulation and experimental results remain. These differences primarily stem from idealized assumptions in the model, such as perfectly rigid structures, precise lens alignment, and ideal material behavior. In contrast, real-world systems inevitably experience manufacturing tolerances, adhesive layer deformation, and environmental perturbations that are not fully captured in optical simulations.
Additionally, the laboratory pressure test was conducted under short-term and controlled conditions, which do not fully replicate the deep-sea environment. Factors such as prolonged exposure to high pressure, thermal gradients, and material aging may induce optical axis drift, mechanical creep, or performance degradation over time. To address these limitations, future efforts will involve extended-duration pressure testing and model refinement incorporating pressure-dependent mechanical and optical parameters. Material selection will focus on low-creep adhesives, thermally stable optical glasses, and high-strength housing materials such as titanium alloys. Mounting structures will be further optimized to minimize internal stress and ensure long-term alignment stability.
Conventional deep-sea imaging platforms are generally constrained to depths shallower than 6000 m and rely on narrow-angle optics (<60°) without polarization discrimination. These systems typically incorporate rigid, air-filled housings or simplified structural designs, which render them vulnerable to mechanical failure or deformation under long-term exposure to high pressure. Consequently, their application is often restricted to short-term, intensity-based imaging missions, with limited adaptability to complex underwater environments. A comparative analysis with recent representative designs further illustrates these limitations. The DEEPi system, though compact and cost-effective, is limited in its operational depth [
26]. Maka Niu offers modularity and field deployment flexibility but lacks wide-field or polarization capability [
27]. The liquid-filled PresTo has improved pressure tolerance, yet its optical precision and structural durability remain constrained by its fabrication complexity and material choice [
28]. The present system advances beyond these constraints by integrating an oil-immersion architecture that maintains pressure equilibrium and minimizes internal stress. It supports full-polarization imaging across an 80° field of view and is rated for operation at depths up to 10,000 m. The use of thermally stable fused silica optics, titanium-alloy housing, and mechanically decoupled mounting structures ensures both optical fidelity and structural robustness over extended deployment periods. These features collectively position the system as a viable solution for long-duration, high-performance imaging in extreme deep-sea conditions.


