Article

A μrad Accuracy and nW Detection Sensitivity Four-Quadrant Heterodyne Coherent Angular Measurement System

1
School of Optoelectronic Engineering, Changchun University of Science and Technology, Changchun 130022, China
2
National and Local Engineering Research Center of Space Optoelectronic Technology, Changchun University of Science and Technology, Changchun 130022, China
*
Author to whom correspondence should be addressed.
Photonics 2025, 12(5), 509; https://doi.org/10.3390/photonics12050509
Submission received: 2 April 2025 / Revised: 24 April 2025 / Accepted: 29 April 2025 / Published: 19 May 2025
(This article belongs to the Section Optical Communication and Network)

Abstract

:
In gravitational wave measurement and inter-satellite laser communication systems, the relative rotation and motion between the transmitter and receiver terminals introduces small angular deviations over a link distance of thousands of kilometers, which need to be measured with high accuracy and sensitivity. The heterodyne coherent angle measurement has a higher measurement accuracy and detection sensitivity compared with the traditional direct detection technique, which performs angle measurement through the phase of a beat frequency signal. In this paper, we propose a four-quadrant heterodyne coherent angle measurement technique with μrad accuracy and nW-level detection sensitivity. A mathematical model of a differential wavefront sensing (DWS) angle solution was formulated, and a Monte Carlo simulation system was built for performance testing. An experimental system was devised to assess the accuracy and sensitivity of the heterodyne coherent measurement method and to compare the performance with that of the direct detection method. The experimental results showed that for azimuth and pitch axes, the accuracy of the heterodyne coherent angle measurement was 2.54 μrad and 2.85 μrad under the same signal power of −16 dBm, which had a 5-fold improvement compared with direct detection. The sensitivity of the heterodyne coherent detection was −50 dBm at the 20 μrad accuracy threshold, which was a 1000-fold improvement compared with direct detection. This research is of great significance for the phase measurement and tracking system in the field of gravitational wave detection and has a guiding role in system design work in the field of inter-satellite laser communication.

1. Introduction

In gravitational wave measurement systems, the relative rotation between test masses introduces angular deviations that have an impact on the accuracy of optical range difference measurements. This field has numerous mature systems [1,2]. In 2016, American scientists successfully detected for the first time the gravitational wave signals generated by the merger of cosmic double black holes through the ground-based gravitational wave observation system LIGO (Laser Interferometer Gravitational-Wave Observatory) [3]. Concurrently, the National Aeronautics and Space Administration (NASA) and the European Space Agency (ESA) have announced their joint undertaking of the Laser Interferometer Space Antenna program, LISA (Laser Interferometer Space Antenna) [4,5]. The distance between the test masses is 5,000,000 km, and the angular measurement accuracy is better than 20 nrad/Hz1/2 in the low frequency band of 0.1 mHz~100 mHz [6]. NASA and the German Aerospace Center (DLR) have announced the GRACE Follow-On satellite mission, which utilizes an interstellar distance of 220 km and an angular pointing measurement accuracy of better than 1 μrad/Hz1/2 at the 0.1 Hz frequency [7,8,9]. The Taiji program, which is overseen by the Chinese Academy of Sciences, with a distance of 3,000,000 km between satellites, has developed interferometers in the 0.1 Hz~1 Hz band that can limit noise to 10 pm/Hz1/2 [10,11].
The integration of communication and tracking in space laser communication systems represents a prevailing trend in future development. The system employs a beaconless design, eschewing the 800 nm beacon laser beam and utilizing a 1550 nm communication laser beam for concurrent high-rate data transmission, high-accuracy beam angle detection, and tracking. The distance between satellites in a laser communication link can span thousands of kilometers, and the relative motion between satellites and other factors can introduce angular deviations to the signal beam at the receiving end. This can compromise the performance of the system. To ensure the stability of the laser link, high-sensitivity detection and the high-accuracy measurement and compensation of the angular deviation of the weak signal are essential. In addition, the reconfigurability of laser communication terminals has emerged as a pivotal area of research in programs such as the U.S. Space-Based Adaptive Communication Node (Space-BACN) [12]. The aim of this study was to realize multiple wavelength switching and repeatable configurations in the range of 1530–1565 nm. When the communication wavelength changes by 0.01 nm, the corresponding amount of optical frequency change is 1.25 GHz. The frequency of beat note signals in the laser heterodyne interferometric angular measurement system is up to 20 MHz. The isolation of different communication wavelengths is realized by adjustment of the optical frequency of the local oscillation laser beam, which can be better applied to the multi-node laser communication network system. Therefore, it is of great significance to develop an angle measurement scheme with high detection sensitivity and high accuracy for future laser communication terminal design work.
A four-quadrant detector (QD) was compared with a conventional charge-coupled device (CCD) and a position sensitive detector (PSD). QDs have a MHz bandwidth, simpler signal processing circuits, and higher measurement accuracy and sensitivity, which make them capable of correctly receiving complete waveforms and accurately solving phase information for MHz-scale beat-frequency continuous wave signals. Therefore, a QD was chosen as the photodetector of the heterodyne coherent angle measurement system. The traditional QD angle measurement system adopts the direct detection technology, which is based on the received signal amplitude information for the spot center position solution and is converted to the angle through the trigonometric function. However, in the actual system, after long-distance transmission to the receiving end of the signal, the laser beam power is weak, which will lead to a substantial deterioration in the signal-to-noise ratio. Thus, the position and angle detection accuracy of the direct detection method is reduced. On this basis, a DWS-based heterodyne coherent angle measurement technique was further proposed, which performs angle solving based on the signal phase. Compared with the traditional direct detection method, the heterodyne coherent angle measurement can obtain a higher accuracy and system signal-to-noise ratio [13,14,15]. The wavefront curvature of the measured light beam can be increased through the lens, significantly improving the detection sensitivity and is being well-applied to high-precision multi-degree-of-freedom interferometers [16]. For the phase angle conversion process, an angle measurement algorithm based on improved differential evolution was proposed, and a coherent laser angle measurement desktop experiment was constructed for verification, with a measurement error better than 5 μrad [17]. Aiming at the problems of a low accuracy of direct detection technology and difficult integration with a high-speed coherent communication system, an interstellar laser communication angular displacement detection method based on coherent light was proposed. A laser communication link was built under laboratory conditions for testing and validation. The angular displacement detection accuracy was 0.6 μrad (σ) with a detection sensitivity of −43.93 dBm [18].
Based on the above analysis, this paper proposes a four-quadrant heterodyne coherent angle measurement technique with μrad accuracy and nW detection sensitivity. Firstly, a set of heterodyne coherent angle measurement methods is proposed, a theoretical model established, a phase-locked loop was adopted as the core of the design, and the conversion relationship between the phase and angle was further deduced. Secondly, the Monte Carlo method was employed for the first time to simulate the whole optoelectronic process of the heterodyne coherent angle measurement and analyze the performance of angle measurement with the phase-locked loop model. Finally, an experimental system was built to compare the quantitative differences between the heterodyne coherence angle measurement and direct detection methods using the same four-quadrant detector (QD). The influence of parameters such as the power of the local oscillator laser beam and the loop bandwidth on the angle measurement performance was also tested and analyzed.

2. Principle

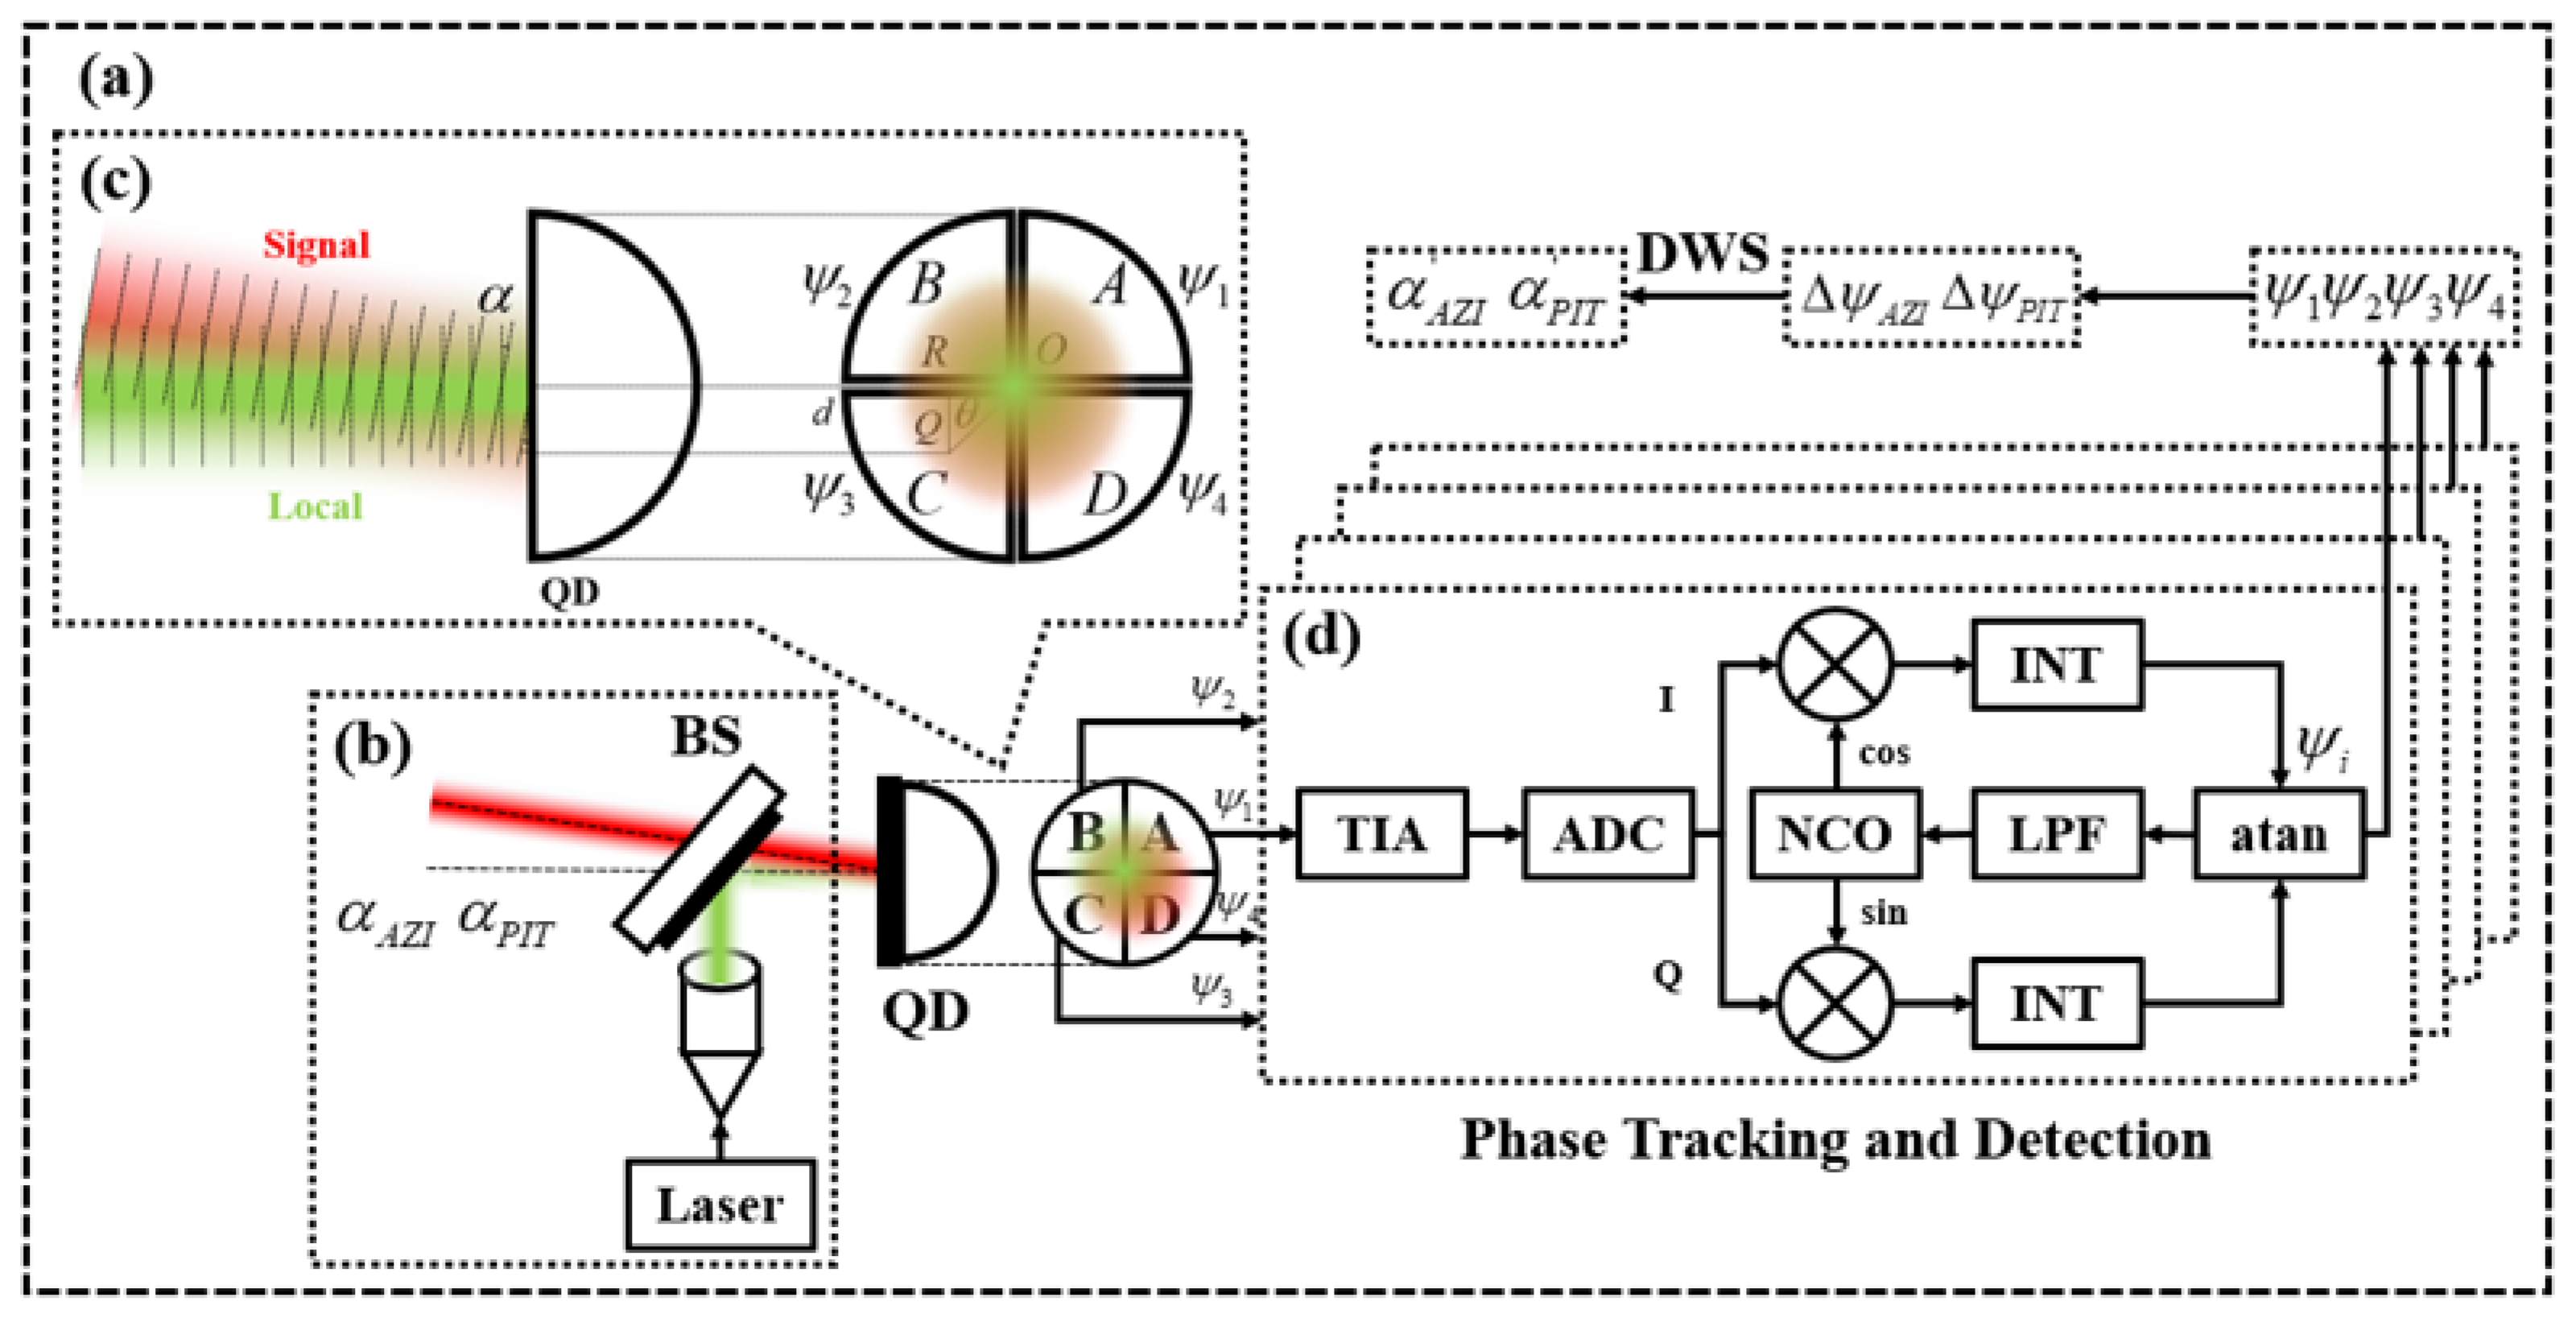
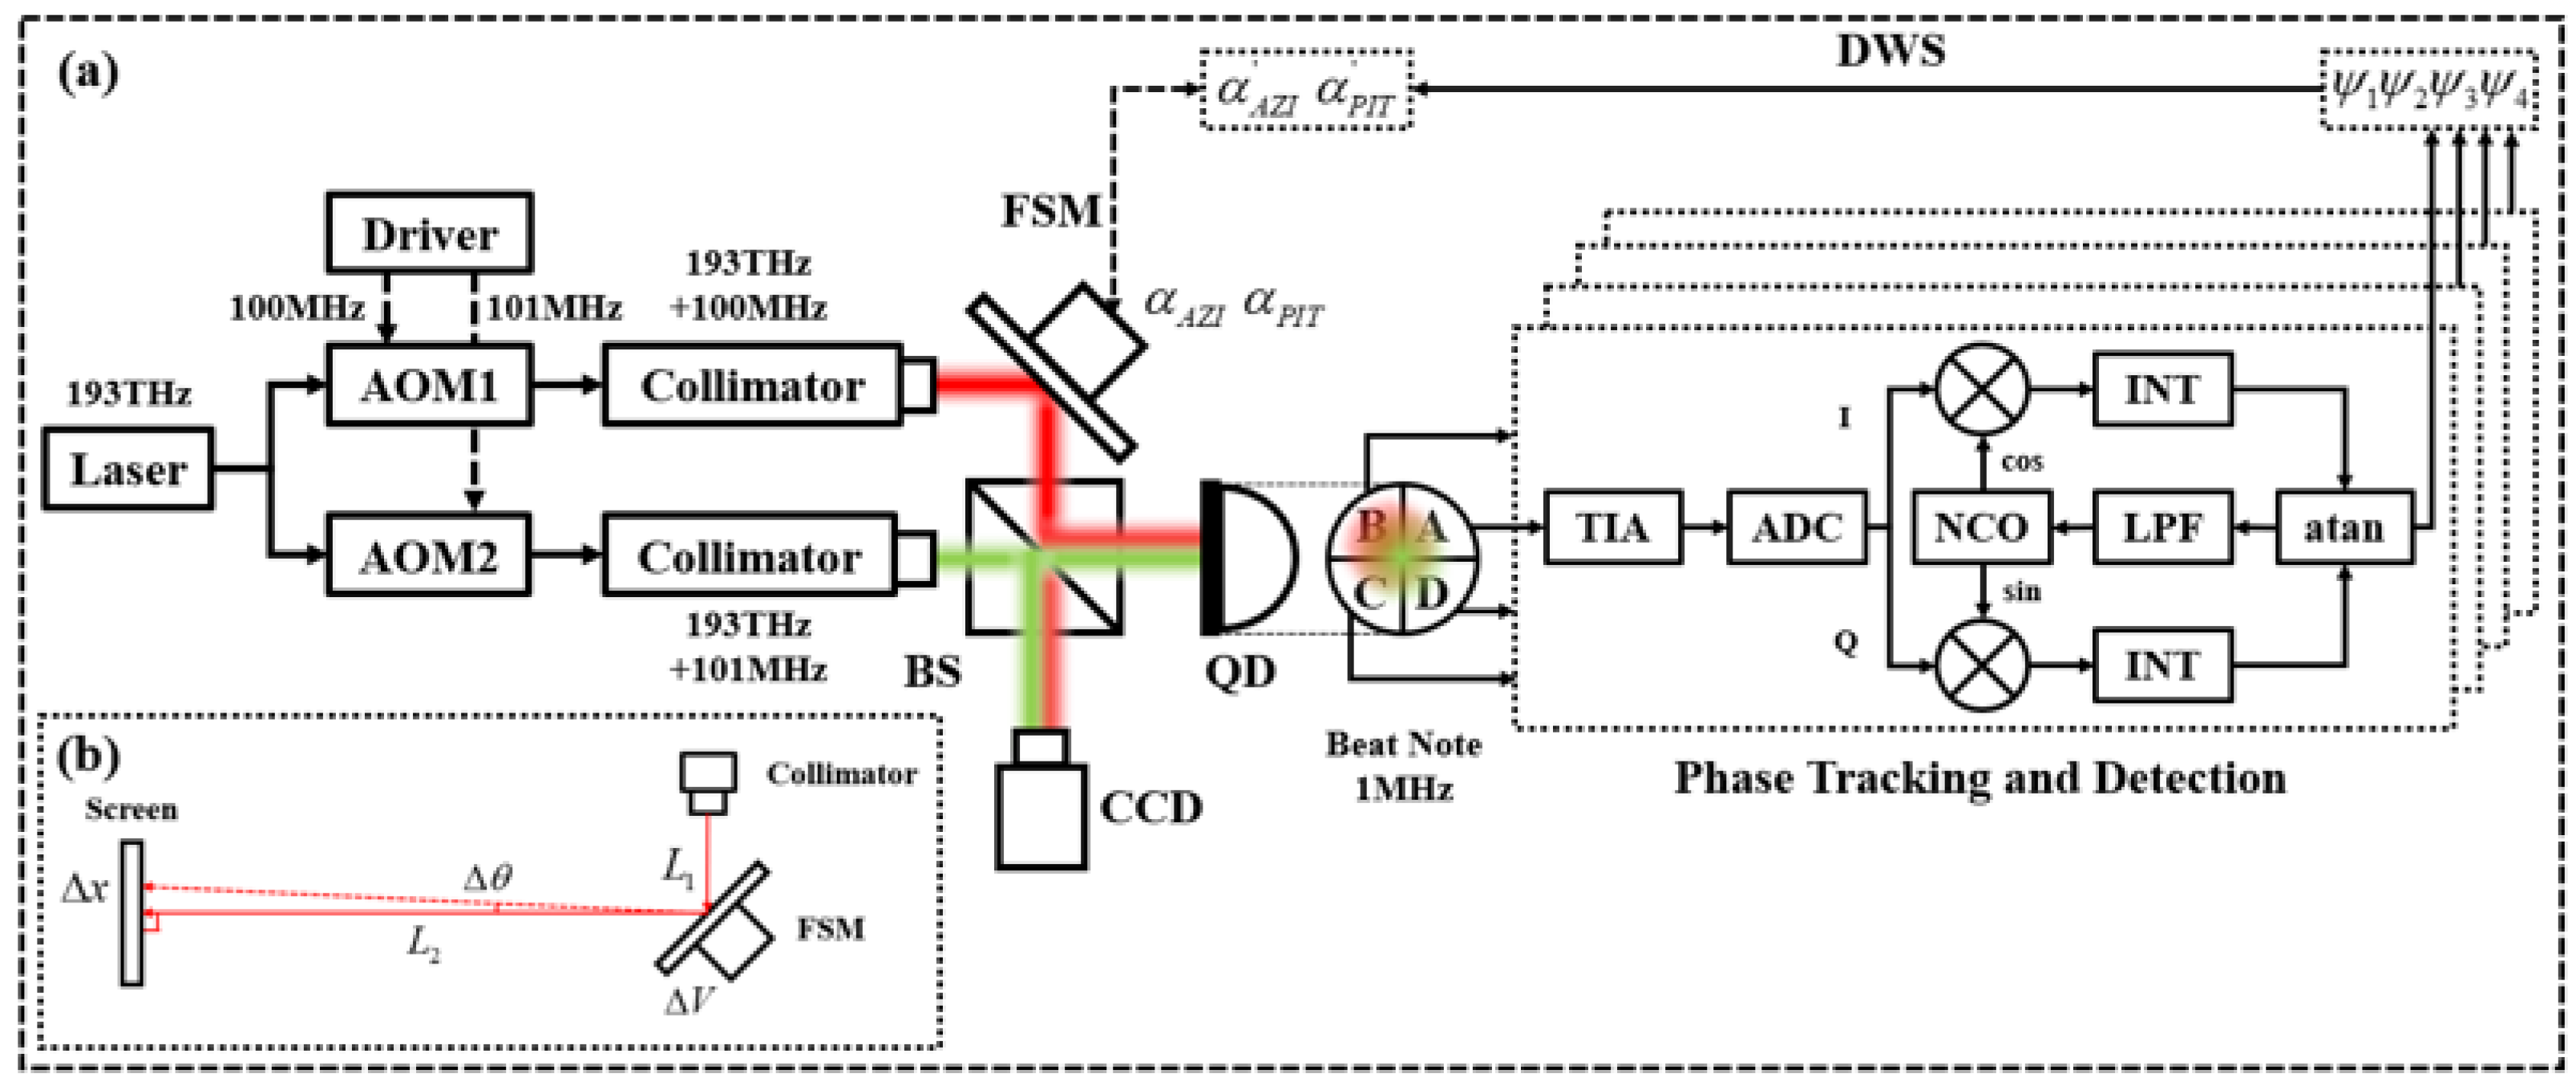
The block diagram illustrating the principle flow of the heterodyne coherent angle measurement is shown in Figure 1a. At the optical front end, as shown in Figure 1b, the signal laser beam (red beam) and the local oscillation laser beam (green beam) propagate to the QD photosensitive surface through the 50:50 beam splitter, and there is an initial frequency difference between the two laser beams, which generates a beat frequency signal corresponding to the frequency difference. As shown in Figure 1c, at the QD photosensitive surface, the local oscillation laser beam is collimated into the incident beam, and the relative rotation or motion between the terminals causes the signal laser beam to have an incident angular deviation αAZI and αPIT along the azimuth and pitch axes, respectively. According to the principle of the angular phase conversion of DWS, the angular deviation of the signal laser beam makes the phase of the beat frequency signal in each quadrant of the QD differ from that of ψ1, ψ2, ψ3, and ψ4. Each quadrant of the beat frequency signal is then entered into the phase tracking and detection module for high accuracy measurement of the phase, as shown in Figure 1d. The signal is first processed by a signal conditioning circuit, followed by amplification through a transimpedance amplifier (TIA), and then converted from analog to digital using an analog-to-digital converter (ADC). Thereafter, the signal enters the Costas phase-locked loop, a specialized circuit dedicated to phase tracking and detection. This loop comprises a phase discriminator (multiplier), an integrator (INT), a loop filter (LPF), and a numerically controlled oscillator (NCO). By adjusting the output frequency of the NCO signal, the NCO tracks the phase of the beat frequency signal, obtains the phase ψ1, ψ2, ψ3, and ψ4 of the beat frequency signal in each quadrant at the same moment, and solves for the phase difference ΔψAZI and ΔψPIT. Finally, through the DWS phase-angle conversion process, the phase difference is converted to angle αAZI, αPIT, thus realizing the measurement and compensation of the initial incidence angle deviation αAZI, αPIT of the signal laser beam.
First, the spatially coherent mixing process of the optical front-end was analyzed, as showed in Figure 1b. In accordance with the coherence condition, the signal and the local oscillation laser beam were configured to be linearly polarized laser beams with parallel polarization vectors. It was observed that there was a certain degree of deviation in the wavefront phase of the signal laser beam. The two laser beams were then subjected to a process of coherent mixing at the QD photosensitive plane, with the vector r representing the QD plane. The signal and the local oscillation laser beam light fields ES (r, t) and ELO (r, t) can be expressed as Equation (1), where the variables |ES(r)| and |ELO(r)| represent the light intensity, ψS(r) and ψLO(r) represent the wavefront phase generated by the incident angular deviation, ωS and ωLO represent the angular frequency, φS and φLO represent the initial optical phase, and t represents the time [6].
  E S r , t = E S r × exp i ψ S r × exp i ω S t + φ S E L O r , t = E L O r × exp i ψ L O r × exp i ω L O t + φ L O
The received optical power P(t) of the QD photosensitive surface can be expressed as Equation (2), where PS, PLO are the DC components, QD denotes the detector photosensitive surface area, and ρ, ε denote the transmittance and reflectance of the optical beam splitter (0 < ρ, ε < 1), respectively. The beat frequency signal is the AC component, ωhet = ωSωLO denotes the angular frequency difference, Δψ(r) = ψS(r) − ψLO(r) denotes the wavefront phase difference, and Δφ = φSφLO denotes the initial optical phase difference.
P t = Q D ρ E S ( r , t ) + i ε E L O r , t 2 d A = ρ 2 P S + ε 2 P L O D C + 2 ρ ε Q D E S r E L O r cos ω h e t t + Δ ψ r Δ φ d A A C P S = Q D E S r 2 d A P L O = Q D E L O r 2 d A
After the triangular transformation of the AC signal, the received optical power P(t) can be expressed as Equation (3), where γ denotes the heterodyne efficiency, which is used as a measure of coherent receiver performance. It is expressed in the QD photosensitive surface as the proportion of the overlapping area of the light spot presented by the signal and the local oscillation laser beams. Δϕ denotes the phase difference information of the two laser beams. For a 50:50 optical beamsplitter, ρ = ε = 1/√2.
P ( t ) = ρ 2 P S + ε 2 P L O + 2 ρ ε P S P L O γ cos ω h e t t + ψ γ = Q D E S ( r ) E L O * ( r ) d A 2 Q D E S ( r ) 2 d A Q D E L O ( r ) 2 d A = Q 2 + I 2 P S P L O
where the I and Q variables in Equation (3) are associated with the amount of wavefront phase difference Δψ(r) caused by the angular deviation between the laser beams. This can reflect the changes in amplitude and phase of the beat frequency signal. The expressions of the I and Q variables are shown in Equation (4), where dA denotes the integral operation carried out on the QD surface.
Q = Q D E S r E L O r sin Δ ψ r d A I = Q D E S r E L O r cos Δ ψ r d A
After substituting the above parameters, the received optical power P(t) and photocurrent I(t) in each quadrant of the QD can be expressed as Equation (5), where ξ denotes the photodiode efficiency, qe denotes the electron charge (1.602 × 10⁻¹⁹ C), λ denotes the laser wavelength, h denotes the Planck constant (6.626 × 10⁻³⁴ J*s), c denotes the speed of the beam, η denotes the photodiode responsivity, and N denotes the number of detector quadrants.
P t = P S 2 N + P L O 2 N + 1 N P S P L O γ cos ω h e t t + ψ I t = ξ q e λ h c P t = η P S 2 N + P L O 2 N + 1 N P S P L O γ cos ω h e t t + ψ
In actual scenarios, the incident angle deviation of the signal laser beam will cause differences in the phase information of the signals received by different quadrants of the detector. By combining the phase difference and DWS technology to calculate the angle deflection amount, the measurement and compensation of the incident angle deviation of the signal laser beam can be achieved.
A detailed derivation of the DWS angular phase conversion process is given below, based on Figure 1c. This was first analyzed based on the plane wave model in the QD photosensitive surface. The local oscillation laser (green beam) is incident collimated, the signal laser (red beam) has an incident angular deviation α, and the spot radius is R. The QD origin is O, and the channel width is d. For any point Q in the spot area, the distance from the origin is y, and the angle between OQ and the detector’s azimuthal axis is θ.
For the pitch axis direction, the optical range difference between point Q and point O is y* × sinθ × sinα, and the corresponding phase difference is y × sinθ × sinα × 2π/λ [19]. Integral averaging of the phase difference between each point and point O in each quadrant of the spot area yields the output wavefront phase value ψ. The expressions for the output wavefront phase values ψA, ψB, ψC, and ψD in each quadrant are as follows.
ψ A = ψ B = 1 1 / 4 π R 2 × 2 π λ × 0 1 / 2 π d / 2 R y × sin θ × sin α × r d r d θ = 8 R 3 d 3 3 λ R 3 sin α ψ C = ψ D = 1 1 / 4 π R 2 × 2 π λ × π 3 π / 2 d / 2 R y × sin θ × sin α × r d r d θ = 8 R 3 d 3 3 λ R 3 sin α
The relationship between the pitch axis phase difference ΔψPIT and the angular deflection α is established by the wavefront phase in each quadrant and can be expressed as Equation (7). A similar relationship exists between the azimuthal phase difference ΔψAZI and the angular deflection α.
Δ ψ P I T = 1 2 ψ A + ψ B ψ C ψ D = 16 R 3 2 d 3 3 λ R 2 sin α Δ ψ A Z I = 1 2 ψ A + ψ D ψ B ψ C = 16 R 3 2 d 3 3 λ R 2 sin α
In the small angle deflection case, the approximation is: sinαα. The relationship between the QD wavefront phase difference Δψ and the angular deflection α can be expressed as Equation (8). This relation is mainly affected by the gap width d and spot radius R.
Δ ψ 16 R 3 2 d 3 3 λ R 2 α
In the heterodyne interferometry system in the field of actual gravitational wave detection, after the signal laser beam is transmitted over an ultra-long distance in space, it will approximately follow a flat-top distribution when it reaches the detector at the receiving end. The local oscillator laser beam will follow a Gaussian distribution when reaching the detector at the receiving end. The DWS signal will be affected simultaneously by the far-end flat-top beam and the local Gaussian beam [20,21].
The laser source is located at the origin in the spatial Cartesian coordinate system, and the z-axis represents the direction of transmission of the beam perpendicular to the photosensitive surface of the detector. The complex amplitude of the local Gaussian beam traveling along the Z-axis can be expressed as Equation (9) [22], where A0, zg, ω(zg), and R(zg) represent the amplitude, propagation distance of the Gaussian beam, spot radius, and wavefront radius of curvature at position zg, respectively. The term φ(zg) denotes the additional optical phase.
E G x , y , z = A 0 ω z g e x 2 + y 2 ω 2 z g i k x 2 + y 2 2 R z g + i φ z g + z g
The complex amplitude of the distal flat-top beam traveling along the z-axis can be expressed as Equation (10), where E0 denotes the amplitude, ωf denotes the spot radius of the flat-top beam in the detector’s photosensitive plane, and zf denotes the distance traveled by the flat-top beam.
E f t x , y , z = E 0 e k i z f x 2 + y 2 ω f 2
In a practical system, the signal laser beam from the far end will be truncated by the circular aperture of the optical antenna at the receiving end, thus presenting a circular spot pattern in the QD photosensitive surface. To simplify the analysis, it was assumed that the signal laser beam was truncated by a square aperture tangent to the actual circular aperture, causing it to present a square spot pattern in the QD. This approximation did not change the results of the qualitative analysis.
To illustrate the derivation and analysis of the resulting mathematical analytical equation, let us consider the angular deflection of the signal laser beam along the azimuthal axis. It can be shown that this equation will also be applicable to the pitch axis direction. The complex amplitudes of the heterodyne interferometric signals in the left and right half quadrants of the QD can be expressed as Equation (11), respectively, where α denotes the deflection angle of the signal laser beam along the azimuth axis.
E l e f t = S l e f t E G x , y , z × E f t x , y , z d S = E 0 × C 1 × C 2 × C 3 E r i g h t = S r i g h t E G x , y , z × E f t x , y , z d S = E 0 × C 1 × C 2 × C 4
where C1, C2, C3, and C4 have the following expressions, respectively.
C 1 = A 0 ω z g e i ψ z g i k z g i k sin ϕ x 0 + i k z f C 2 = ω f ω f e y 2 ω 2 z g i k y 2 2 R z g d y C 3 = x 0 R cos α d e x 2 ω 2 z g i k x 2 2 R z g + i k sin α x d x C 4 = d x 0 + R cos α e x 2 ω 2 z g i k x 2 2 R z g + i k sin α x d x
According to the above equation, the DWS signal can be expressed as follows.
Δ ψ A Z I = arg E r i g h t arg E l e f t
As demonstrated by the derivation results outlined above, it can be concluded that the DWS signal is predominantly influenced by the signal laser beam deflection angle α, the QD channel width d, the spot radius R, and the offset of the signal spot center of mass in the QD photosensitive surface x0.
Subsequent to the conversion of the angular deflection into a phase difference in the QD photosensitive surface, the phase tracking and detection module utilizes a Costas phase-locked loop to measure the received signal phase, denoted as ψS, with a high degree of accuracy, as shown in Figure 1d. Within a specific quadrant of the QD, the input signal VS(t) of the phase-locked loop can be expressed as follows:
V S t = A S sin ω h e t t + ψ i i = 1 , 2 , 3 , 4
The NCO in the phase-locked loop generates in-phase VNCOI(t) and quadrature branch signals VNCOQ(t) (ωNCOωhet) of a frequency that is similar to the input signal based on the initial frequency word. VNCOI(t) and VNCOQ(t) can be expressed as Equation (15). The phase tracking is achieved through constant feedback adjustment ωNCO during the loop locking process.
V N C O I t = A N C O cos ω N C O t + ψ N C O V N C O Q t = A N C O sin ω N C O t + ψ N C O
The NCO in-phase and quadrature signals are multiplied, integrated, and averaged with the input signals to obtain VINTI(t) and VINTQ(t), respectively. VINTI(t) and VINTQ(t) can be expressed as Equation (16). Subsequently, interference terms such as ωhet + ωNCO in the multiplication result are filtered out, and the ωhetωNCO containing the phase difference are retained. This process is analogous to a low-pass filter in a conventional phase-locked loop.
V I N T I t = A S A N C O 2 sin ω h e t ω N C O t + ψ i ψ N C O A S A N C O 2 sin ψ i ψ N C O V I N T Q t = A S A N C O 2 cos ω h e t ω N C O t + ψ i ψ N C O A S A N C O 2 cos ψ i ψ N C O
After completing the integration for the mean value, the output signals of the in-phase and quadrature branches perform the atan operation to directly solve for the phase difference information ψi − ψNCO. The phase difference between the input signal and the NCO signal at this point is obtained and used as the input signal of the loop filter, and the NCO frequency word is adjusted accordingly. The phase difference solving process is shown in Equation (17).
a r c tan V I N T I t V I N T Q t = ψ i ψ N C O i = 1 , 2 , 3 , 4
After this, by constantly combining the current phase difference ψi − ψNCO to the NCO frequency ωNCO feedback adjustment. This process gradually leads to the convergence of the phase difference to 0. Following the completion of phase tracking, the NCO index serves as the current moment of the phase information. This is then utilized in the subsequent phase angle conversion step, thereby facilitating the high accuracy measurement of the angle.
In a phase-locked loop, the input signal VS(t) will contain additive Gaussian white noise n(t) with mean 0 and variance σ2, and the phase jitter variance σ2ψn generated by this noise can be expressed as Equation (18), where SNR denotes the input signal-to-noise ratio, and Psig and Pn denote the signal and noise power, respectively.
σ ψ n 2 = 1 2 S N R = P n 2 P s i g
Gaussian white noise n(t) will introduce phase noise containing systematic and random errors to the phase-locked loop. In this case, the systematic error is accompanied by the phase higher-order dynamic stress of the input signal, and the random error is generated by the noise factor. Combining the one-sided power spectral density N0 of the noise n(t) and the input signal power Pin of the phase-locked loop, the conversion of the phase jitter variance δ2ψn generated by the random error to the equivalent loop bandwidth Bn can be expressed as Equation (19) [23]. It can be seen that the increase in the loop bandwidth Bn will lead to a decline in the loop phase locking performance, thereby affecting the angle measurement performance. The main reason is that excessive adjustment of the loop leads to the introduction of random errors. Meanwhile, if Bn is too small, it will also make it difficult for the loop to correctly detect the signal phase. The main reason is that the adjustment of the loop being too small leads to the introduction of systematic errors. In this part, further analysis is carried out in combination with the relevant data in the experimental system.
δ ψ n 2 = N 0 2 P i n 0 + H j 2 π f 2 d f = N 0 B n 2 P i n
Furthermore, the system noise sources and SNR are also influenced by the power of the local oscillation laser beam PLO. The noise sources of the heterodyne coherent angular measurement system primarily comprise the thermal noise Pth generated by the detector device, the shot noise Psh generated by the local oscillation laser beam, and the laser relative intensity noise PRIN generated by the laser. The power level of each noise can be expressed as Equation (20). In this equation, k denotes the Boltzmann constant, T denotes the Kelvin temperature, B denotes the detection bandwidth, RL denotes the load resistor resistance, ν denotes the optical frequency, and R denotes the laser suppression ratio parameter.
P t h = 4 k T B R L P s h = 2 ξ q e 2 B P L O h ν P R I N = R q e ξ h ν 2 B P L O 2
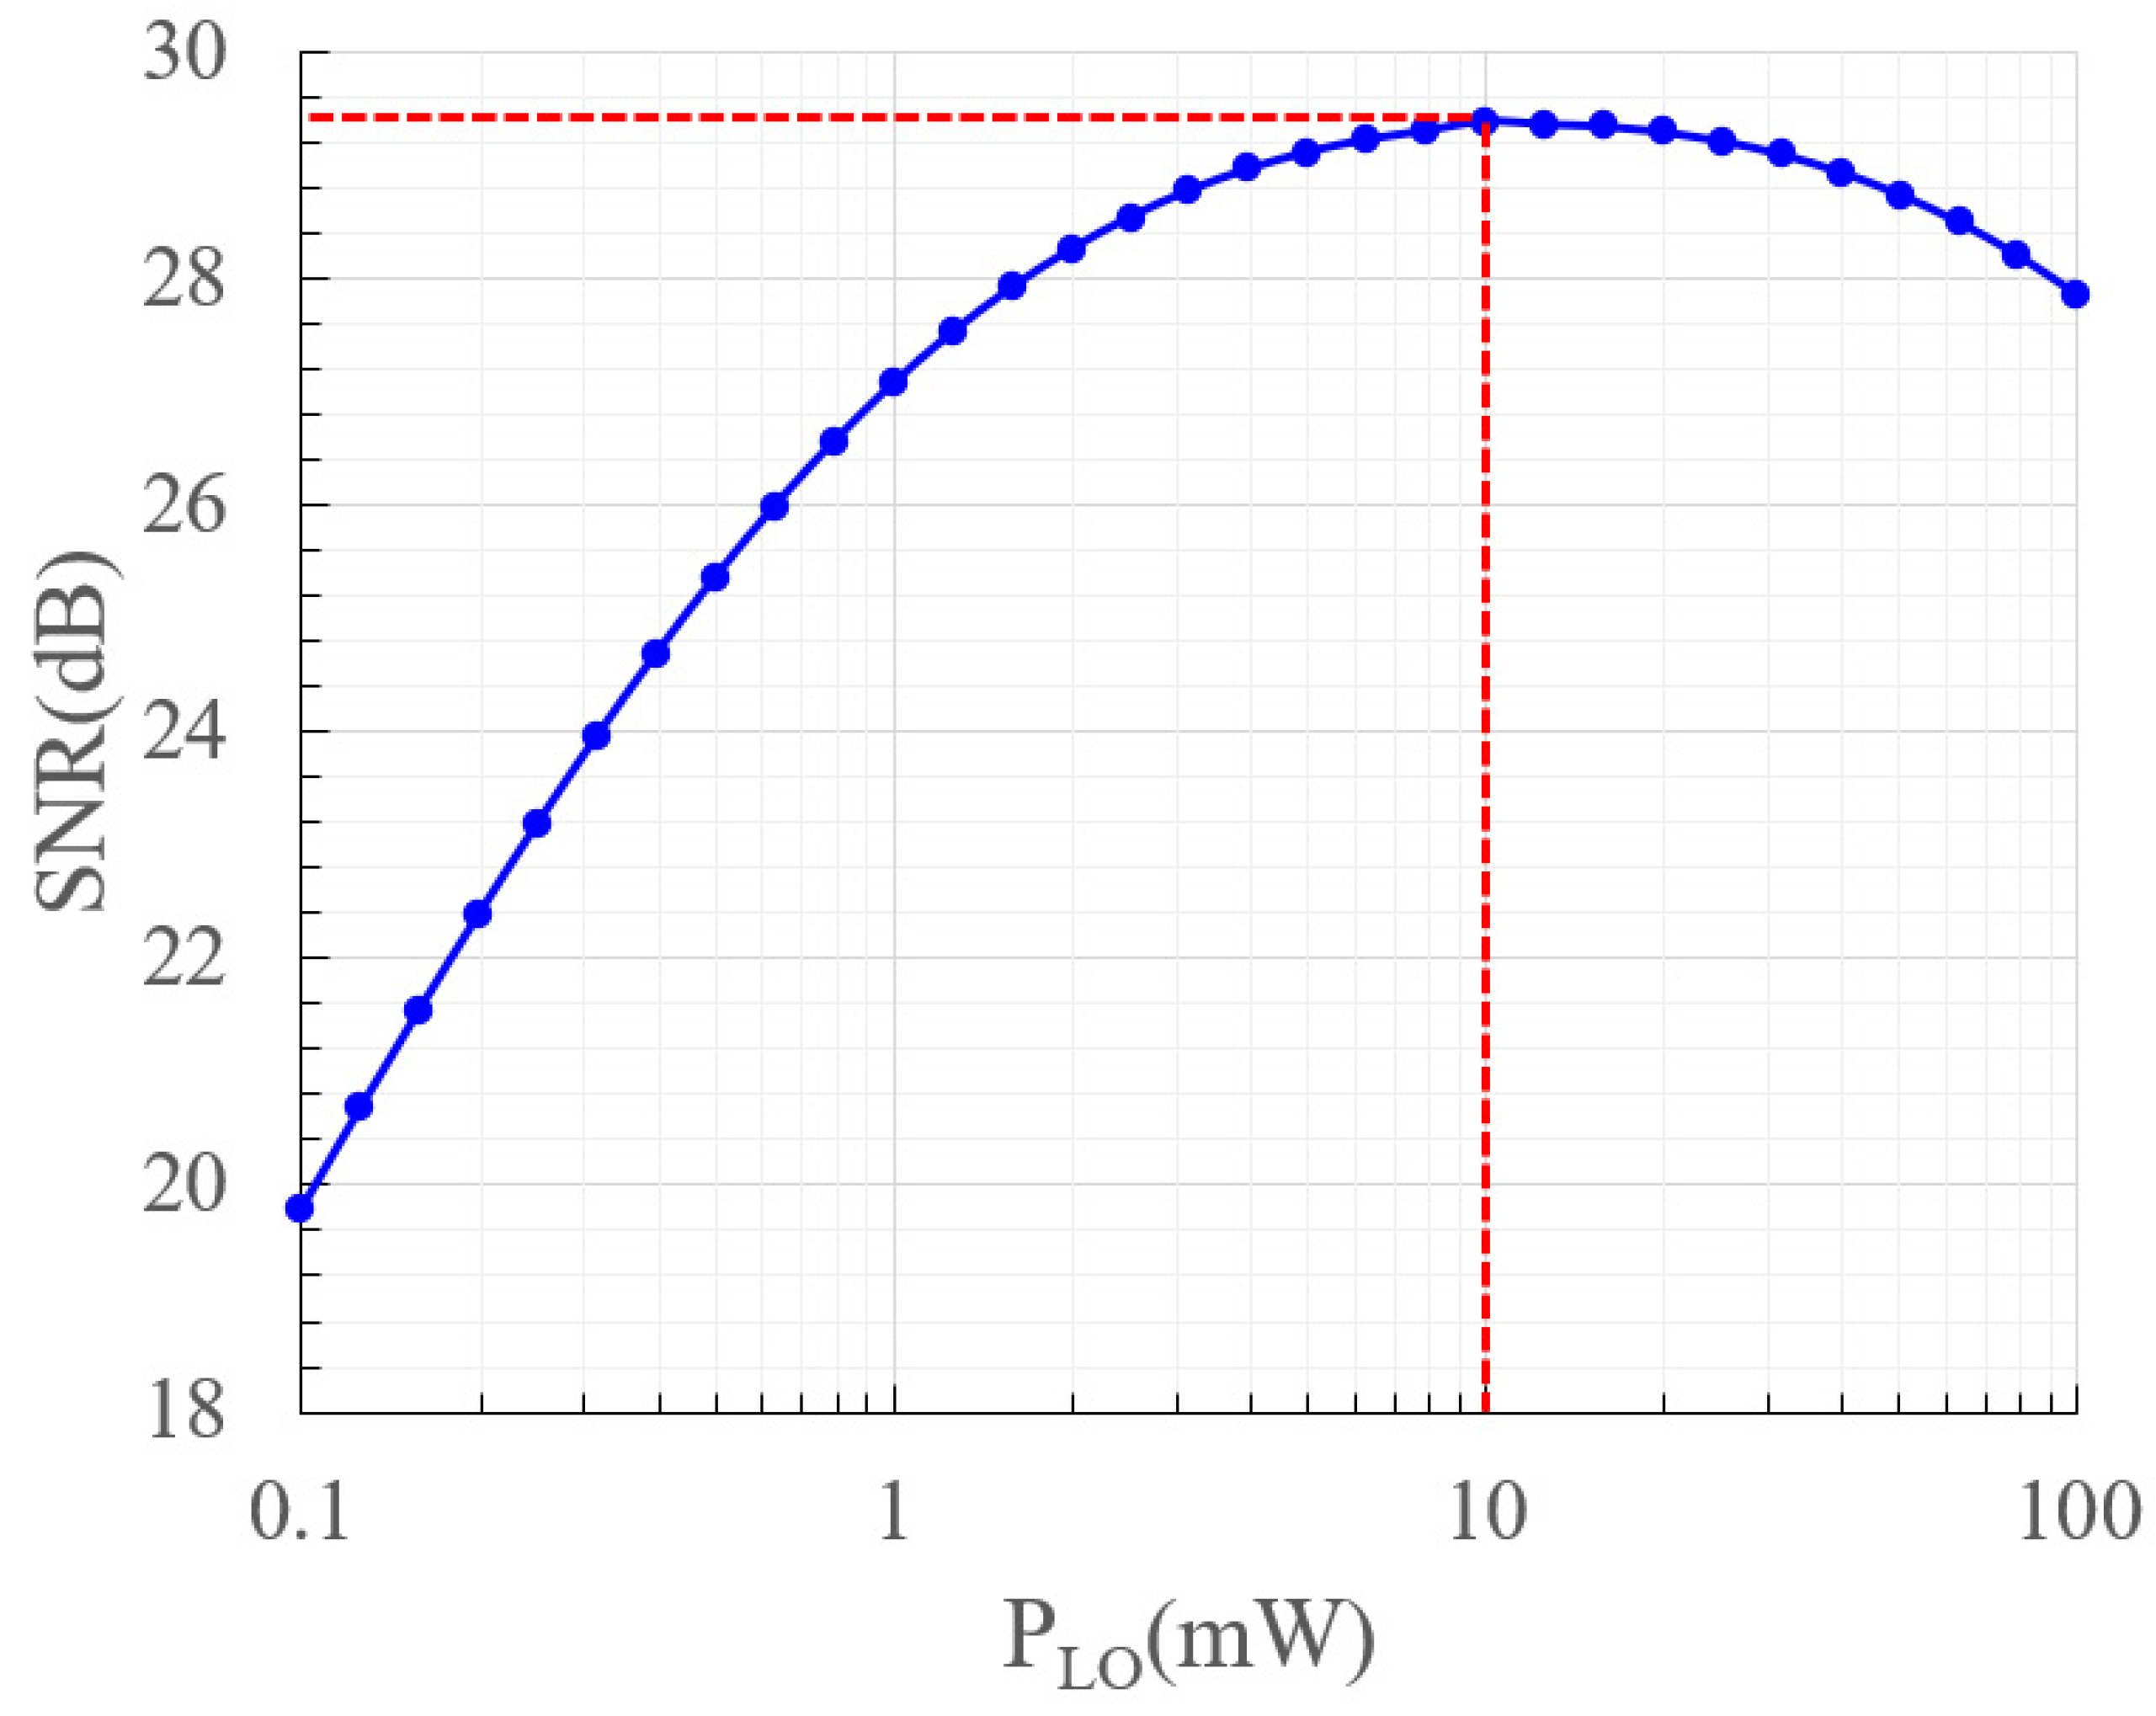
Combined with the beat frequency signal power expression in Equation (5), the SNR is obtained to have the following expression [24].
S N R = 2 ξ q e h ν 2 P L O P S P t h + P s h + P R I N = ξ P S B h ν 1 + 2 k T h ν ξ q e 2 P L O R L + ξ R P L O 2 h ν 1
Combined with the weak light detection background, when the signal laser beam power PS is 20 nW, the signal-to-noise ratio SNR with the local oscillation laser beam power PLO variation graph is as shown in Figure 2. When the PLO is 10 mW, the SNR attains its optimal value. In addition, the most suitable PLO needs to be further selected in combination with the device’s performance to ensure optimal functionality within the actual system.

3. System and Simulation

The construction of the simulation system for the heterodyne coherent angle measurement was predicated on the analysis of the above principle (see Figure 3 for a program block diagram). The initial angular deflections αAZI and αPIT were set along the azimuth and pitch directions, respectively, and converted to the phase ψ1, ψ2, ψ3, and ψ4 of the beat-frequency signals in each quadrant through the DWS process. The Monte Carlo method was adopted to simulate the spot presented by the laser beam in the QD photosensitive surface through random points, and the beat frequency signal was obtained based on the statistical points in each quadrant of the detector, which was used as the input signal of the Costas phase-locked loop simulation module.
The NCO generates in-phase (COS) and quadrature (SIN) signals from the initial frequency word and multiplies them with the NCO signal through the multiplier MULT. The output will contain the phase difference Δψ between the two signals. The result of the multiplication is then integrated and averaged in the integrator INT, and the interfering terms, such as the sum-of-frequencies component, are filtered out by using the periodicity of the sinusoidal signal. Subsequently, the in-phase and quadrature branch integration results are subjected to an atan operation to obtain the phase difference, denoted as Δψ, at the current moment. If the phase difference caused by the initial angle deviation exceeds 2π, it is necessary to first capture the beat frequency signal, eliminate the integer 2π parts of the phase difference, and then continue with phase tracking and detection. Concurrently, the loop filter LPF dynamically adjusts the frequency word of the NCO according to Δψ. Thereafter, the frequency fNCO of the NCO signal is continuously adjusted to ultimately realize phase tracking of the beat frequency signal.
Once the loop is locked, each quadrant outputs the phase values of ψ1′, ψ2′, ψ3′, and ψ4′ at the current moment, based on the NCO index. The phase difference ΔψAZI, ΔψPIT in the azimuth and pitch directions, respectively, are then calculated. The angular deflection, denoted as αAZI′ and αPIT′, is then obtained through the DWS phase-angle conversion process. This process enables the realization of the high-accuracy measurement and compensation of the initial angular deflection, αAZI and αPIT.
In the phase-locked loop, the loop filter dynamically adjusts the frequency of the NCO signal based on the leading and lagging characteristics of the phase of the NCO signal relative to the beat frequency signal. The NCO frequency is calculated based on the parameters of the current moment and the previous moment. The calculation process is as follows:
f N C O = f N C O o l d + T τ 1 × Δ ψ + τ 2 τ 1 × Δ ψ Δ ψ o l d
In this equation, fNCO and fNCOold represent the current and previous NCO signal frequencies, respectively, Δψ and Δψold represent the phase difference between the beat frequency signal and the NCO signal, T denotes the integration time, and τ1 and τ2 represent the filter coefficients.
The angular measurement accuracy is expressed as the fluctuation of the angle between the coherent beams recognized by the QD compared with the true result [17] and is evaluated by the standard deviation of the difference between the true value of the angular deflection αAZI and the measured value αAZIi. The angular measurement accuracy has the following expression:
σ = 1 N i = 1 N α A Z I i α A Z I 2
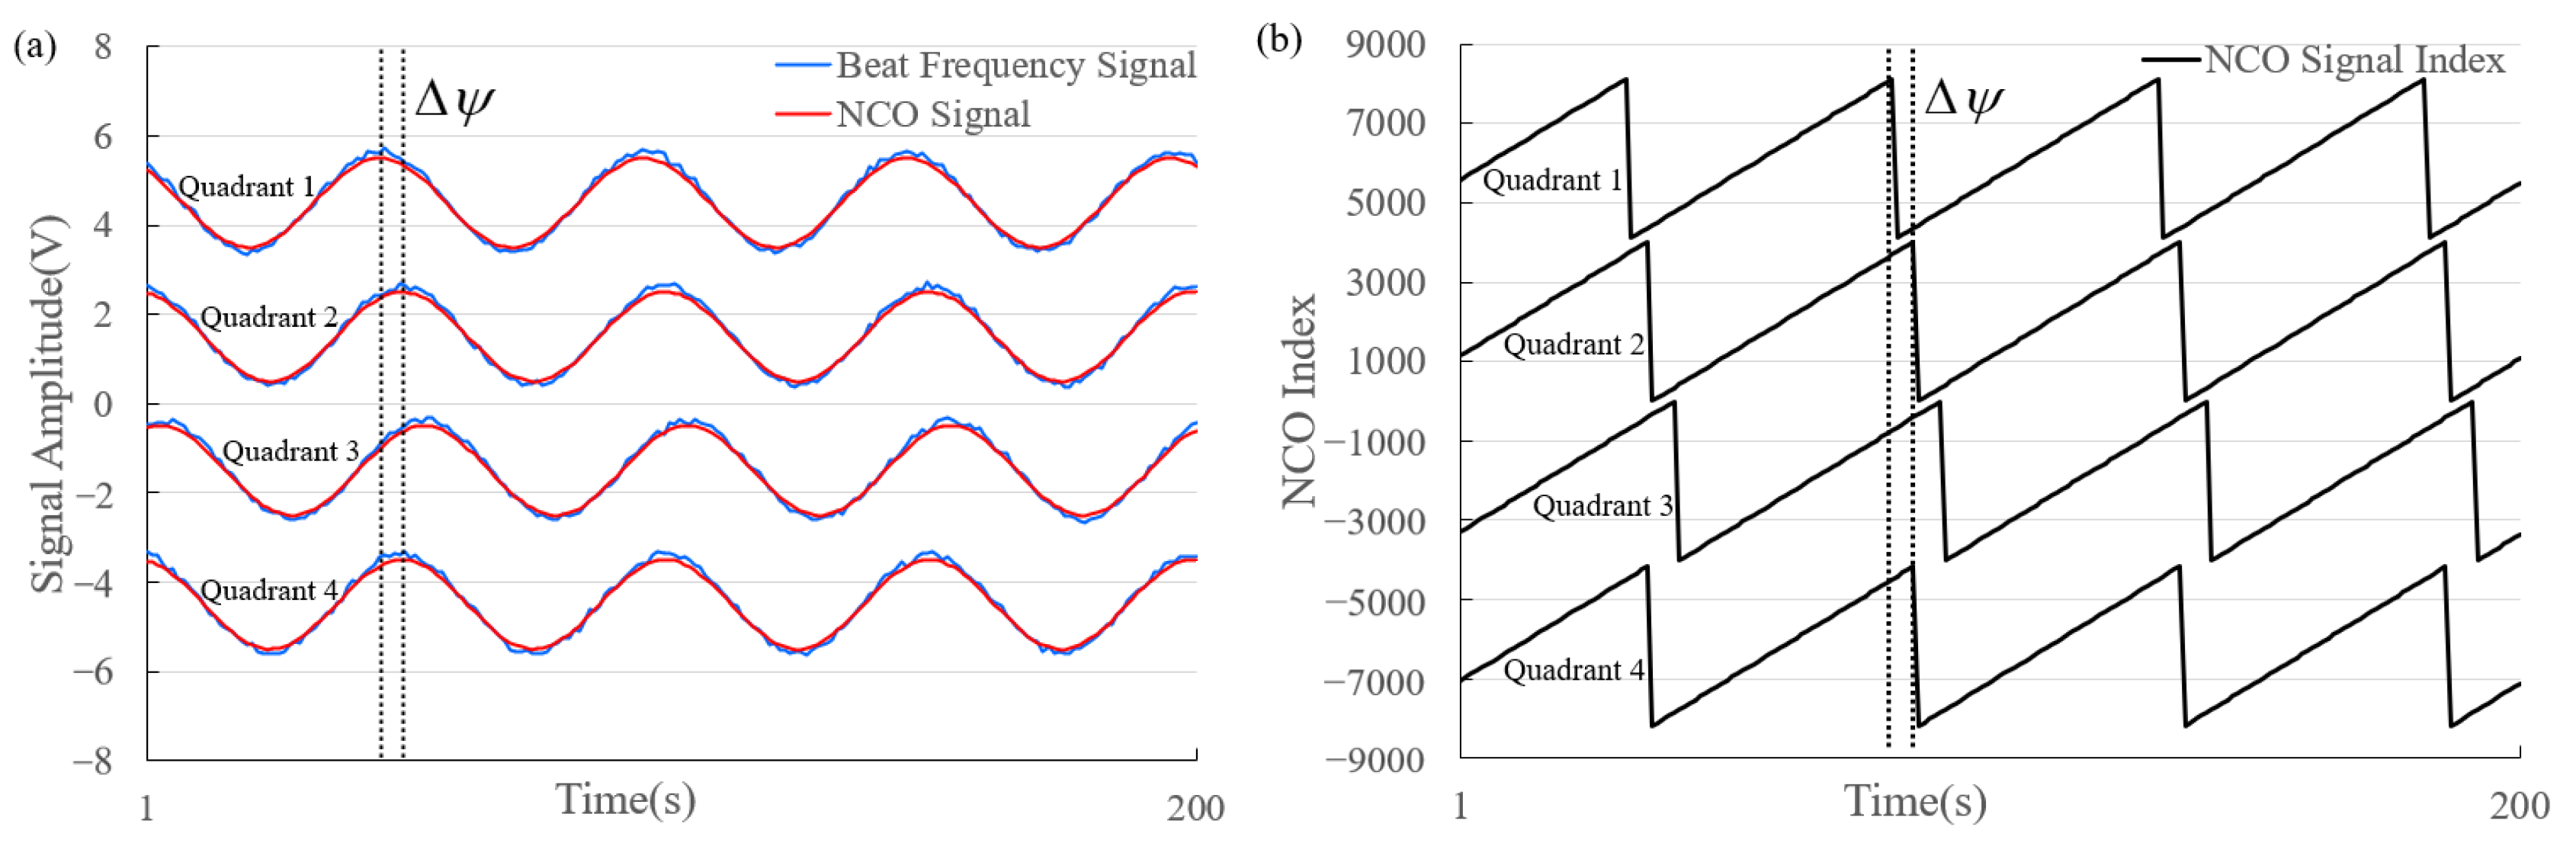
In the simulation system of the heterodyne coherent angle measurement, the following parameters were observed: the laser wavelength was 1550 nm, the beat signal frequency was 1 MHz, the QD photosensitive surface diameter was 3 mm, the spot diameter was 2 mm, the sampling frequency was 50 MHz, and the number of sampling bits was 12. To accentuate the phase difference between the quadrants, the initial angle deflection of the azimuth and pitch axes were set to 300 μrad, and the initial frequency of the phase-locked NCO output signal was also set to 1 MHz. The tracking results of the NCO signals in each quadrant on the phase of the beat frequency signal are shown in Figure 4a. Following the establishment of a locked loop, the current phase information was characterized according to the index of the NCO output signal in each quadrant concurrently. The ensuing results are illustrated in Figure 4b. To facilitate the visualization of the phase differences in the signals within each quadrant, a certain amount of direct flow was superimposed on the signals during the plotting process, which allowed for differentiation of the signals.
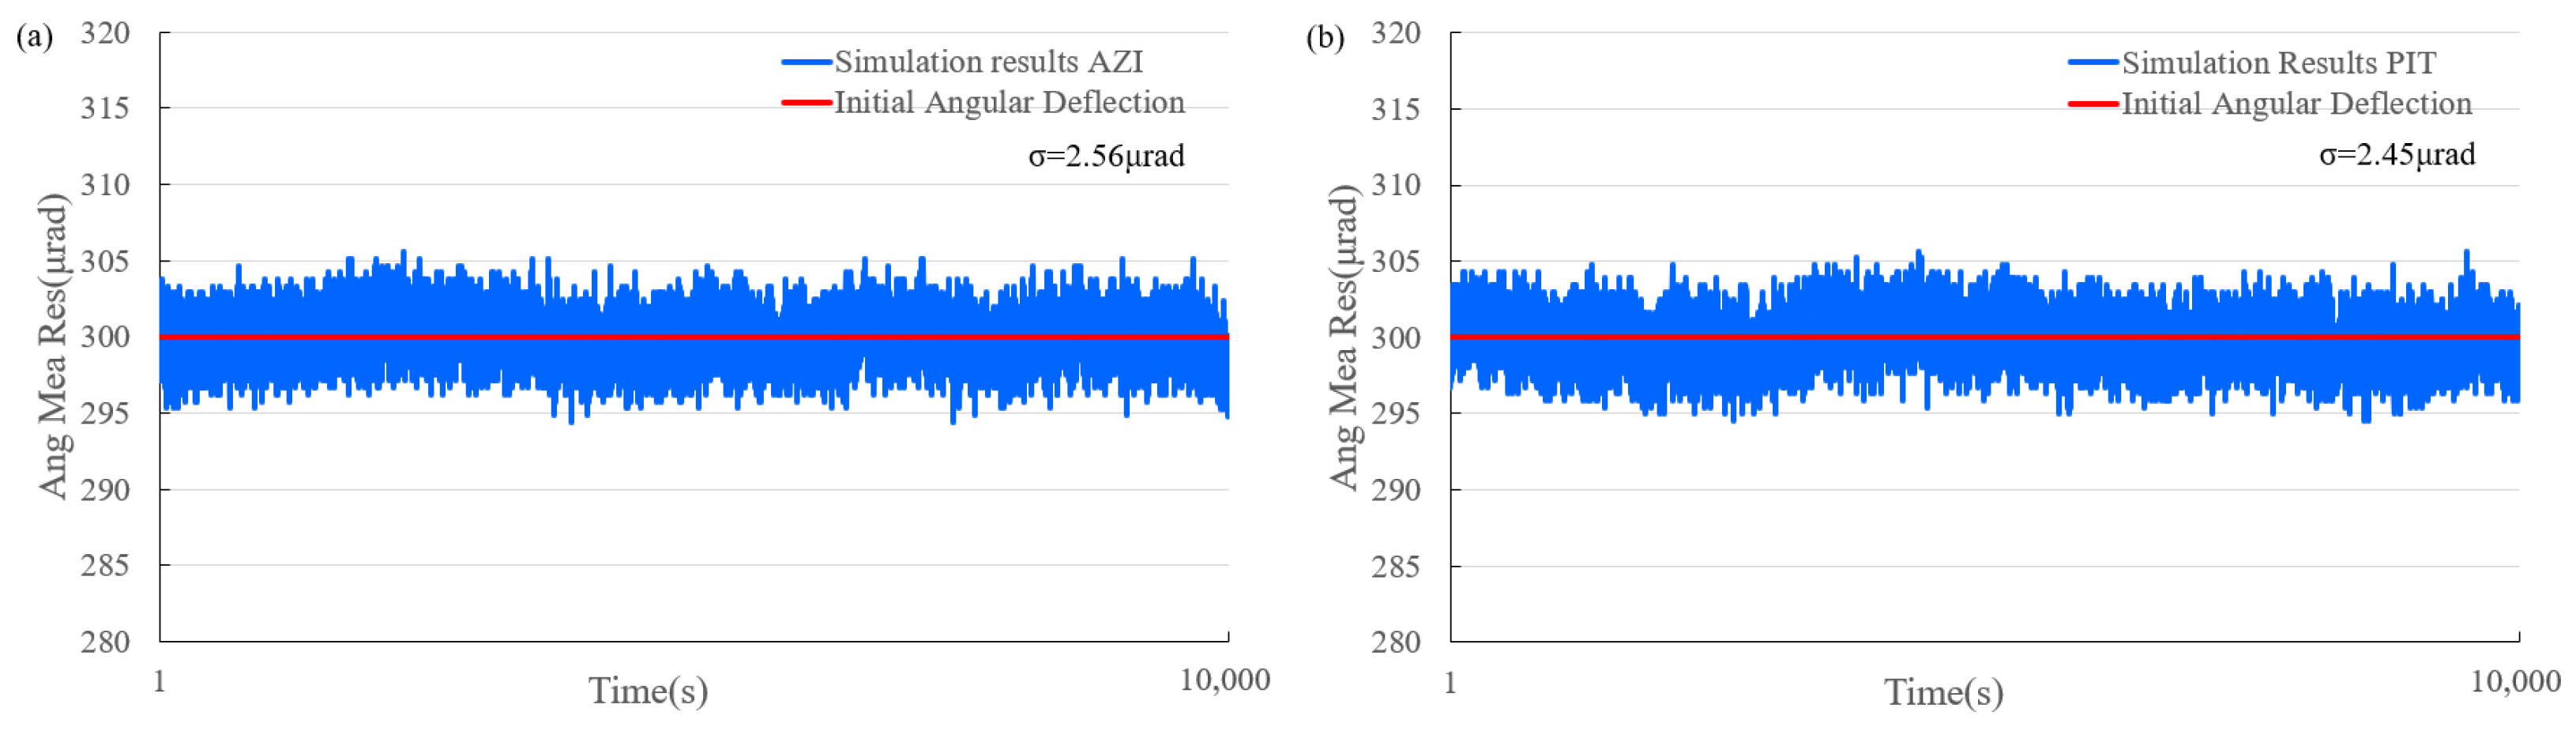
The initial angular deflections of the azimuth and pitch axes were calculated and measured based on the NCO output signal index of each quadrant. The angle measuring results are shown in Figure 5.
The experimental results indicate that the accuracy of the heterodyne coherent angle measurements in the azimuth and pitch directions was 2.56 μrad and 2.45 μrad, respectively. This suggests that the simulation system functioned properly in each module and was capable of measuring the given angular deflection with high accuracy.

4. Experiment and Results

4.1. System Setup

The experimental system for heterodyne coherent angle measurement was constructed based on the theoretical model and the results of the simulation system. The schematic block diagram of the experimental system is presented in Figure 6a. Figure 6b provides a detailed depiction of the fast-steering mirror (FSM) calibration process. Figure 7a showcases the physical diagram of the experimental system, while Figure 7b offers a visual representation of the laser beam spot inside the charge-coupled device (CCD). In this figure, the signal and local oscillation laser beams are depicted as being in an overlapping state. Among them, red represents the signal laser beam and green represents the local oscillation laser beam. A dual-channel parallel acousto-optic modulator (AOM) was adopted to offset the frequency of the signal and the local oscillator laser beam, simulating the heterodyne beat frequency signal generated by the frequency difference between the two laser beams in the actual system. After completing the angular calibration, FSM was utilized to deflect the signal laser beam by a known angle, thus simulating the angular shift of the laser beam incidence due to the relative rotation or motion of the terminals in the actual system. Four parallel Costas phase-locked loops were adopted to track and detect the phase of the beat frequency signal, accurately measuring the phase differences between the received signals in each quadrant of the QD. The DWS algorithm was adopted to further convert the phase difference into the angular deflection amount, and the standard deviation was calculated in combination with the FSM angular deflection amount, thereby achieving high-precision angular measurements.
The key parameters of the desktop experimental system for the heterodyne coherent angle measurements are shown in Table 1.
The experimental system for the heterodyne coherent angle measurements consisted of two subsystems: the coherent optical front-end and the angle accuracy measurement. The coherent optical front-end is responsible for simulating the signal and local oscillation laser beams within the actual system and for coherently mixing them in the QD photosensitive surface. This configuration is predicated on a beaconless space laser communication scenario. The system laser source is a 1550 nm narrow linewidth laser. The outgoing laser beam signal undergoes 50:50 beam splitting and enters the dual parallel AOM for frequency shifting. Following this process, the frequency of the local oscillation laser beam is 193 THz + 100 MHz, while the frequency of the signal laser beam is 193 THz + 101 MHz. The frequency-shifted fiber signal subsequently generates a spatial laser beam through a collimator, in which the signal laser beam is deflected at a known angle through the FSM. The two laser beams are then reflected and transmitted at the 50:50 spatial beam splitter, and transmitted together to the QD photosensitive surface for coherent mixing to produce a 1 MHz beat frequency signal.
The function of the angle precision measurement subsystem is to perform phase tracking and angle calculation on the beat frequency signal. After the QD front-end circuit converts the beat frequency signal into a digital signal, it enters the Costas phase-locked loop. The phase-locked loop is composed of a field programmable gate array (FPGA) and an advanced RISC machine (ARM). After the phase tracking is completed, the phase difference is calculated based on the NCO index of each channel, and the phase difference is converted into the azimuth and pitch axis angle in combination with DWS. The calculation result of this angle is then compared with the known deflection amount of FSM, thereby achieving a high-precision measurement of the angular deflection amount of the signal laser beam by the system.

4.2. Angular Resolution

The angular deflection of the signal laser beam in the experimental system was introduced by the FSM. Therefore, it was necessary to ensure that the angular deflection of the FSM matched the final angular deflection measured by the experimental system. Prior to the construction of the experimental system, it was imperative to calibrate the angular deflection of the FSM. The calibration process is delineated in Figure 6b.
In this experiment, the distance between the collimator and the FSM was represented by L1, which was 50 mm, and the distance between the FSM and the screen was represented by L2, which was 1930 mm. At this time, the laser beam was incident vertically with L2 >> L1. The driving voltage of the FSM was adjusted with ΔV, and the amount of movement of the center of mass of the spot in the screen was recorded with Δx. The angular offset Δθ at this time can be calculated with L2. To obtain more accurate calibration results, a different L2 was chosen to perform multiple sets of tests.
Following the calibration of the FSM azimuth and pitch axis angular deflections, the FSM was connected to the experimental system for the angular resolution test. The test results are shown in Figure 8. The FSM within the experimental system was actuated by piezoelectric ceramics, and the driving voltage adjustment step was set to ΔV = 0.2 V. Due to the configuration of the optical path, the angular deflection of the FSM in the azimuth axis will produce twice the angular deflection of the optical axis, while the angular deflection in the pitch axis will produce the square root of two times the angular deflection of the optical axis. Consequently, the angular deflection measurements of the azimuth and pitch axes were estimated to follow a square root relationship [19]. The experimental results demonstrate that the experimental system for heterodyne coherent angle measurement built in this paper can accurately measure the known deflection angle of FSM.

4.3. Angular Measurement Accuracy

In order to address the high accuracy requirements of long-distance beam measurements between satellites, an angle measurement accuracy test was conducted. The power of the signal laser beam transmitted into the QD photosensitive surface was adjusted to −16 dBm, the power of the local oscillation laser beam was −7 dBm, the bandwidth of the phase-locked loop was 10 Hz, and the angular deflections of the FSM azimuth and pitch axes were 0. In order to make the direct detection signal power higher than its sensitivity in the subsequent comparison experiments, which were designed to yield more informative experimental results, the signal laser beam power was set to −16 dBm. At this time, the accuracy of the heterodyne coherent angle measurement is shown in Figure 9. The experimental findings demonstrate that the azimuth axis angle measurement accuracy was 2.54 μrad, and the pitch axis was 2.85 μrad.
Next, the influence of the local oscillator laser beam power on the measurement accuracy of the heterochromatic coherence angle was tested. The main noise sources in coherent detection systems include thermal noise, shot noise, and laser relative intensity noise. The accuracy of the angle measurement will mainly depend on the signal-to-noise ratio of the system. When the power of the local oscillator laser beam is small, the signal-to-noise ratio increases with the increase in power. However, when the local oscillation laser beam power exceeds a certain threshold, the laser relative intensity noise becomes the dominant factor, leading to a decrease in the signal-to-noise ratio with increasing power [24]. Therefore, it is essential to select the optimal power of the local oscillation laser beam by integrating the above characteristics with the specifications of the experimental device. The saturation optical power of the QD selected in the experimental system was −5 dBm, and the measurement accuracy of the heterodyne coherence angle under different signal laser beam powers was tested when the local oscillation laser beam power was −7 dBm, −10 dBm, and −13 dBm, respectively. The test results are shown in Figure 10. The experimental results indicate that when the local oscillation laser beam power was −7 dBm, the heterodyne coherence angle measurement accuracy under the same signal laser beam power was relatively optimal. Therefore, −7 dBm was selected as the local oscillation laser beam power of the experimental system.
In the process of heterodyne coherent angle measurement, the phase detection accuracy of the phase-locked loop on the beat-frequency signal directly affects the angle measurement accuracy. The loop bandwidth is an important parameter that affects the phase detection accuracy. Therefore, the effect of the loop bandwidth on the accuracy of heterodyne coherent angle measurement was further tested. The conditioning signal laser beam power was −16 dBm, the local oscillation optical power was −7 dBm, and the test results are shown in Figure 11. The experimental findings revealed that when the loop bandwidth was set at 10 Hz, the accuracy of the heterodyne coherence angle measurement was optimal under the same power level. When the loop bandwidth gradually increased on the basis of 10 Hz, the random error increased accordingly. The phase tracking result of the phase-locked loop for the beat frequency signal had a large jitter, resulting in a certain degree of decrease in the angle measurement accuracy. When the loop bandwidth gradually decreased on the basis of 10 Hz, the system error increased accordingly. The phase-locked loop is difficult to accurately track and detect the phase of the beat frequency signal, resulting in a significant decrease in the accuracy of angle measurement. When the loop bandwidth was 1 Hz, the phase-locked loop showed a lock-out state. Consequently, 10 Hz was designated as the loop bandwidth of the experimental system.

4.4. Comparison with Direct Detection

The experimental system of the heterodyne coherent angle measurement was adjusted to construct a direct detection angle measurement experimental system, and the block diagram of the experimental system is shown in Figure 12. The FSM was employed to deflect the initial angle of the transmitting laser beam, and the two laser beams, shifted by the AOM frequency, were coupled by the optical fiber to generate a Sin signal of 1 MHz and transmitted to the QD photosensitive surface. The received optical power P1, P2, P3, and P4 in each quadrant, in conjunction with the spot center position detection algorithm, facilitated the determination of the spot center in the azimuth and pitch axis of the offset. Subsequent trigonometric function calculations further resolved the angular deflection amount. The FSM angular deflection amount was then integrated into the calculation of the standard deviation. Consequently, the direct detection angle measurement was achieved.
A direct detection angle measurement accuracy experiment was carried out. The power of the transmitting laser beam directed toward the QD photosensitive surface was adjusted to −16 dBm, and the deflection of the FSM azimuth and pitch angle was set to 0. The results of the direct detection angle measurement accuracy at this time are presented in Figure 13. The experimental results indicate that the angular measurement accuracy was 13.54 μrad for the azimuth axis and 12.51 μrad for the pitch axis. The heterodyne coherent angular measurement demonstrated a higher angular measurement accuracy compared with direct detection under the same power condition. This is particularly advantageous for the high accuracy demanded in the scenario of inter-satellite long-distance beam measurement.
In response to the high detection sensitivity requirement for long-distance beam measurement between satellites, further detection sensitivity comparison experiments were carried out. The power of the local oscillator laser beam was adjusted to −7 DBM and the loop bandwidth to 10 Hz. Firstly, the signal laser beam power was set to −15 dBm, and the angular measurement accuracy was evaluated based on heterodyne coherence and direct detection mode, respectively. Secondly, the signal laser beam power was systematically reduced in 1 dB steps to assess the angle measurement accuracy of heterodyne coherence and direct detection under varying optical powers. Finally, the angle measurement accuracy threshold was set to 20 μrad, and the minimum signal optical power of the heterodyne coherence and direct detection methods under this threshold was compared and analyzed. The ensuing test results are presented in Figure 14. The experimental results demonstrated that for an angular measurement accuracy threshold of 20 μrad, the phase measurement method exhibited a sensitivity of −50 dBm, while it was −20 dBm in the direct detection method. This observation indicates that the phase measurement method can maintain the same angular measurement accuracy under lower signal optical power, making it more suitable for high detection sensitivity requirements in inter-satellite long-distance beam measurement scenarios.

5. Conclusions

This study addressed the necessity for high accuracy and sensitivity in the measurement of inter-satellite long-range beams. A theoretical model of heterodyne coherent angle measurement was established, and the principles of spatial coherent mixing and DWS angular phase conversion were analyzed. Based on the Monte Carlo method, a simulation system of heterodyne coherent angle measurement was constructed, and a phase-locked loop was combined to measure the given angular deflection analog quantity with high accuracy. An experimental system was further constructed to test the accuracy and detection sensitivity of the heterodyne coherent angle measurement and compare them with direct detection. When the local oscillation laser beam power was −7 dBm, the loop bandwidth was 10 Hz, and the signal laser beam power as −16 dBm. The accuracy of the heterodyne coherent angle measurement was 2.54 μrad and 2.85 μrad, which reached the μrad order of magnitude and was improved by about 5 times compared with direct detection. The detection sensitivity of the heterodyne coherent method was −50 dBm, which was in the order of nW, using 20 μrad as the angle measurement accuracy threshold. This enhancement over the direct detection methods exhibited an impressive magnitude of 1000-fold improvement. In comparison with studies by other scholars, this study analyzed and compared the performance of heterodyne coherent and direct detection angle measurement techniques in terms of accuracy and sensitivity. In terms of system performance, the heterodyne coherent angle measurement system constructed in this study showed a certain improvement compared with the coherent off-target detection system described in the literature [17], and the angle measurement accuracy improved from 5 μrad in the literature to 2.85 μrad at a high optical power level. This research provides support for long-distance beam measurements between satellites and has reference significance in the measurement of gravitational waves and the design of laser communication terminals between satellites.

Author Contributions

Conceptualization, Z.Z. and X.Y.; Data curation, Z.Z.; Formal analysis, Z.Z.; Funding acquisition, X.Y.; Investigation, Z.Z. and D.Z.; Methodology, Z.Z., P.L., and X.Y.; Project administration, X.Y.; Resources, P.L. and X.Y.; Software, Z.Z.; Supervision, S.T. and X.Y.; Validation, Z.Z.; Visualization, Z.Z. and D.Z.; Writing—original draft, Z.Z.; Writing—review and editing, S.T. and X.Y. All authors have read and agreed to the published version of the manuscript.

Funding

This research was funded by the National Key R&D Program of China (2022YFB2903402).

Institutional Review Board Statement

Not applicable.

Informed Consent Statement

Not applicable.

Data Availability Statement

The original contributions presented in this study are included in the article. Further inquiries can be directed to the corresponding author.

Conflicts of Interest

The authors declare no conflicts of interest.

References

  1. Xu, X.; Tan, Y.; Mu, H.; Li, Y.; Wang, J.; Jin, J. Laser Interferometric Multi-Degree-of-Freedom Measurement Technology in Space Gravitational-Wave Detection. Laser Optoelectron. Prog. 2023, 60, 0312006. [Google Scholar]
  2. Xu, X.; Liu, H.; Tan, Y. Verification of Laser Heterodyne Interferometric Bench for Chinese Spaceborne Gravitational Wave Detection Missions. Research 2024, 7, 0302. [Google Scholar] [CrossRef] [PubMed]
  3. Abbott, B.; Abbott, R.; Adhikari, R.; Ajith, P.; Zweizig, J. LIGO: The Laser Interferometer Gravitational-Wave Observatory. Rep. Prog. Phys. 2009, 72, 076901. [Google Scholar] [CrossRef]
  4. Danzmann, K.; Rudiger, A. LISA technology-concept, status, prospects. Class. Quantum Gravity 2003, 20, S1–S9. [Google Scholar] [CrossRef]
  5. Hough, J.; Robertson, D.; Ward, H. LISA—The Interferomter. Space Res. 2003, 32, 1247–1250. [Google Scholar] [CrossRef]
  6. Universidad, D. Laser Ranging and Data Communication for the Laser Interferometer Space Antenna; Universidad de Granada: Granada, Spain, 2012; pp. 28–30. [Google Scholar]
  7. Wegener, H.; Müller, V.; Heinzel, G.; Misfeldt, M. Tilt-to-Length Coupling in the GRACE Follow-On Laser Ranging Interferometer. J. Spacecr. Rocket. 2020, 57, 1362–1372. [Google Scholar] [CrossRef]
  8. Goswami, S.; Francis, S.; Bandikova, T.; Spero, R. Analysis of GRACE Follow-On Laser Ranging Interferometer derived inter-satellite pointing angles. IEEE Sens. J. 2021, 21, 19209–19221. [Google Scholar] [CrossRef]
  9. Peng, B.; Wu, K.; Yang, Y.; Wu, J.; Guo, Z.; Wang, Y.; Zheng, Y.; Lin, X. Studying an off-axis optical bench for future gravity missions from the perspective of carrier-to-noise ratio. Opt. Express 2023, 31, 13751–13762. [Google Scholar] [CrossRef] [PubMed]
  10. Tao, W.; Deng, X.; Diao, Y.; Gao, R.; Qi, K.; Wang, S.; Luo, Z.; Sha, W.; Liu, H. Design and Construction of the Optical Bench Interferometer for the Taiji Program. Sensors 2023, 23, 9141. [Google Scholar] [CrossRef] [PubMed]
  11. Wen, B.; Tang, W.; Peng, X.; Yang, Z. Autonomous State Estimation and Observability Analysis for the Taiji Formation Using High-Precision Optical Sensors. Sensors 2023, 23, 8672. [Google Scholar] [CrossRef] [PubMed]
  12. Xu, B.; Jia, P.; Liu, S.; Zhang, L.; Han, Y. Progress and insights from the United States “Space-based Adaptive Communication Node” project. Aerosp. China 2023, 8, 35–38. [Google Scholar]
  13. Wissel, L.; Hewitson, M.; Heinzel, G. Measuring the impact of laser relative intensity noise on heterodyne interferometers using differential wavefront sensing. Phys. Rev. Appl. 2024, 22, 044048. [Google Scholar] [CrossRef]
  14. Heinzel, G.; Alvarez, M.; Pizzella, A.; Brause, N.; Delgado, J. Tracking Length and Differential-Wavefront-Sensing Signals from Quadrant Photodiodes in Heterodyne Interferometers with Digital Phase-Locked-Loop Readout. Phys. Rev. Appl. 2020, 14, 054013. [Google Scholar] [CrossRef]
  15. Meshksar, N.; Mehmet, M.; Isleif, K.; Heinzel, G. Applying Differential Wave-Front Sensing and Differential Power Sensing for Simultaneous Precise and Wide-Range Test-Mass Rotation Measurements. Sensors 2021, 21, 164. [Google Scholar] [CrossRef] [PubMed]
  16. Xia, Q.; Liang, Y.; Yan, H.; Xu, Z.; Liu, L.; Zhou, Z. High-precision laser beam lateral displacement measurement based on differential wavefront sensing. Opt. Lett. 2023, 48, 5281–5284. [Google Scholar] [CrossRef] [PubMed]
  17. Lei, M. Research of Misalignment Detection Technology Based on Heterodyne Interferometry. Master’s Thesis, The Institute of Optics and Electronics, The Chinese Academy of Sciences, Chengdu, China, 2021. [Google Scholar]
  18. Zhang, Y.; Jiang, H.; Song, Y.; Liu, M.; Ding, R.; Xue, J.; Qian, Z.; Sun, L.; Wang, C. Research on angular displacement detection technology of inter-satellitelaser communication based on coherent system. Opt. Commun. 2025, 574, 131050. [Google Scholar] [CrossRef]
  19. Jiang, Y. Study on Optimization and Matching of Quadrant Photoreceiver in Differential Wavefront Sensing. Ph.D. Thesis, Huazhong University of Science and Technology, Wuhan, China, 2022. [Google Scholar]
  20. Duan, H.; Liang, Y.; Yeh, H. Analysis of non-linearity in differential wavefront sensing technique. Opt. Lett. 2016, 41, 914–917. [Google Scholar] [CrossRef] [PubMed]
  21. Gao, R.; Liu, H.; Luo, Z.; Jin, G. Linearity performance analysis of the differential wavefront sensing for the Taiji programme. J. Mod. Opt. 2020, 67, 383–393. [Google Scholar] [CrossRef]
  22. Qian, X.; Cui, Z.; Shi, H.; Wang, X.; Yao, W.; Gao, R.; Wang, Y. Analysis of Beam Walk in Inter-Satellite Laser Link: Implications for Differential Wavefront Sensing in Gravitational Wave Detection. Appl. Sci. 2024, 14, 5526. [Google Scholar] [CrossRef]
  23. Liu, Y.; Zhao, X.; Tong, S.; Chang, S.; Song, Y.; Dong, Y.; An, Z.; Yu, F. Study of multistage composite loop control based on optical phase-locked loop technology. Opt. Commun. 2018, 424, 17–25. [Google Scholar] [CrossRef]
  24. Abdelazim, S.; Santoro, D.; Arend, M.; Moshary, F.; Ahmed, S. Coherent Doppler Lidar for Wind Sensing. In Spatial Variability in Environmental Science—Patterns, Processes, and Analyses; IntechOpen: London, UK, 2020; pp. 1–21. [Google Scholar]
Figure 1. Block diagram of the heterodyne coherent angle measurement principle. (a) Overall process block diagram. (b) Spatial coherent mixing. (c) DWS angle phase conversion. (d) Phase tracking and detection.
Photonics 12 00509 g001
Figure 2. Relation between the local oscillation laser beam power and signal-to-noise ratio.
Photonics 12 00509 g002
Figure 3. Block diagram of the simulation system for heterodyne coherent angle measurements.
Photonics 12 00509 g003
Figure 4. Results of the phase-locked loop operation in each quadrant. (a) Loop locked state. (b) NCO indexed calculated phase.
Photonics 12 00509 g004
Figure 5. Heterodyne coherent angle measurement accuracy. (a) Azimuth axis. (b) Pitch axis.
Photonics 12 00509 g005
Figure 6. Block diagram of the heterodyne coherent angle measurement experimental system. (a) General block diagram. (b) FSM calibration.
Photonics 12 00509 g006
Figure 7. Physical diagram of the heterodyne coherent angle measurement experimental system. (a) Total system. (b) CCD laser beam spots.
Photonics 12 00509 g007
Figure 8. Angle measuring results. (a) Azimuth axis. (b) Pitch axis.
Photonics 12 00509 g008
Figure 9. Zero heterodyne coherent angle measurement accuracy results. (a) Azimuth axis. (b) Pitch axis.
Photonics 12 00509 g009
Figure 10. Results of the heterodyne coherent angle measurement accuracy under different local laser beam powers.
Photonics 12 00509 g010
Figure 11. Results of the heterodyne coherent angle measurement accuracy under different loop bandwidths.
Photonics 12 00509 g011
Figure 12. Block diagram of the direct detection angle measurement experiment.
Photonics 12 00509 g012
Figure 13. Zero direct detection angle measurement accuracy results. (a) Azimuth axis. (b) Pitch axis.
Photonics 12 00509 g013
Figure 14. Zero detection sensitivity comparison of the test results.
Photonics 12 00509 g014
Table 1. Key parameters of the desktop experimental system for the heterodyne coherent angle measurements.
ParametersValues
Wavelength1550 nm
Local Oscillation laser beam power−7 dBm
Collimator diameter2.1 mm
Collimator divergence angle500 μrad
QD diameter3 mm
QD bandwidth20 MHz
Disclaimer/Publisher’s Note: The statements, opinions and data contained in all publications are solely those of the individual author(s) and contributor(s) and not of MDPI and/or the editor(s). MDPI and/or the editor(s) disclaim responsibility for any injury to people or property resulting from any ideas, methods, instructions or products referred to in the content.

