Article

Fiber Eavesdropping Detection and Location in Optical Communication System

1
State Key Laboratory of Information Photonics and Optical Communications, Beijing University of Posts and Telecommunications, Beijing 100876, China
2
College of Information and Communication, National University of Defense Technology, Wuhan 430010, China
*
Author to whom correspondence should be addressed.
Photonics 2025, 12(5), 501; https://doi.org/10.3390/photonics12050501
Submission received: 1 April 2025 / Revised: 24 April 2025 / Accepted: 12 May 2025 / Published: 16 May 2025
(This article belongs to the Special Issue Photonics for Emerging Applications in Communication and Sensing II)

Abstract

Fiber eavesdropping severely endangers the confidentiality of data transmitted in optical networks. Therefore, it is necessary to explore how to detect and locate fiber eavesdropping in an effective approach. To leverage the advantages of the state of polarization (SOP) in detecting various abnormal events while addressing its challenges in acquiring the SOP of different fiber links, we propose a multi-channel joint SOP estimation scheme to estimate the SOP of different fiber spans. Based on the proposed scheme, we provide a comprehensive solution for fiber eavesdropping location and detection in optical communication systems. In this solution, the estimated SOP and optical performance monitoring (OPM) data are utilized for rapid fiber eavesdropping detection and coarse location at the span level. The effectiveness of the solution is validated by experiments. In the aspect of detection, we achieve the detection of the start or end of fiber eavesdropping, the overlapping of fiber eavesdropping and abnormal events, and other abnormal events. The overall accuracy is 99.77%. In the aspect of location, we can locate the fiber span that has been eavesdropped.

1. Introduction

As the backbone of modern telecommunications, optical networks play a critical role in transmitting large-scale data. Notably, driven by the rapid development and widespread adoption of artificial intelligence (AI) and large language models (LLMs), higher demands have been placed on the transmission capability of optical networks [1,2,3,4]. While increasing the transmission capacity, the data security of optical networks is equally critical. Although the optical fiber is a kind of closed transmission media, unauthorized intruders can still eavesdrop on optical signals without interrupting fiber transmission. The currently known methods of fiber eavesdropping include fiber bending, optical splitting, evanescent coupling, fiber grating scattering, V-groove cut, and so on [5]. If we do not take protection measures against fiber eavesdropping, massive confidential data will face the risk of being deciphered.
At present, research on protection measures against fiber eavesdropping is categorized into active and passive approaches. Passive protection measures primarily use optical physical-layer encryption technologies, which are designed to prevent eavesdroppers from acquiring useful information by increasing the complexity of optical modulated signals with secure keys. The optical physical layer encryption can be carried out directly in the optical domain, such as optical spectral phase encoding [6] or optical spread spectrum [7]. Alternatively, it can be achieved in the electronic domain by encrypting the electronic signals, such as quantum noise stream ciphers [8], digital chaotic encryption [9], and end-to-end deep learning encryption [10]. Active protection measures detect and locate fiber eavesdropping and other events that violate physical layer safety in real time [11]. When eavesdroppers’ decryption capabilities are undetermined, active protection measures can trigger real-time alerts to network administrators to implement immediate countermeasures, which will effectively mitigate the information leakage. Therefore, it is crucial to develop an efficient method for detecting and locating optical fiber eavesdropping.
Currently, there are three primary kinds of technical approaches for eavesdropping detection and location in classical optical communication systems. The first approach is based on distributed fiber sensing (DFS) [12]. By measuring the properties of backscattered light, such as intensity or frequency shift [13,14], it can identify and localize the fiber eavesdropping accurately. However, the sensing range is usually limited due to excessive power loss and the optical isolators of the amplifier, which makes it difficult to implement in optical networks. The second approach is based on OPM data. In [15], the eye diagram of received signals is utilized to detect fiber eavesdropping. In [16], the authors propose a scheme to detect and locate fiber eavesdropping in a multi-span WDM system. By collecting various OPM data, such as optical power, optical signal-to-noise ratio (OSNR), and bit error rate (BER), the scheme can locate which span is being eavesdropped through a cluster-based unsupervised classification algorithm. The essence of this approach lies in the fact that optical power loss caused by fiber eavesdropping will affect the OPM data. However, the drawback of OPM data is the lack of enough useful information, which makes it difficult to distinguish fiber eavesdropping and other abnormal events. For example, ordinary fiber bending and fiber eavesdropping can both cause optical power loss. The third approach is based on the state of polarization (SOP). In [17,18], the authors emulate fiber eavesdropping and other harmful or non-harmful events in fiber links and measure the SOP of received light with a polarization analyzer. They use a machine learning algorithm to achieve the classification of different events. Their work demonstrates the ability of SOP to record detailed information about various abnormal events. With the development of coherent DSP technology, detecting abnormal events with SOP is not limited to polarization measurement equipment [19,20], which could reduce the cost of detecting fiber eavesdropping with SOP. Moreover, the advanced AI algorithms could mine the transient feature of SOP to realize the detection of some rare events [21]. As the measured SOP reflects the accumulated state of the whole fiber link, the location ability of SOP is usually limited to span-level. In [22], the authors use estimated SOP and route optimization algorithms to locate which fiber link is affected by an abnormal event. If we need to do further analysis of abnormal events on different links, we need to acquire the SOP of different links. However, it is difficult to achieve that unless using a complex loop structure [23].
Given the challenge of the OPM-data-based approach in distinguishing other abnormal events, as well as the challenge of acquiring the SOP of different fiber spans, this paper provides a solution of fiber detection and location based on SOP and OPM data in optical communication systems. In this solution, we propose a multi-channel joint SOP estimation scheme to estimate the SOP of different fiber spans. By analyzing the combined data of estimated SOP and OPM data with AI, it can address the rapid detection and span-level location of fiber eavesdropping in multi-span system. Finally, the proposed solution is verified by two experiments. In the first experiment, we emulate the start and end of fiber eavesdropping and the overlapping of fiber eavesdropping and other abnormal events. The overall accuracy of 99.77% is achieved by analyzing the estimated SOP and error vector magnitude (EVM) data with a convolutional neural network. The second experiment emulates fiber eavesdropping in a multi-span system. The results show that the proposed scheme can accurately obtain the SOP of each span and locate the span that has been eavesdropped on.
The remainder of this paper is organized as follows. In Section 2, we emulate the fiber eavesdropping experimentally and summarize the characteristics of fiber eavesdropping from the perspectives of SOP and optical power loss. In Section 3, we propose a multi-channel joint polarization estimation scheme to estimate the SOP of each fiber span. Then, we provide a comprehensive solution for fiber eavesdropping location and detection in optical communication systems. In Section 4, we present and analyze the experiment setup and results. In Section 5, we conclude the entire work.

2. The Characteristics of Fiber Eavesdropping

Before introducing the proposed scheme, it is necessary to investigate the impacts of fiber eavesdropping on optic communication systems, which is the basis for fiber eavesdropping detection and location. Among all methods of fiber eavesdropping, eavesdropping based on fiber bending is the easiest to deploy with the minimal risk of damaging the fiber [5]. Therefore, we focus on the eavesdropping based on fiber bending in the paper.
Here, we use a device called a clip-on coupler to emulate fiber eavesdropping. Before the experiment, we use a fiber-stripping plier to strip the jacket, strength member, and buffer of the fiber patch cord until the coating layer is exposed. However, to completely remove those protective layers, we need to cut the fiber and then reconnect it with a fiber fusion splicer. Regarding actual eavesdroppers, they may employ more efficient fiber-stripping techniques, including automated mechanical tools, chemical corrosion, or thermal methods (e.g., heating and melting) without penetrating or cutting the fiber. When the coating layer is exposed, we bend it and put it into the guide wheel of the clip-on coupler, as shown in Figure 1a. When the clip-on coupler is closed, the optical signal leaks at the bent part and is collected by the prism of the clip-on coupler, as shown in Figure 1b. The prism could improve the coupling efficiency. The bending radius caused by the clip-on coupler is about 2.5 mm.

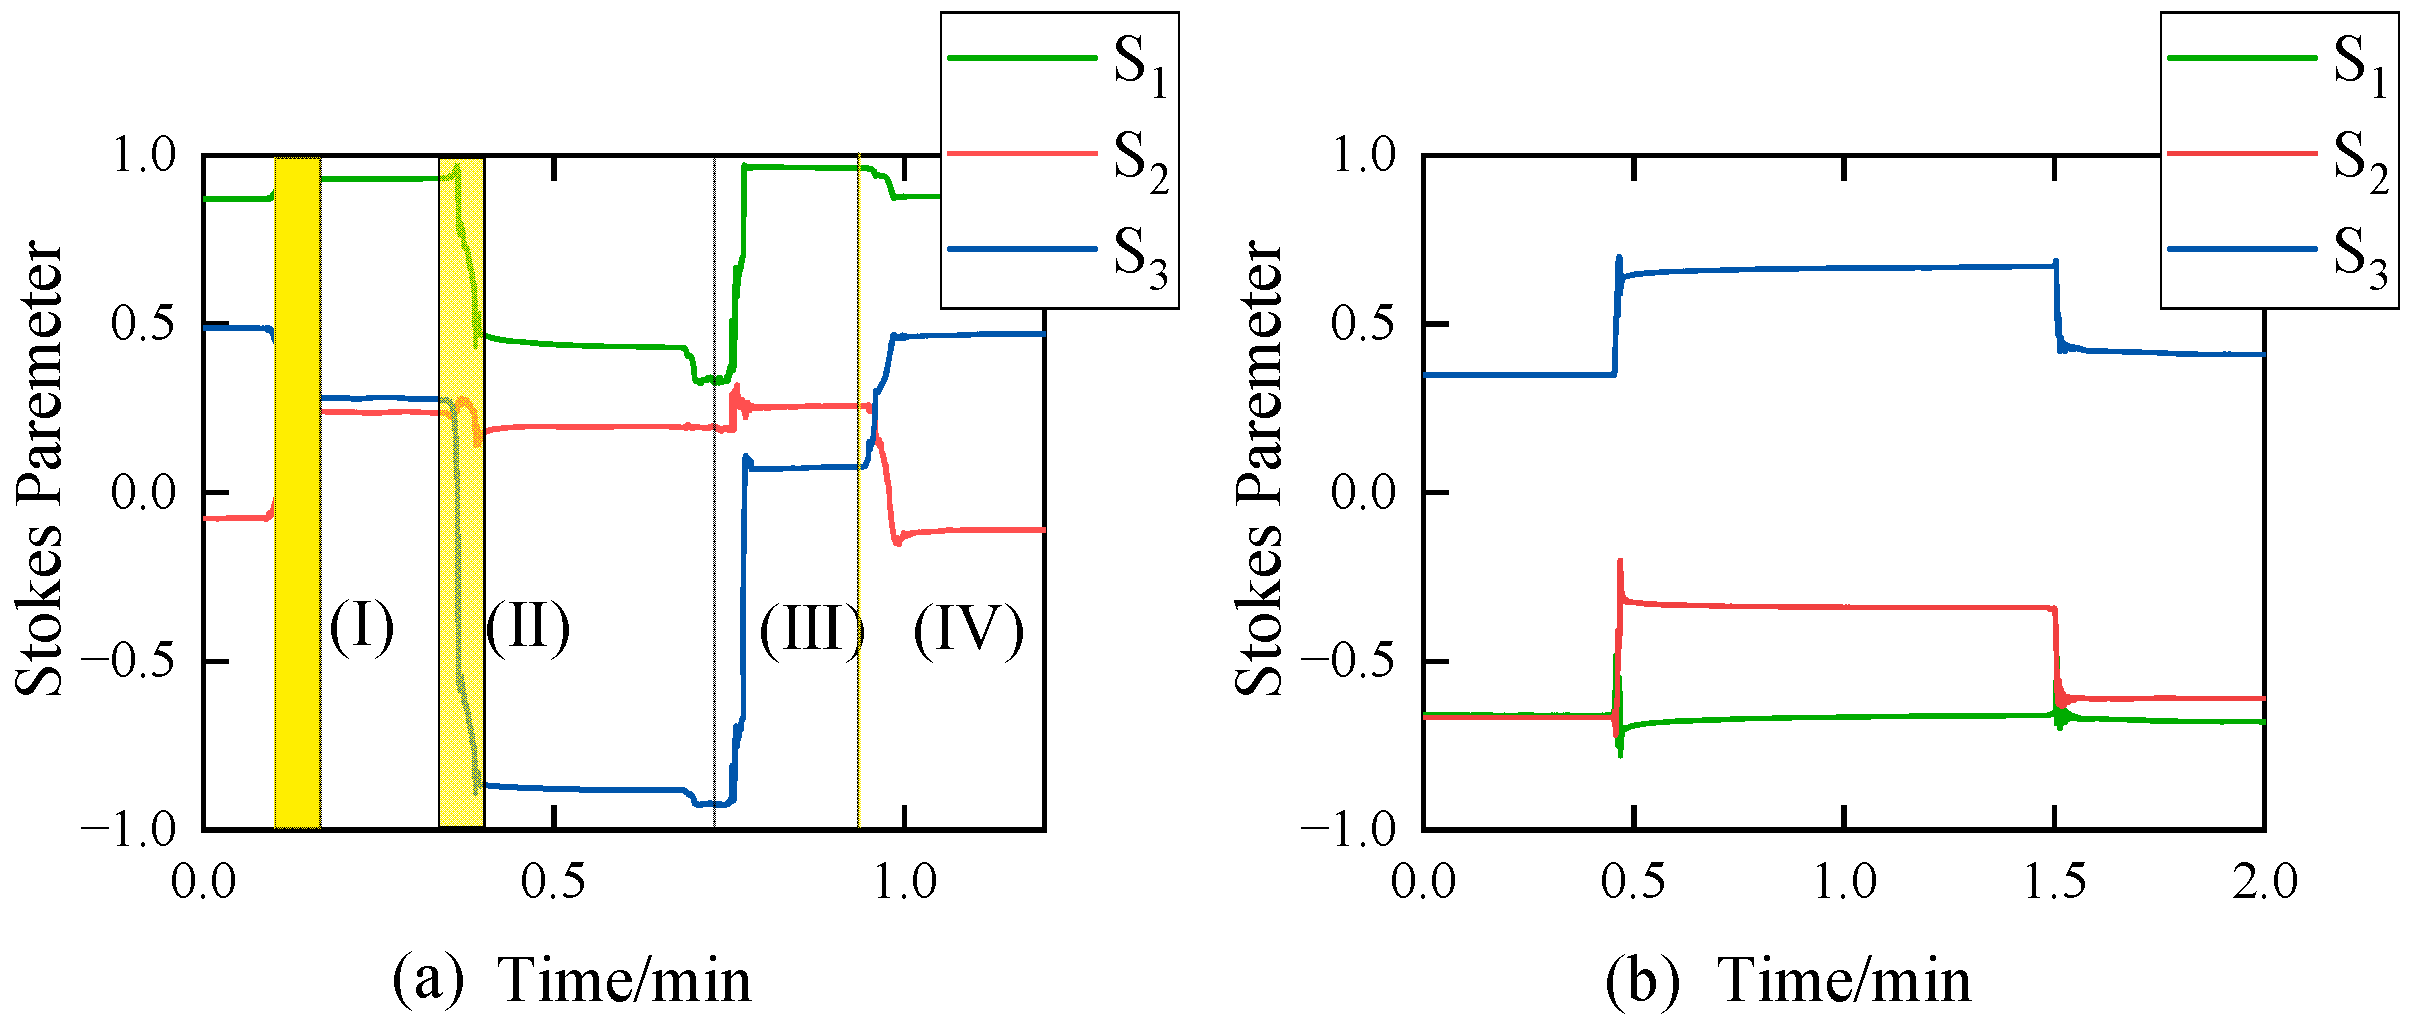
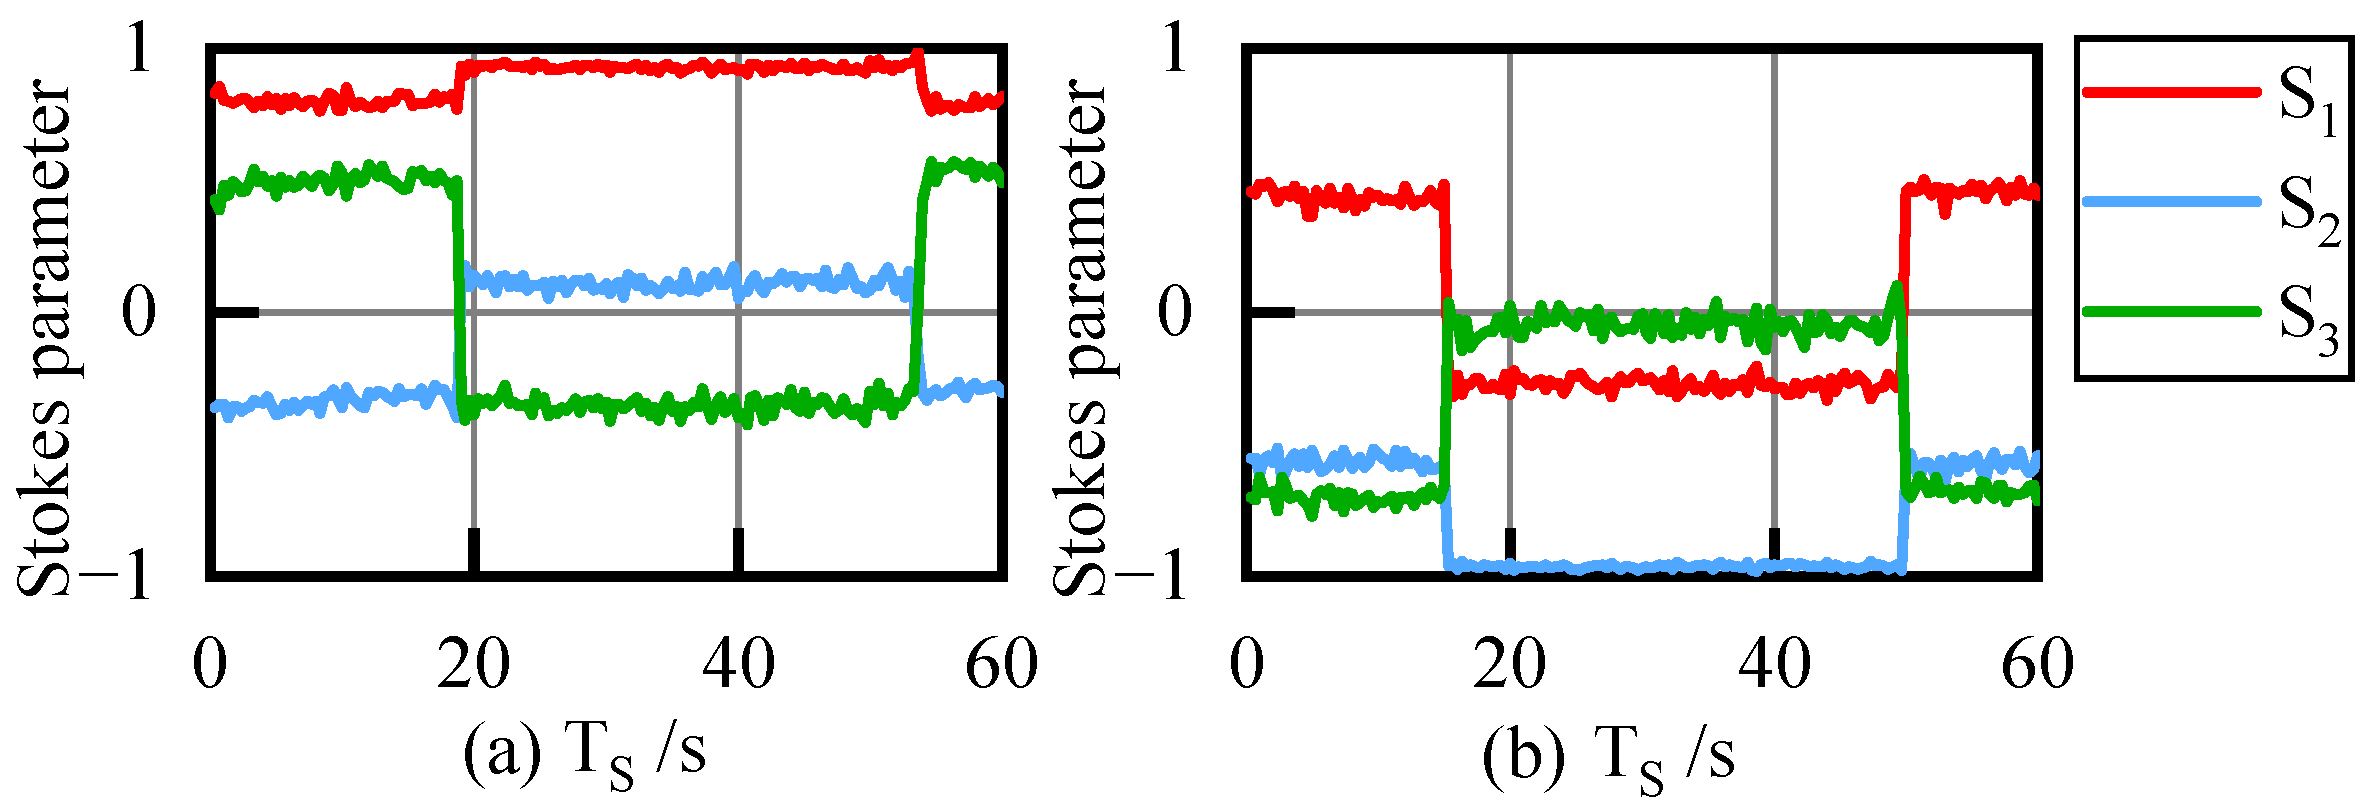
2.1. The Change in SOP

In the process of implementing fiber eavesdropping, some inevitable actions will change the shape of the fiber, such as pulling and bending fiber. These actions will influence the SOP of optical signals transmitted in fiber. Therefore, we first examine the influence of fiber eavesdropping on SOP. The experiment setup is shown in Figure 2a. In our experiment, a 10 dBm light at 1550 nm generated by a tunable laser is injected into the PSG-in port of a polarization state generator and analyzer (PSGA, GP-UM-PSGA-101A-12). The PSGA generates stable linearly horizontal polarized (LHP) light from the PSG-out port and transmits it into a fiber. Then, the PSA analyzes and records (~40 samples/s) the normalized Stokes parameters of the returned light at the PSA-in port. A clip-on coupler is placed on the fiber between PSG-out and PSA-in ports.
For the convenience of subsequent analysis, we ignore the process of peeling off the jacket and putting the fiber into the holder, which is completed manually in our experiments. Those processes present chaotic features on SOP. Moreover, those processes may be automated by machines in practice. Therefore, we only consider the transition from closing to opening the coupler and the reverse process. The corresponding temporal traces of Stokes parameters for the decomposition process of optical eavesdropping are shown in Figure 3a. As observed, the variation in SOP can be divided into four stages:
(I)
Pull the fiber until it touches the lens groove of the clip-on coupler, as shown in Figure 2c. At this stage, the SOP changes due to the movement of the fiber.
(II)
Close the clip-on coupler like Figure 2d. At this stage, there is an instantaneous jump in SOP because the clip-on coupler applies the pressure on the fiber.
(III)
Open the clip-on coupler. At this stage, the SOP exhibits an instantaneous jump because the clip-on coupler releases the pressure on the fiber.
(IV)
Pull the fiber away from the prism groove of the clip-on coupler. At this stage, the SOP changes again due to the movement of the fiber.
In practice, the stages I–II and III–IV are usually successive. The corresponding Stokes parameter traces are shown in Figure 3b. Based on the above analysis, we can conclude that the SOP is sensitive to the fiber eavesdropping, which confirms the feasibility of detecting fiber eavesdropping with SOP. In addition, SOP can capture action details of abnormal events, aiding in the distinction between fiber optic eavesdropping and other abnormal events. However, if the sampling frequency of SOP is not high, it becomes difficult to distinguish between the start and end of fiber eavesdropping. In this case, additional feature data may be required.

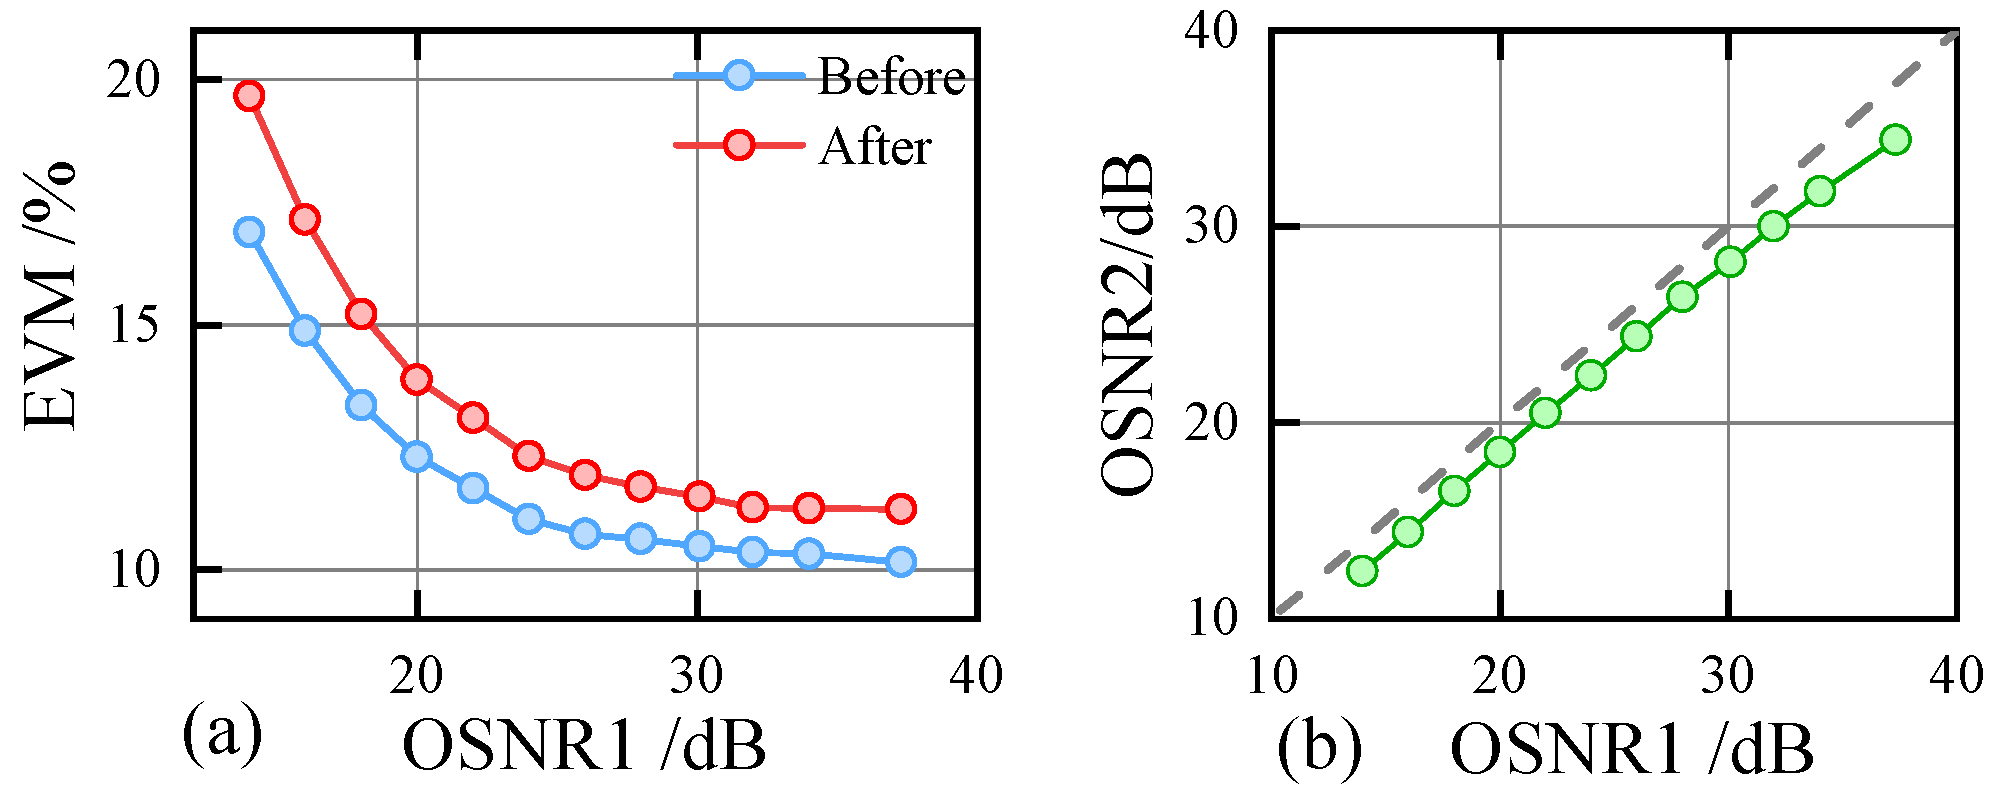
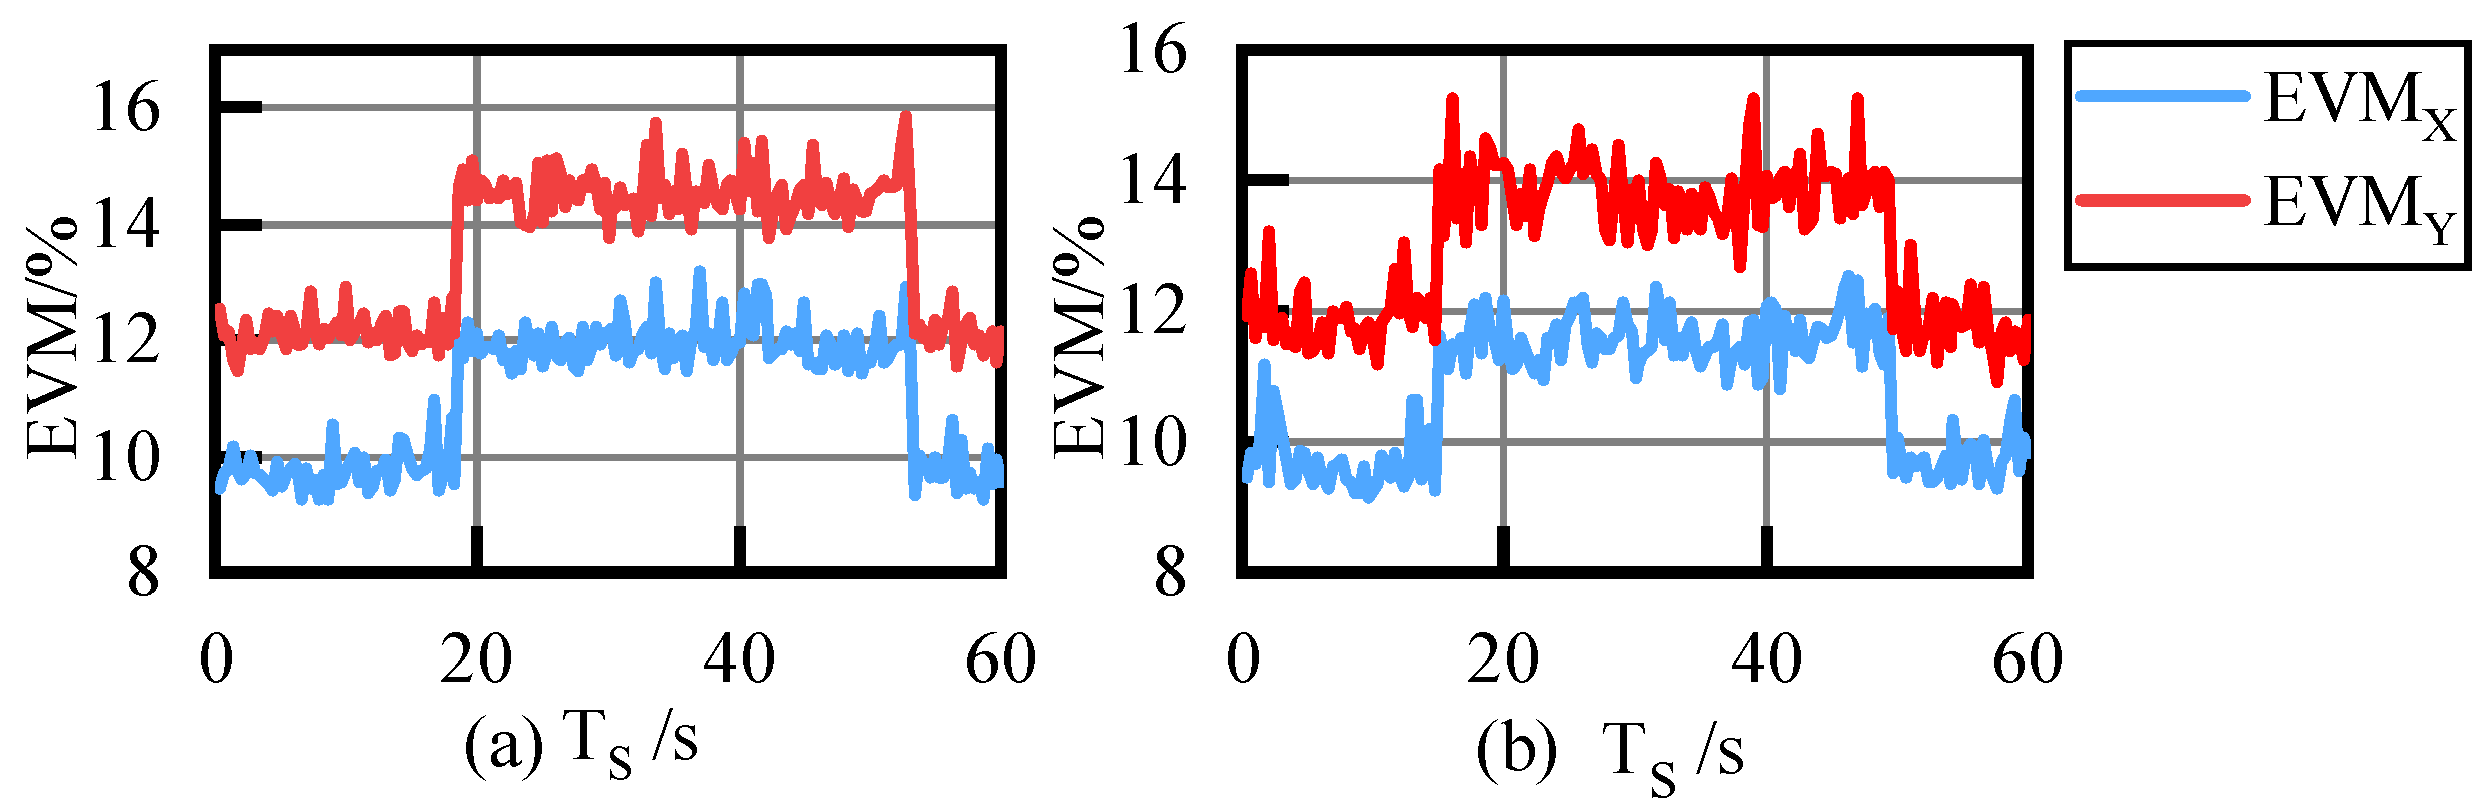
2.2. Optical Power Loss and Degradation of Transmission Performance

When an unauthorized intruder eavesdrops on a fiber link, the optical power of the primary link inevitably decreases. Therefore, we investigate the influence of optical power loss caused by fiber eavesdropping on the communication system. In this experiment, we emulate fiber eavesdropping in a single-span 20 GBaud PDM-QPSK coherent system as detailed in Section 4.1.1. The transmission link consists of a 40 km span of standard single-mode fiber (SSMF) and two erbium-doped fiber amplifiers (EDFAs). The clip-on coupler is placed at 0 km from EDFA1. The detailed experimental setup and DSP algorithm of transmitter (Tx) and receiver (Rx) will be introduced in detail in Section 4.1.1.
Here, we first measure the optical power, OSNR, and optical spectrum at three positions before and after eavesdropping. The monitoring positions are shown as the orange dots. The results are shown in Figure 4. At positions A and B, fiber eavesdropping causes approximately 3.5 dB of optical power loss, and the optical spectrum shifts downward overall. However, the OSNR remains unchanged. This is because the power of the modulated signal and noise reduce simultaneously. However, at position C (after EDFA2), the optical power and OSNR loss are approximately 1.5 dB and 2.8 dB, respectively. In Figure 4c, the spectrum outside the signal range is slightly elevated. This phenomenon indicates the power of amplified spontaneous emission (ASE) noise is increased slightly. Next, we measure the EVM of received QPSK signals as a function of OSNR1, i.e., the OSNR before eavesdropping. The result is shown as Figure 5a. Figure 5b presents the relationship between OSNR2, i.e., the OSNR after eavesdropping, and OSNR1. It can be observed that OSNR2 decreases compared to OSNR1 and the signal quality deteriorates.
Moreover, we also measure the OTDR curve of a 30 km SSMF before and after eavesdropping, as shown in Figure 6a. The result is shown in Figure 6b. It is evident that the fiber eavesdropping is located at approximately 10 km. The backscatter power decreases after the fiber eavesdropping position, and a small reflection peak appears at the eavesdropping point.
Based on the above analysis, we can conclude that the power loss caused by optical fiber eavesdropping not only affects various optical layer parameters such as optical spectrum and OSNR but also affects electrical layer parameters, such as EVM and BER. In addition, OTDR can be used to precisely locate fiber eavesdropping during maintenance. However, it should be noted that the experimental results presented above represent only one specific case of fiber-optic eavesdropping. As demonstrated in [24], the optical power loss is related to the bending angle and bending radius for the eavesdropping based on fiber bending. Smaller bending radii and larger bending angles will increase the power of leaked optical signals.

3. Scheme Principle

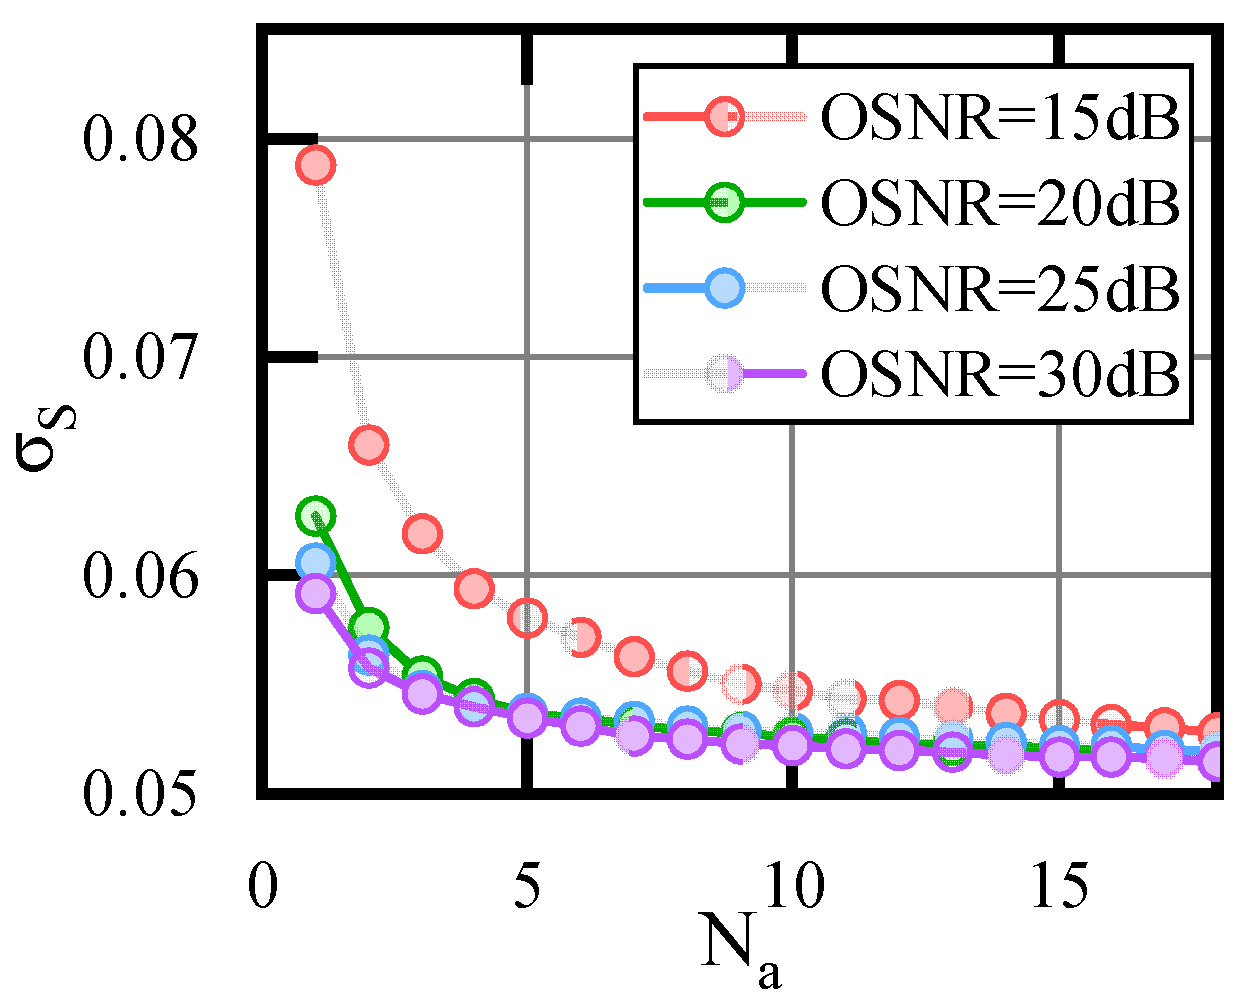
3.1. Multi-Channel Joint SOP Estimation

To monitor the SOP of different fiber links and locate which fiber span is subjected to fiber eavesdropping attacks, we propose a multi-channel joint polarization estimation scheme. The scheme is designed to utilize digital coherent DSP technology [18] and optical network control technology [25], thereby avoiding the introduction of additional SOP measuring equipment. The schematic diagram of the proposed scheme is shown in Figure 7. In the transmission plane of the optical communication system, for the transmission path highlighted in the network topology, we defined the polarization-dependent transfer function of the fiber link between wavelength routing node i and i − 1 as H i ω , where ω is the angular frequency. In the polarization division multiplexing (PDM) system, H i ω can be written as follows:
H i ω = H i , X X ω H i , Y X ω H i , X Y ω H i , Y Y ω .
For convenience, we ignore the chromatic dispersion (CD). Because CD is regarded as a kind of time-invariant and polarization-independent effect. Here, we assume that the optical signals in channel λ 1 and λ 2 are dropped and received at node i and i − 1. The fiber transfer function that two channels experienced can be expressed as follows:
T i 1 ω = H i 1 ω H 2 ω H 1 ω ,
T i ω = H i ω H i 1 ω H 2 ω H 1 ω .
In respective recovers, the adaptive equalizer could achieve the polarization demultiplexing and compensate the other polarization-dependent impairment. The corresponding adaptive equalizers are defined as W i 1 ω and W i ω . Therefore, the estimated transfer function could be given by the following:
T ^ i 1 ω = W i 1 ω ,
T ^ i ω = W i 1 1 ω ,
Therefore, the estimated transfer function between node i and i − 1 is as follows:
H ^ i ω = T ^ i ω T ^ i 1 1 ω ,
By taking the zero-frequency component of H ^ i ω , we could analyze the SOP rotation of this fiber link with M ^ i :
M ^ i = H ^ i ω = 0 = M i , X X M i , Y X M i , X Y M i , Y Y ,
It can be shown that a LHP light J L H P , i n = 1 0 T will be transformed by the fiber link to the following:
J L H P , o u t = M i , X X M i , X Y T ,
The corresponding Stokes vector form S L H P , o u t = S 1 S 2 S 3 T is given by the following:
S 1 = M i , X X 2 M i , X Y 2 / S 0 ,
S 2 = 2 Re M i , X X M i , X Y / S 0
S 3 = 2 Im M i , X X M i , X Y / S 0
S 0 = M i , X X 2 + M i , X Y 2
Therefore, if we collect the information of the adaptive equalizer from each node continuously with optical network control technology, such as software-defined optical networks (SDON), the SOP of each fiber link in the optical network could be obtained, which could help detect which span is eavesdropped. It is worth noting that the wavelength channels used to estimate the SOP can be the same or different. Those channels can be designated monitoring channels or information transmission channels, which depends on the specific network configuration.

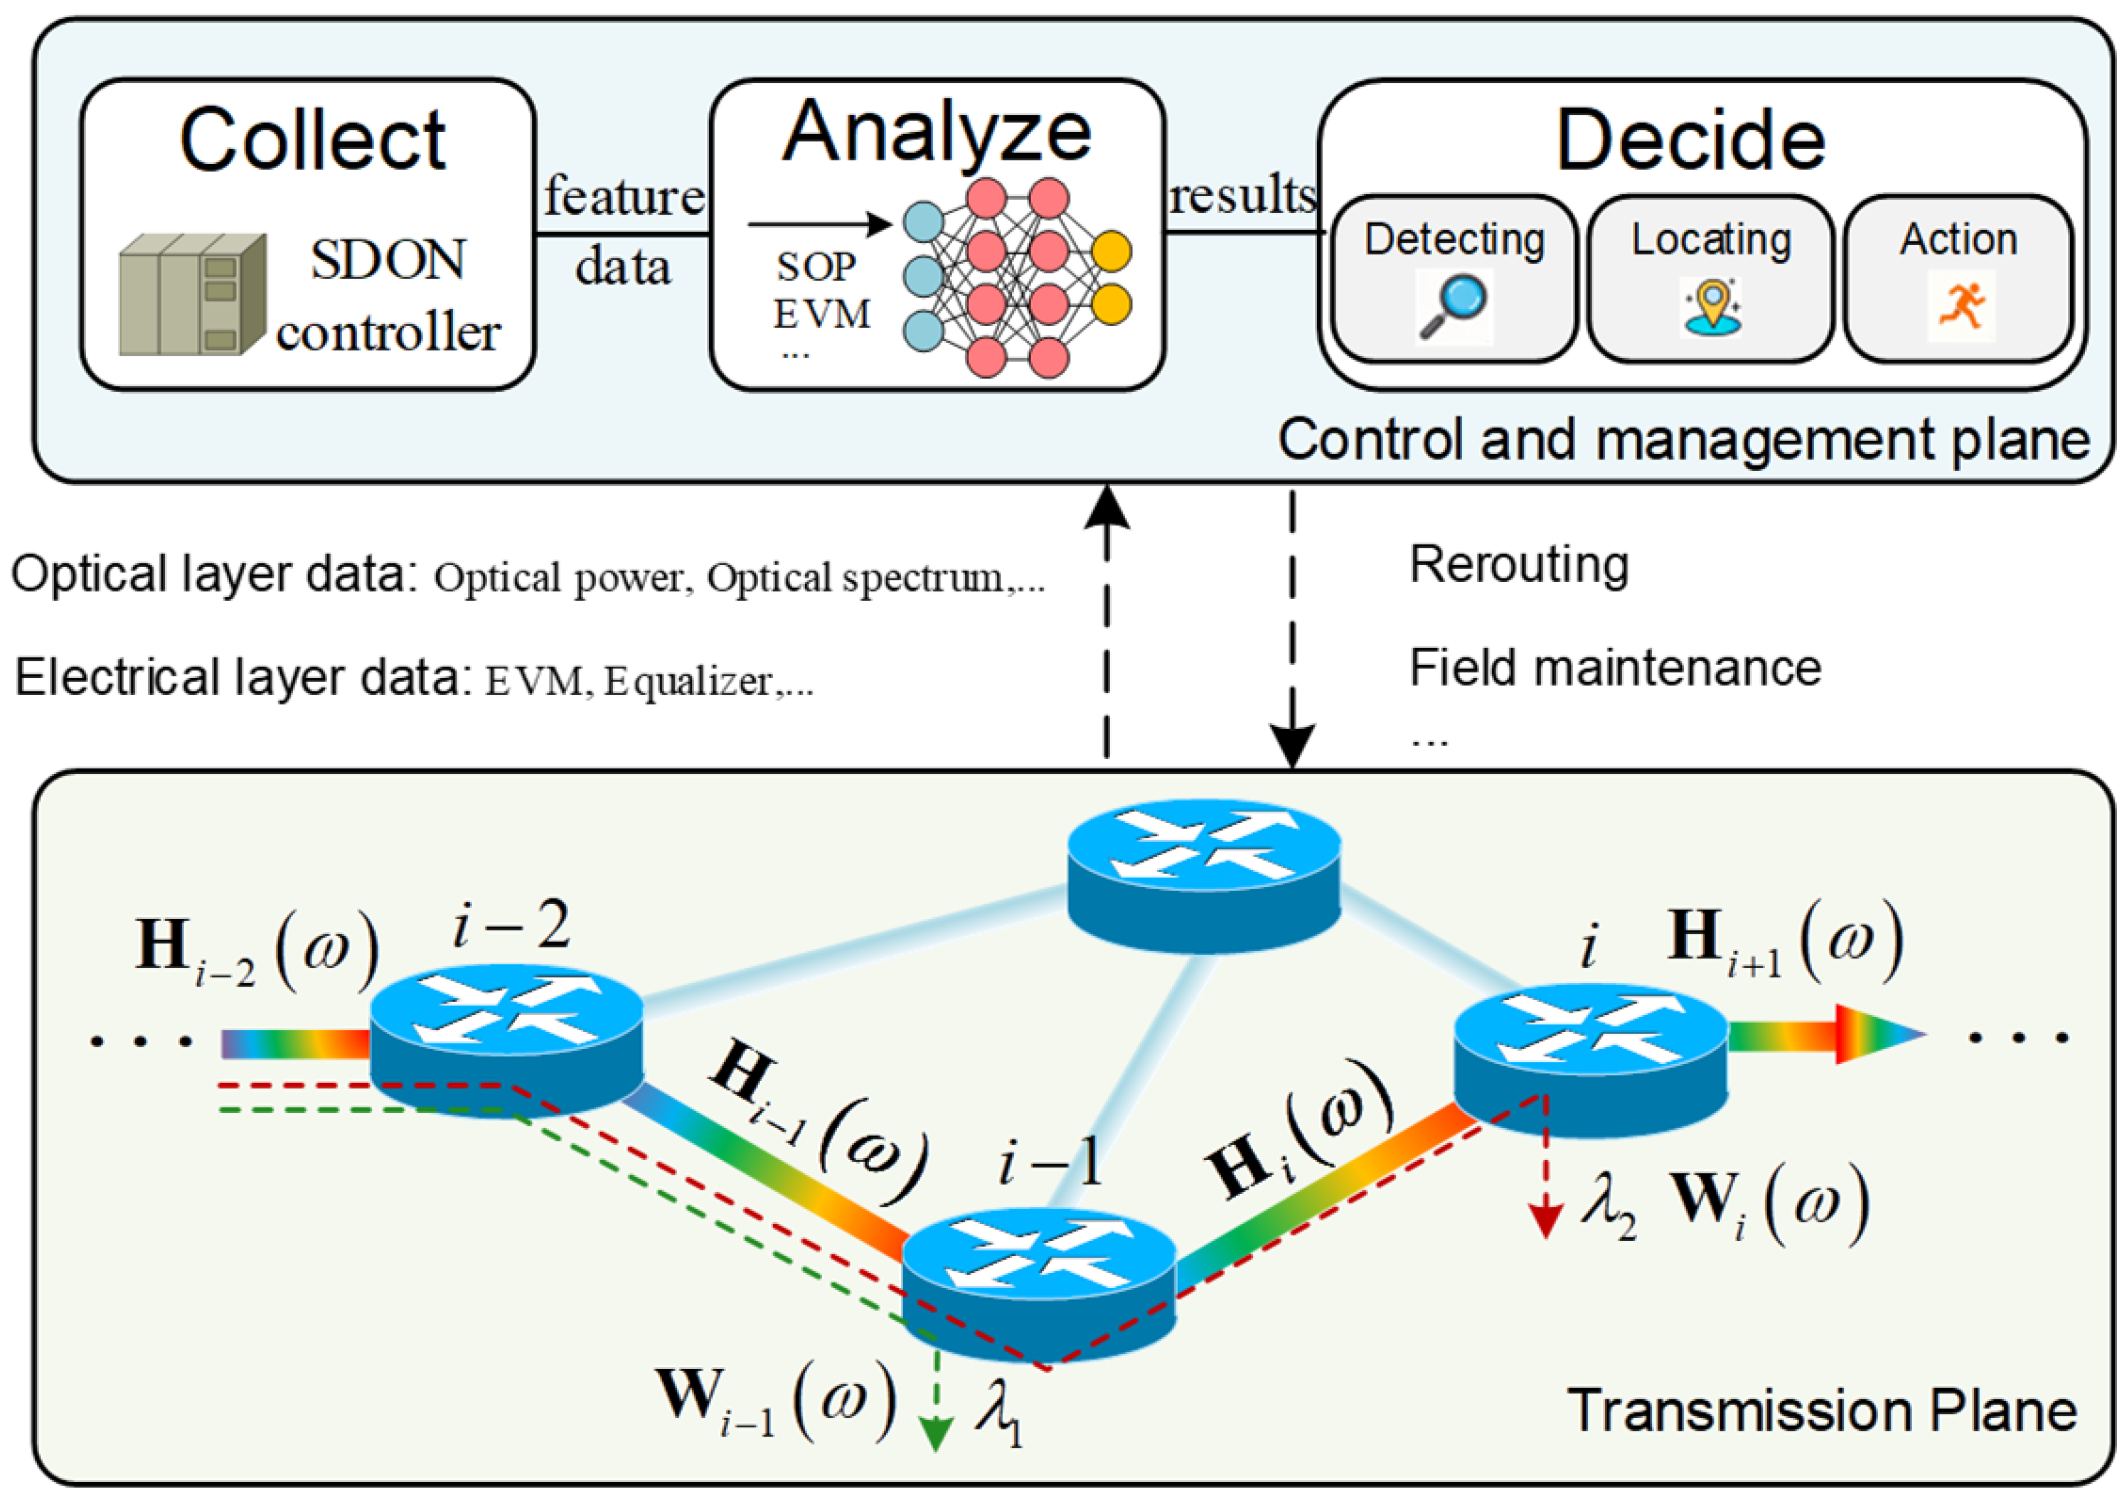
3.2. Comprehensive Solution

Based on the proposed multi-channel joint SOP estimation scheme and experimental results in Section 2, we present a comprehensive solution for fiber eavesdropping detection and location in optical communication system, as shown in Figure 7. The solution can be divided into three parts:
(1)
Collect: First, the control and management plane collect various parameters from the transmission plane in the optical communication system. These parameters can be obtained from electronical layers, such as an adaptive equalizer, EVM, or BER, or from optical layers, such as an optical power, OSNR, or optical spectrum. The diversity of parameters could help to improve the accuracy of identifications of fiber eavesdropping and other abnormal events.
(2)
Analyze: Subsequently, the collected feature data is transmitted to the data center for analysis. The data center could estimate the SOP and OPM data of different based on the proposed multi-channel joint SOP estimation scheme and other techniques [26]. Leveraging powerful computing resources and advanced artificial intelligence models [27], the data center conducts an in-depth analysis of this data. Next, it provides the judgment results for different optical fiber links.
(3)
Decide: Finally, the management plane makes decisions based on the judgments provided by the data center. For example, when a certain link is determined to be eavesdropped, network administrators can reroute the transmission path [28], dispatch maintenance personnel to conduct on-site inspections [29], and utilize an OTDR to precisely locate the fiber eavesdropping.
This solution takes advantage of different schemes. The SOP and OPM data can be acquired during data transmission. These data can help to timely detect fiber eavesdropping and achieve a coarse location at the span level. After determining the specific fiber span, we can use OTDR or another DFS scheme to locate the accurate position of fiber eavesdropping.

4. Experiment Setup and Results Analysis

To verify the proposed solution, we design and demonstrate two experiments. The experiments are mainly used to verify the effectiveness of fiber eavesdropping detection and coarse locating using estimated SOP and OPM data. As for the accurate location, this paper does not explore it in detail; we have shown the results of OTDR in Section 2.2.

4.1. Fiber Eavesdropping Dection in Single-Span System

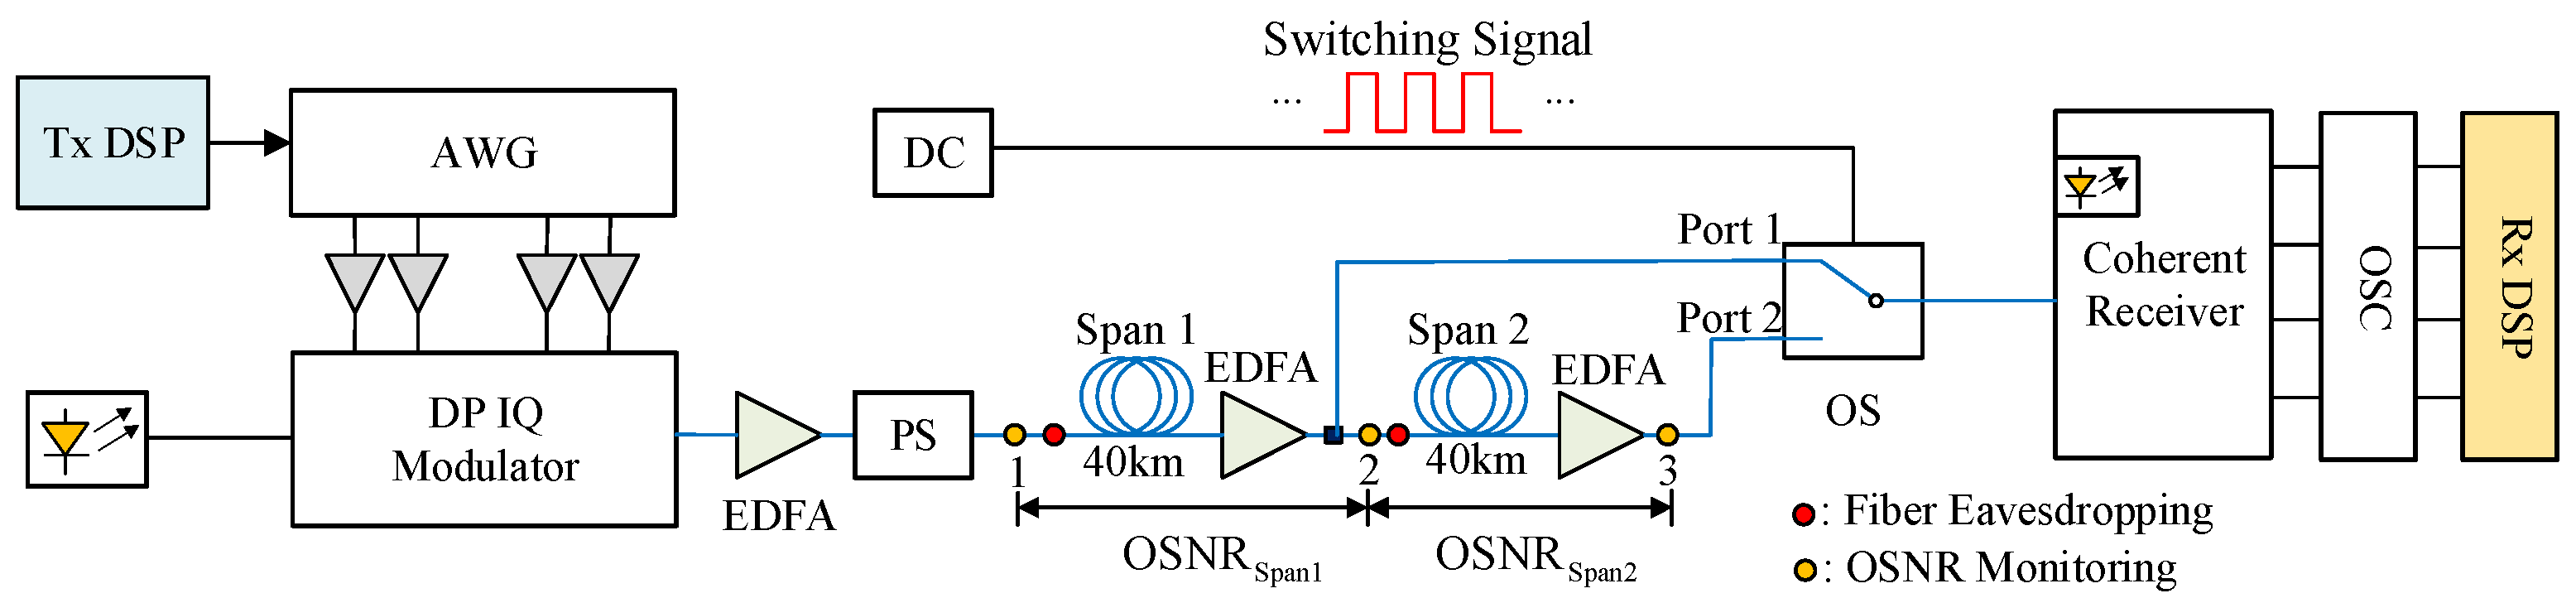
4.1.1. Experiment Setup

The first experiment aims to verify the accuracy of detecting fiber eavesdropping and other abnormal events by combining estimated SOP with other electrical-layer parameters. The experiment setup is shown in Figure 8. At the transmitter (Tx) side, a 15 dBm optical carrier generated by an external cavity laser operating at 193.414 THz is injected into a dual-polarization (DP) IQ modulator. In Tx DSP, the transmitted 0/1 bits are first mapped onto quadrature phase shift keying (QPSK) signals, and the constant-amplitude zero auto-correlation (CAZAC) sequence of length 136 is added to the header of each QPSK frame. Each frame consists of 1024 symbols. After up-sampling to match the symbol rate, the generated QPSK frame is loaded into a 128 GSa/s arbitrary waveform generator (AWG). The AWG converts it into four-channel electrical signals with the symbol rate of 20 GBaud and sends it to the DP IQ modulator. The output of the I/Q modulator is amplified to approximately −3 dBm by an EDFA.
In this system, the transmission link consists of a 40 km SSMF span and an EDFA. Before transmission, a polarization controller (PC) is used to randomize the initial SOP. An amplified spontaneous emission noise (ASEN) source and a variable optical attenuator (VOA) are used to adjust the receiver OSNR. Ten events are simulated on the fiber link, namely: normal, fiber eavesdropping start and end, vibration, interference, and the overlap of fiber eavesdropping with interference or vibration. The corresponding class labels are shown in Figure 8. Here, the start and end of the fiber eavesdropping correspond to the closing and opening of the clip-on coupler. The vibration of fiber is caused by a fascia gun with the frequency of ~60 Hz, aiming to emulate the harmful vibration from external instruments like excavators. Interference is caused by PC, which disturbs SOP with the speed of ~65 rad/s. The interference is designed to emulate rapid SOP changes caused by external environment, such as wind and lightning.
At the receiver (Rx) side, the OSNR is measured by an optical spectrum analyzer (OSA). The coherent receiver consists of a polarization- and phase-diverse 90° optical hybrid, four balanced photodetectors, and four trans-impedance amplifiers. The four received electrical signals are sampled and digitized by an 80 GSa/s oscilloscope (OSC). The OSC is set to operate in automatic sampling mode, which can capture and save the received signals. The sampling frequency is related to the storage depth of OSC. The captured signals are then processed by offline Rx-DSP, as shown in Figure 8. The Rx-DSP includes the Gram–Schmidt orthogonalization procedure (GSOP) and frequency–domain CD compensation. After resampling to 2 samples per symbol, the CAZAC sequence is used for frequency offset (FO) compensation and channel estimation [30]. In this step, the 2 × 2 frequency domain response of the DP fiber channel is obtained, which is then used to estimate Stokes parameters according to Equation (9) and update the taps of the 2 × 2 frequency domain MIMO filter. The MIMO filter tracks SOP rotation and compensates for polarization mode dispersion compensation. Following the V-V phase recovery algorithm, a T-spaced post decision-directed least mean square (DD-LMS) equalizer is used to compensate for residual inter-symbol interference and device penalty. Finally, the EVM of the recovered QPSK signals in both polarizations is estimated.
Due to limitations, we cannot continuously record optical power or the OSNR at the same sampling frequency as OSC. Here, we choose EVM data to replace the OSNR data. By processing the captured signals continuously, we obtain the time traces of estimated SOP (S1, S2, and S3) and EVM (EVMX and EVMY). Then, a sliding window with the width of 64 slides over time and segments the time traces, which are then fed into a convolutional neural network (CNN) as shown in Figure 8. The input data size for the convolutional network is 5 × 64. The CNN will output a probability distribution across the different classes. The detailed information of CNN is described in Appendix A.

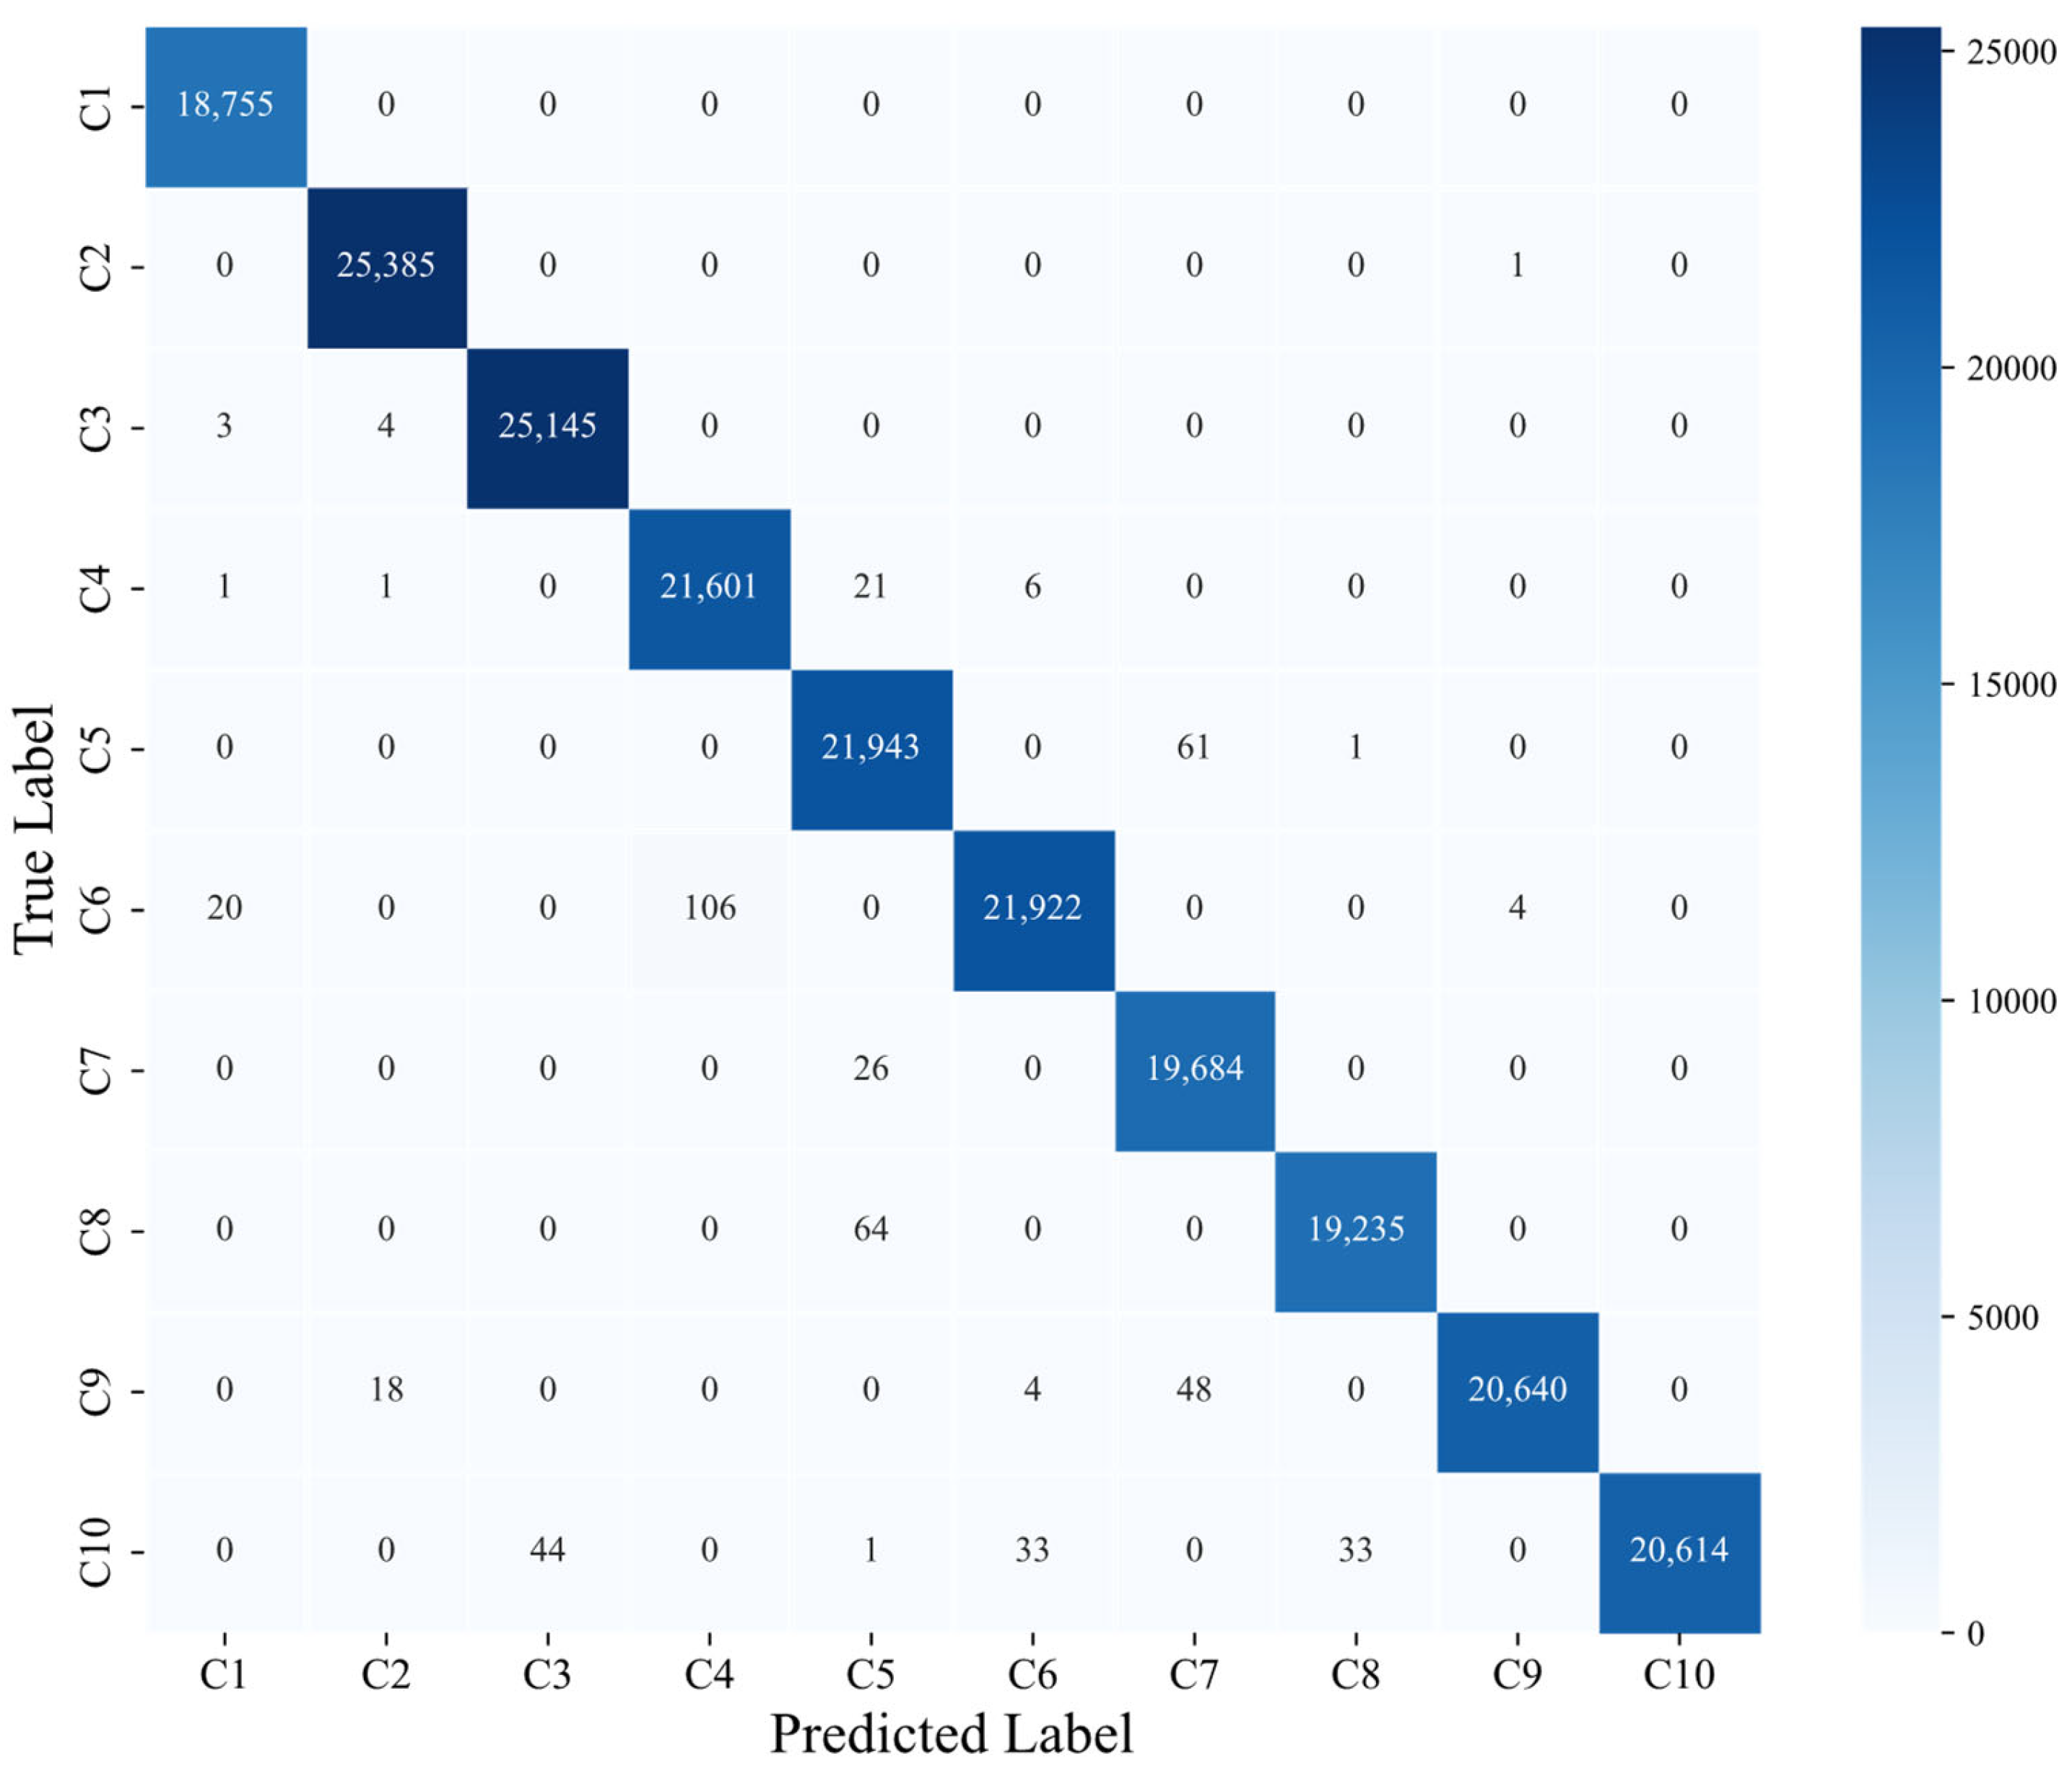
4.1.2. Results Analysis

Here, we first investigate the relationship between the precision of the estimated SOP and the number of transfer functions used for averaging N a , which corresponds to the number of QPSK frames captured by the OSC each time. The precision of estimated SOP is quantified by its standard deviation σ S , which is given by the following:
σ S 2 = σ S 1 2 + σ S 2 2 + σ S 3 2 .
where σ S i is the standard deviation of S i , i = 1 , 2 , 3 .
In the optical back-to-back scenario, the σ S i as a function of N a under different OSNR is shown as Figure 9. As we can see, the σ S decreases with the increase of OSNR, which indicates that the ASE noise would affect the precision of estimated SOP. In addition, σ S decreases with the increase in N a and tends toward to a constant. Therefore, increasing the number of transfer functions used for averaging could increase the precision of estimated SOP. However, increasing the number of frames captured will cause the reduction in the sampling rate of the OSC. To balance the sampling rate and the precision of the SOP, we set N a to 2 during data collection. Under these conditions, the OSC’s storage depth is 16 kSa/time, while the corresponding sampling frequency is approximately 3 Hz.
Then, we investigate the relationship between eavesdropping distance and estimated parameters. When the clip-on coupler is placed at 0 km and 40 km from EDFA1, the estimated EVM and SOP under eavesdropping are shown in Figure 10 and Figure 11, where T S is the sampling time of OSC. As can be seen, the degree of EVM increase is basically consistent, which is because the optical power loss caused by the clip-on coupler is fixed regardless of eavesdropping distance. For SOP, although the Stokes parameters are not completely identical, the characteristics of instantaneously jumping all have been recorded in Figure 11a,b. If we plot the Stokes parameters for 0 km and 40 km on the Poincaré sphere (Figure 12), it can be observed that the degree of Stokes parameters change in the Poincaré sphere is basically consistent. Therefore, the eavesdropping distance only affects the rotation SOP rotation of fiber link but does not affect the characteristics of eavesdropping. Moreover, for eavesdroppers, the closer they are to the EDFA launch point, the higher the power of the eavesdropped signal will be. Based on the above analysis and for the convenience of the experiment, we fix the clip-on coupler at 0 km from EDFA1 when collecting data. The estimated SOP and EVM example of 10 events can be found in the Supplementary Materials.
After collecting data and training the CNN model, the confusion matrix of the test set is obtained, as shown in Figure 13. To assess the effectiveness of the trained CNN model, we conducted a comprehensive performance evaluation based on standard classification metrics as detailed in Table 1, including overall accuracy, precision, recall, and F1-score for each class. The overall accuracy of the entire test set reached 0.9977, indicating high discriminative capability. However, the ASE noise in optical communication system, affects the performance of trained models. For the test set under 15 dB OSNR conditions, the classification accuracy is 0.9974, showing a 0.23% relative decrease compared to the overall accuracy. For the test set under 25 dB or 30 dB OSNR conditions, the accuracy increases slightly. In addition, the results also show that the trained model performs well in detecting each event. Under normal situations (C1), the recall rate can reach 100% with no missed detections (i.e., false negatives). The precision of C1 is 0.9987, with the major misclassifications (i.e., false positives) arising from vibration (C6). This is because sometimes the vibration intensity is not large enough for the change in SOP to be obvious. For fiber eavesdropping start and end (C2 and C3), the recall nearly approaches 1.0000, with only a few instances of missed detections. The major misclassifications of C2 and C3 are from C9 and C10, respectively, i.e., the overlapping of vibration and eavesdropping start or end. The misclassifications and missed detections for fiber bending (C4) primarily involve interference (C5) and vibrations (C6), but the model demonstrates strong discriminative capability between fiber bending and fiber eavesdropping. For the interference (C5), the misclassifications are mostly from the overlapping of interference and fiber eavesdropping start (C7), which is mainly because the interference could affect the transformance performance. However, the major missed detections of interference (C5) arise from the C7 and C8, i.e., the overlapping of interference and eavesdropping start or end, which indicates that fiber eavesdropping in an interference environment may be difficult to detect. For the vibration (C6), it is most easily classified as fiber bending (C4), as the duration of C6 fails to occupy a sufficiently large proportion of the sliding window length. As for the overlapping-type events (C7, C8, C9, and C10), they are easily confused with a single-type event.
In general, this model not only shows good performance in distinguishing fiber eavesdropping start or end from other abnormal events but also can detect the fiber eavesdropping when overlapped with other events. Notably, the bending angle and bending radius are fixed in our experiments. In fact, these parameters could affect the detection accuracy of fiber eavesdropping. When the bending radius exceeds 7.5 mm without an additional coupling scheme, the optical power loss will be lower than 0.2 dB [31]. This situation not only demands enhanced precision from OPM systems but also substantially complicates eavesdropping detection due to minimal OSNR variation.

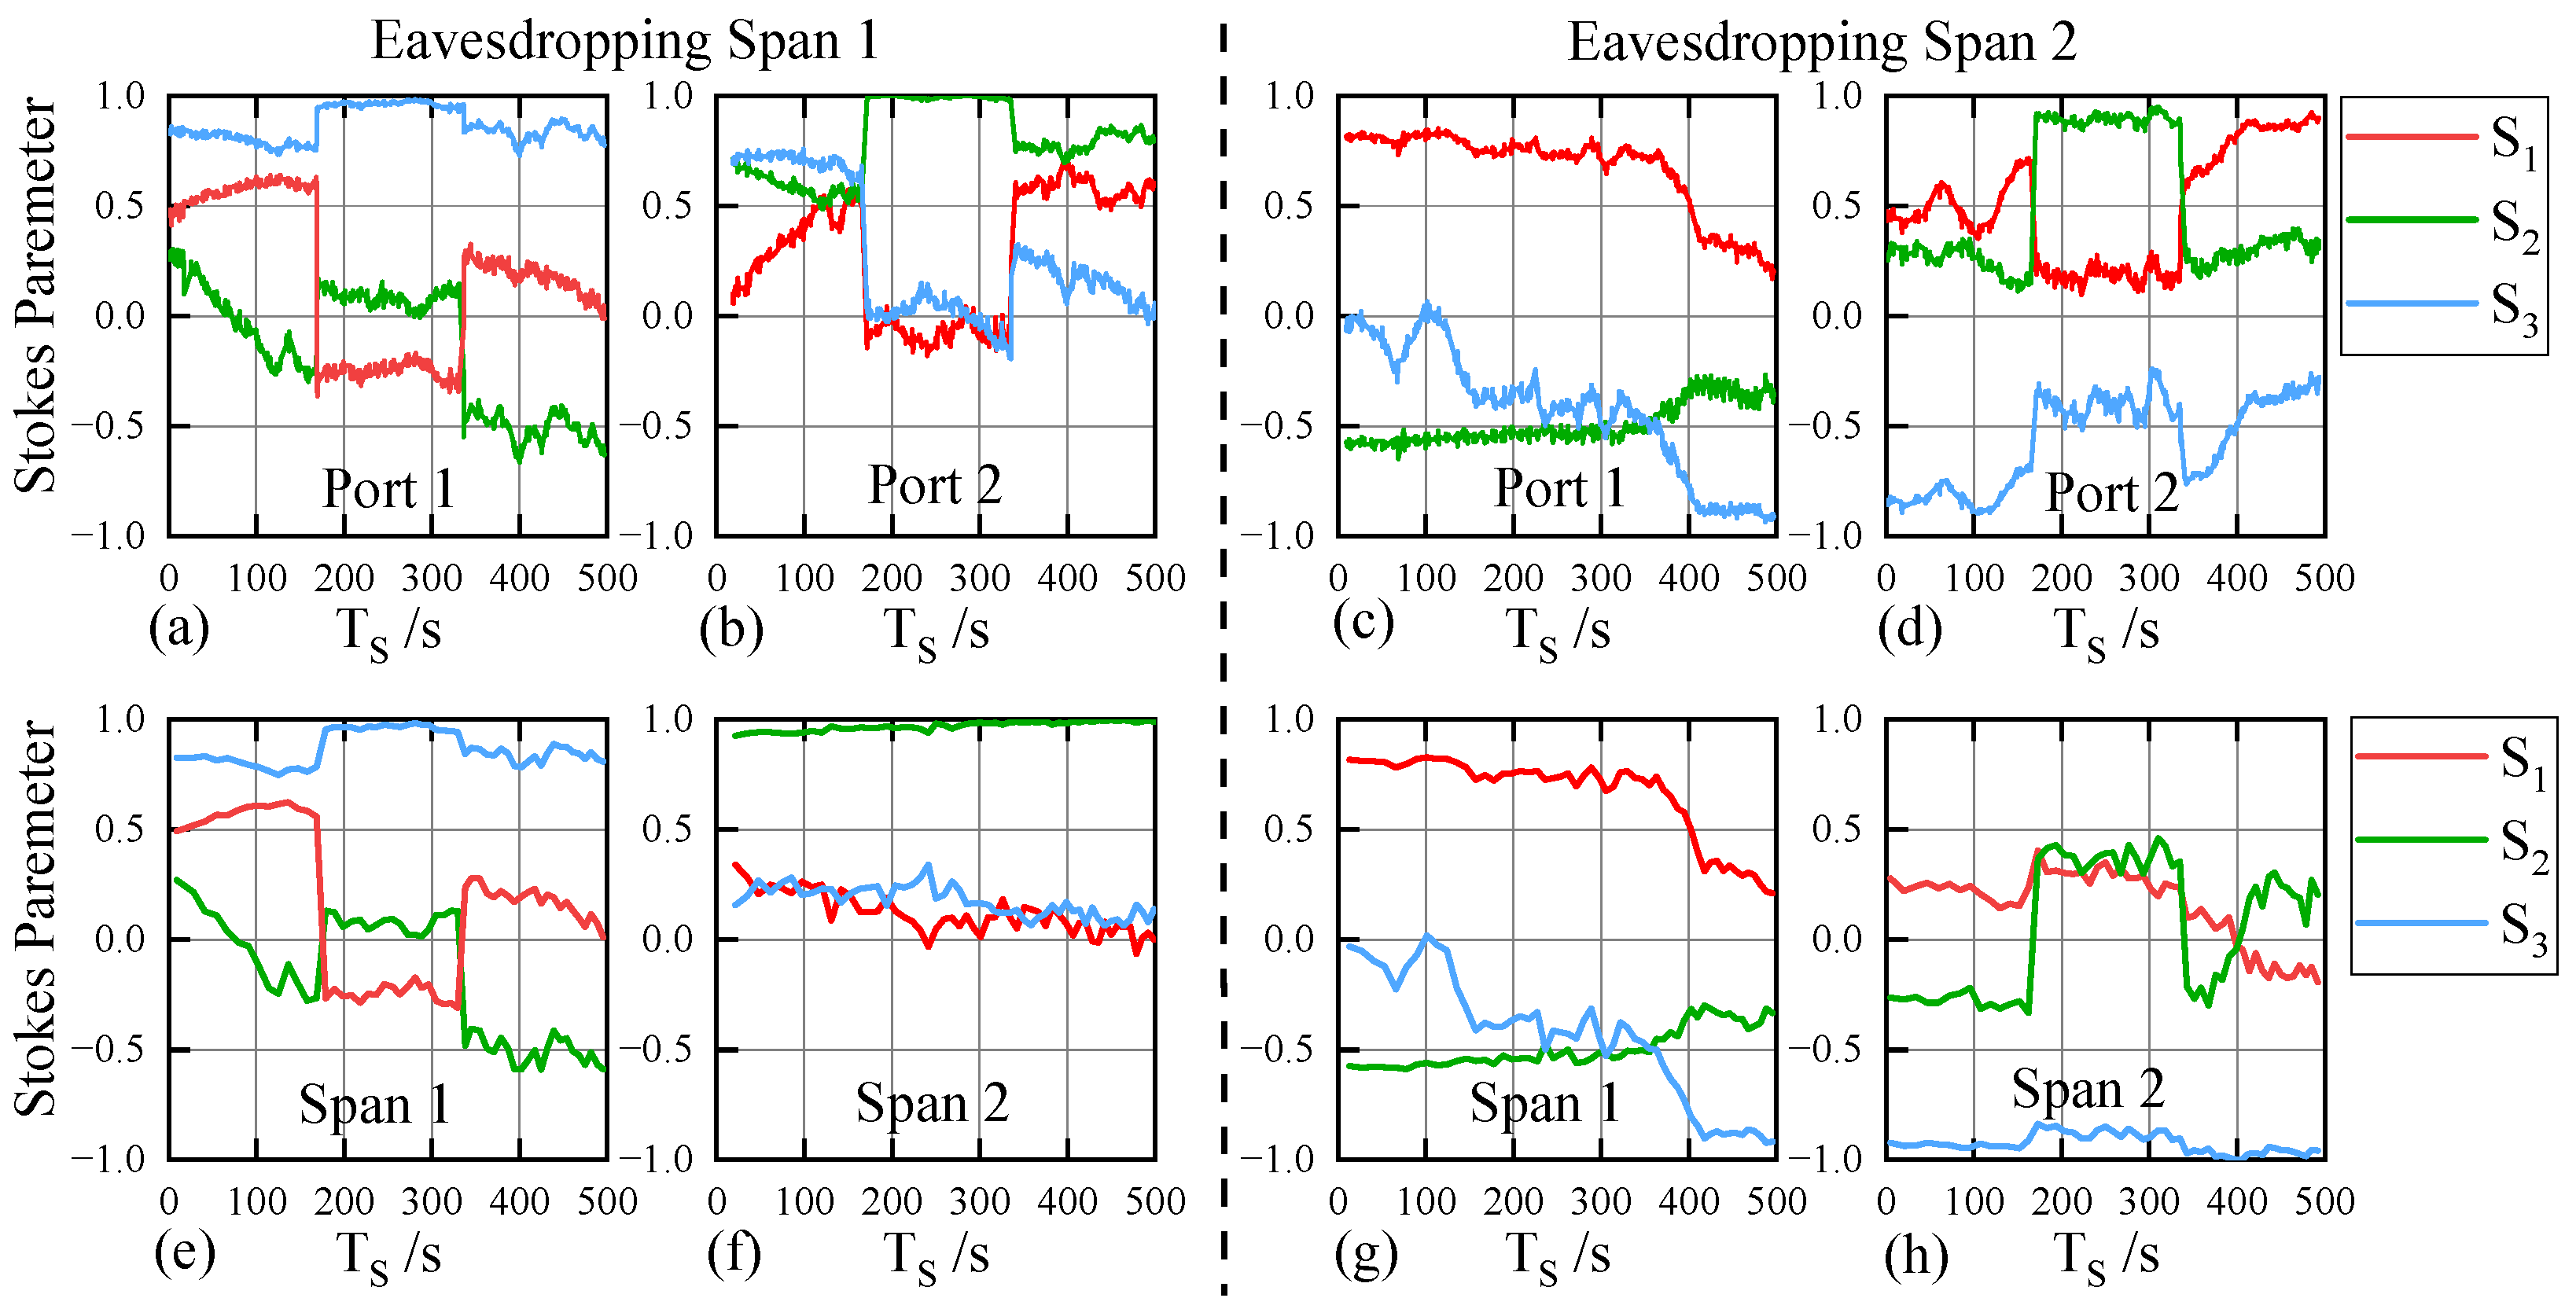
4.2. Fiber Eavesdropping Coarse Location in Multi-Span System

4.2.1. Experiment Setup

The second experiment aims to verify the effectiveness of the proposed multi-channel joint SOP estimation scheme and the feasibility of locating optical fiber eavesdropping in multi-span systems. The experiment set is shown in Figure 14. The fiber link consists of two spans of 40 km SSMF. Due to equipment limitations, we do not have the condition to emulate the WDM system with multi-receivers. In this experiment, we use an optical switch (OS) to select the optical signals entering the coherent receiver. As shown in Figure 11, we split the optical signals after the first 40 km of SSMF and EDFA and connect it to port 1 of OS. The output of signals after 80 km transmission and amplification is connected to port 2 of OS. A programmable direct current (DC) source generates a series of switching signals with a period of 30 s. The low level switches the optical signals from port 1 into a coherent receiver. The high level switches the optical signals from port 2 into a coherent receiver. In this way, we achieve to obtain the signals dropped from different fiber links. In this system, we emulate the fiber eavesdropping at different fiber links, respectively. The positions of eavesdropping are shown in Figure 14 with red dots. The OSNR of the multi-span system is monitored, as shown in Figure 14 with orange dots.

4.2.2. Results Analysis

Here we first show the estimated SOP only with the optical signal received from port 1 or 2. The results are shown in Figure 15a–d. As we can see, when fiber eavesdropping happens in span 2, the SOP of span 1 was not affected, as shown in Figure 15c. However, when the fiber eavesdropping happens in span 1, the SOP estimated from two ports both have the characteristics of fiber eavesdropping, as shown in Figure 15a,b. If the fiber link is more complex, we cannot locate which span is being eavesdropping. For comparison, we select a transfer function in each period to represent the state of these links in this period and estimate the SOP for each span using our proposed multi-channel joint SOP estimation scheme. The corresponding results are shown in Figure 15e–h. It can be observed in Figure 15f that the SOP of the span 2 is not affected by the fiber eavesdropping at the span 1, which indicates the effectiveness of the proposed scheme.
Next, we analyze the OSNR of different spans. Because we cannot continuously record optical OSNR, we only statistically record the OSNR at different nodes before and after eavesdropping, as shown in Table 2. Here, we analyze the OSNR of different spans according to the following:
1 OSNR 2 = 1 OSNR 1 + 1 OSNR Span 1 ,
1 OSNR 3 = 1 OSNR 2 + 1 OSNR Span 2 ,
where OSNRi, i = 1, 2, 3, is the monitored OSNR at the orange dots of Figure 14, and OSNRSpan1 and OSNRSpan2 are the estimated OSNRs of spans 1 and 2. The corresponding results are shown in Table 2. When the fiber eavesdropping happens in the span 1, OSNRSpan1 decreases by about 4 dB and OSNRSpan2 remains basically unchanged. When the fiber eavesdropping happens in the span 2, OSNRSpan2 decreases by about 3.5 dB, and OSNRSpan1 remains basically unchanged.
The above experiment results verify the feasibility of coarse fiber location with SOP and OPM data. However, due to equipment limitations, it is hard to synchronously collect received data from two OS ports and OSNR data at different monitoring positions. Therefore, we cannot analyze the detection accuracy of different fiber spans like the first experiment.

5. Conclusions

This paper investigated the solution of fiber eavesdropping detection and coarse location in optical communication systems based on SOP and OPM data. To address the challenge of acquiring the SOP of different fiber links, we propose a multi-channel joint SOP polarization estimation scheme. The scheme utilizes the coherent DSP algorithms and optical network control technology to estimate the SOP of different fiber spans, which avoids introducing additional equipment in the optical communication system. The effectiveness of the proposed solution is validated by experiments. In the aspect of fiber eavesdropping detection, we use the EVM of received signals to assist estimated SOP. In this situation, we can detect the start and end of fiber eavesdropping, which helps to analyze the duration of fiber eavesdropping. The successful detection of fiber eavesdropping overlapping with other abnormal events also demonstrates the robustness of our proposed solution. In the aspect of fiber eavesdropping coarse detection, we schematically demonstrate how to locate fiber optic eavesdropping with SOP and OSNR.
Due to equipment limitations, there are still two aspects that need to be improved in our experiments. The first is to analyze the fluence of fiber bending angle and radius on the detection accuracy. The second is to assess the coarse location accuracy of each fiber span by improving experimental conditions. In future research, we will continue to optimize the experimental results and consider verifying the proposed scheme in a practical optical network environment.

Supplementary Materials

The following supporting information can be downloaded at: https://www.mdpi.com/article/10.3390/photonics12050501/s1, Table S1. The emulated evens and corresponding labels. Figure S1. The (a) estimated Stokes and (b) EVM for C1. Figure S2. The (a) estimated Stokes and (b) EVM for C2 and C3. Figure S3. The (a) estimated Stokes and (b) EVM for C4. Figure S4. The (a) estimated Stokes and (b) EVM for C5. Figure S5. The (a) estimated Stokes and (b) EVM for C6. Figure S6. The (a) estimated Stokes and (b) EVM for C7 and C8. Figure S7. The (a) estimated Stokes and (b) EVM for C9 and C10.

Author Contributions

Conceptualization, Y.L. (Yuang Li); data curation, Y.L. (Yuang Li); formal analysis, Y.L. (Yuang Li), Y.L. (Yuyuan Liang), M.Z., and S.W.; funding acquisition, Y.L. (Yuang Li), Y.L. (Yajie Li), and J.Z.; investigation, Y.L. (Yuang Li), Y.L. (Yuyuan Liang), M.Z., S.W., and H.Z.; methodology, Y.L. (Yuang Li) and Y.L. (Yajie Li); project administration, Y.L. (Yajie Li), Y.Z., and J.Z.; resources, Y.L. (Yajie Li); software, Y.L. (Yuang Li); supervision, Y.L. (Yajie Li), Y.Z., and J.Z.; validation, Y.L. (Yuang Li), Y.L. (Yuyuan Liang), M.Z., and S.W.; visualization, Y.L. (Yuang Li); writing—original draft, Y.L. (Yuang Li); writing—review and editing, Y.L. (Yuang Li), H.Z., and Y.L. (Yajie Li). All authors have read and agreed to the published version of the manuscript.

Funding

This research was funded by the National Natural Science Foundation of China (62471063, 62425105), the Beijing Natural Science Foundation (4232011), the BUPT Excellent Ph.D. Students Foundation (CX20243029), and the Fundamental Research Funds for the Central Universities.

Institutional Review Board Statement

Not applicable.

Informed Consent Statement

Not applicable.

Data Availability Statement

Data underlying the results presented in this paper are not publicly available at this time but maybe obtained from the authors upon reasonable request.

Conflicts of Interest

The authors declare no conflicts of interest.

Appendix A

Appendix A.1. The Structure of CNN

The CNN of Figure 8 starts with a 2D convolutional layer with a kernel size of 3 × 3, producing a 32-channel output, followed by a 2 × 2 max-pooling layer. Due to the column number of the first convolutional layer being an odd number, 5, the stride of the first max-pooling layer is (1, 2), whose output size is (32, 4, 32). The stride of the subsequent max-pooling layers is all set to (2, 2). Next, two consecutive convolutional layers are employed: the first expands the 32-channel input into a 64-channel output, while the second maintains the 64-channel dimensionality. A 2 × 2 max-pooling layer follows these convolutional layers. Before feeding the extracted features into the fully connected (FC) layers, a flattening layer is applied to convert the multi-dimensional feature maps into a one-dimensional vector. Next, an FC layer projects the extracted 1024-dimensional features onto a 128-dimensional space. To mitigate overfitting, a dropout layer is incorporated. Another FC layer then projects the 128-dimensional features onto 10 distinct output classes. Finally, a softmax function is applied, generating a probability distribution across the classes.

Appendix A.2. Data Augmentation

To improve the model’s generalization capability, we perform data augmentation on the estimated Stokes parameters. By rotating the Stokes parameters randomly in the Poincaré sphere, it is possible to cover the maximum possible variations of SOP. Here, we first generate a Jones matrix randomly:
U r = cos α e j φ sin α e j θ sin α e j θ cos α e j φ ,
where α , φ , and θ are the generated random angle belongs to [ 0 , 2 π ] . The corresponding Miller matrix is as follows:
R r = R r , 11 R r , 12 R r , 13 R r , 21 R r , 22 R r , 23 R r , 31 R r , 32 R r , 33 ,
where R r , i j , i, j = 1, 2, 3 is as follows:
R r , i j = 1 2 Tr U r σ j U r σ i .
σ k , k = 1, 2, 3 is the Pauli matrix, written as follows:
σ 1 = 1 0 0 1 , σ 2 = 0 1 1 0 , σ 2 = 0 j i 0 .
For the estimated Stokes parameters sequence S t = S 1 t S 2 t S 3 t T , the rotated Stokes parameters sequence is written as follows:
S r t = R r S t

Appendix A.3. Training Setup

During the process of training the model, a dataset containing 806,405 samples is divided into a training set and a validation set in an 80:20 ratio. The training set is used to train the network parameters, while the validation set is used to evaluate the model’s performance and adjust the learning rate. After the model training is completed, a test set with 215,424 samples is used to evaluate the performance of the trained CNN.

References

  1. Bhatt, V. On Continued Significance of Multimode Links in Data Centers. J. Light. Technol. 2025, 43, 1700–1707. [Google Scholar] [CrossRef]
  2. Xie, C.; Zhang, B. Scaling Optical Interconnects for Hyperscale Data Center Networks. Proc. IEEE 2022, 111, 1699–1713. [Google Scholar] [CrossRef]
  3. Zhou, X.; Lam, C.F.; Urata, R.; Liu, H. State-of-the-Art 800G/1.6T Datacom Interconnects and Outlook for 3.2T. In Proceedings of the Optical Fiber Communication Conference (OFC) 2023, San Diego, CA, USA, 5–9 March 2023. paper W3D.1. [Google Scholar]
  4. Tian, Y.; Dong, B.; Li, Y.; Xiong, B.; Zhang, J.; Sun, C.; Hao, Z.; Wang, J.; Wang, L.; Han, Y.; et al. Photonics-assisted THz wireless communication enabled by wide-bandwidth packaged back-illuminated modified uni-traveling-carrier photodiode. Opto-Electron. Sci. 2024, 3, 230051-1. [Google Scholar] [CrossRef]
  5. Shaneman, K.; Gray, S. Optical network security: Technical analysis of fiber tapping mechanisms and methods for detection & prevention. In Proceedings of the IEEE Military Communications Conference (MILCOM) 2024, Monterey, CA, USA, 31 October–3 November 2004. [Google Scholar]
  6. Sadot, D.; Wohlgemuth, E.; Attia, I.; Balasiano, O.; Jonas, I.; Keller, E.; Shalom, H. Photonic Layer Security in High-Speed Optical Communications. J. Light. Technol. 2025, 43, 1671–1677. [Google Scholar] [CrossRef]
  7. Chen, Q.; Fan, Y.; Cheng, M.; Gao, X. Secure Spread Spectrum Communication Using Super-Orthogonal Optical Chaos Signals. IEEE Photonics J. 2022, 14, 1–6. [Google Scholar] [CrossRef]
  8. Li, Y.; Li, Y.; Zhu, K.; Wang, W.; Zhao, Y.; Zhang, J. Analysis of the encryption penalty in a QAM-based quantum noise stream cipher. Opt. Express 2023, 31, 19006–19020. [Google Scholar] [CrossRef] [PubMed]
  9. Wei, S.; Liu, S.; Wang, D.; Zhang, M.; Li, Y.; Wang, W.; Li, Y.; Zhang, D.; Zhao, Y.; Zhang, J. Probabilistic shaping probability distribution scrambling based on a chaotic system for integrating secure transmission and adaptive key updating. Opt. Express 2024, 32, 42545–42557. [Google Scholar] [CrossRef]
  10. Zekun, N.; Yunhao, X.; Guozhi, X.; Chenhao, D.; Hang, Y.; Chuyan, Z.; Minghui, S.; Lyv, L.; Guoqing, P.; Weisheng, H.; et al. Experimental Demonstration of Integrated Encryption and Communication over Optical Fibre. Natl. Sci. Rev. 2025, nwaf112. [Google Scholar] [CrossRef]
  11. Michal, R.; Lukas, J.; Petr, D.; Adrian, T.; Vladimir, S.; Petr, M. Classification of Events Violating the Safety of Physical Layers in Fiber-Optic Network Infrastructures. Sensors 2022, 22, 9515. [Google Scholar] [CrossRef] [PubMed]
  12. Sun, Z.; Liu, K.; Jiang, J.; Xu, T.; Wang, S.; Guo, H.; Zhou, Z.; Xue, K.; Huang, Y.; Liu, T. Optical Fiber Distributed Vibration Sensing Using Grayscale Image and Multi-Class Deep Learning Framework for Multi-Event Recognition. IEEE Sens. J. 2021, 17, 19112–19120. [Google Scholar]
  13. Abdelli, K.; Cho, J.Y.; Azendorf, F.; Griesser, H.; Tropschug, C.; Pachnicke, S. Machine-learning-based anomaly detection in optical fiber monitoring. J. Opt. Commun. Netw. 2022, 14, 365–375. [Google Scholar] [CrossRef]
  14. Popp, A.; Sedlmeir, F.; Stiller, B.; Marquardt, C. Eavesdropper localization for quantum and classical channels via nonlinear scattering. Opt. Quantum 2024, 2, 21–28. [Google Scholar] [CrossRef]
  15. Song, H.; Li, Y.; Liu, M.; Wang, K.; Li, J.; Zhang, M.; Zhao, Y.; Zhang, J. Experimental study of machine-learning-based detection and location of eavesdropping in end-to-end optical fiber communications. Opt. Fiber Technol. 2022, 68, 102669. [Google Scholar] [CrossRef]
  16. Song, H.; Lin, R.; Wosinska, L.; Monti, P.; Zhang, M.; Liang, Y.; Li, Y.; Zhang, J. Cluster-based unsupervised method for eavesdropping detection and localization in WDM systems. J. Opt. Commun. Netw. 2024, 16, F52–F61. [Google Scholar] [CrossRef]
  17. Sadighi, L.; Karlsson, S.; Natalino, C.; Furdek, M. Machine Learning-Based Polarization Signature Analysis for Detection and Categorization of Eavesdropping and Harmful Events. In Proceedings of the Optical Fiber Communication Conference (OFC) 2024, San Diego, CA, USA, 24–28 March 2024. paper M1H.1. [Google Scholar]
  18. Sadighi, L.; Karlsson, S.; Wosinska, L.; Furdek, M. Machine Learning Analysis of Polarization Signatures for Distinguishing Harmful from Non-harmful Fiber Events. In Proceedings of the 24th International Conference on Transparent Optical Networks (ICTON) 2024, Bari, Italy, 14–18 July 2024. [Google Scholar]
  19. Abdelli, K.; Lonardi, M.; Gripp, J.; Correa, D.; Olsson, S.; Boitier, F.; Layec, P. Anomaly Detection and Localization in Optical Networks Using Vision Transformer and SOP Monitoring. In Proceedings of the Optical Fiber Communication Conference (OFC) 2024, San Diego, CA, USA, 24–28 March 2024. paper Tu2J.4. [Google Scholar]
  20. Pellegrini, S.; Minelli, L.; Andrenacci, L.; Rizzelli, G.; Pilori, D.; Bosco, G.; Della Chiesa, L.; Crognale, C.; Piciaccia, S.; Gaudino, R. Overview on the state of polarization sensing: Application scenarios and anomaly detection algorithms. J. Opt. Commun. Netw. 2025, 17, A196–A209. [Google Scholar] [CrossRef]
  21. Kyle, G.; Jesse, E.S.; Fabien, B.; Dan, K.; Jelena, P.; Michael, S. Efficient Classification of Polarization Events Based on Field Measurements. In Proceedings of the Optical Fiber Communication Conference (OFC), San Diego, CA, USA, 8–12 March 2020. paper Th3D-7. [Google Scholar]
  22. Ji, P.N.; Ye, Z.; Huang, Y.K.; de Lima, T.F.; Aono, Y.; Asahi, K.; Wang, T. Optical Network Anomaly Detection and Localization Based on Forward Transmission Sensing and Route Optimization. In Proceedings of the Optical Fiber Communication Conference 2024, San Diego, CA, USA, 24–28 March 2024. paper Tu2J.4. [Google Scholar]
  23. Yaman, F.; Li, Y.; Han, S.; Inoue, T.; Mateo, E.; Inada, Y. Polarization Sensing Using Polarization Rotation Matrix Eigenvalue Method. In Proceedings of the Optical Fiber Communication Conference (OFC) 2023, San Diego, CA, USA, 5–9 March 2023. paper W1J.7. [Google Scholar]
  24. Stefan, K.; Rui, L.; Lena, W.; Paolo, M.; Eavesdropping, G. 652 vs. G. 657 fibres: A performance comparison. In Proceedings of the 2022 International Conference on Optical Network Design and Modeling (ONDM), Warsaw, Poland, 16–19 May 2022; pp. 1–3. [Google Scholar]
  25. Thyagaturu, A.S.; Mercian, A.; McGarry, M.P.; Reisslein, M.; Kellerer, W. Software Defined Optical Networks (SDONs): A Comprehensive Survey. IEEE Commun. Surv. Tutor. 2016, 18, 2738–2786. [Google Scholar] [CrossRef]
  26. Lee, J.H.; Yoshikane, N.; Tsuritani, T.; Otani, T. In-band OSNR monitoring technique based on link-by-link estimation for dynamic transparent optical networks. J. Light. Technol. 2008, 26, 1217–1225. [Google Scholar] [CrossRef]
  27. Wan, Y.; Liu, X.; Wu, G.; Yang, M.; Yan, G.; Zhang, Y.; Wang, J. Efficient stochastic parallel gradient descent training for on-chip optical processor. Opto-Electron. Adv. 2024, 7, 230182. [Google Scholar]
  28. Liu, T.; Wang, W.; Ouyang, F.; Hao, Y.; Li, Y.; Zhao, Y.; Zhang, J. Eavesdropping-aware survivable routing in physical-layer secured optical networks. J. Opt. Commun. Netw. 2025, 17, 127–138. [Google Scholar] [CrossRef]
  29. Cantono, M.; Castellanos, J.C.; Batthacharya, S.; Yin, S.; Zhan, Z.; Mecozzi, A.; Kamalov, V. Optical Network Sensing: Opportunities and Challenges. In Proceedings of the Optical Fiber Communication Conference (OFC) 2022, San Diego, CA, USA, 6–10 March 2022. paper M2F.1. [Google Scholar]
  30. Pittala, F.; Slim, I.; Mezghani, A.; Nossek, J.A. Training-aided frequency-domain channel estimation and equalization for single-carrier coherent optical transmission systems. J. Light. Technol. 2014, 32, 4849–4863. [Google Scholar] [CrossRef]
  31. And, K.Y.; Ahmet, D.; Heha, Y.D. Experimental optical setup to measure power loss versus fiber bent radius for tapping into optical fiber communication links. In Proceedings of the 2021 International Conference on Electrical, Computer and Energy Technologies (ICECET), Cape Town, South Africa, 9–10 December 2021; pp. 1–6. [Google Scholar]
Figure 1. The photos of the clip-on coupler: (a) in the open state; (b) in the closed state.
Photonics 12 00501 g001
Figure 2. (a) The experiment setup of measure SOP. (bd) The different stage of clip-on coupler.
Photonics 12 00501 g002
Figure 3. (a) The temporal Stokes parameters traces for the decomposition process of optical eavesdropping. (b) The temporal Stokes parameters traces for the successive process of optical eavesdropping.
Photonics 12 00501 g003
Figure 4. (ac). Optical spectrum of different positions before and after fiber eavesdropping at different nodes.
Photonics 12 00501 g004
Figure 5. (a) EVM vs. OSNR1; (b) OSNR2 vs. OSNR1.
Photonics 12 00501 g005
Figure 6. (a) The experiment setup of measuring OTDR curve under fiber eavesdropping; (b) OTDR traces.
Photonics 12 00501 g006
Figure 7. Schematic diagram of fiber eavesdropping detecting and location in optical communication system.
Photonics 12 00501 g007
Figure 8. The experiment setup of detecting fiber eavesdropping in single-span system.
Photonics 12 00501 g008
Figure 9. The standard deviation of estimated Stokes parameters σ S as the function of frame numbers N a in channel estimation.
Photonics 12 00501 g009
Figure 10. The estimated EVM as a function of sampling time T S when the clip-on coupler is placed at 0 km (a) and 40 km (b) from EDFA1.
Photonics 12 00501 g010
Figure 11. The estimated Stokes parameters as a function of sampling time T S when the clip-on coupler is placed at 0 km (a) and 40 km (b) from EDFA1.
Photonics 12 00501 g011
Figure 12. The estimated Stokes parameters in Poincaré sphere.
Photonics 12 00501 g012
Figure 13. The confusion matrix of test set.
Photonics 12 00501 g013
Figure 14. The experiment setup of locating fiber eavesdropping in multi-span system.
Photonics 12 00501 g014
Figure 15. (ad) The estimate SOP only with the optical signal received from port 1 or 2. (eh) The estimate SOP of span 1 or 2 by the proposed scheme.
Photonics 12 00501 g015
Table 1. The accuracy, precision, recall, and F1-score of test set.
EntireOSNR = 15 dBOSNR = 20 dBOSNR = 25 dBOSNR = 30 dB
Accuracy0.99770.99740.99770.99780.9978
C1C2C3C4C5C6C7C8C9C10
Precision0.99870.99910.99830.99510.99490.99800.99450.99820.99981.0000
Recall1.00001.00000.99970.99870.99720.99410.99870.99670.99660.9946
F1-score0.99940.99950.99900.99690.99610.99610.99660.99750.99820.9973
Table 2. The OSNR before and after fiber eavesdropping.
OSNR1OSNR2OSNR3OSNRSpan1OSNRSpan2
NO Eavesdropping43.238.234.539.8536.92
Eavesdropping Span143.235.232.935.8336.91
Eavesdropping Span243.235.231.339.8533.64
Disclaimer/Publisher’s Note: The statements, opinions and data contained in all publications are solely those of the individual author(s) and contributor(s) and not of MDPI and/or the editor(s). MDPI and/or the editor(s) disclaim responsibility for any injury to people or property resulting from any ideas, methods, instructions or products referred to in the content.

