1. Introduction
Physical-layer security in optical networks is crucial as they face threats that may disrupt services or allow access to confidential data without authorization [
1]. The quantum key distribution (QKD) is proposed as a method to stand against these threats [
2]. Although QKD can provide unconditional physical-layer security, it suffers from technical imperfections, which pose great challenges to the rates of key generation and transmission distances. QKD has seen breakthroughs in extending secure transmission distances [
3] and increasing secret key rates [
4]. However, these schemes still require complex equipment to achieve. Compared to QKD, quantum secure direct communication (QSDC) has the advantage of immediacy, as it does not require key establishment before information transmission [
5]. Yet, its practical application is limited by the current technological constraints of quantum memory and quantum repeaters. Quantum digital signatures (QDSs) offer a promising approach for the future of digital signatures and data integrity [
6,
7]. Nevertheless, implementing QDSs requires advanced quantum communication infrastructure, including stable QKD systems and controlled quantum networks. Quantum noise stream cipher (QNSC) is proposed to overcome these challenging implementation difficulties [
8,
9,
10,
11,
12,
13,
14,
15,
16]. It allows high transmission rates and long distances since the encoding and decoding are performed in digital signal processing (DSP). The security is protected by the quantum noise in the transmission system. Many experiments have been reported for different modulation formats in QNSC, such as phase shift-key (PSK) [
8], quadrature amplitude modulation (QAM) [
9,
10,
11,
12] and intensity modulation (IM) [
9,
10,
11].
To further enhance the security of QNSC, the technique of quantum noise randomized cipher (QNRC) has been developed. It increases the noise masking by applying randomization in the QNSC symbol. There have been reports of both theoretical and experimental studies related to the QNRC system [
14,
15,
16,
17,
18,
19,
20,
21,
22]. Recently, the randomization scheme driven by optical temporal scrambling has been proposed [
14]. Moreover, applying a chaotic system as a random source is also an effective method to enhance the QNRC [
15,
16,
17,
18,
19]. All these schemes need a pseudo/true-random number generator as a randomization source for QNRC. Although randomization has shown advantages in enhancing the security of QNRC, existing studies have pointed out that high levels of randomization may significantly decrease transmission performance. Moreover, existing studies have rarely analyzed the limiting capacity of randomization under various conditions. Therefore, it is essential to conduct a quantitative capacity analysis of randomization in QNRC to determine the maximal level of randomization that can ensure both high security and high transmission performance.
In this paper, we propose a capacity analysis method for randomization in QNRC and verify it in 160 km BPSK/QNRC, QPSK/QNRC and 16QAM/QNRC transmission systems. Compared to existing methods, our approach offers unique advantages in analyzing randomization capacity: it enables quantification of system randomization capacity across different modulation formats and optical signal-to-noise ratios, thereby assessing the maximum level of randomization that ensures both high security and transmission performance. Experimental results demonstrate that the BPSK-based 2M QNRC system has the best capacity performance for randomization. And a higher M leads to a lower capacity. Moreover, BPSK has the highest value of noise masking while the system’s randomization level reaches its capacity.
In the following sections, this paper provides a structured analysis of the randomization capacity in QNRC systems.
Section 2 introduces the principle of QNRC, explaining the encryption schemes and randomization techniques utilized for different data modulation formats. In
Section 3, we present a detailed mathematical framework for calculating randomization capacity across various modulation schemes, including BPSK, QPSK, 16QAM and IM.
Section 4 describes the experimental setup used to evaluate QNRC performance over a 160 km optical fiber link and discusses the results, highlighting the security and randomization capacity trade-offs under different conditions. Finally,
Section 5 concludes the paper by summarizing key findings and suggesting future directions.
2. Principle of QNRC
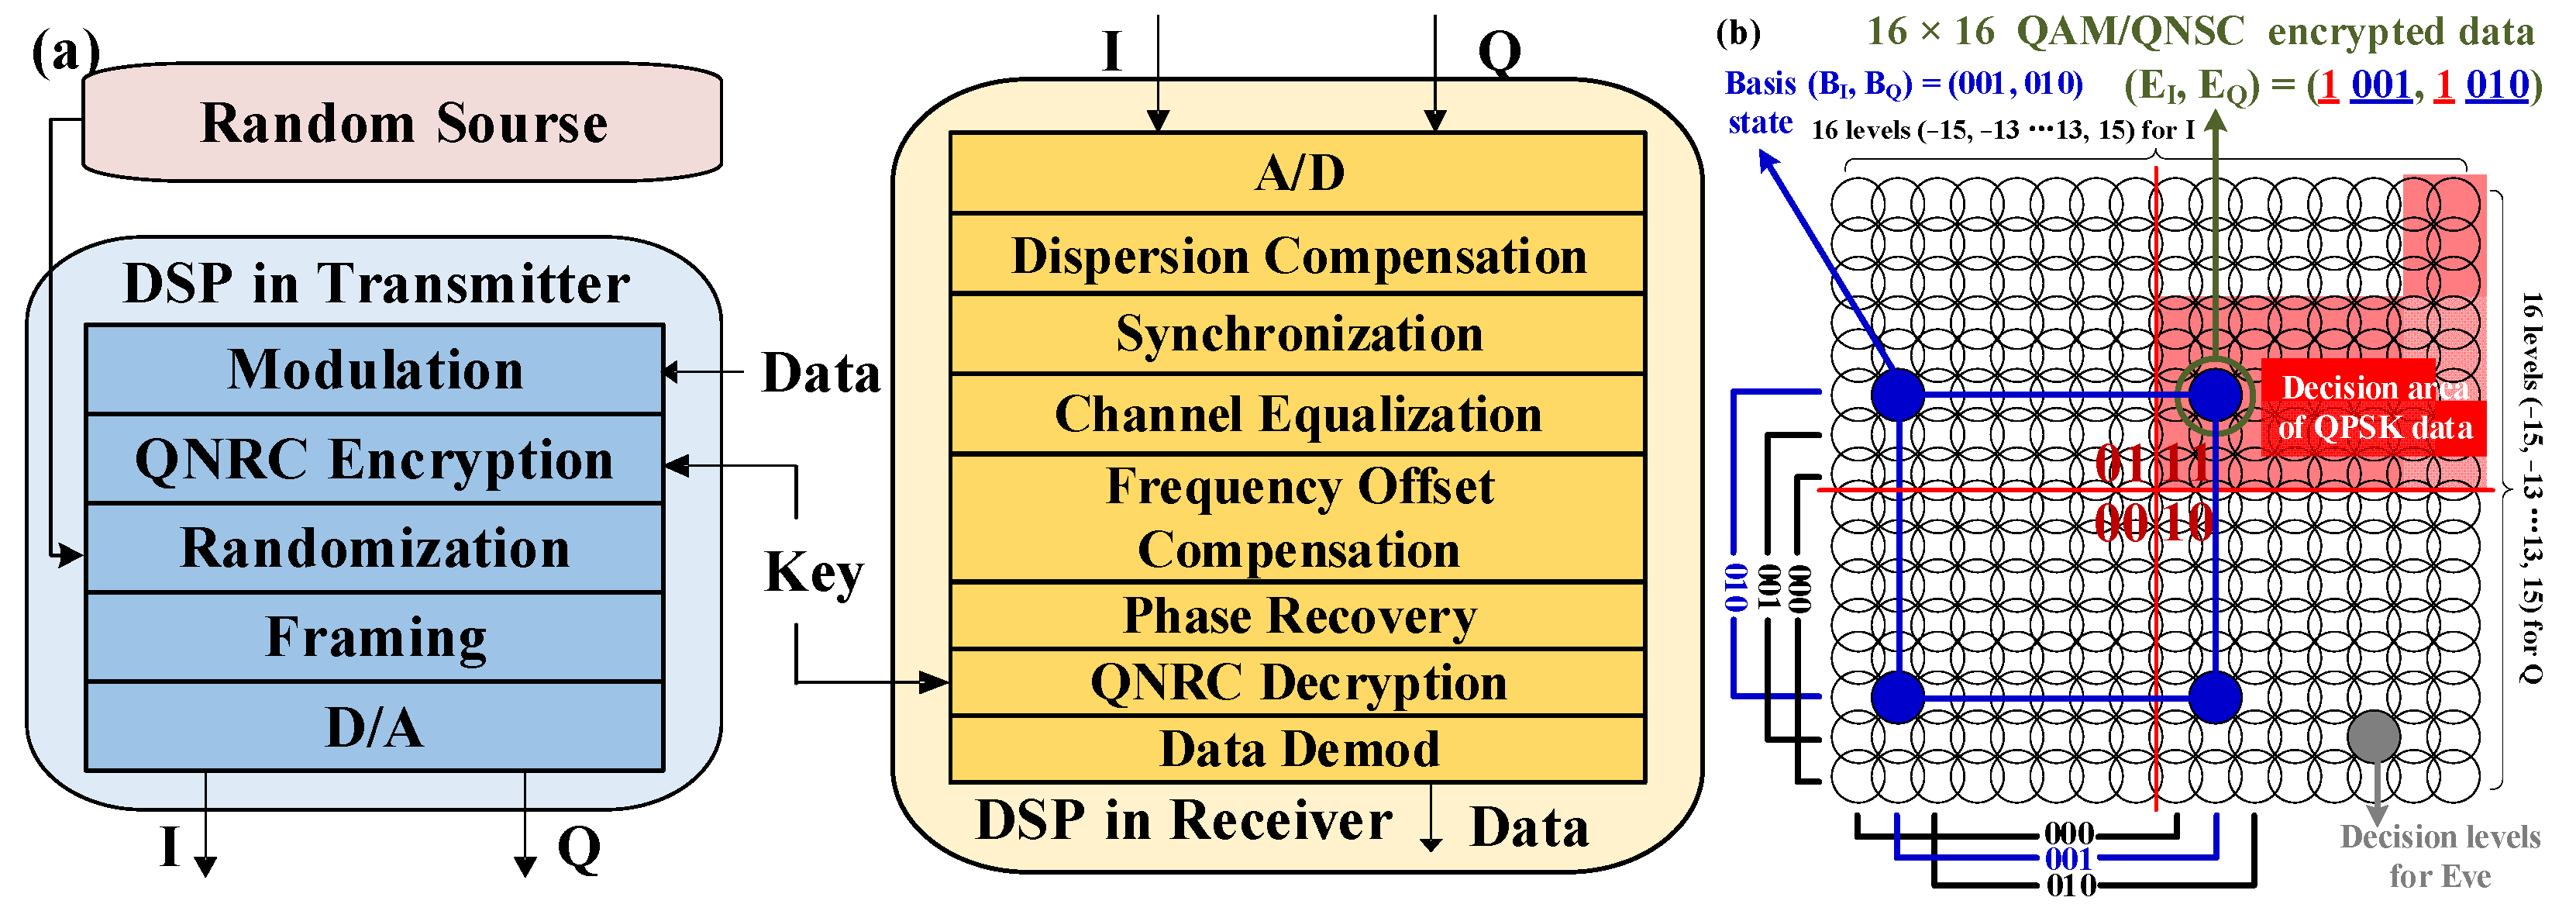
Figure 1 shows the DSP module in QNRC at the transmitter and receiver. For QPSK/QNRC and 16QAM/QNRC, the original data stream is firstly mapped into QPSK or 16QAM symbols at the transmitter. Secondly, the randomized signal is encrypted into QAM format with QNRC. In detail, the encrypted QAM is, respectively, generated by 1-bit QPSK or 2-bit 16QAM signal xor
M-bit basis (which uses keys generated by pseudo-random number generator (PRNG) and is pre-synchronized by Alice and Bob) in I and Q modes. The encryption rule is also shared by Alice and Bob. The modulation format of such encrypted data is 2
M × 2
M QAM. The mapping rule of QNRC is natural binary mapping instead of gray mapping. Therefore, 2-bit or 4-bit (I + Q) is hidden in one encrypted QAM symbol and the correct decision level of the signal for Eve is covered with quantum noise. Similarly, BPSK or IM symbols can also be encrypted into 2
M BPSK/QNRC or 2
M IM/QNRC symbols. As an example, the constellation of 16 × 16 QAM/QNRC is shown in
Figure 1b, where QPSK (1 bit for I and Q, respectively) data are encrypted by using
basis states (3 bits for I and Q, respectively). We use 2-bit information data
,
and 6-bit basis
,
to generate 8-bit encrypted data
,
. The encrypted binary information
and
are converted into decimal constellation levels
and
. Then, we apply scrambling to
and
as follows:
, where
and
are randomized perturbations with a standard deviation of
. Meanwhile,
and
are determined based on random numbers from a random source. Similarly, this disturbance manifests in the phase for BPSK and in the optical intensity for IM. Our previous work demonstrated an integrating key distribution scheme based on the physical layer of optical fibers. The generated keys have been proven to exhibit good randomness, which can be used as a random source for QNRC [
23,
24,
25]. Finally, training sequences and pilots are inserted into randomized I/Q signals for transmission.
Figure 2 shows the principle of randomization in QNRC for different data modulation. The blue and pink areas represent the noise masking range before and after randomization, respectively. The effect of randomization directly appears as the increase in the noise masking and the decrease in Bob’s receiver performance. Nevertheless, Bob can receive the data correctly as long as
γ is below a critical level. This fact leads us to the motivation of capacity analysis of randomization.
3. Randomization Capacity
The capacity of randomization (
CR) is defined as the difference in mutual information between Alice and Bob between
and maximal γ. The value of maximal γ is obtained when the bit error rate (BER) of Bob reaches the forward error correction (FEC) threshold
Pth. The specific calculation method of mutual information in BPSK and IM (
N-level) is shown in Equations (1) and (2).
where
x is the data from Alice before transmission,
y is the data received by Bob.
CR is related to
I0 and
Ith based on Equations (1) and (2).
I0 represents the mutual information between Alice and Bob without randomization. A higher value of
I indicates better system transmission performance, which is influenced by factors such as system noise and optical fiber nonlinearity. Meanwhile,
Ith represents the mutual information between Alice and Bob with randomization while BER reaches
Pth. The value of
Ith depends on
Pth. It can be observed that the
CR of the system increases as the system transmission performance improves or a more powerful FEC algorithm with a higher threshold
Pth is employed.
CR for BPSK and IM is as Equation (3) to Equation (5).
Similarly, the calculation methods of mutual information and
CR in QPSK and 16QAM (
N ×
N-level), are given, respectively, by Equation (6) to Equation (10).
3.1. CR in BPSK/QNRC
The principle of QNRC differs when data modulation is varied. Hence, the calculation method of
CR is also different for QNRC in different data modulations.
Figure 3 shows the principle of BPSK-based QNRC. Data are encrypted by rotating the phase of BPSK with
θbasis. After encryption, the constellation becomes a high-order PSK signal. Subsequently, a truly random phase randomization of
θR is added to the signal. The range of randomization is
γ and it has a maximum value of
CR. The randomization increases in the noise masking. In the receiver, only
θbasis is subtracted with the pre-shared key. And the effect of randomization decreases Bob’s receiver performance.
The noise masking Γ is commonly considered as an evaluation index of security in the QNRC system. In 2
M BPSK/QNRC, the average phase noise
is defined as Equation (11). The Γ
BPSK is given as Equation (12).
The calculation of the bit error ratio for the
M-th bit position is as Equation (13). The
M-th bit has the lowest bit error rate among 1-st to
M-th bits in the 2
M BPSK/QNRC symbol. It is used for data transmission [
10].
Appling
RM-BPSK in Equation (5),
CR in BPSK/QNRC is shown as follows:
3.2. CR in QPSK/QNRC
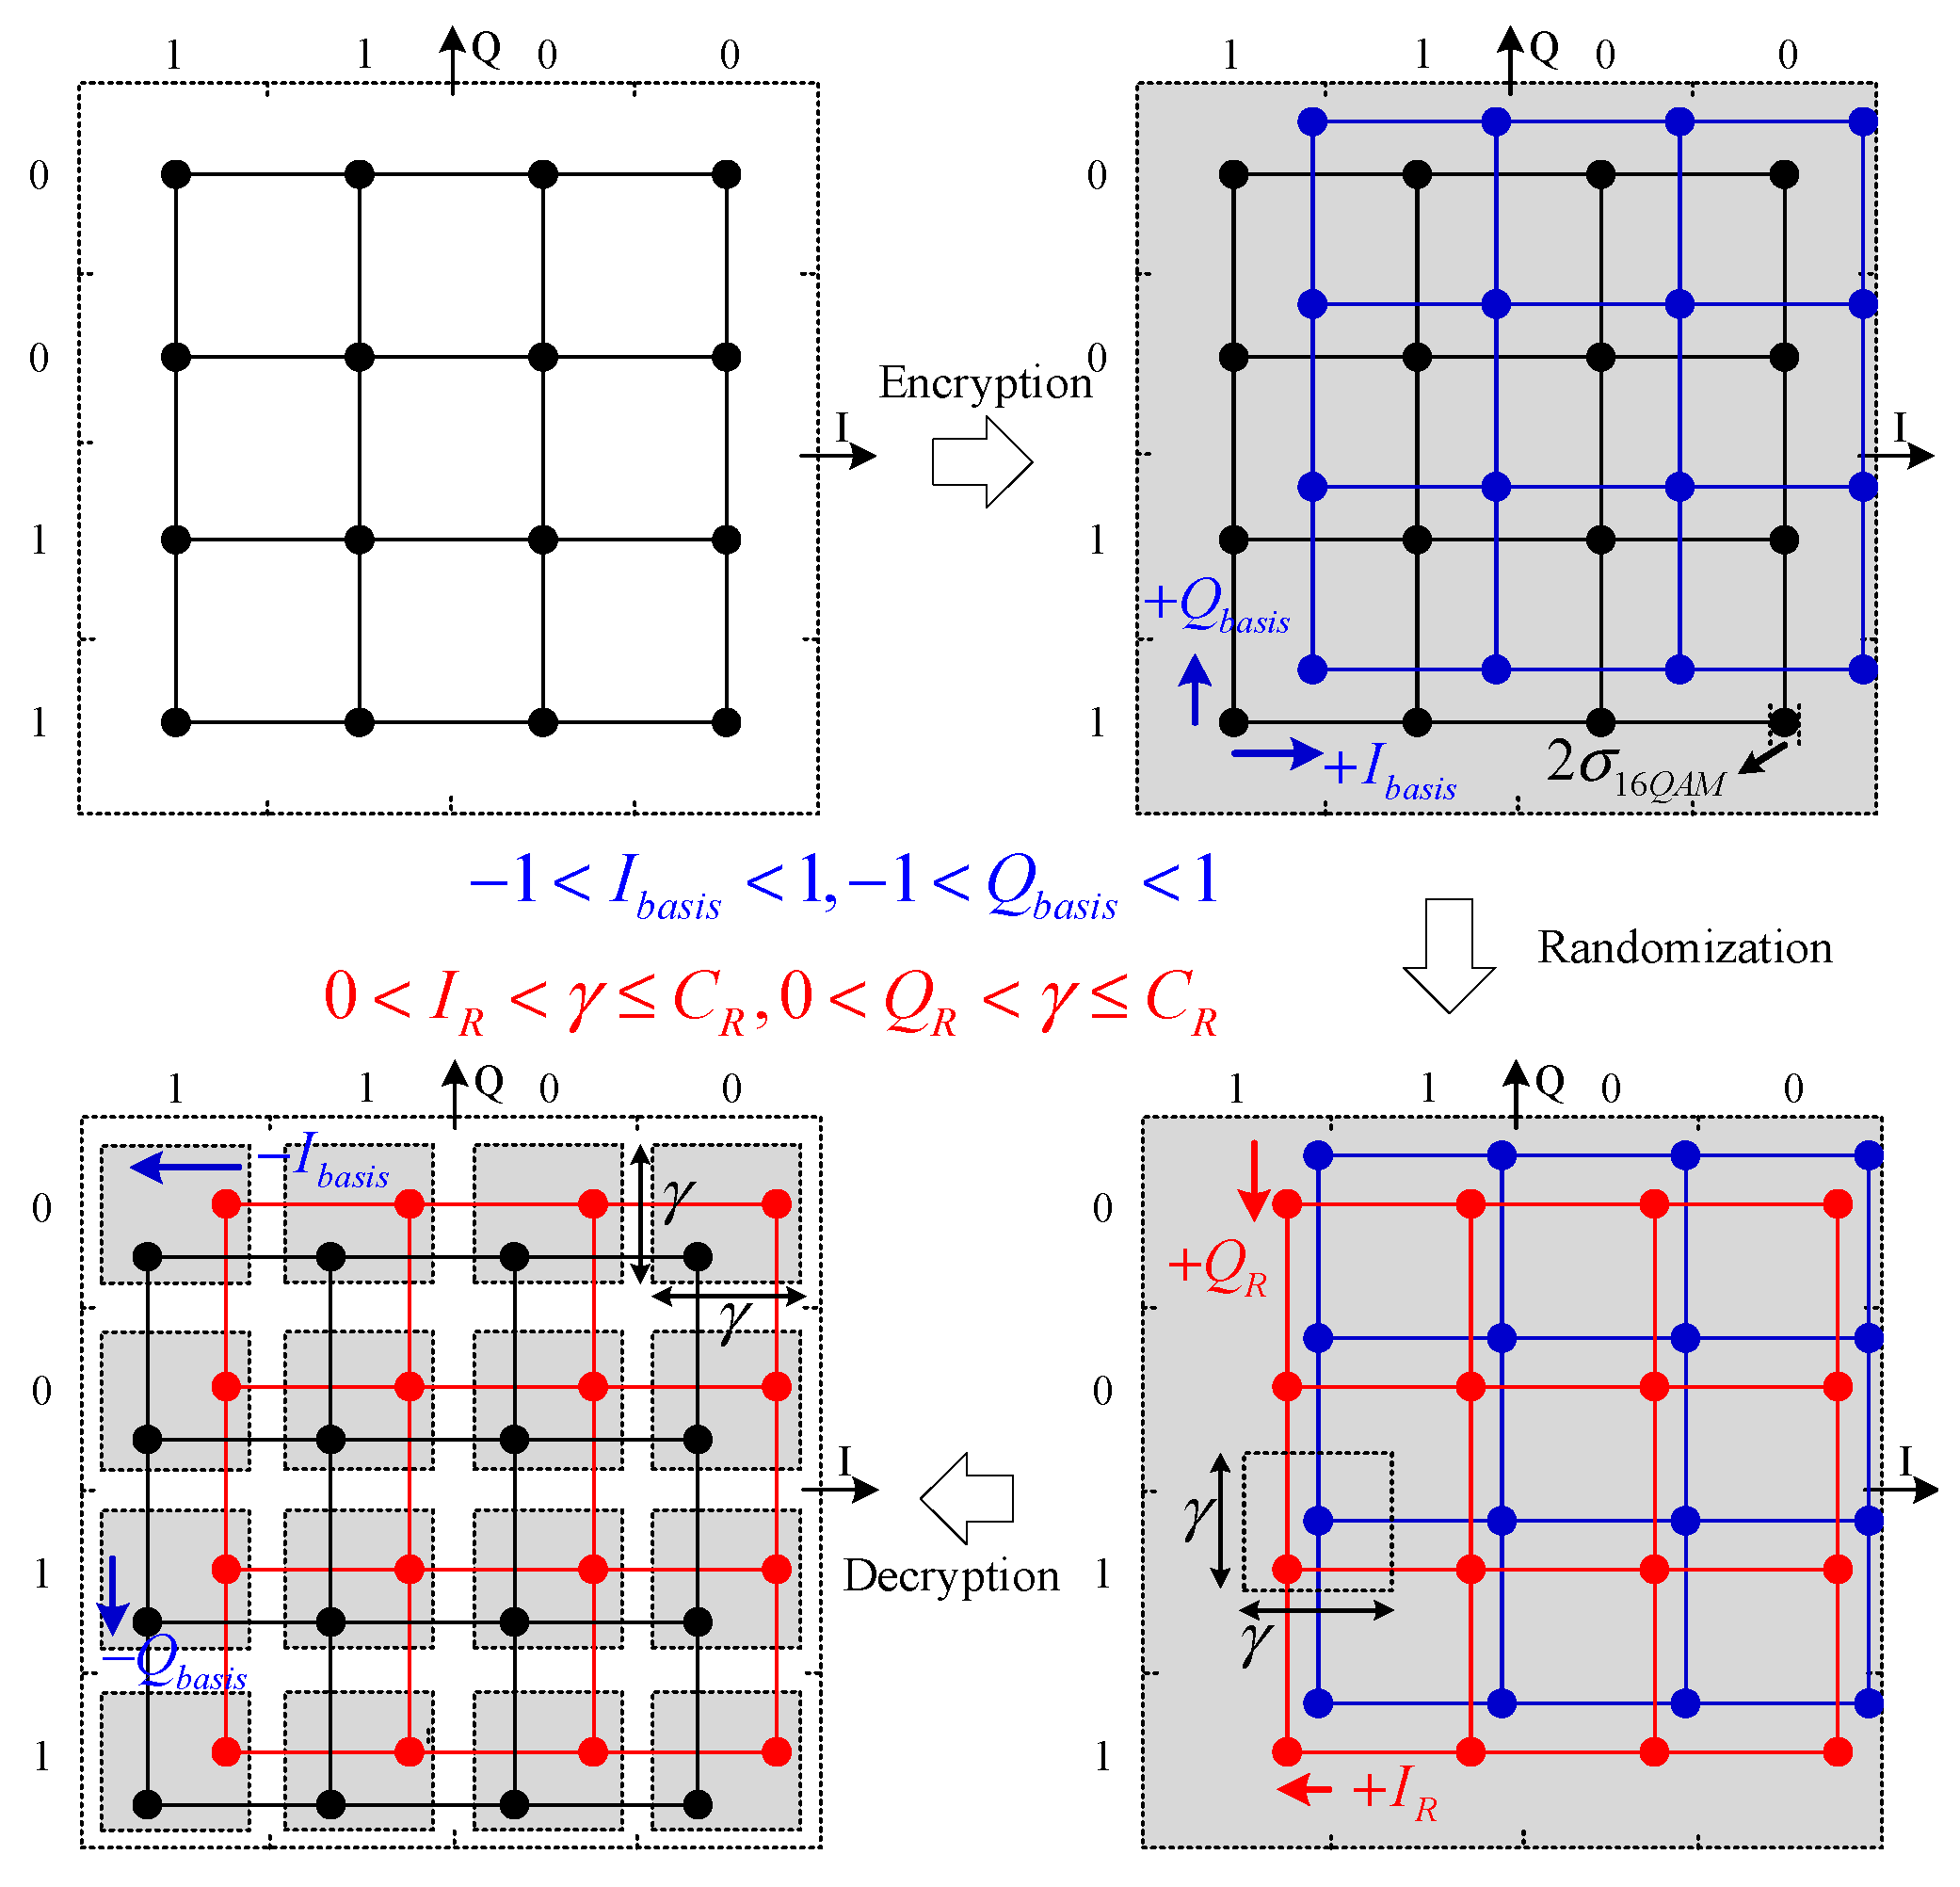
Figure 4 shows the principle of QPSK-based QNRC. Data are encrypted by translating the amplitude of QPSK with
Ibasis and
Qbasis in the I/Q channel, respectively. After encryption, the constellation becomes a high-order QAM signal. Subsequently, a truly random amplitude randomization of
IR and
QR is added to the signal in the I/Q channel. In the receiver, only
Ibasis and
Qbasis are subtracted with the pre-shared key.
In QPSK/QNRC, we define the average noise standard deviation
as Equation (15). The Γ for each channel of 2
M × 2
M QPSK/QNRC (I or Q) is given as Equation (16).
The calculation of the bit error ratio for
M-th bit position in 2
M × 2
M QPSK/QNRC symbol (I or Q) is as Equation (17) [
10].
Hence, in terms of Equation (10),
CR in 2
M × 2
M QPSK/QNRC is shown as follows:
3.3. CR in 16QAM/QNRC
Figure 5 shows the principle of 16QAM-based QNRC. The operation of encryption, decryption and randomization by translating the amplitude is similar to that of QPSK/QNRC. Yet, the encrypted data represents 16QAM instead of QPSK.
Similar to 2
M × 2
M QPSK/QNSC, the average noise standard deviation and Γ in 2
M × 2
M 16QAM/QNRC are as shown in Equations (19) and (20).
In 2
M × 2
M 16QAM/QNRC,
M-th and
M − 1-th bit in each symbol of the I/Q channel is used for data transmission. Their bit error ratios are shown in Equation (21) and Equation (22), respectively.
While
, as Equation (10),
CR in 2
M × 2
M 16QAM/QNRC is calculated as follows:
3.4. CR in IM/QNRC
Figure 6 shows the principle of IM-based QNRC. Data are encrypted by adjusting the intensity with
Pbasis. After encryption, the constellation becomes a high-order IM signal. Subsequently, a truly random intensity randomization of
PR is added to the signal. In the receiver, only the
Pbasis is subtracted with the pre-shared key.
The average noise standard deviation and Γ in 2
M IM/QNRC are as shown in Equations (24) and (25).
and
Pm is the intensity level of 2
M IM/QNRC (1 ≤
m ≤ 2
M). The calculation of the bit error ratio for the
M-th bit position in the 2
M IM/QNRC symbol is as Equation (26). Hence, as claimed by Equation (5),
CR in 2
M IM/QNRC is shown as Equation (27).
4. Experiment Setup and Results Analysis
Figure 7 shows the experiment setup of 2
M BPSK/QNRC, 2
M IM/QNRC, 2
M × 2
M QPSK/QNRC, and 2
M × 2
M 16QAM/QNRC. At the transmitter, the data are converted by an arbitrary waveform generator (AWG) to an electrical signal at the sampling rate of 10-GSa/s and a digital analog converter (DAC) of 12 bits. An external cavity laser (ECL) sends a beam at 1550 nm with 6 dBm power into an electro-optical converter. For BPSK/QNRC, QPSK/QNRC, and 16QAM/QNRC, the electro-optical conversion is achieved by an I/Q modulator. While an intensity modulator is used in the electro-optical conversion of IM/QNRC. After the variable optical attenuator (VOA), the signal is loaded onto the 160 km (80 km × 2) standard single-mode fiber (SSMF) with an attenuation of 0.2 dB/km.
At the receiver, the received OSNR is measured by an optical spectrum analyzer. The received optical signal is amplified into 0 dBm, and then transformed into an electrical signal by an optical-electro converter. For BPSK/QNRC, QPSK/QNRC, and 16QAM/QNRC, the optical-electro conversion is achieved by a coherent receiver which is combined with a local oscillator. While in IM/QNRC, a photoelectric detector is used for optical-electro conversion. The received electrical signals are captured by a digital oscilloscope.
Figure 8a shows the
CR in QNRC (
M = 8) with different data modulation for
OSNR from 1 dB to 25 dB. In our QNRC system with
M = 8, higher
OSNR values lead to higher
CR values. The soft-decision FEC (SD-FEC) with low-density parity-check codes we used has a threshold
Pth of 4 ×10
−2. Consequently, the maximum achievable
CR in our system is 0.242. This value can be further improved by using a more powerful SD-FEC algorithm. However, it will increase the computational complexity of the receiver. For BPSK, QPSK, 16QAM, IM (
r = 3) and IM (
r = 2) data modulations, the
CR exceeds 0 at
OSNR values of above 0, 6, 10, 14 and 17 dB, respectively. Moreover, the
CR reaches 0.242 at
OSNR values of above 7, 13, 17, 21 and 24 dB, respectively. These results suggest that BPSK modulation provides the best capacity performance for randomization compared to other data modulations in the QNRC system with
M = 8.
Figure 8b illustrates the
CR performance of 2
M × 2
M 16QAM/QNRC for various
OSNR values. For
M = 6, 7, 8, 9 and 10, the
CR exceeds 0 at
OSNR values of above 5, 8, 10, 12, and 12 dB, respectively. Additionally, the
CR reached 0.242 at
OSNR values of above 12, 14, 17, 19, and 20 dB for
M = 6, 7, 8, 9 and 10, respectively. Meanwhile,
CR increases as the increase in
OSNR and a higher
M leads to a lower
CR value. This result is due to the increased complexity of the QAM modulation scheme at higher values of
M, which makes the transmission more susceptible to noise and impairments.
Figure 9a presents the values of Γ for QNRC (
M = 8) when the system reaches
CR at different
OSNR levels. Despite the increase in
OSNR, the value of Γ remained relatively stable when the system achieved
CR. However, the choice of data modulation scheme has a significant impact on the value of Γ when the system reaches
CR. For instance, we found that Γ was 283.68, 54.76, 48.49, 134.34, and 142.34 for BPSK, IM (
r = 2), IM (
r = 3), 16QAM and QPSK while
, respectively. These findings demonstrate that BPSK has the highest value of Γ when the randomization reaches
CR. It is worth noting that the value of Γ provides a useful metric for evaluating the security of QNRC [
9].
Figure 9b shows the Γ and 1-
DFP for QPSK/QNRC (
M = 8) with or without randomization in different
OSNR. Detection failure probability (
DFP) refers to the probability that Eve (an eavesdropper) fails to detect the QNRC symbol that is masked by noise. This measure is often used to evaluate the security level of QNRC systems [
8,
9,
10,
11,
12,
13,
14,
15,
16,
17,
18]. The calculation method for the DFP of QPSK/QNRC is presented in Equation (28).
It can be observed that the noise masking number, Γ, for QPSK/QNRC decreases as
OSNR increases. This is due to the fact that high
OSNR diminishes the effectiveness of noise masking, thereby compromising the security of the system [
9,
20]. However, the introduction of randomization raises the value of Γ. When the level of randomization reaches the system’s tolerance
CR, for
OSNR is 15 dB, Γ increases from 4.56 to 48.60. Meanwhile, 1 −
DFP decreases from 3.19 × 10
−2 to 4.47 × 10
−4. The results indicate that the introduction of randomization increases the probability of Eve failing to detect the QNRC symbols, thereby enhancing the security of the QNRC system.


