Article

Supercontinuum Generation in Suspended Core Fibers Based on Intelligent Algorithms

Institute of Lightwave Technology, Key Lab of All Optical Network and Advanced Telecommunication Network, Ministry of Education, Beijing Jiaotong University, Beijing 100044, China
*
Author to whom correspondence should be addressed.
Photonics 2025, 12(5), 497; https://doi.org/10.3390/photonics12050497
Submission received: 8 April 2025 / Revised: 6 May 2025 / Accepted: 9 May 2025 / Published: 16 May 2025
(This article belongs to the Special Issue Optical Fiber Lasers and Laser Technology)

Abstract

:
This study presents a reverse-optimization framework for supercontinuum (SC) generation in Ge20Sb15Se65 suspended-core fibers (SCFs), integrating neural network modeling with the Nutcracker Optimization Algorithm to co-design optimal fiber structures and pump pulse parameters. A high-nonlinearity SCF structure (γ ≈ 6–7 W−1·m−1) was first designed, and a neural network model was developed to accurately predict effective modal refractive indices and mode-field areas (RMSE < 1%). The generalized nonlinear Schrödinger equation was then used to study spectral broadening influenced by structural and pulse parameters. Global optimization was performed in four-dimensional structural and seven-dimensional combined parameter spaces, significantly enhancing computational efficiency. Simulation results demonstrated that the optimized design achieved a broad and flat SC spectrum extending from 0.7 µm to 25 µm (at –20 dB intensity), with lower peak power requirements compared to previous studies achieving similar coverage. The robustness and manufacturing tolerances of the optimized fiber structure were also analyzed, verifying the reliability of the design. This intelligent reverse-design strategy provides practical guidance and theoretical foundations for mid-infrared SC fiber design.

1. Introduction

The study of supercontinuum (SC) generation began in 1970, when Alfano and Shapiro first created a white light source that covered the 400–700 nm spectral range using borosilicate glass and introduced the concept of “white light continuum” [1]. In 1977, Chinlon Lin and R. H. Stolen observed SC generation in optical fibers for the first time [2]. Since then, significant progress has been made in understanding the mechanisms of SC generation, with the introduction of optical solitons and their self-frequency shift phenomena, laying the theoretical foundation for SC generation. Initially, silica fibers were the primary focus of research. However, due to their limited nonlinearity and dispersion properties, SC generation in silica fibers has a constrained spectral bandwidth, making it difficult to achieve high-power, broad-range SC. For example, in 1998, Takushima and Yuichi generated only 140 nm of SC in normal dispersion silica fibers using a mode-locked semiconductor laser source [3].
To overcome the limitations of silica fibers, research has shifted toward soft glass fibers such as fluoride [4], chalcogenide [5], and tellurite fibers [6]. Fluoride fibers, with their low-loss characteristics, can produce high spectral power output. In 2019, Yang Linyong, Li Ying, and colleagues used fluoride fibers to create a mid-infrared SC source spanning 1.9–3.35 μm with an average power of 30.0 W [7]. Chalcogenide fibers, known for their high nonlinearity, have become a major focus in SC research. In 2018, Karim and Mohammad Rezaul successfully generated a mid-infrared SC from 2 to 15 μm using As2Se3 chalcogenide fibers [8]. In 2019, Medjouri, Abdelkader, and their team used Ga8Sb32S60 chalcogenide fibers to generate an SC covering 1.65–9.24 μm [9]. However, tellurite fibers, which have high -OH content, exhibit significant loss around 3.3 μm, limiting their application range [10].
The suspended-core fiber structure, combined with chalcogenide materials, further enhances SC performance due to its unique design. In 2020, A. S. M. Tanvir Ul Islam and Redwan Ahmad, among others, achieved SC output from 1 to 14 μm using chloroform-doped AsSe2 suspended-core fibers [11]. In 2022, Jiao Kai, Wang Xiange, and colleagues employed suspended-core fibers made from Ge20Sb15Se65 and As2S3 materials, observing a broad SC spanning 1.6–12 μm [12].
The generation of supercontinuum (SC) depends on the optical properties of fibers, particularly higher-order dispersion and nonlinear coefficients. Traditional methods for calculating fiber performance rely on analytical and numerical simulations. While accurate, these methods are time-consuming and inefficient, making it challenging to meet the increasing complexity of fiber design. Recently, neural networks have demonstrated strong potential for predicting fiber structure performance thanks to their excellent nonlinear fitting capabilities. In 2019, Sunny Chugh, Aamir Gulistan, and others proposed a machine learning method using neural networks to predict key properties of photonic crystal fibers (PCFs), such as refractive index, mode area, and dispersion. This approach completes calculations in milliseconds, significantly improving efficiency compared to traditional methods [13]. In 2024, Xiao Fangxin, Huang Wei, and colleagues successfully applied neural networks to predict photonic crystal fiber optical properties [14].
To generate supercontinuum spectra with flatness, broad wavelength coverage, and customizable spectral ranges, this study optimizes the design of a novel suspended-core fiber using intelligent algorithms. The non-toxic Ge20Sb15Se65 material is selected to balance high nonlinearity with environmental friendliness. By integrating neural networks with optimization algorithms, an intelligent approach is used to reverse-engineer the fiber structure parameters and initial pulse conditions to achieve custom wavelength coverage. In this study, we propose an intelligent reverse-design framework that integrates a neural network model with the Nutcracker Optimization Algorithm to co-optimize fiber structural parameters and pump pulse conditions. The fiber model is based on Ge20Sb15Se65 chalcogenide glass and features a suspended-core structure to enhance nonlinearity. The neural network is trained to predict effective modal characteristics, while the optimization algorithm explores the high-dimensional parameter space for tailored spectral performance.
In this work, the generalized nonlinear Schrödinger equation (GNLSE) is numerically solved using the fourth-order Runge–Kutta (RK4) method to simulate the evolution of the supercontinuum spectrum in the designed suspended-core fiber. Our simulation results demonstrate that the designed fiber can generate a broadband supercontinuum spanning from 0.7 μm to 25 μm under relatively low peak power. The proposed optimization method significantly reduces computational overhead, and tolerance analysis confirms the robustness of the optimized structure. These findings provide valuable insights for efficient and customizable mid-infrared supercontinuum source design.

2. Basic Principles

2.1. Design of Ge20Sb15Se65 Suspended-Core Fiber

The suspended-core fiber structure is shown in Figure 1. The core and its connecting region are composed of the highly nonlinear Ge-Sb-Se chalcogenide material Ge20Sb15Se65, which features an infrared transmission range up to 25 µm [15]. The remaining regions are filled with air. The outer fiber diameter is labeled as D, the core diameter as d, the cantilever width as hq, and the chamfer at the core as Λ.

2.2. Analysis of the Theoretical Foundations of Supercontinuum Generation

The dispersion of the Ge20Sb15Se15 material varies with wavelength, and its refractive index is calculated using the Sellmeier equation.
n ( λ ) = A 0 + B 1 λ 2 λ 2 C 1 + B 2 λ 2 λ 2 C 2 + B 3 λ 2 λ 2 C 3
The parameters used in the Sellmeier equation are as follows: A0 = 3.8667, B1 = 0.1366, B2 = 2.2727, B3 = 0.0138, C1 = 0.0420 µm2, C2 = 0.01898 µm2, and C3 = 68.8303 µm2 [16,17].
As shown in Equation (2), D(λ) is the material dispersion parameter, λ is the wavelength of light, c is the speed of light, n(λ) is the refractive index of the material that depends on wavelength, and d 2 n ( λ ) / d λ 2 is the second-order derivative of the refractive index, representing the rate of change in refractive index with respect to wavelength.
D ( λ ) = λ c d 2 n ( λ ) d λ 2
As shown in Equation (3), group velocity dispersion (GVD) refers to the temporal broadening of an ultrashort pulse during propagation in the fiber caused by different frequency components traveling at different group velocities. The group velocity is determined by the first-order derivative of the propagation constant β with respect to angular frequency ω, while the group velocity dispersion is characterized by the second-order derivative β2.
β ω = β 0 + β 1 ( ω ω 0 ) + 1 2 β 2 ( ω ω 0 ) 2
β 2 = λ c d 2 n eff d λ 2
The dispersion coefficients of various orders are calculated using Equation (5).
β m = d m β d ω m ω = ω 0 ( m = 1 , 2 , )
β 2 and D ( λ ) can be related through the following equation.
D ( λ ) = 2 π c λ 2 β 2
In the process of supercontinuum generation, the selected fiber length is relatively short, so the effect of fiber loss on SC generation is minimal and can almost be neglected. However, the influence of higher-order dispersion, especially from β3 to β9, cannot be ignored. Although lower-order dispersion, such as β2, typically dominates the initial formation of the SC, higher-order dispersion plays a crucial role in shaping the spectral details and extending the coverage range. Higher-order dispersion causes more complex phase distortions during pulse propagation, significantly affecting the shape and bandwidth of the SC.
The nonlinear coefficient of the fiber is calculated using (7)
γ = 2 π n 2 λ A eff
Here, n2 represents the nonlinear refractive index of the material. For Ge20Sb15Se65, n2 = 6.8 × 10⁻18 m2/W [17]. Aeff denotes the effective mode area of the fiber, which is calculated using (8)
A eff ( λ ) = E 2 d x d y 2 E 4 d x d y
The pulse propagation in the fiber is simulated using the generalized nonlinear Schrödinger equation (GNLSE), as shown in Equation (8).
A z + a 2 A i k 2 i k + 1 β k k ! k A t k = i γ 1 + i w 0 t × A ( z , t ) R ( t ) | A ( z , t t ) | 2 d t ]
A represents the Fourier transform of the pulse amplitude, z denotes the fiber length, α accounts for the confinement loss, βₖ refers to the dispersion coefficient of the κ-th order, and R(t′) is the nonlinear response function.
R ( t ) = ( 1 f R ) δ ( t t e ) + f R h R ( t )
h R ( t ) = τ 1 2 + τ 2 2 τ 1 2 τ 2 2 exp t τ 2 sin t τ 1
In the equation, τ 1 = 23.1 fs, τ 2 = 195 fs, and f R = 0.1 [18].
The initial pulse is a hyperbolic secant pulse, as expressed in (11)
W = P sec h T T 0 exp i C T 2 2 T 0 2
In the equation, P represents the peak power, C denotes the chirp parameter, T 0   is the initial input pulse width, and FWHM is the full width at half maximum of the pulse. There is a specific relationship between T0 and FWHM: T0 = FWHM/1.763.
The flatness of the SC spectrum is characterized by the coefficient of variation (CV) of the spectral data, and it is calculated as shown in (12).
C V = σ μ
Here, σ represents the standard deviation of the spectral intensity values within the effective wavelength range, and μ denotes the mean spectral intensity in the same range. The CV is a dimensionless quantity, typically expressed as a percentage by multiplying by 100. A smaller CV indicates lower fluctuation in spectral intensity and thus higher flatness, whereas a larger CV suggests greater intensity variation and poorer flatness.
The GNLSE was numerically solved using the classical fourth-order Runge–Kutta method. This method constructs a linear operator based on the dispersion coefficients β and a nonlinear operator based on the nonlinear coefficient γ and the Raman response, enabling accurate modeling of pulse propagation in nonlinear dispersive media. It offers high computational precision with relatively low complexity, which helps reduce the computational cost of large-scale iterative simulations while maintaining accuracy. In the simulation, a −20 dB intensity threshold was used to define the spectral broadening range.

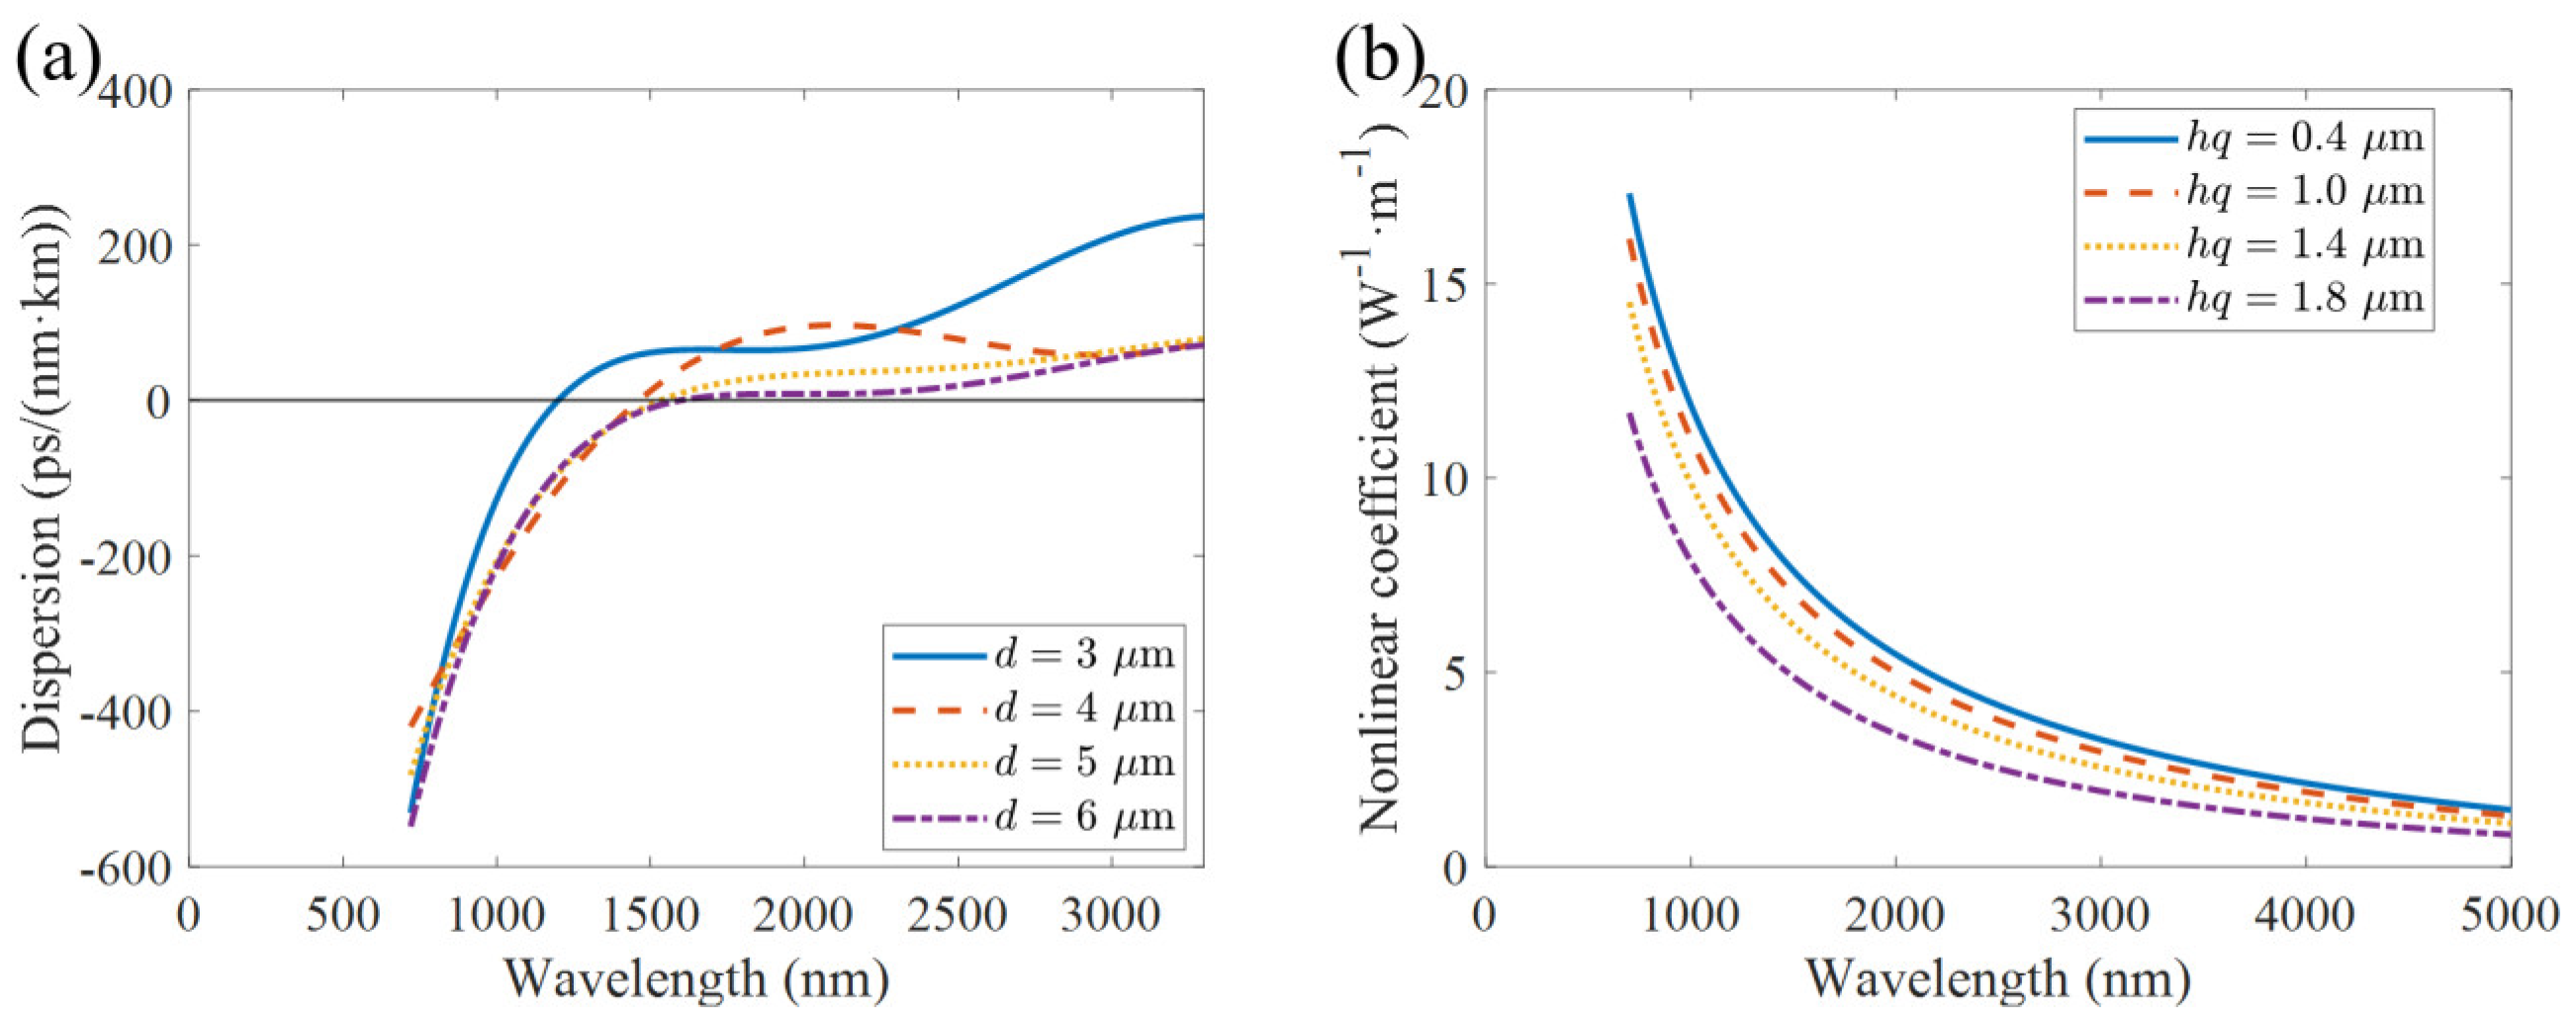
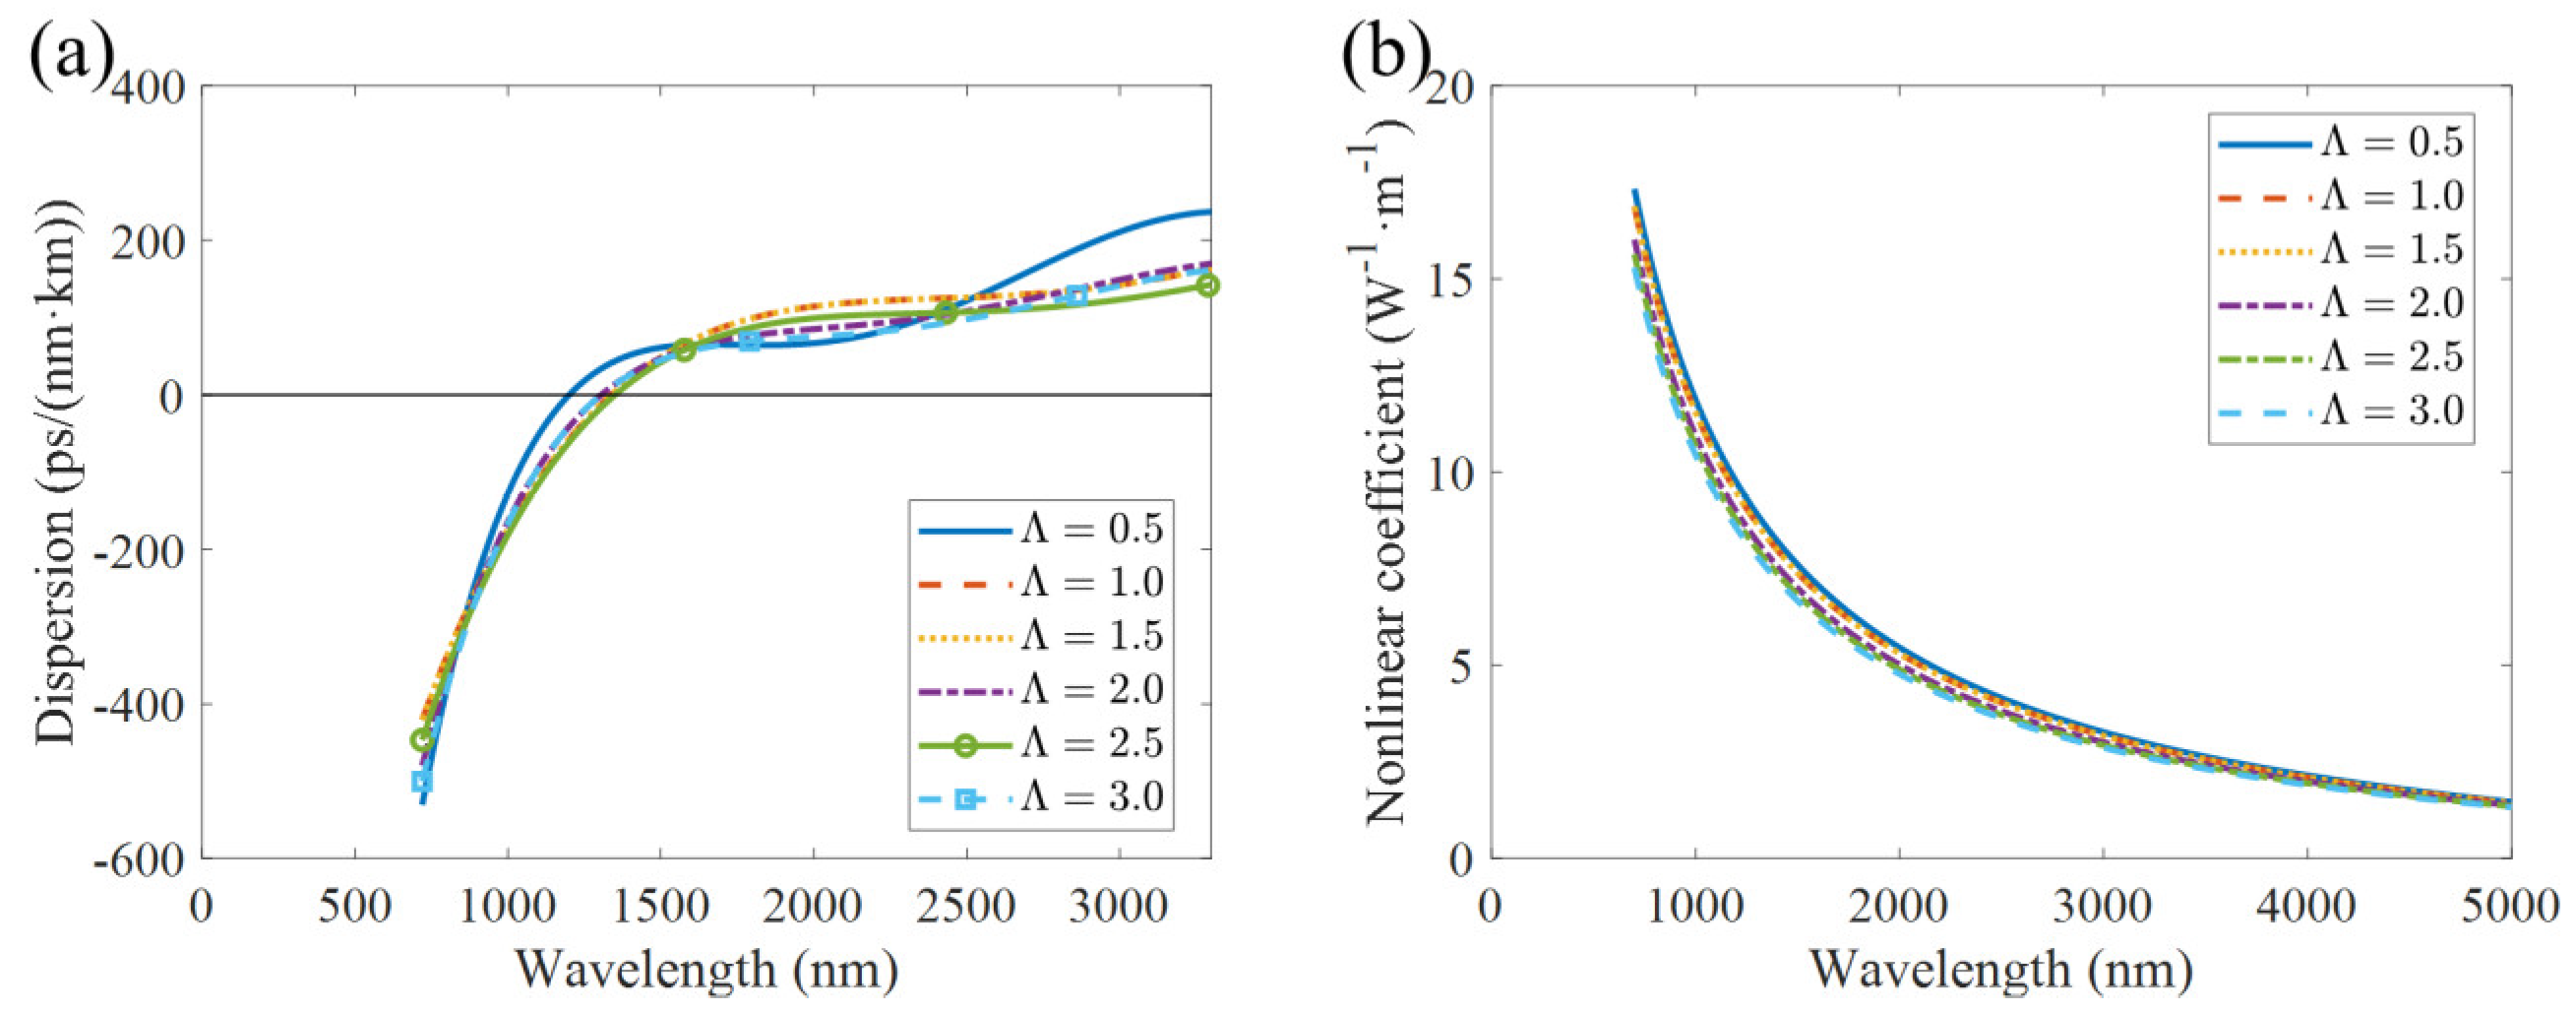
2.3. Effect of Fiber Structural Parameters on Dispersion and Nonlinearity

Based on the established fiber model, we investigated the effect of varying a single structural parameter on the dispersion and nonlinear coefficient. As shown in Figure 2, the suspended width hq was fixed at 0.4 µm and the core chamfer Λ was set to 0.5 µm, while the core diameter d was varied among 3 µm, 4 µm, 5 µm, and 6 µm.
It can be observed that as the core diameter d increases, the overall dispersion curve becomes flatter, and the zero-dispersion wavelength (ZDW) shifts toward longer wavelengths. A larger core diameter helps reduce the magnitude of dispersion. Specifically, the ZDW is 1.2 μm for d = 3 μm, 1.463 μm for d = 4 μm, 1.534 μm for d = 5 μm, and 1.601 μm for d = 6 μm.
As shown in Figure 3b, the nonlinear coefficient γ decreases gradually with increasing wavelength. At any given wavelength, a smaller core diameter corresponds to a higher γ value, indicating that a smaller d enhances mode confinement and reduces the effective mode area, thereby significantly increasing the fiber’s nonlinearity. This suggests that reducing d is beneficial for applications such as supercontinuum generation, where strong nonlinear interaction is desired.
As shown in Figure 3, the core diameter d is set to 3 µm and the core chamfer Λ is fixed at 0.5 µm, while the suspended width hq is varied as 0.4 µm, 1.0 µm, 1.4 µm, and 1.8 µm.
As shown in Figure 3a, the influence of different hq values on the dispersion characteristics exhibits a nonlinear trend, but the variation in zero-dispersion wavelengths (ZDWs) is relatively small. Specifically, the ZDW is 1.2 μm for hq = 0.4 μm, 1.308 μm for hq = 1.0 μm, 1.441 μm for hq = 1.4 μm, and 1.332 μm for hq = 1.8 μm.
Figure 3b shows that the nonlinear coefficient γ generally decreases with increasing wavelength. At shorter wavelengths, the curves corresponding to different hq values differ significantly. The highest nonlinearity is observed for hq = 0.4 μm, while the lowest is for hq = 1.8 μm. As the wavelength increases, the differences between the curves gradually diminish. This behavior is related to mode confinement: a smaller hq enhances optical confinement, reducing the effective mode area and thereby increasing the nonlinear coefficient. Conversely, a larger hq results in looser confinement, leading to weaker nonlinear effects.
As shown in Figure 4, the core diameter d is set to 3 µm and the suspended width hq is fixed at 0.4 µm, while the core chamfer Λ is varied as 0.5 µm, 1.0 µm, 1.5 µm, 2.0 µm, 2.5 µm, and 3 µm.
As shown in Figure 4a, the zero-dispersion wavelengths (ZDWs) are concentrated around 1.2–1.3 µm. Specifically, the ZDW is 1.2 µm for Λ = 0.5 µm, 1.3376 µm for Λ = 1.0 µm, 1.3048 µm for Λ = 1.5 µm, 1.3048 µm for Λ = 2.0 µm, 1.3038 µm for Λ = 2.5 µm, and 1.3048 µm for Λ = 3.0 µm.
The nonlinear coefficient γ shows a decreasing trend across the entire wavelength range, which is attributed to the expansion of the mode field leading to a larger effective mode area and thus a weaker nonlinear effect. At the same wavelength, smaller Λ values correspond to higher γ, indicating that more compact periodic structures enhance nonlinear interactions. The γ curves for different Λ values are relatively close to each other and do not show significant crossings, suggesting that the influence of Λ on γ is relatively stable. Unlike d and hq, which cause more pronounced changes, Λ can be used to fine-tune the balance between nonlinearity and structural compactness during fiber design.
In summary, considering the simulated dispersion and nonlinear characteristics of the designed fiber structures, the pump wavelength of 1550 nm was selected. This wavelength lies near or slightly above the zero-dispersion wavelengths of most fiber configurations analyzed, enabling effective excitation of nonlinear mechanisms such as soliton fission and self-phase modulation. Moreover, the nonlinear coefficient γ remains sufficiently high at this wavelength, ensuring efficient spectral broadening. The choice of 1550 nm also leverages mature commercial laser sources and facilitates practical implementation.

3. Neural Networks and Optimization Algorithms

Latin hypercube sampling (LHS) was employed to generate 3000 representative combinations of fiber structural parameters, including core diameter (d), cantilever width (hq), and core chamfer (Λ). For each of these structures, the effective refractive index (neff) and effective mode area (Aeff) were calculated using a numerical simulation based on the finite element method (FEM). The wavelength λ was also included as a variable input during the computation. The resulting dataset, consisting of structural parameters and their corresponding optical properties, was then used to train a feedforward neural network. This neural network model takes four inputs—λ, d, hq, and Λ—and produces two outputs—neff and Aeff. The network architecture includes three hidden layers, each with 64 neurons, and is illustrated in Figure 5.
Figure 6 shows the prediction performance of the neural network on the validation set. It can be seen that the proposed neural network model provides predictions for neff and Aeff that are very close to the results obtained by numerical methods.
The neural network described above improves the computational efficiency of generating supercontinuum spectra for individual fiber structures. It enables the prediction of supercontinuum spectra based on fiber structure parameters (core diameter d, cantilever width hq, and core chamfer Λ). Using the neural network model, it is possible to quickly predict the corresponding neff and Aeff for different fiber structures, and subsequently calculate the higher-order dispersion coefficients (β2 to β9) and the nonlinear coefficient γ. These parameters are then applied to the generalized nonlinear Schrödinger equation to solve for the supercontinuum spectrum.

3.1. Optimization Algorithms

NOA is a nature-inspired optimization algorithm [19] that mimics the process of searching, storing, retrieving, and revisiting prey locations. It combines global search capabilities with local optimization, making it highly effective for solving complex, multidimensional nonlinear problems and finding optimal solutions. By applying NOA to multi-objective optimization of spectral broadening range and flatness, a well-balanced solution is achieved. Compared to traditional methods, NOA improves both computational efficiency and optimization accuracy, while considering practical constraints more comprehensively. This makes it an efficient and precise tool for fiber design and pulse modulation.
The neural network-based program for predicting fiber parameters and generating supercontinuum spectra, as described in Chapter 2, is incorporated into the optimization algorithm. This algorithm utilizes seven parameters: cantilever width (hq), core diameter (d), core chamfer (Λ), fiber length (flength), initial pulse peak power (P), initial pulse width (FWHM), and chirp (C). The upper and lower bounds for these parameters are defined, as summarized in Table 1.
An optimization index fitness is defined to achieve a supercontinuum (SC) with high flatness within a specified wavelength range.
f i t n e s s = C V + abs m m i n L + abs n m a x L ) 100
m refers to the target starting wavelength where the intensity exceeds −20 dB, minL is the beginning of the spectral coverage range, n represents the target ending wavelength, and maxL is the endpoint of the spectral range.
The optimization index (fitness) is defined in (14), where a lower fitness value indicates better spectral flatness and better alignment with the target spectral coverage. In this study, we adopt a fixed number of iterations (500) as the stopping condition for the optimization algorithm.

3.2. Comparison of Different Optimization Algorithms

The NOA optimization algorithm employed in this study was compared with the Genetic Algorithm (GA) [20] and Particle Swarm Optimization (PSO) [21]. For all three algorithms, the population size and the number of iterations were set to 50 and 500, respectively. As shown in Figure 7, under tasks 1 through 5 (with target spectral broadening wavelengths of 6 µm, 10 µm, 15 µm, 20 µm, and 25 µm, respectively), the NOA algorithm demonstrated superior global search capability. Furthermore, NOA achieved the lowest computational time cost, with average execution times reduced by 46.68% and 23.27% compared to GA and PSO, respectively.

4. Analysis and Discussion

4.1. Performance Analysis of Optimized Fiber Structure

Figure 8 presents the supercontinuum spectra for the input parameters obtained through the optimization algorithm, with a population size of 50 and 500 iterations, targeting spectral broadening ranges of 6 µm, 10 µm, 15 µm, 20 µm, and 25 µm.
Table 2 presents the parameter values obtained from the optimization algorithm. The results indicate that for target spectral broadening of 6 µm and 10 µm, the chirp is positive. A larger core diameter and smaller chamfer enhance the mode confinement, reducing light field leakage. Under these conditions, the power requirement is relatively low, the pulse width is smaller, and the spectral variation coefficient (CV) is higher than 60%, with the flatness still needing improvement.
When the target spectral broadening is increased to 15 µm, the chirp weakens to C = 1.4. The fiber diameter increases to 5.85 µm, the chamfer grows to 1.7 µm, and the initial pulse peak power increases to 861 W with a pulse width of 0.06 ps. The enhanced nonlinear effects further promote spectral broadening. The spectral variation coefficient is CV = 55.85%, and the spectral flatness improves.
For a target spectral broadening of 20 µm, the chirp approaches zero, and the fiber diameter is further reduced. The chamfer increases to 2.9 µm, the power requirement is 873 W, and the pulse width narrows to 0.035 ps. At this point, the variation coefficient is CV = 52.52%.
When the target spectral broadening is 25 µm, the chirp becomes negative, and nonlinear effects driven by high power become the primary mechanism for spectral broadening. The fiber diameter is 3.34 µm, the chamfer is 1.57 µm, and the pulse width is 0.06 ps. The nonlinear effects introduce more frequency components, significantly extending the spectral range. At this point, the spectral flatness reaches its optimal value.

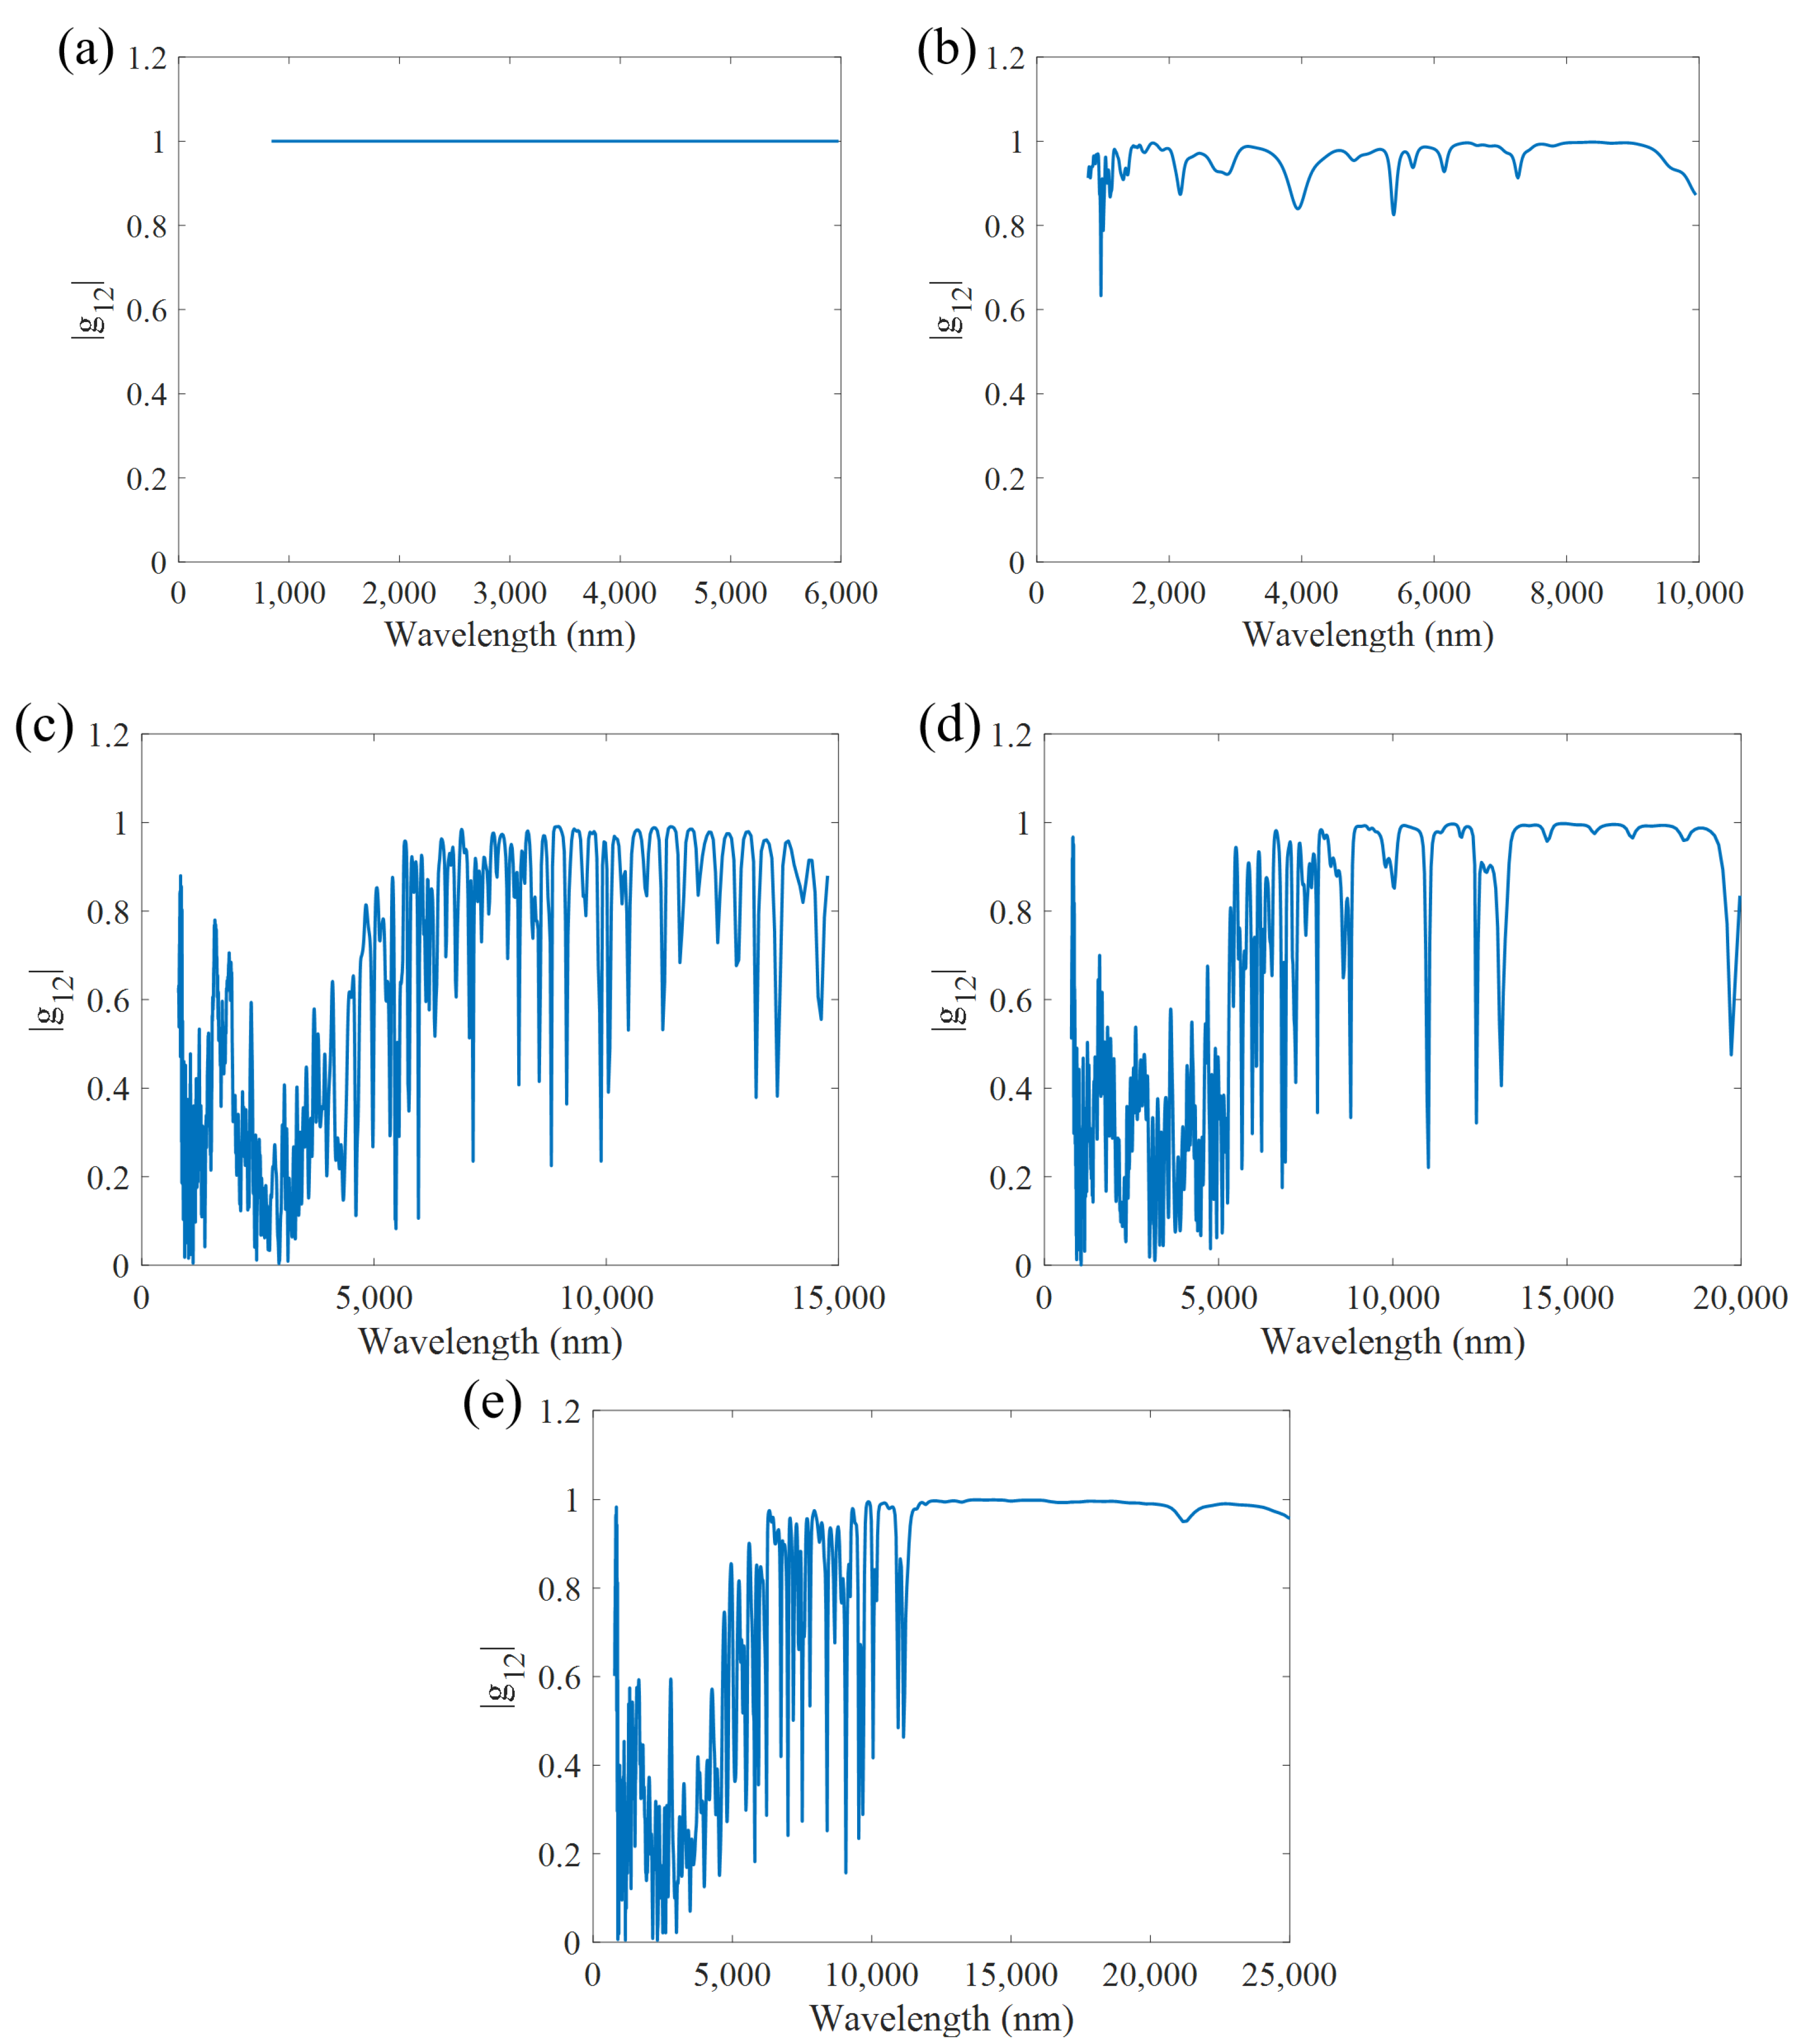
4.2. Analysis of Supercontinuum Coherence

Coherence analysis is conducted based on the optimization results by introducing random Gaussian noise into the pump pulse and incorporating it into the generalized nonlinear Schrödinger equation for supercontinuum (SC) computation. The calculation is performed using Equation (15).
g 12 w = < A 1 * L , w A 2 L , w > [ < | A 1 L , w | 2 > < | A 2 L , w | 2 > ] 1 2
A1 and A2 represent the Fourier transforms of two adjacent pulses, angular brackets denote averaging over all pulses, and * indicates conjugation.
The coherence of the spectra with broadening ranges of 6 µm, 10 µm, 15 µm, 25 µm, and 29 µm, obtained through the optimization algorithm, is shown in Figure 9.

4.3. Fiber Fabrication Tolerance Analysis

During the fiber fabrication process, certain errors may occur due to technological limitations. Therefore, a tolerance analysis was conducted on the optimal structural parameters of the fiber. The error range was set to ±10%, and parameters d, hq, and Λ were randomly varied within this range. Subsequently, the resulting changes in the supercontinuum (SC) spectrum were observed. As shown in Figure 10, the solid circular line represents the SC spectrum generated based on the original optimized parameters, while the star-marked line represents the SC spectrum generated after introducing the errors.
For spectral broadening ranges of 6 µm, 10 µm, 15 µm, 20 µm, and 25 µm, the corresponding correlation coefficients are 0.98823, 0.89074, 0.86932, 0.72211, and 0.6951, respectively. The results indicate that the consistency between the two methods decreases when the broadening range exceeds 15 µm. This is attributed to the increasing influence of nonlinear effects and higher-order dispersion as the broadening range expands, along with the amplified impact of random noise on the spectral shape. Nevertheless, the Pearson correlation coefficient remains above 0.69, demonstrating that the optimized parameter design maintains relatively high consistency across larger broadening ranges. This suggests that the optimized structure exhibits strong tolerance to parameter variations.
These design results demonstrate the effectiveness of the proposed intelligent optimization method. By leveraging neural network modeling and global optimization algorithms, we successfully identified suspended-core fiber structures that provide a broad and flat supercontinuum under low pump power. The consistency between simulation results and predicted parameters also validates the reliability of the model. These findings can serve as a theoretical reference for future fabrication of chalcogenide SCFs and mid-infrared SC applications in spectroscopy and sensing.

5. Conclusions

This paper presents a novel design approach that combines neural networks with optimization algorithms to enhance the supercontinuum characteristics of suspended-core fibers, resulting in optimal fiber structure and initial pulse parameters. The primary focus of this study is to use neural networks to improve computational efficiency, followed by the optimization of fiber structural parameters (such as core diameter and cantilever width) and initial pulse properties (such as pulse width and power) using NOA.
The results show that this method achieves supercontinuum generation with spectral coverage from 0.7 µm to 25 µm at a −20 dB intensity threshold, while maintaining excellent flatness and coherence. Additionally, a fiber structure tolerance analysis was performed, underscoring the potential of this approach to enhance both fiber design efficiency and performance.

Author Contributions

Conceptualization, M.J. and T.N.; methodology, M.J. and T.N.; software, M.J.; validation, M.J. and T.N.; formal analysis, M.J.; investigation, M.J.; resources, T.N.; data curation, M.J.; writing—original draft preparation, M.J.; writing—review and editing, T.N.; visualization, M.J.; supervision, T.N.; project administration, T.N. All authors have read and agreed to the published version of the manuscript.

Funding

This research received no external funding.

Institutional Review Board Statement

Not applicable.

Informed Consent Statement

Not applicable.

Data Availability Statement

The original contributions presented in this study are included in the article. Further inquiries can be directed to the corresponding author.

Conflicts of Interest

The authors declare no conflicts of interest.

References

  1. Alfano, R.R.; Shapiro, S.L. Emission in the region 4000 to 7000 Å via four-photon coupling in glass. Phys. Rev. Lett. 1970, 24, 584–587. [Google Scholar] [CrossRef]
  2. Lin, C.; Stolen, R.H.; Jain, R.K. Group velocity matching in optical fibers. Opt. Lett. 1977, 1, 205–207. [Google Scholar] [CrossRef] [PubMed]
  3. Takushima, Y.; Futami, F.; Kikuchi, K. Generation of over 140-nm-wide super-continuum from a normal dispersion fiber by using a mode-locked semiconductor laser source. IEEE Photon. Technol. Lett. 1998, 10, 1560–1562. [Google Scholar] [CrossRef]
  4. Bartula, R.J.; Hagen, C.L.; Walewski, J.W.; Sanders, S.T. Generation of pulsed ultra-violet and mid-infrared supercontinua in standard single-mode fiber. In Laser Applications to Chemical, Security and Environmental Analysis; Optica Publishing Group: Incline Village, NV, USA, 2006; p. ThB2. [Google Scholar]
  5. Wang, Y.Y.; Zhang, N.; Zhang, P.Q. Broadband and coherent supercontinuum generation in all-normal-dispersion double-clad Ge-As-Se-Te fiber taper. Chin. J. Lasers 2022, 49, 0101010. [Google Scholar]
  6. Jia, Z.; Yao, C.; Li, Z.; Jia, S.; Zhao, Z.; Wei, Q.; Qin, G. High power mid-infrared supercontinuum light sources based on fluorotellurite glass fibers. Infrared Laser Eng. 2018, 47, 0803004. [Google Scholar]
  7. Yang, L.; Li, Y.; Zhang, B.; Wu, T.; Zhao, Y.; Hou, J. 30-W supercontinuum generation based on ZBLAN fiber in an all-fiber configuration. Photon. Res. 2019, 7, 1061–1065. [Google Scholar] [CrossRef]
  8. Karim, M.; Ahmad, H.; Ghosh, S.; Rahman, B. Mid-infrared supercontinuum generation using As2Se3 photonic crystal fiber and the impact of higher-order dispersion parameters on its supercontinuum bandwidth. Opt. Fiber Technol. 2018, 45, 255–266. [Google Scholar] [CrossRef]
  9. Medjouri, A.; Abed, D.; Becer, Z. Numerical investigation of a broadband coherent supercontinuum generation in Ga8Sb32S60 chalcogenide photonic crystal fiber with all-normal dispersion. Opto-Electron. Rev. 2019, 27, 1–9. [Google Scholar] [CrossRef]
  10. Madeikis, K.; Dansette, P.-M.; Bartulevičius, T.; Veselis, L.; Jutas, R.; Eremchev, M.; Danilevičius, R.; Girdauskas, V.; Michailovas, A. Investigation of materials for supercontinuum generation for subsequent nonlinear parametrical and Raman amplification at 1 MHz repetition rate. Opt. Laser Technol. 2021, 143, 107373. [Google Scholar] [CrossRef]
  11. Islam, A.M.T.U.; Ahmad, R.; Hossen, I.; Kabir, M.R.; Bishwas, M.S.; Faruque, O. Wideband mid-infrared supercontinuum generation in chloroform filled suspended core fiber. In Proceedings of the 2020 2nd International Conference on Sustainable Technologies for Industry 4.0 (STI), Dhaka, Bangladesh, 19–20 December 2020; pp. 1–4. [Google Scholar]
  12. Jiao, K.; Wang, X.G.; Liang, X.; Bai, S.; Zhao, Z.; Wang, X.; Zhang, P.; Dai, S.; Nie, Q.; Wang, R. Single-mode suspended large-core chalcohalide fiber with a low zero-dispersion wavelength for Supercontinuum generation. Opt. Express 2021, 30, 641–649. [Google Scholar] [CrossRef] [PubMed]
  13. Chugh, S.; Gulistan, A.; Ghosh, S.; Rahman, B.M.A. Machine learning approach for computing optical properties of a photonic crystal fiber. Opt. Express 2019, 27, 36414–36425. [Google Scholar] [CrossRef] [PubMed]
  14. Xiao, F.; Huang, W.; Yu, H.; Song, B. Predicting optical properties of different photonic crystal fibers from 2D structural images using convolutional neural network and transfer learning. Opt. Commun. 2024, 558, 130363. [Google Scholar] [CrossRef]
  15. Wei, W.H. Structural, thermal and optical properties and transition threshold in Ge-Sb-Se glassy system. J. Non-Cryst. Solids 2020, 536, 119991. [Google Scholar] [CrossRef]
  16. Amiri, I.; Khalek, A.; Chakma, S.; Paul, B.K.; Ahmed, K.; Dhasarathan, V.; Rajan, M.M. Design of Ge20Sb15Se65 embedded rectangular slotted quasi photonic crystal fiber for higher nonlinearity applications. Optik 2019, 184, 63–69. [Google Scholar] [CrossRef]
  17. Han, X.; You, C.; Dai, S.; Zhang, P.; Wang, Y.; Guo, F.; Xu, D.; Luo, B.; Xu, P.; Wang, X. Mid-infrared supercontinuum generation in a three-hole Ge20Sb15Se65 chalcogenide suspended-core fiber. Opt. Fiber Technol. 2017, 34, 74–79. [Google Scholar] [CrossRef]
  18. Shahriar, T.R.; Islam, O.; Tahmid, I.; Alam, Z.; Alam, M.S. Highly coherent supercontinuum generation in circular lattice photonic crystal fibers using low-power pulses. Optik 2023, 272, 170258. [Google Scholar] [CrossRef]
  19. Abdel-Basset, M.; Mohamed, R.; Jameel, M.; Abouhawwash, M. Nutcracker optimizer: A novel nature-inspired metaheuristic algorithm for global optimization and engineering design problems. Knowl.-Based Syst. 2023, 262, 110248. [Google Scholar] [CrossRef]
  20. John, H. Holland. Genetic algorithms. Sci. Am. 1992, 267, 66–73. [Google Scholar]
  21. Kennedy, J.; Eberhart, R. Particle swarm optimization. In Proceedings of the ICNN’95—International Conference on Neural Networks, Perth, Australia, 27 November–1 December 1995; Volume 4, pp. 1942–1948. [Google Scholar]
Figure 1. Fiber structure diagram. (a) Cross-section of the optical fiber (b) schematic of the mode field.
Photonics 12 00497 g001
Figure 2. Effect of d on dispersion and nonlinear coefficient: (a) Influence on dispersion; (b) Influence on nonlinear coefficient.
Photonics 12 00497 g002
Figure 3. Effect of hq on dispersion and nonlinear coefficient: (a) Influence on dispersion; (b) Influence on nonlinear coefficient.
Photonics 12 00497 g003
Figure 4. Effect of Λ on dispersion and nonlinear coefficient: (a) influence on dispersion; (b) influence on nonlinear coefficient.
Photonics 12 00497 g004
Figure 5. Neural network structure.
Photonics 12 00497 g005
Figure 6. Neural network fitting results (a) neff fitting result (b) Aeff fitting result.
Photonics 12 00497 g006
Figure 7. Comparison of fitness and time for different optimization algorithms (NOA, PSO, GA) under five tasks. “Task1”–“Task5” correspond to target supercontinuum spectral broadening wavelengths of 6 µm, 10 µm, 15 µm, 20 µm, and 25 µm, respectively. The same optimization parameters (population size = 50, iterations = 500) were used for all methods. Solid lines denote computation time; dashed lines denote fitness.
Photonics 12 00497 g007
Figure 8. Spectra under different optimization targets: (a) 6 µm; (b) 10 µm; (c) 15 µm; (d) 20 µm; (e) 25 µm.
Photonics 12 00497 g008
Figure 9. Coherence under different spectral width targets: (a) 6 µm; (b) 10 µm; (c) 15 µm; (d) 20 µm; (e) 25 µm.
Photonics 12 00497 g009
Figure 10. Comparison of the original supercontinuum spectrum and the supercontinuum spectrum with structural errors: (a) 6 µm; (b) 10 µm; (c) 15 µm; (d) 20 µm; (e) 25 µm.
Photonics 12 00497 g010
Table 1. Parameter upper and lower limits settings.
ParametersMinimum LimitMaximum Limit
hq0.4 µm1.8 µm
d3 µm6 µm
Λ0.5 µm2.9 µm
flength0.03 m0.1 m
P100 W1000 W
FWHM0.03 ps0.06 ps
C−66
Table 2. Parameters obtained through the optimization algorithm.
Maximµm Spectral Bandwidth/µmCoefficient of Variation (CV/%)hq/µmd/µmΛ/µmflength/mP/WFWHM/psC
2543.661.223.341.570.0610000.046−0.94
2052.520.843.222.900.088730.035−0.44
1555.850.685.851.700.068610.061.40
1062.1215.360.600.055000.063.63
666.200.554.671.080.031760.052.63
Disclaimer/Publisher’s Note: The statements, opinions and data contained in all publications are solely those of the individual author(s) and contributor(s) and not of MDPI and/or the editor(s). MDPI and/or the editor(s) disclaim responsibility for any injury to people or property resulting from any ideas, methods, instructions or products referred to in the content.

