Article

Fuzzy Logic-Based Performance Enhancement of FSO Systems Under Adverse Weather Conditions

by
Hassan Yousif Ahmed
1,
Medien Zeghid
2,*,
Akhtar Nawaz Khan
3 and
Somia A. Abd El-Mottaleb
4
1
Department of Electrical Engineering, College of Engineering in Wadi Alddawasir, Prince Sattam Bin Abdulaziz University, Wadi Alddawasir 11991, Saudi Arabia
2
Department of Computer Engineering and Information, College of Engineering in Wadi Alddawasir, Prince Sattam Bin Abdulaziz University, Wadi Alddawasir 11991, Saudi Arabia
3
Department of Electrical Engineering, University of Engineering & Technology, Jalozai Campus, Peshawar 25120, Pakistan
4
Department of Mechatronics Engineering, Alexandria Higher Institute of Engineering and Technology, Alexandria 21311, Egypt
*
Author to whom correspondence should be addressed.
Photonics 2025, 12(5), 495; https://doi.org/10.3390/photonics12050495
Submission received: 10 April 2025 / Revised: 3 May 2025 / Accepted: 7 May 2025 / Published: 16 May 2025

Abstract

:
In this paper, we propose an application of fuzzy logic control (FLC) to improve the system performance of free-space optics (FSO) networks using the optical code-division multiple-access (OCDMA) technique. The primary objective is to dynamically adjust the bit error rate (BER) threshold at the receiver based on weather conditions (i.e., rain and fog) and the propagation distance (which significantly affects the received power). The FLC module at the receiver integrates and processes these variables to optimize the BER threshold. The FLC module operates through an algorithm comprising eight well-defined steps, ensuring robust and adaptive control of the BER. Simulation results show that the FSO-FLC-based system has significant advantages over traditional approaches. For instance, under heavy rain conditions, the FSO-FLC system supports 12 users compared to a traditional system, which supports 7 users without FLC over a distance of 2.8 km with BER 10 9 . Similarly, under heavy fog conditions, the FSO-FLC system can support 22 users compared to a traditional system, which supports 18 users without FLC over a distance of 0.5 km with equal BER. These values show that the performance of FSO under weather conditions significantly improves when using the proposed approach. The computational efficiency and real-time feasibility of the FSO-FLC are also analyzed. The complexity of the FLC is O(1), indicating that the execution time remains constant regardless of input size. An Intel Core i7-1165G7 (2.80 GHz) using MATLAB’s fuzzy logic toolbox is used for all experiments. Results show that the proposed FLC executes up to 4 ms per decision cycle, which ensures real-time adaptability for practical FSO communication systems.

1. Introduction

The growing demand for higher data rates has significantly increased the need for advanced solutions in wireless data transmission. Furthermore, the emphasis on green communication has further driven research directions toward innovative technologies. Optical wireless communication (OWC) has emerged as a compelling candidate, offering a sustainable and efficient approach to address modern communication requirements. FSO is a subclass of OWC that has gained significant attention in the realm of wireless data transmission. FSO has many positive attributes which present a viable and efficient alternative to the traditional radio frequency (RF) communication links [1]. FSO utilizes optically modulated signals and enables the wireless transmission of data signals in free space between precisely aligned transmitter and receiver units. This technology offers numerous benefits, including high-speed data transmission, a broad bandwidth operating in an unlicensed spectrum, resistance to electromagnetic interference, energy efficiency, and suitability for deployment in urban environments [1,2]. Future communication networks, including QKD-based optical systems, demand precise modeling of environmental effects on optical signal propagation. In [3], the authors emphasize this need in the context of converged satellite/fiber optical infrastructure. Atmospheric attenuation and atmospheric turbulence are the two main factors that degrade the strength of an optical signal during beam propagation in the FSO channel. Atmospheric attenuation in FSO communication systems arises from various weather conditions, including rain, fog, haze, snow, and dust. These factors cause signal degradation primarily through scattering and absorption of an optical signal. Fog and haze typically exert the most significant impact due to Mie scattering from their high concentration of small particles [1,2]. Rain and snow further cause both Mie and geometric scattering [4,5]. Absorption is influenced by the interaction of light with water molecules and other atmospheric components. The relative impact of these factors varies greatly depending on the intensity of the weather event and the wavelength of the optical signal [6]. Heavier rainfall can significantly reduce signal strength with higher attenuation [5]. Atmospheric turbulence is caused by fluctuations in the refractive index of air, which result from uneven heating and cooling. These fluctuations produce optical beam defocusing, signal strength variations (scintillation), and increased beam divergence. Turbulence-induced effects, such as signal distortion and spreading, further degrade the quality of the received signal [7]. This study focuses on atmospheric attenuation caused by fog and rain conditions.

1.1. Existing Works

To enhance the FSO transmission capacity, multiplexing techniques like orthogonal frequency multiplexing (OFDM), wavelength division multiplexing (WDM), and OCDMA are utilized in FSO systems [8,9]. High-data-rate FSO systems are affected by various impairments that reduce transmission signal quality. These impairments have been reported to increase the risk of an optical transmission system error, but the impact is not severe over considerably long distances [10]. The results reveal that 1550 nm FSO wavelengths are less affected by atmospheric attenuation. Furthermore, the 1550 nm wavelength can support a 2.5 Gbps error-free transmission in clear weather conditions with BER  = 10 9 . Short link-reach between the transmitter and receiver can further optimize the FSO system transmission parameters or components [11]. Spectral amplitude coding optical code-division multiple-access (SAC-OCDMA) codes are employed in free-space optical communication systems to mitigate multiple-access interference. Different categories of codes have been suggested, and their effectiveness has been assessed in diverse weather circumstances. Successful transmission of high data rates has been achieved, where the performance is influenced by the selection of the detection method and receiver [12,13]. In [14], the authors theoretically and experimentally studied the spectral attenuation of FSO communication systems operating across visible and near-infrared (NIR) wavelengths under fog and smoke conditions, using a controlled laboratory atmospheric chamber of 5.5 m. A new wavelength-dependent empirical model was proposed, demonstrating closer agreement with measured attenuation data than conventional models, such as models of Kim and Kruse. Furthermore, the study provided insights into optimal wavelength selection for FSO systems operating in dense fog. In [15], the authors evaluated the performance of FSO systems under different line-coding schemes, including return-to-zero (RZ), carrier-suppressed RZ (CSRZ), and non-return-to-zero (NRZ) at a data rate of 2.5 Gbps. A 4 × 4 multi-input–multi-output (MIMO) FSO system was also investigated, showing that a combination of MIMO and RZ modulation could significantly extend the propagation distance of the FSO link. In [16], a performance comparison of FSO systems using pulse-position modulation (PPM), RZ, and NRZ coding schemes was carried out. The study further analyzed the impact of varying transmitted power levels, concluding that PPM modulation achieved the greatest improvement in BER performance with increased transmitter power compared to other schemes.
While the aforementioned techniques focus on enhancing transmission efficiency and coding robustness, another line of research explores the use of intelligent control methods to mitigate environmental effects in real time. Among these, fuzzy logic has emerged as a powerful tool for adaptive decision-making in optical systems, particularly under uncertain and variable weather conditions. Fuzzy logic has been used for various aspects in optical communication systems [17]. One application is to evaluate the different sensing resource allocations in fiber-optic communication networks [1]. Similarly, it is used in the integrated routing and wavelength assignment method for Optical Network-on-Chip (ONoC), where fuzzy logic is used to consider multiple performance factors such as OSNR, traffic distribution, waiting delay, and wavelength utilization [2]. Fuzzy logic is also used in mitigating the adverse effects of weather conditions on FSO communication (FSOC) systems by implementing an adaptive fuzzy logic controller (AFLC) for laser beam alignment and tracking. Additionally, fuzzy logic is utilized in the creation of effective optical logic systems, where light emitters of different colors are used as fuzzy variables for logical information processing [18]. Finally, fuzzy logic is employed in routing optimization within multi-path optical networks, where a fuzzy logic diagnostic and control subsystem helps in evaluating transmission threats and making dynamic decisions for data routing. Fuzzy logic (FL) provides an efficient method to improve the performance of the SAC-OCDMA code over FSO links. In this method, fuzzy logic enables dynamic adaptation to channel conditions by optimizing power and code allocation, while also providing a mechanism for error detection and correction, ultimately enhancing network reliability [18].

1.2. Main Contributions

In this paper, we propose an adaptive FLC system to improve the performance of FSO communication under adverse weather conditions. The key contributions are as follows:
(i)
FLC Development and Computational Efficiency:
  • We have developed a fuzzy control system that dynamically adjusts the BER threshold at the receiver in response to FSO link impairments (rain, fog, and distance).
  • We have conducted a complexity analysis of the FLC to demonstrate that its computational complexity is O(1). Therefore, it ensures constant-time execution.
  • We have implemented and tested the FLC using MATLAB (R2017b)’s fuzzy logic toolbox on an Intel Core i7-1165G7 (2.80 GHz) processor (UX435E Notebook PC, ASUSTeK Computer Inc., Taipei, Taiwan)
  • Experimental results confirm that the FLC executes under 4 ms per decision cycle, making it suitable for real-time applications.
(ii)
FSO-OCDMA System Integration and Optimization:
  • We have integrated the FLC within an end-to-end FSO-OCDMA setup to enhance adaptability to varying atmospheric conditions.
  • We have analyzed the FSO system and optimized BER threshold levels to maintain reliable communication under rain and fog conditions.
(iii)
Theoretical and Performance Analysis:
  • We have conducted theoretical performance and analysis of the FSO-FLC-OCDMA system using the Single Sigma Matrix (SSM) code.
  • The system behavior is evaluated under different attenuation levels (dB/km) across varying distances from very-short-range (200 m) to long-range (3 km).
(iv)
Performance Gains and System Efficiency:
  • In this work, we have demonstrated that the proposed system supports a higher number of users while extending transmission distances compared to conventional methods.
  • In this work, it is ensured that optical transmission requirements were met with minimal effective transmitted source power.

1.3. Organization

The article is organized as follows. Section 2 presents the modeling of rain and fog impairments in FSO systems, detailing the impact of atmospheric attenuation on signal propagation. Section 3 introduces the fuzzy modeling approach for enhancing receiver performance in the FSO-OCDMA system. This section covers the design of the FSO-OCDMA system integrated with an FLC, the Adaptive BER Threshold Adjustment Algorithm for FSO-FLC-OCDMA receivers, and the different control functions for dynamic BER optimization. Additionally, the computational efficiency and real-time feasibility of the FLC are analyzed. Section 4 discusses the results and performance evaluation, comparing the proposed FSO-FLC approach with conventional methods under varying weather conditions. Finally, Section 5 concludes the paper, summarizing key findings and outlining potential future research directions.

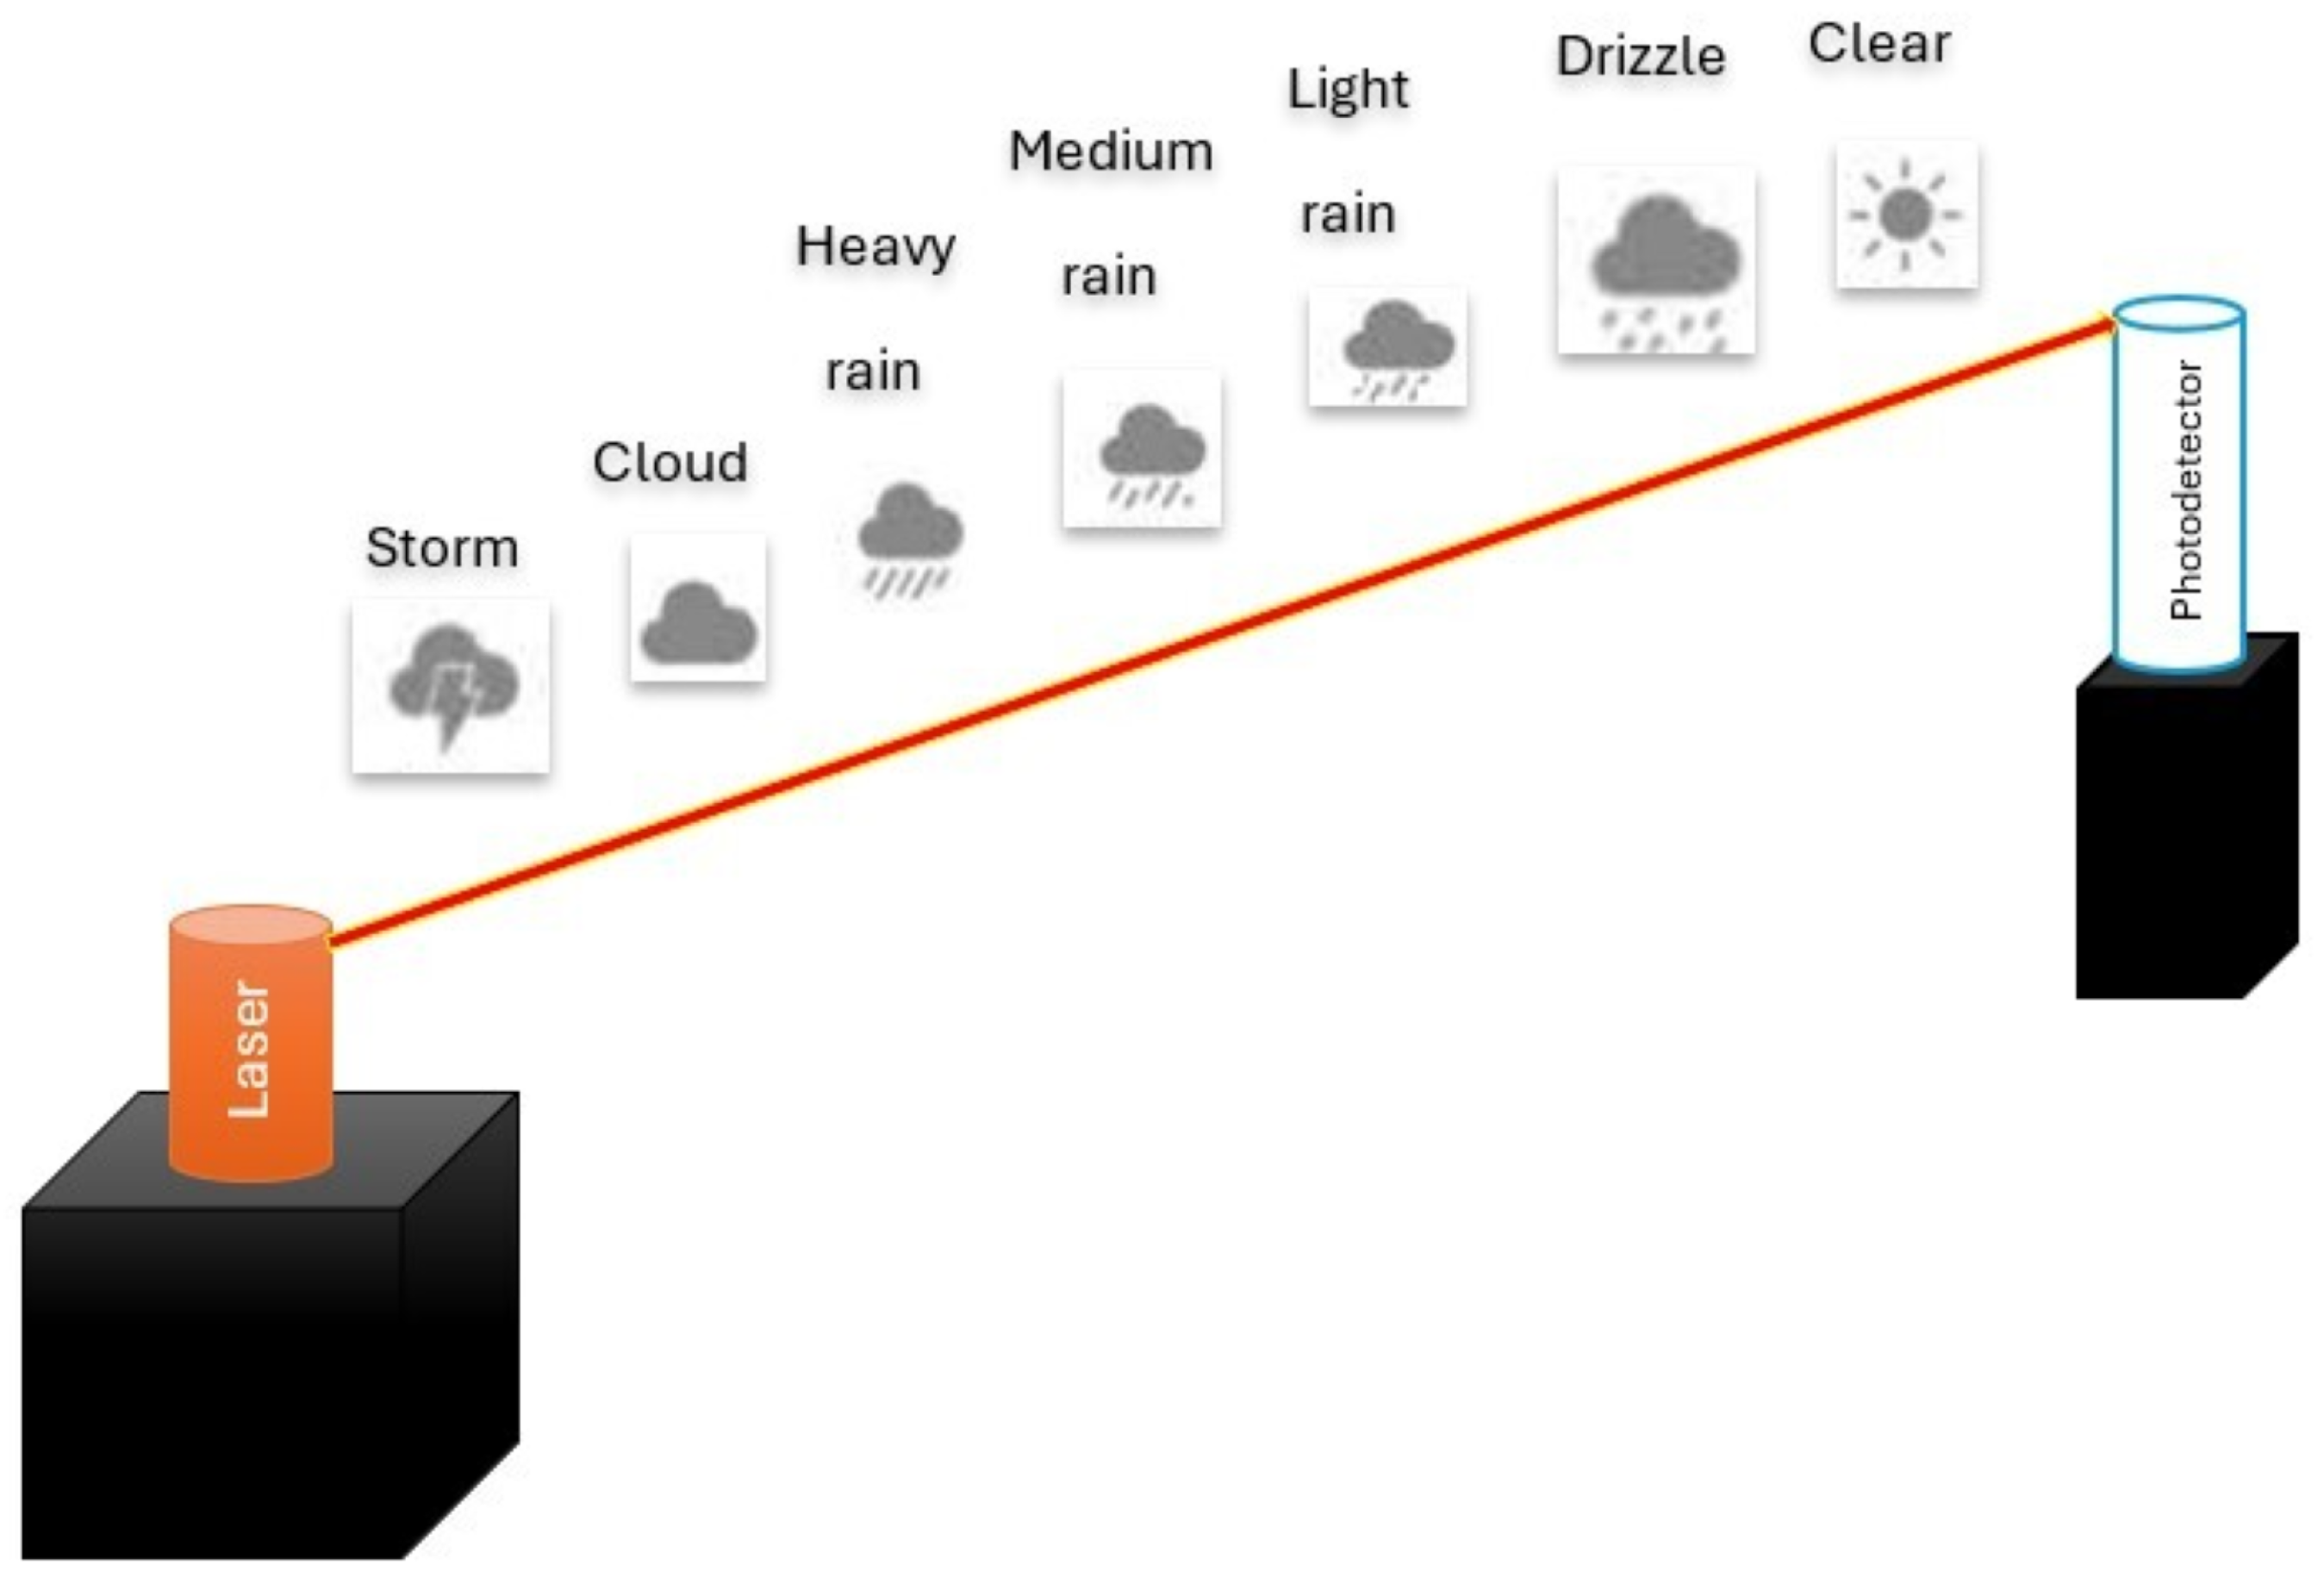
2. Modeling of Rain and Fog Impairments in FSO System

The FSO communication link has many advantages. Unlike the radio frequency spectrum, it operates without the need for a license. Its installation is possible in regions where optical fibers or cables cannot be installed due to their geographical location [1]. However, FSO signals are highly sensitive to atmospheric conditions, resulting in degradation of received power and attenuation losses due to rain, fog, haze, and dust [2]. Rain and fog are among the most critical environmental impairments affecting FSO performance. In this study, we focus on modeling the impact of rain and fog on signal quality and transmission distance. The modeling approach is supported by both empirical studies and standard recommendations such as ITU-R P.1814 and ITU-R P.1817, which provide prediction methods and propagation data essential for designing robust terrestrial FSO systems [19,20].

2.1. Rain

The attenuation caused by rain significantly impacts the transmitted optical power in FSO links. This attenuation is primarily a function of the rainfall rate (R), which is defined as the amount of rain falling per hour, measured in millimeters per hour (mm/h). The specific attenuation caused by rain can be expressed using an empirical relation  [4].
γ r a i n = 1.076 R 0.67
In Equation (1), γ r a i n indicates the attenuation of rain in (dB/km) and R refers to the rain rate in (mm/hr). The value of R differs from one region to another. While the attenuation model is driven by rainfall rate (R, mm/h), it is helpful to relate common rain conditions to their expected impact on FSO performance. Table 1 presents standard qualitative rain intensity levels along with typical attenuation effects for each category [5]. The intensity of rain that affects the FSO link is displayed in Figure 1. Moreover, recent work [21] has explored cloud attenuation modeling that spans from Ka-band to optical frequencies, highlighting the importance of integrated liquid water content in predicting signal loss, a concept relevant when analyzing dense rain or overlapping cloud cover in FSO links.

2.2. Fog

A mathematical expression for the fog and haze attenuation in the FSO system is given in Equation (2) [6]. In the case of different fog and haze conditions, attenuation is more compared to the rain attenuation as the dust and smoke particles remain longer in the atmosphere.
α = 13 V λ 550 nm x
In Equation (1), α shows the fog or haze attenuation in (dB/km), V is the visibility in (km), λ is the wavelength in nm, and x is the size distribution of the scattering particle. According to Kim model, x can be determined as follows  [2,3,4,5,6]:
x = 1.6 V > 50 1.36 < V < 50 0.16 V + 0.341 < V < 6 V 0.5 < V < 1 0 V < 0.5
Table 2 shows haze and fog conditions with their attenuation [8].
As the received power decreases due to these weather conditions, the relation between the received and transmitted power can be expressed as follows [9]:
P R X = P T X d R X d T X + θ L 2 10 β L 10
where P R X , P T X , d R X , d T X , θ , and L respectively indicate received power, transmitted power, received aperture diameter, transmitted aperture diameter, beam divergence, and link range, while β refers to the atmospheric attenuation which is γ r a i n in case of rain condition and α in case of fog or haze conditions. In our model, geometric losses are accounted for using fixed system parameters, consistent with prior literature. We assume a transmitted power of 10 dBm, a receiver aperture of 20 cm, a transmitter aperture of 8 cm, and a beam divergence angle of 2 mrad, as reported in  [2,6,8]. These parameters define the baseline configuration of the FSO system and are used consistently in analytical and fuzzy control evaluations. The received signal, after propagating through the FSO channel, is directed to the photodetector (PD) to be converted back into an electrical signal. Then, it enters the low-pass filter (LPF), which has a cutoff frequency of 0.75 × data rate Hz to block the unwanted signal. Furthermore, it passes through a bit error rate (BER) analyzer to compute the performance of the received data.
As the BER depends on the signal-to-noise ratio (SNR), it is necessary to initially examine the SNR in detail. The SNR can be characterized in terms of shot noise variance, σ s 2 , and thermal noise, σ t 2 , as [2,13]
SNR = I PD 2 σ s 2 + σ th 2
where I PD represents the resultant current from the photodetector [2].
I P = R P rx
where R represents the responsivity of the photodetector and has a value of 0.8 A/W.
σ s 2 and σ th 2 can be calculated as [8,13]
σ s 2 = 2 q e ( I P + I D ) B e
σ th 2 = 4 k B T B e R L
Here, q e represents the electron charge in C, B e denotes the electrical bandwidth (taken as 0.75 × data rate in Hz), I D is the dark current and has a value of 10 nA. k B is the Boltzmann constant, the parameter T stands for the receiver noise temperature and is assumed to be 298 K, while R L refers to the receiver load resistance, set at 1030 Ω .

3. Fuzzy Modeling for Enhancing Receiver Performance in FSO System
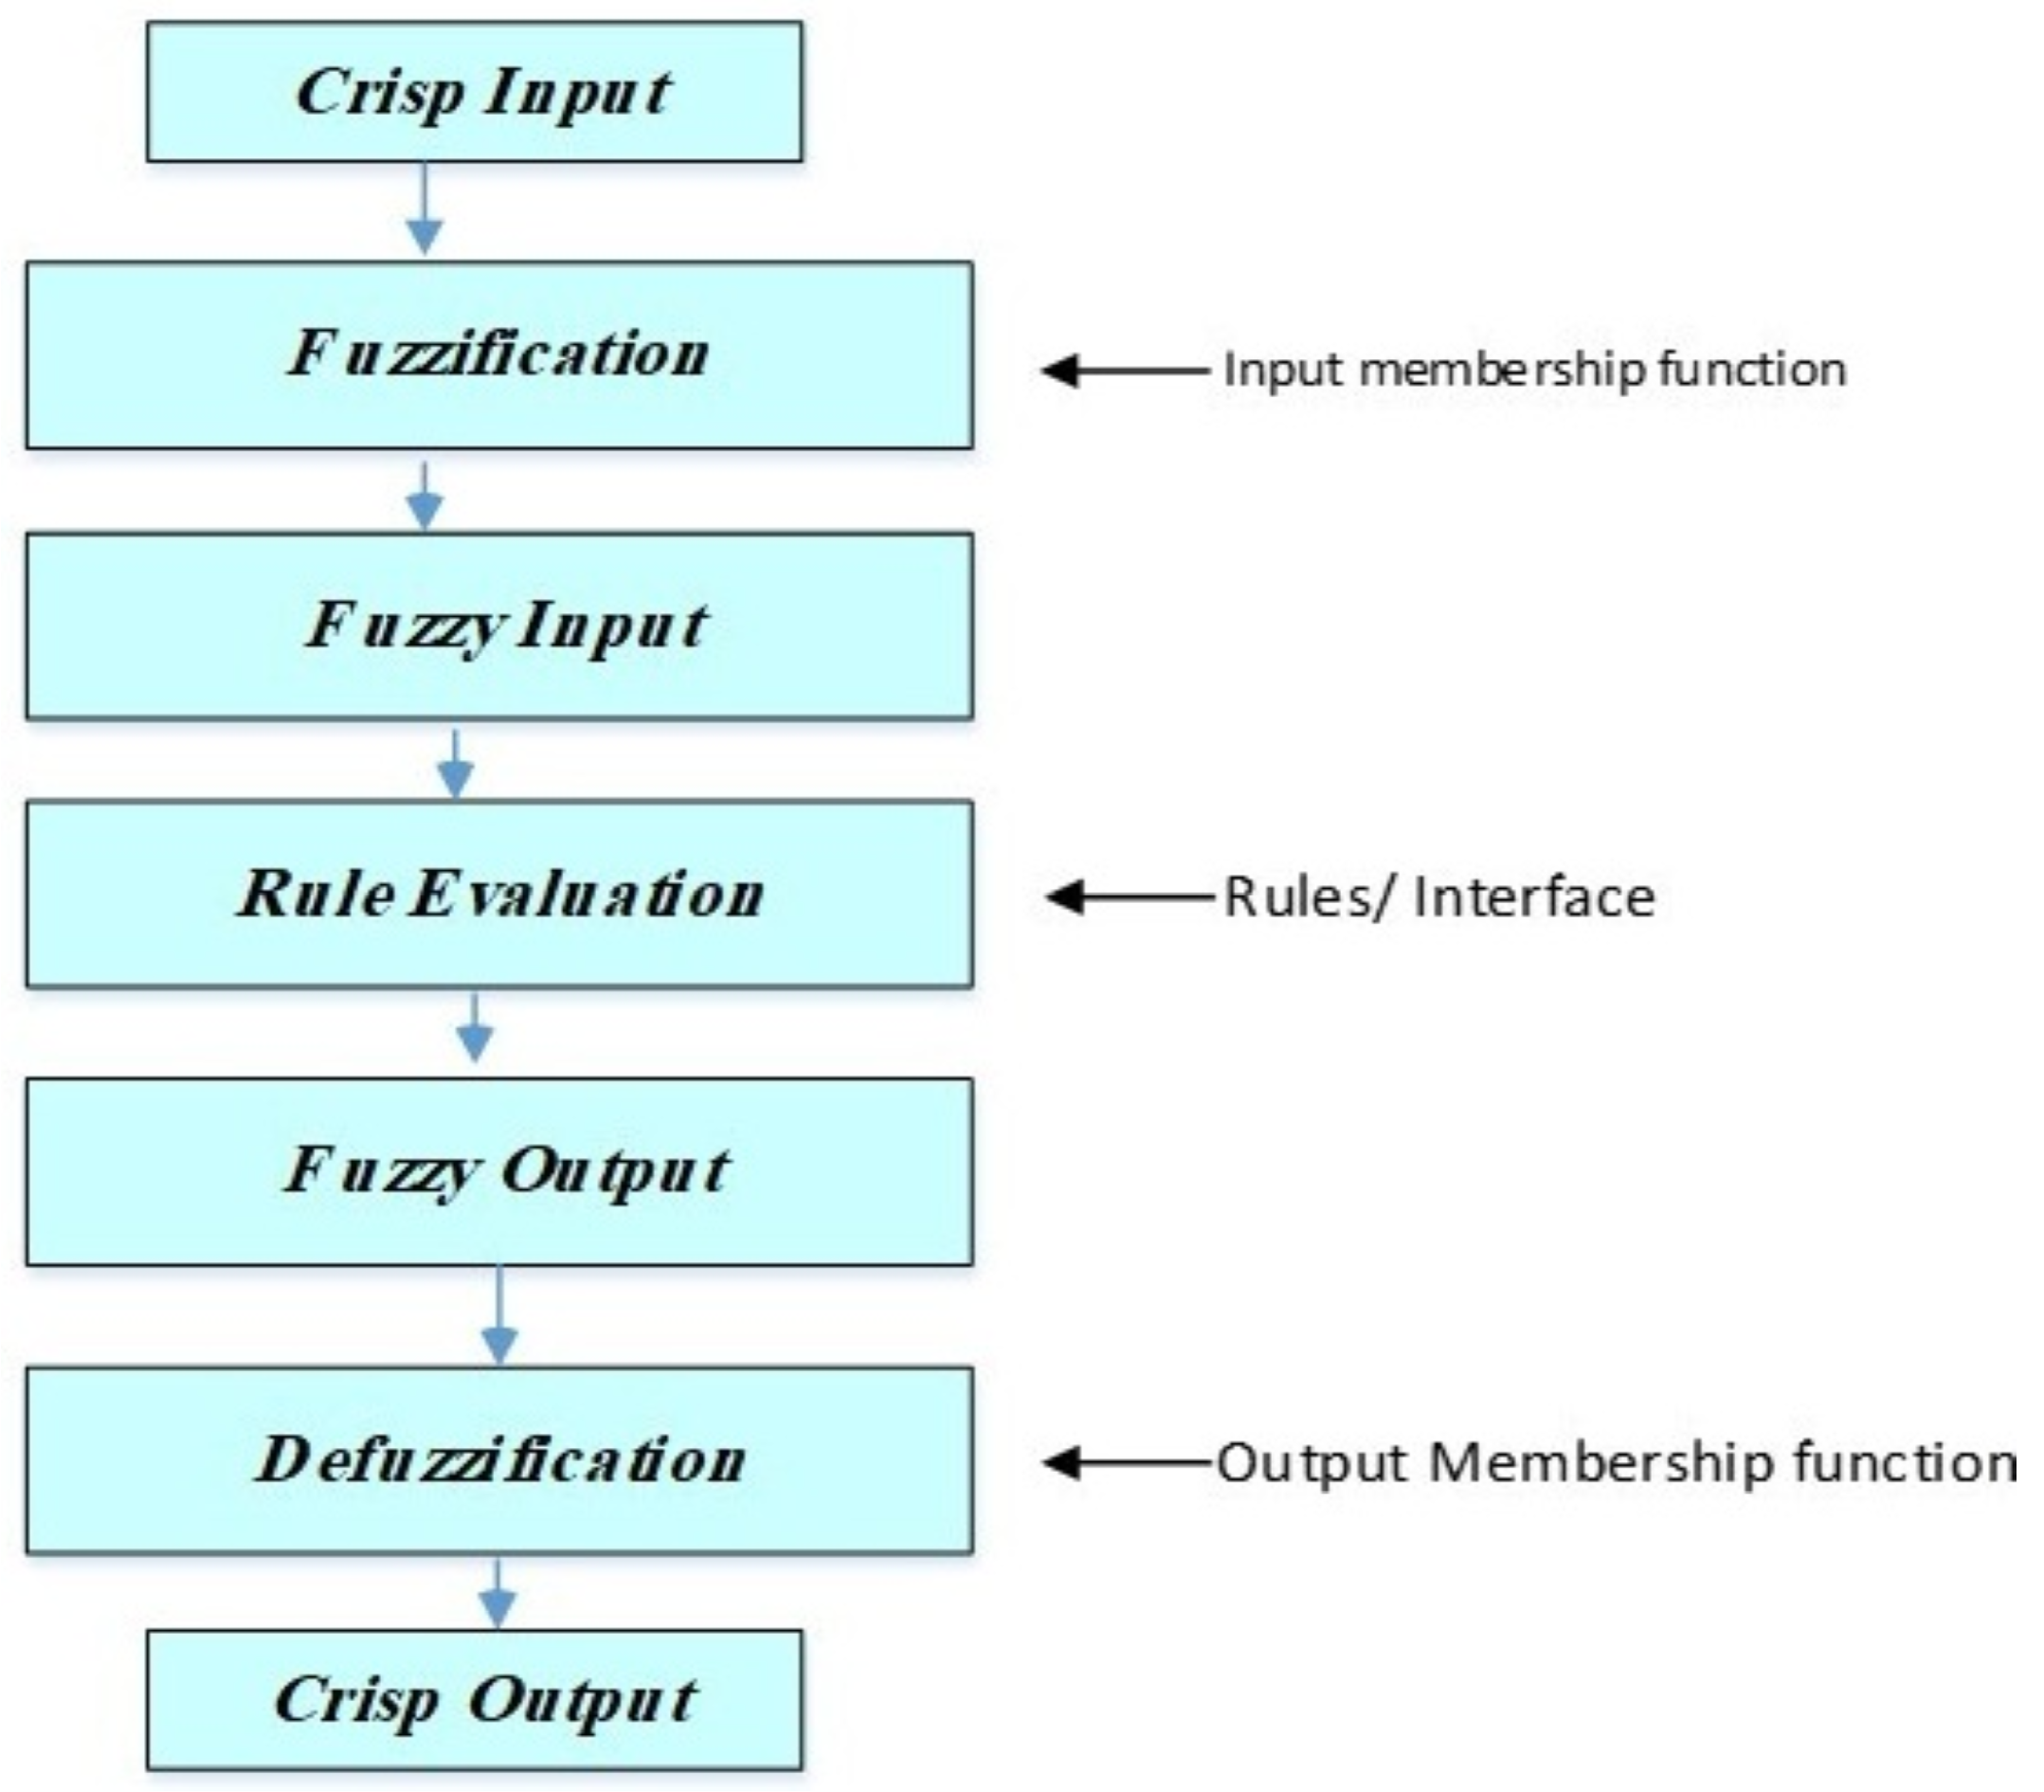
3.1. Fuzzy Logic

FL is a logical framework that extends the conventional binary logic. In contrast to binary-valued logic with binary numbers (0 or 1), it is a multivalued logic that encompasses a broader range of values. Furthermore, FL exhibits a capacity to emulate the human presentation of experiences. In the context of binary logic, temperatures are classified as “hot” if they exceed a predetermined threshold, whereas temperatures below this threshold are classified as “cold”. In contrast, within the context of FL, the temperature variable can be denoted using language notations such as “very hot”, “hot”, “normal”, “cold”, and “very cold”. Since its emergence in the 1960s, FL has become a significant methodology in the fields of system modeling and control [22]. The model’s ability to predict unknown data is a measure of its accuracy. As a result, selecting the appropriate modeling tool is a rewarding task.
FL can generate an accurate model with a small number of training iterations. The FL-based modeling approach is divided into three stages, including fuzzification, inference system, and defuzzification, which are shown in Figure 2. During the fuzzification and defuzzification phases, membership functions (MFs) were employed to change values from crisp to fuzzy and vice versa. The rule-based nature is represented by the inference system. The rules are normally developed by an expert, but they may also be retrieved from the data themselves. The rule is written in the following format: IF (A) THEN (B), where A and B indicate the antecedent (input) and consequence (output), respectively. The Center of Gravity (COG) defuzzification strategy is widespread in Mamdani-type, whereas the Weighted Average (Wtaver) defuzzification approach is popular in TSK-type. COG is used in this study [17].

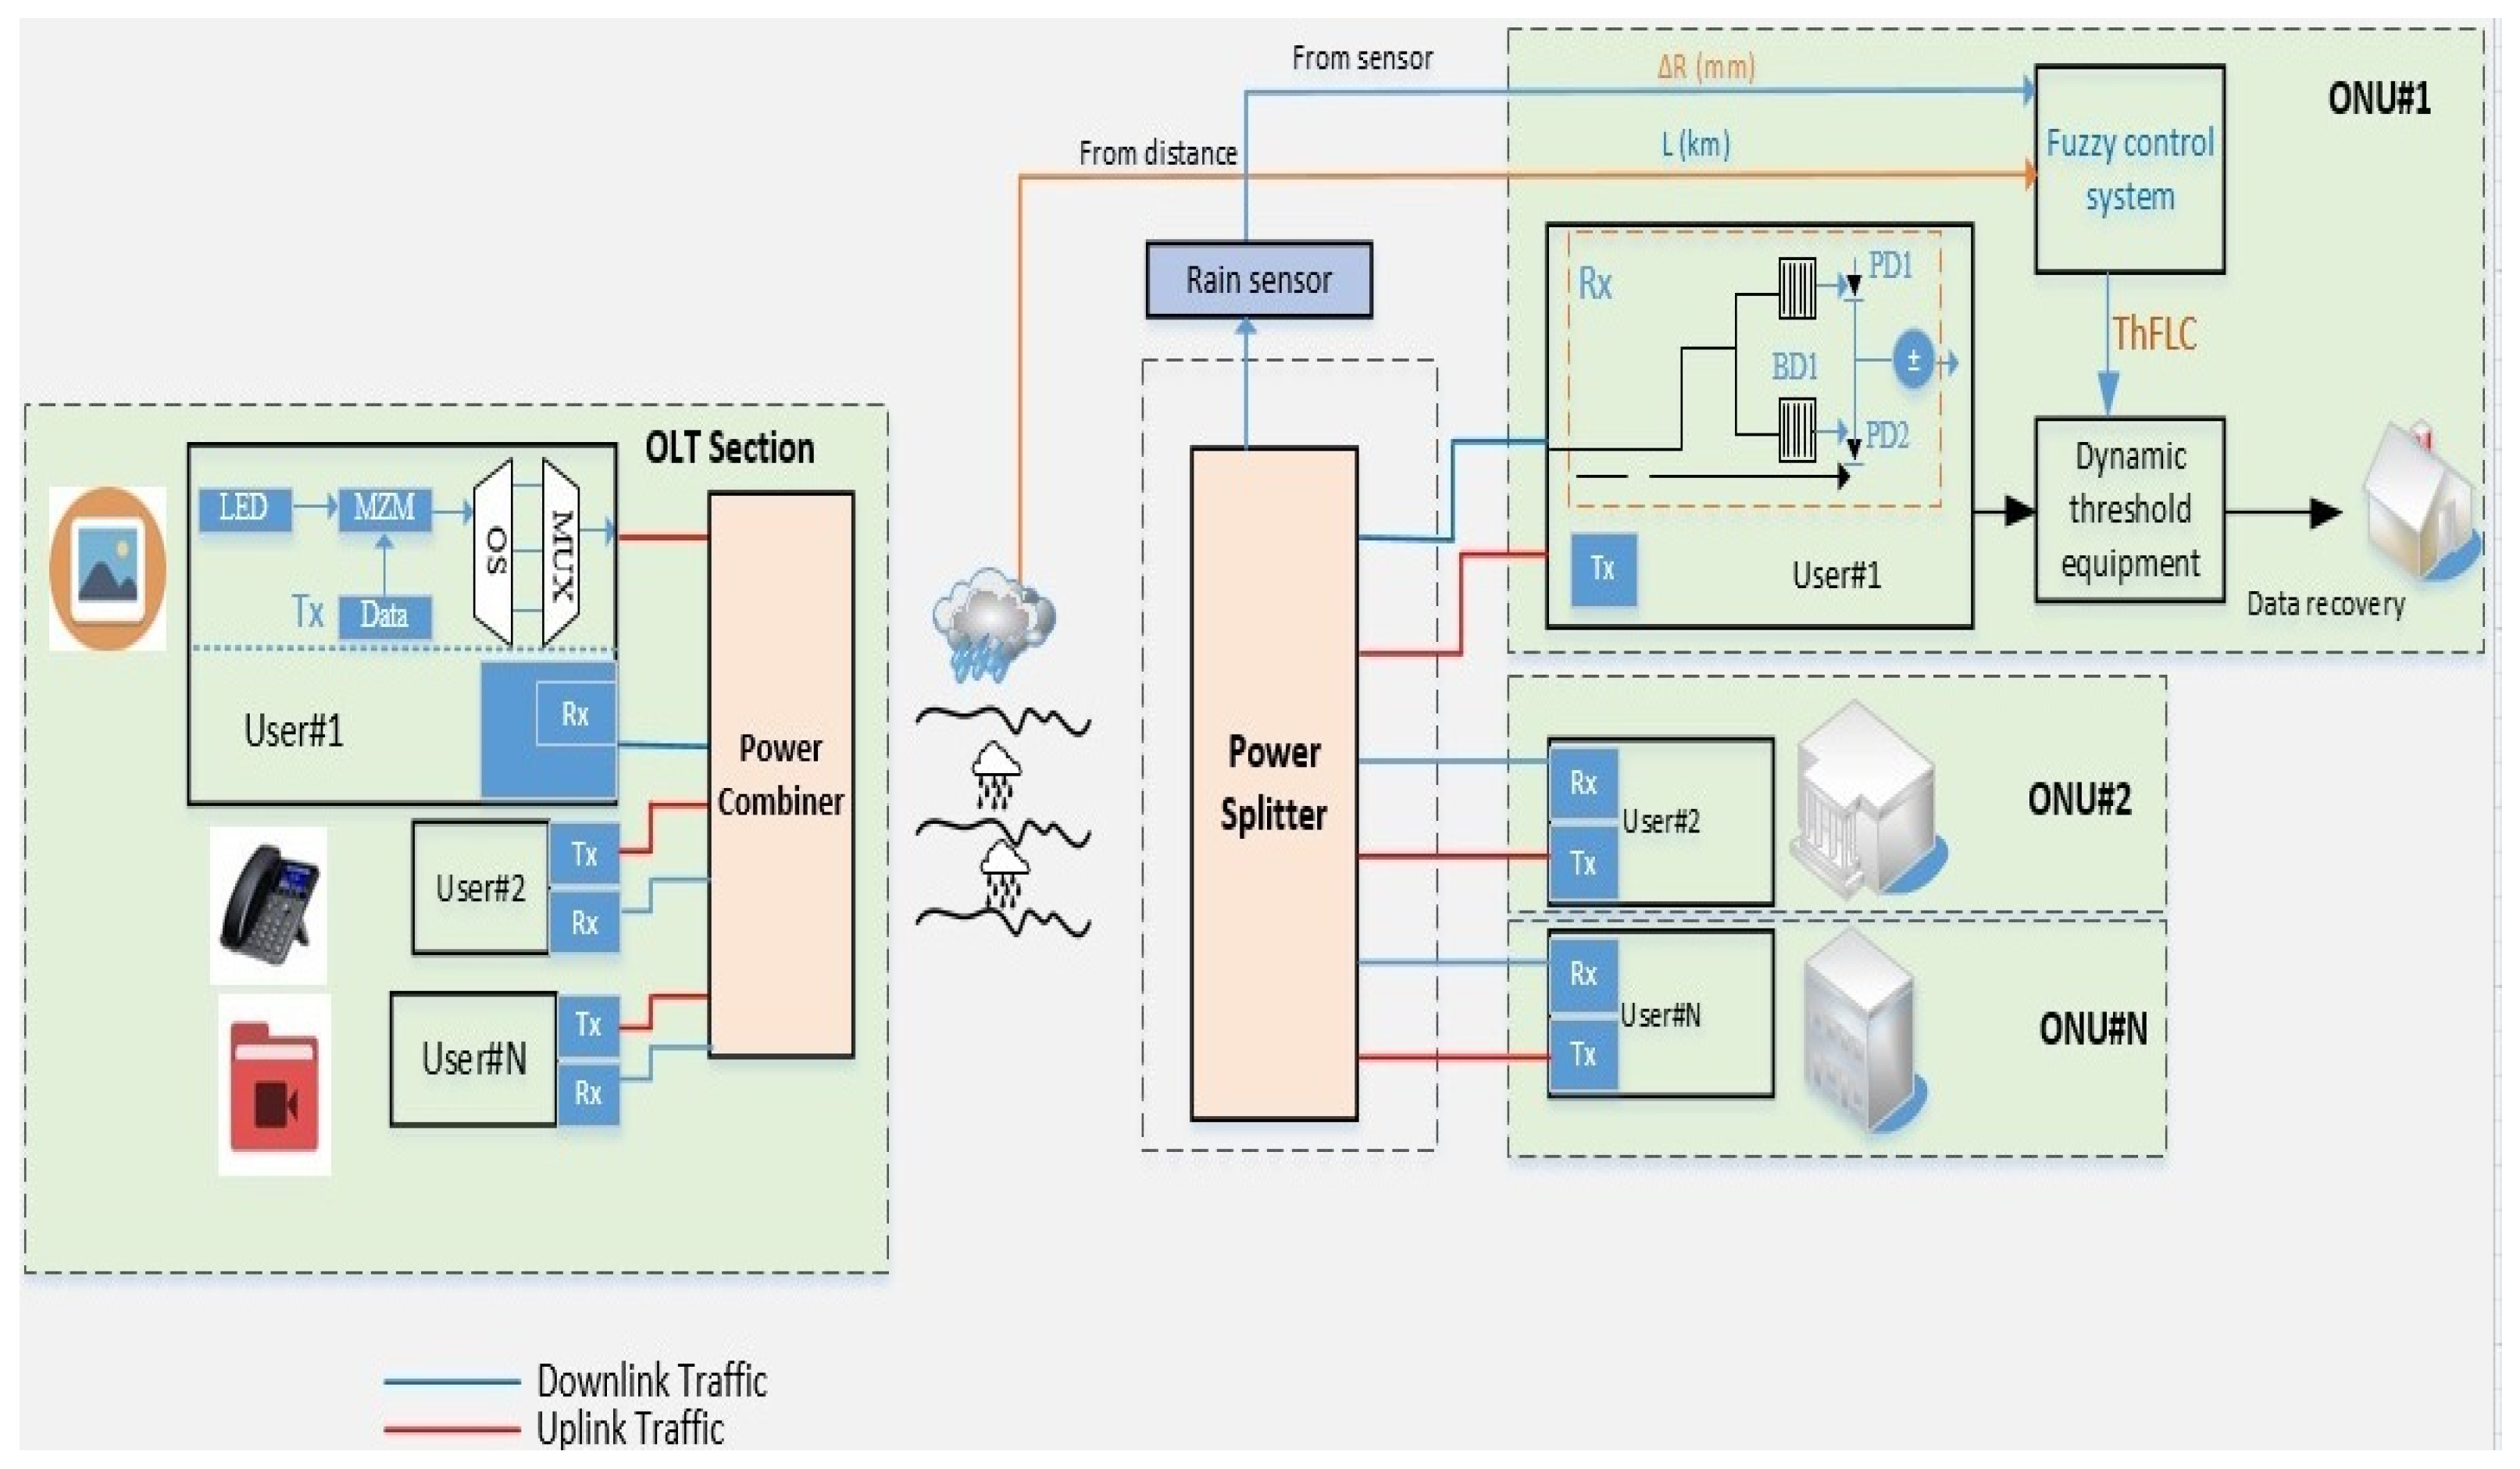
3.2. Motivation and Architecture of the FLC-Based Adaptive Receiver for FSO-OCDMA Systems

Passive optical networks (PONs) are potentially used in last-mile point-to-multipoint broadband access communication systems due to their high bandwidth as well as low cost. In rural areas with low population density and areas with some obstacles, installing optical fibers becomes a complex or impractical process. The FSO system is considered as a practical solution to address this problem [23]. However, the problem of ensuring a reliable connection is particularly challenging in adverse weather conditions in the FSO system [24]. For some factors, such as rain, fog, and the distance between the transceivers, the quality of the optical signal drops, which increases the bit error rate (BER). To mitigate these factors, it is necessary to implement a dynamic adjustment of the BER threshold to ensure optimal communication performance. The dynamic BER threshold is a continuously adjustable factor that determines the acceptable level of errors in the transmitted signal. Unlike a static threshold, which remains fixed regardless of environmental conditions, a dynamic threshold adapts to real-time changes in the surrounding environment. This adaptability is crucial, as different conditions may necessitate varying levels of tolerance for error. To obtain this dynamic adjustment, a fuzzy control system can be employed. A fuzzy logic controller (FLC) will consider the parameters, including OCDMA code properties, intensity of rain, fog density, and distance between the devices to establish reliable optical transmission. These inputs are categorized into fuzzy sets, such as very low, low, medium, and high, which enables the system to interpret real-world conditions more effectively.
The OCDMA-PON network architecture based on FSO with the integrated control fuzzy system at the receiver is displayed in Figure 3 under rainy weather conditions. A similar architecture is used for foggy weather conditions, where the rain sensor is replaced by a fog sensor [17].
In this work, the transmitter utilizes a conventional encoder in which the SSM SAC-OCDMA system is adopted [25], while each receiver employs an OCDMA decoder equipped with a dynamic threshold device controlled by our proposed control fuzzy system. In the proposed FLC system, we assumed that the data related to the weather conditions are provided by external sensors placed along the network, and we use a similar method as in [26]. The proposed FLC dynamically adjusts the detection threshold level due to weather condition variations. In particular, the dynamic threshold should be inversely proportional to the SNR, increasing for low SNR (poor signal) and decreasing for high SNR (good signal).
Figure 4 shows the block diagram of the proposed FLC system. It includes four main components, i.e., the fuzzification interface, a rule base, an inference mechanism (which acts as the decision logic), and the defuzzification interface. The Mamdani fuzzy model [22] serves as the foundation for the proposed FLC-FSO approach in this work, which involves two inputs and one output parameter (dynamic BER threshold). These input parameters are rainy (mm/h) and foggy (g/m3) weather conditions estimated presumably by external sensors along the distance L (km) between each transceiver unit. The output parameter specifies an adjusted threshold ( Fuzzy T B E R ) set by the FL controller, which enables fine-tuning of the receiver unit.

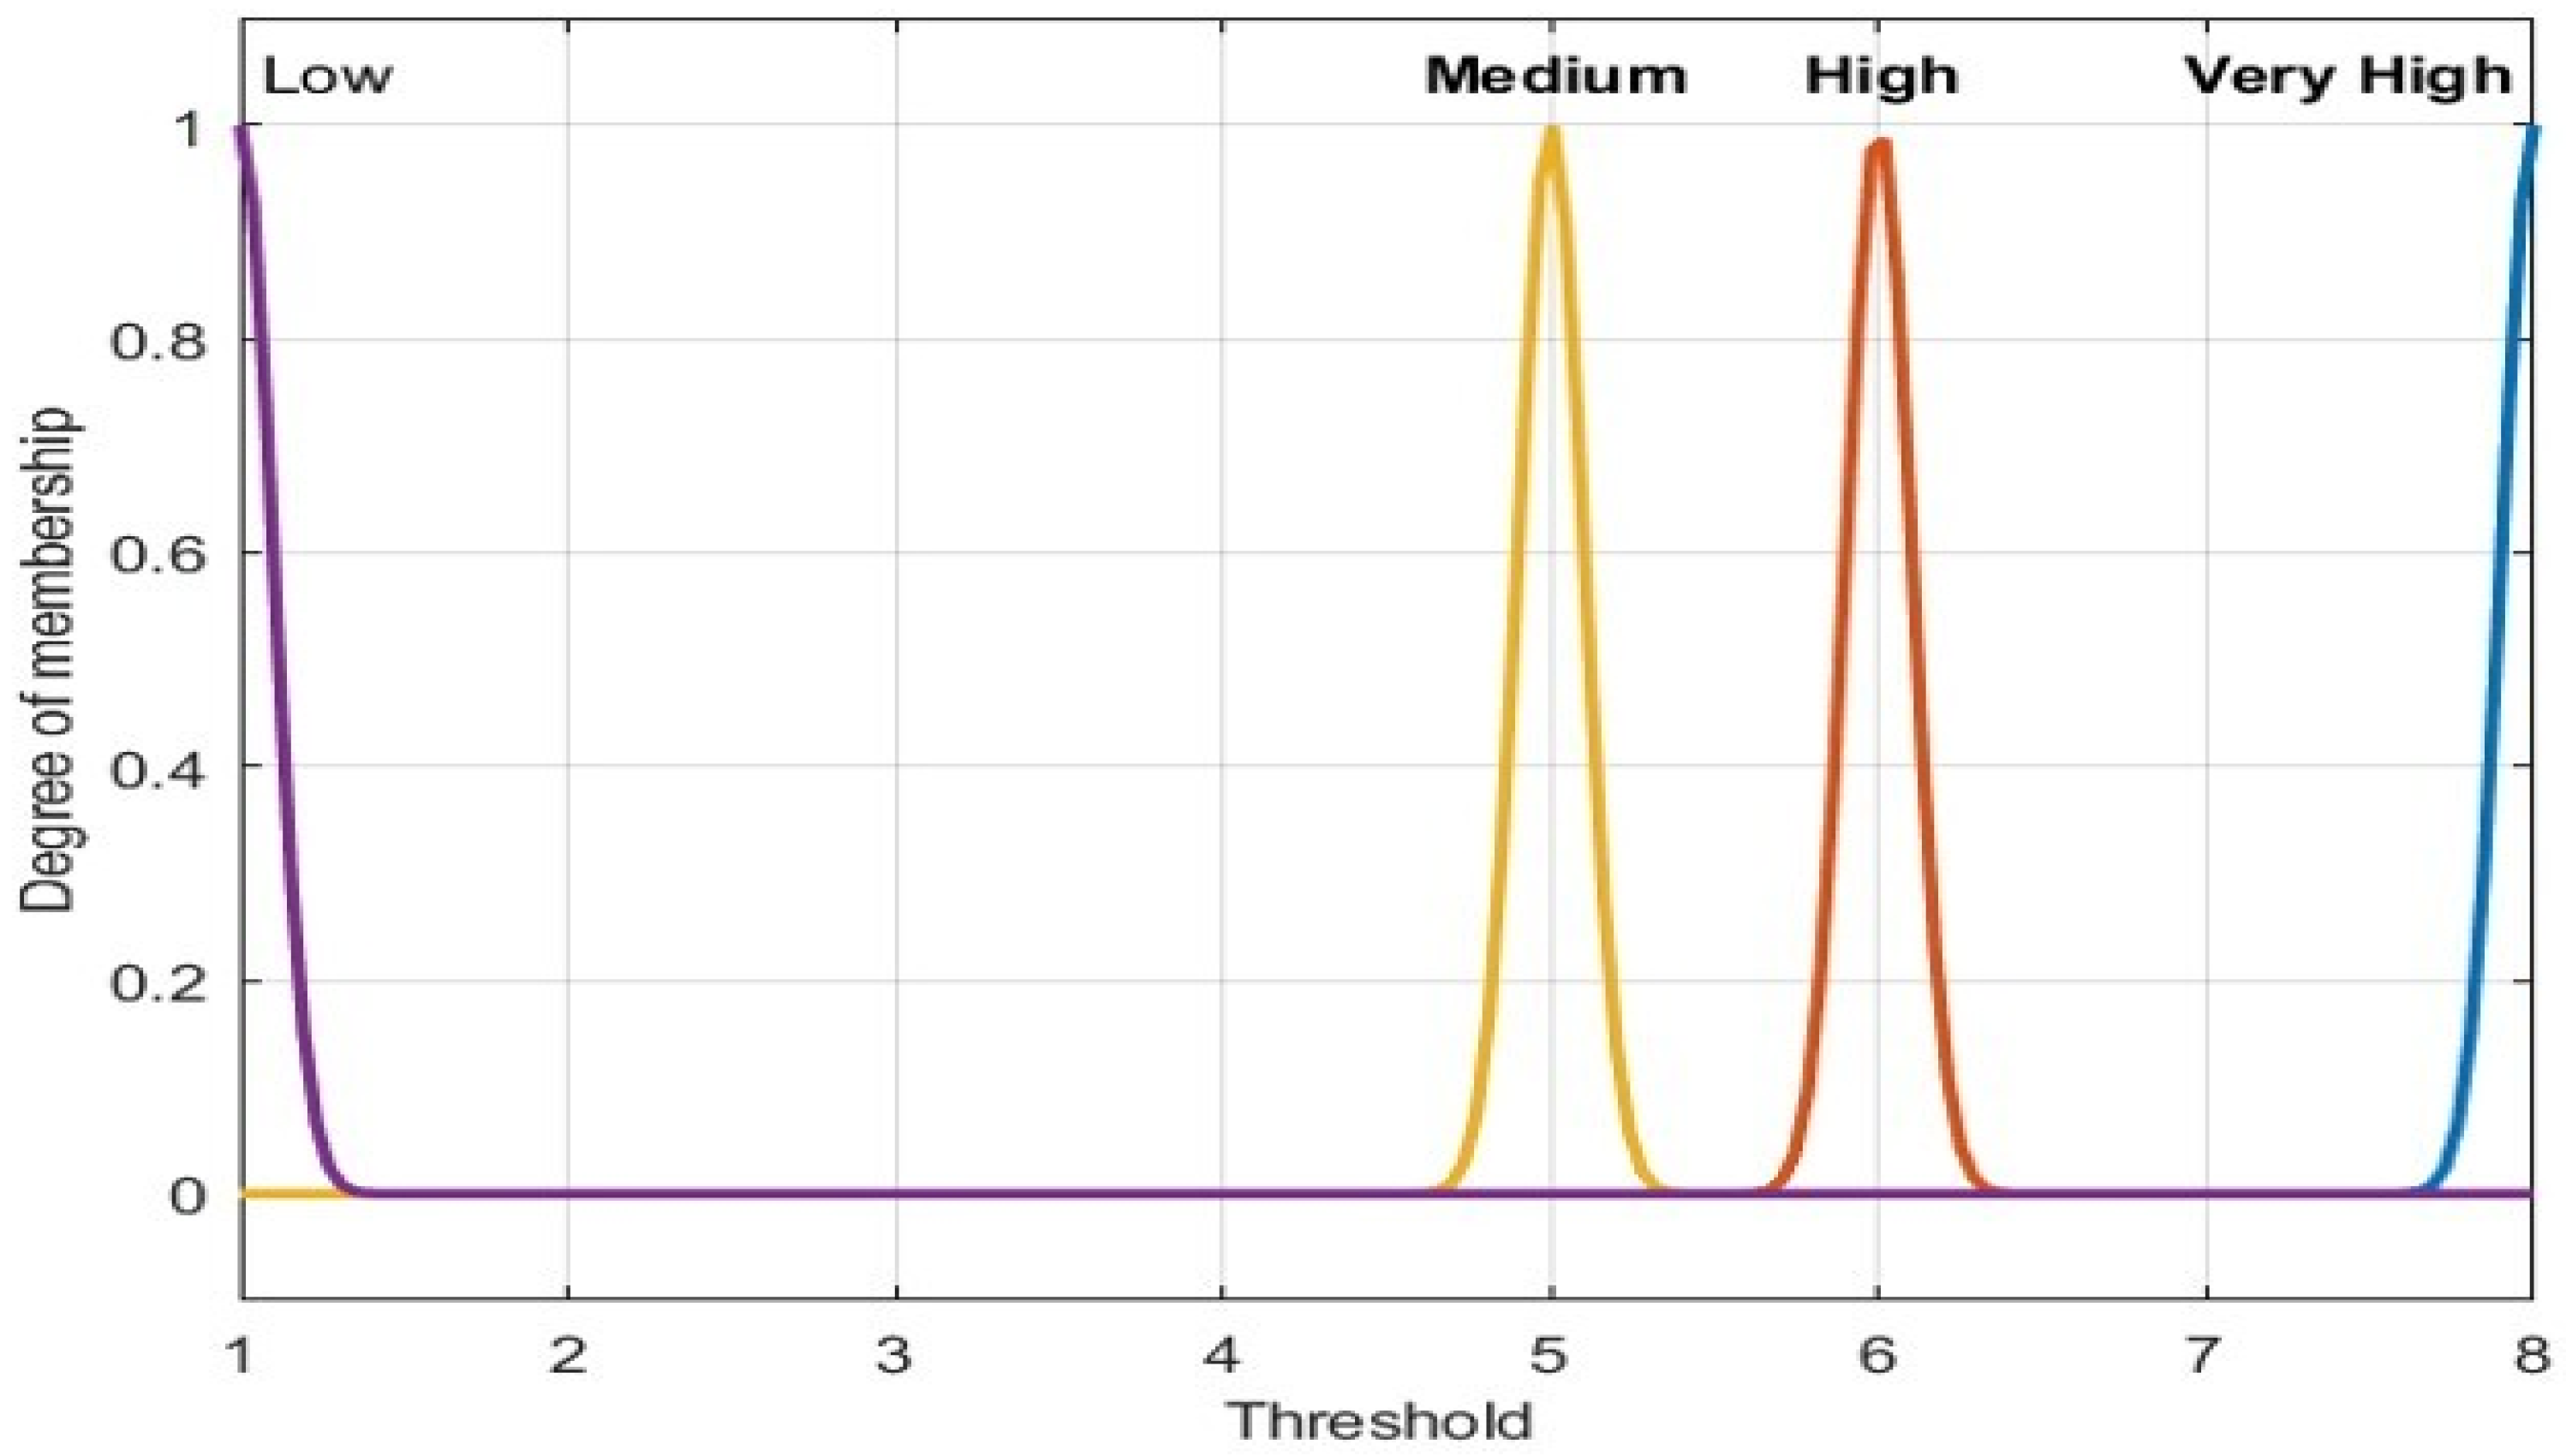
3.3. Selection of Input and Output Membership Functions

The FLC system operates according to the established rules that link environmental inputs to the variable BER threshold. For example, if the system identifies elevated levels of rain and fog along with an extended distance, the FLC will generate a high threshold BER value. Conversely, in optimal conditions marked by minimal rain and fog, as well as a short distance, a lower threshold BER value will be generated, which allows an increased error tolerance. This method enhances the reliability of the communication link while also optimizing resource utilization. By continuously observing the actual BER and comparing it with the dynamically computed threshold value, the system can initiate necessary adjustments when the BER surpasses acceptable limits. These modifications involve adjusting the transmission power. Therefore, for the implementation of a dynamic BER threshold, the designed fuzzy logic controller evaluates the following key environmental factors (inputs):
  • Rain (R): Intensity of rainfall (0 to precipitation rate > 50 mm).
  • Fog (F): Density of fog (0 to 1.5 ).
  • Distance (D): Distance between the FSO transceivers (0 to 3 km).
These inputs undergo the first stage of the fuzzy inference process, known as the fuzzification interface, where precise inputs are converted into fuzzy values using membership functions. Each crisp input belongs to a universe of discourse, meaning it exists within a range of possible values that the crisp variable can take. The membership functions selected for the fuzzy sets of rainy weather conditions inputs, Z ( Δ R ) = clearair ( C A ) , low rain (LR), medium rain (MR), heavy rain (HR) and distances with four terms, Z ( Δ L ) = very low distance (VLD), low distance (LD), medium distance (MD), and high distance (HD), within the universe of discourse between 0 and 3 km, are shown in Figure 5.
Likewise, the fuzzy sets of fog weather conditions inputs, Z ( Δ F ) = clear air (CA), low fog (LF), medium fog (MF), and heavy fog (HF), follow a similar structure to the rainy weather conditions. Using these inputs, along with the properties of OCDMA codes, we adopt 2D-SSM codes with w = 8 to analyze the FSO system. The fuzzy logic controller generates a dynamic BER threshold (T-BER), which is classified into a set of thresholds (T-BERi), where i ranges from 1 to w. Furthermore, due to its ability to represent the signal propagation model, the Gaussian membership function is adopted in this study, which involves setting the mean ( μ ) and the standard deviation ( σ ) and is expressed as follows [26].
f ( x , μ , σ ) = e x μ 2 σ 2
Let β C A ( Z ( Δ R ) ) , β L R ( Z ( Δ R ) ) , β M R ( Z ( Δ R ) ) , and  β H R ( Z ( Δ R ) ) denote the membership functions of rain variation for CA, LR, MR, and HR in Z ( Δ R ) , respectively, having width σ = 2 and μ ranging from 0 to 3, as shown in Figure 5. Likewise, assume β C A ( Z ( Δ F ) ) , β L F ( Z ( Δ F ) ) , β M F ( Z ( Δ F ) ) , and  β H F ( Z ( Δ F ) ) denote the membership functions of fog variation for CA, LF, MF, and HF in Z ( Δ F ) , respectively, having width σ = 2 and μ ranging from 0 to 3. In the meantime, the membership function of distance variation is given by β V L D ( Z ( Δ L ) ) , β L D ( Z ( Δ L ) ) , β M D ( Z ( Δ L ) ) , and  β H D ( Z ( Δ L ) ) . Finally, the membership functions of threshold output is given by β t h i ( Z ( Δ T B E R ) ) , i 1 , 2 , , 8 , having width σ = 0.2 and μ ranging from 1 to 8, as shown in Figure 6.

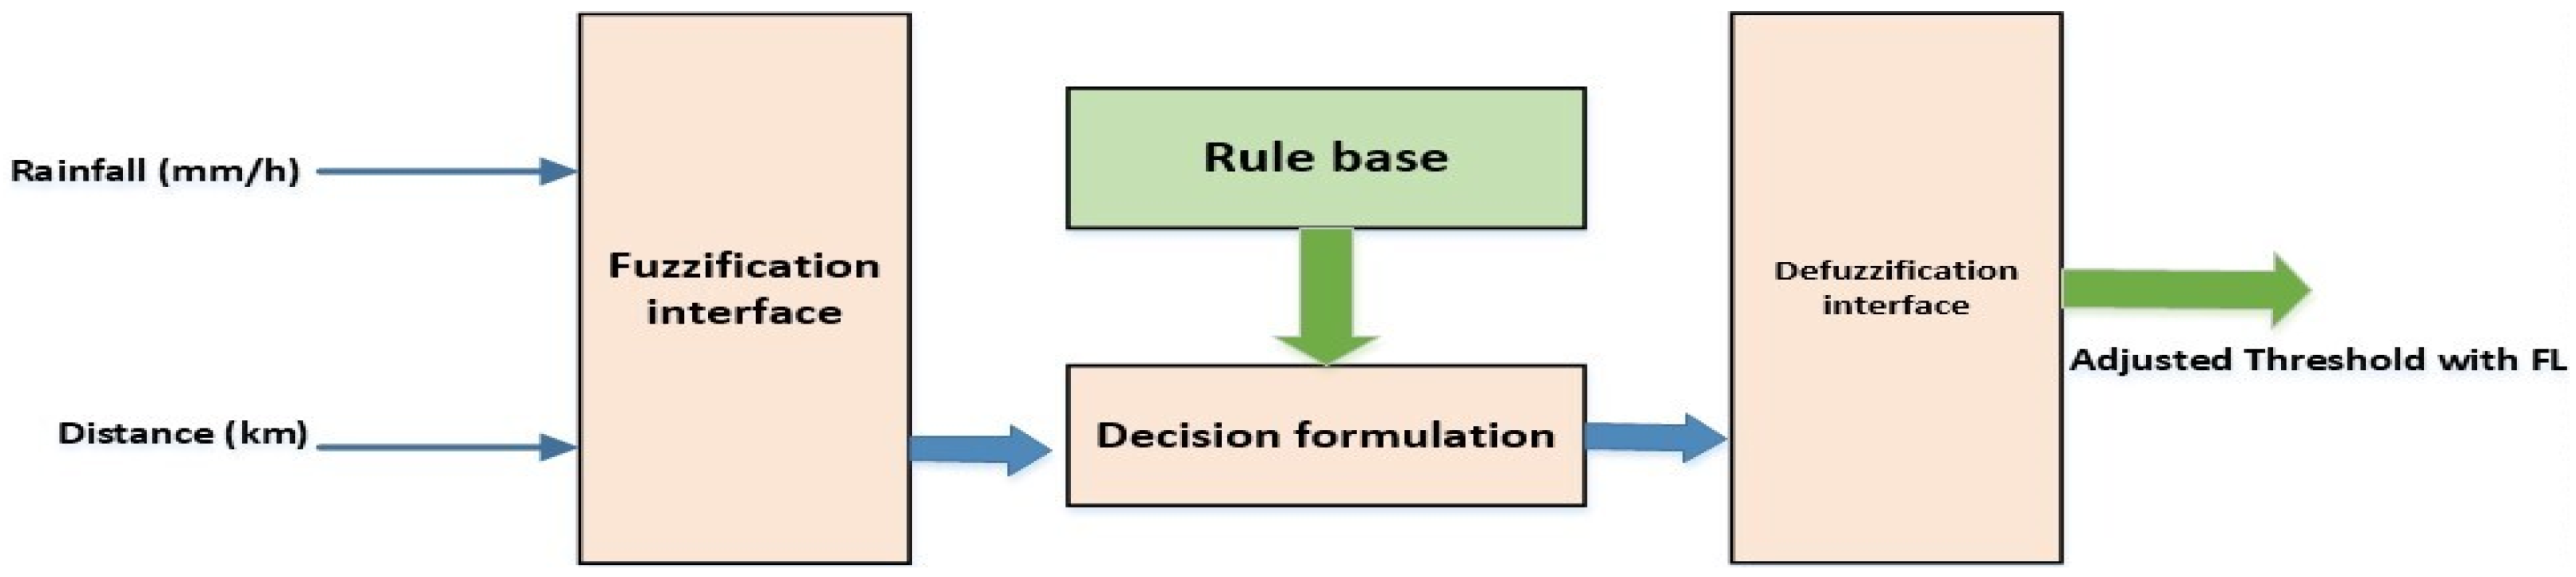
3.4. Fuzzy Rule Base and Inference Mechanism

After establishing the fuzzy inputs and output membership functions, the decision-making logic is implemented. In this study, the Mamdani [22,26] method is used as a fuzzy inference technique. Therefore, the IF–THEN rules are used to represent relationships between variables. A fuzzy IF–THEN rule is illustrated as follows: if the “rain” is low (LR) and the “distance” is low (LD), then the “threshold should be Th8”. If the “rain” is low (HR) and the “distance” is high (HD), then the “threshold should be Th1”. The truth tables related to a fuzzy rule based on the proposed system for (rain; distance) and (fog; distance) are tabulated in Table 3 and Table 4. These rules are shown as a fuzzy inference diagram in Figure 7, tuning the inputs accordingly.

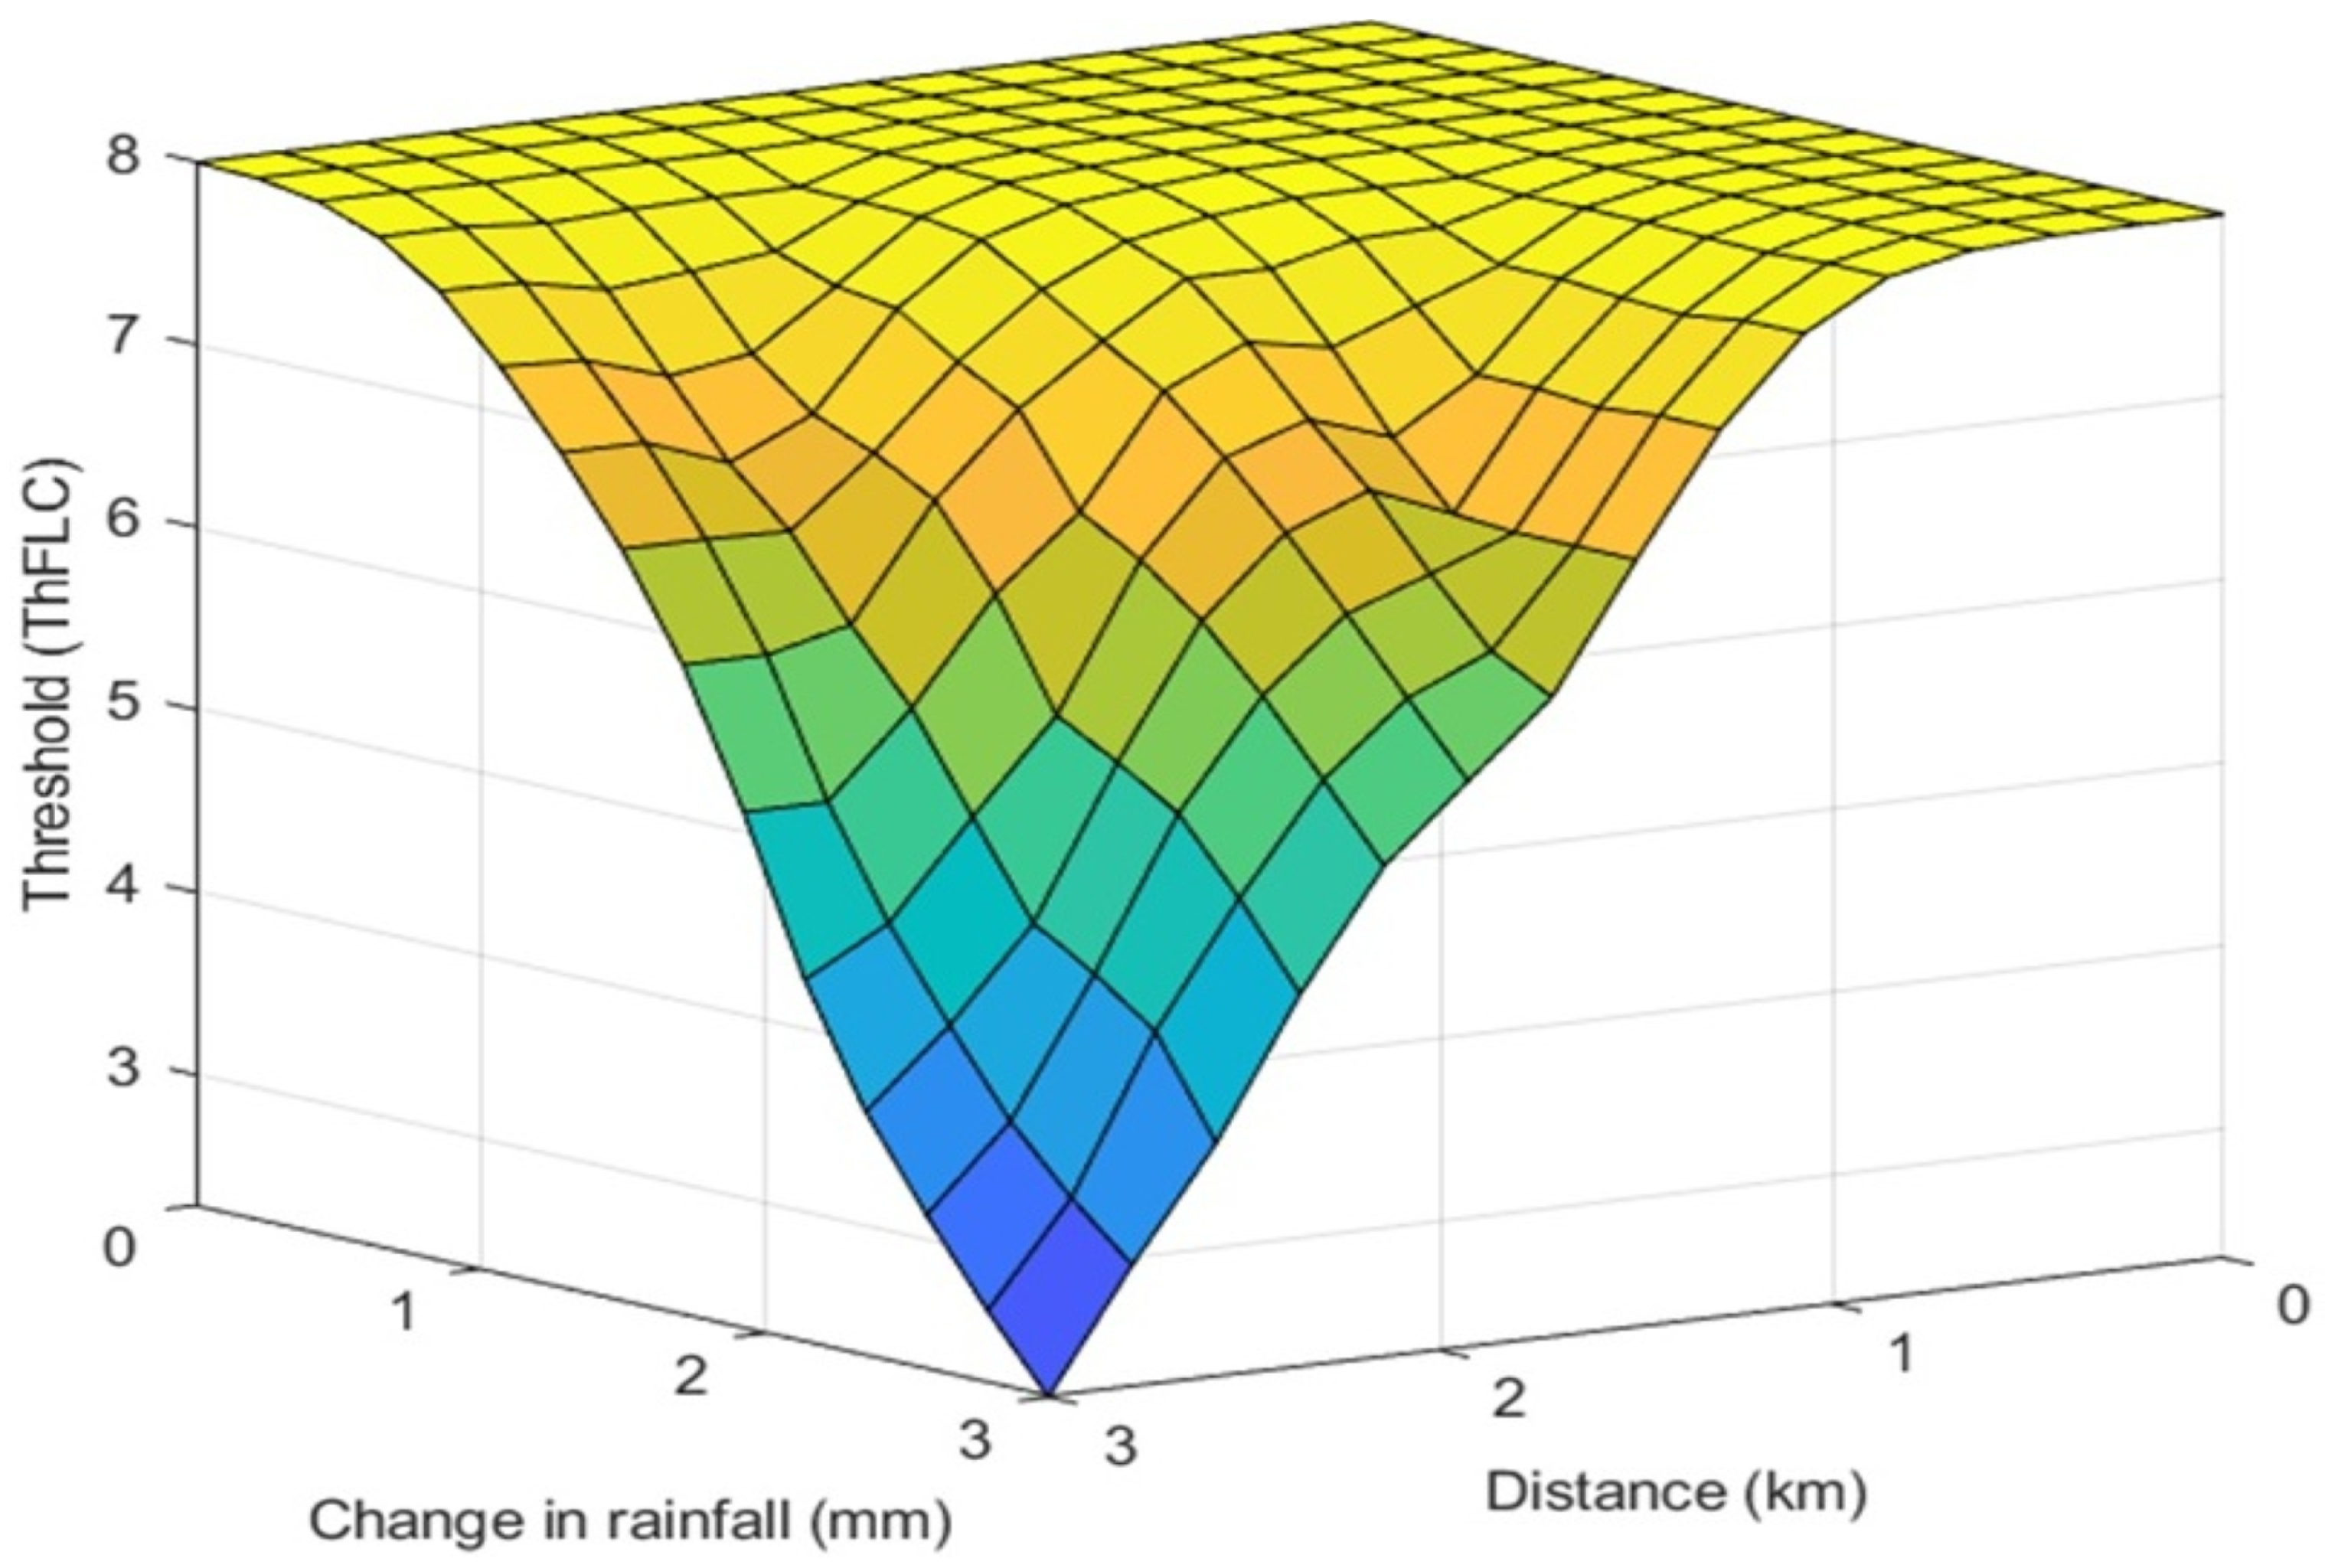
3.5. Adaptive BER Threshold Adjustment Mechanism for FSO-FLC-OCDMA Receivers

The adaptive behavior of the FSO receiver is driven by the interaction between the actual bit error rate (BER) and the dynamically computed Fuzzy BER Threshold (Fuzzy T-BER). To illustrate the overall control strategy visually, the adaptive process is depicted in Figure 8. Based on the logic shown in Figure 8, the full adaptive thresholding mechanism is implemented using two core functions described in Algorithms 1 and 2. These are detailed below.
Algorithm 1 Dynamic BER threshold adjustment.
Input: rainfall rate, fog density, distance
Input: SSM priorities (w, L, K, ⋯)
Output: Fuzzy T B E R = Fuzzy BER threshold
Output: adjustments = {Dynamic Threshold Adjustment; Receiver Gain Control; Noise Filtering}
Output: Request
Define current R , current F , and current D
Define Low = [ 10 24 , 10 9 ], Medium = [ 10 9 , 10 6 ], High = [ 10 6 , 10 3 ]
Define Control B E R , Fuzzy T B E R , actual B E R , and Request f u z z y c o n t r o l
1 Step 1: Define Fuzzy Membership Functions
rain = FuzzyVariable(“Rain”, Light = [0; 10], Moderate = [10; 20], Heavy = [20; 30])
fog = FuzzyVariable(“Fog”, Light = [0, 5], medium = [5; 15], Heavy = [15; 30])
distance = FuzzyVariable(“Distance”, VL = [0; 0.5], LD = [0.5; 1], MD = [1; 1.5], HD = [1.5; 2])
2 Step 2: Define fuzzy output variable for dynamic BER threshold (T-BER)
T B E R = F u z z y V a r i a b l e ( T B E R ,   L o w ,   M e d i u m ,   H i g h )
3 Step 3: Define fuzzy rules for T B E R
rules =
3.1 FuzzyRule(if Rain.high & Fog.high & Distance.long then T-BER.high),
3.2 FuzzyRule(if Rain.medium & Fog.medium & Distance.medium then T-BER.medium),
3.3 FuzzyRule(if Rain.low & Fog.low & Distance.short then T-BER.low),
3.4 …
3.5 …
3.6 FuzzyRule(if Rain.low & Fog.low & Distance.short then T-BER.low)
4 Step 4: Create fuzzy system
Control B E R = FuzzySystem(rules)
5 Step 5: Monitor environmental conditions
5.1 current R = GetCurrentRain()
5.2 current F = GetCurrentFog()
5.3 current D = GetCurrentDistance()
6 Step 6: Calculate dynamic BER threshold (T-BER)
Fuzzy T B E R = Control B E R .compute(rain = current R , fog = current F , distance = current D )
7 Step 7: Monitor actual BER
actual B E R = MeasureActualBER()
8 Step 8: Decision based on BER
if actual B E R > Fuzzy T B E R
adjustments = AdjustReceiverSettings(rain = current R , fog = current F , distance = current D )
else:
Request = MaintainSettings()
9 Step 9:
return adjustments
return Request
Algorithm 2 Receiver adjustment settings.
Input: currentR = rainfall rate
Input: currentF = fog density
Input: currentD = distance
Output: adjustments = {dynamic_threshold; gain_control; N_filtering}
Step 1: Dynamic Threshold Adjustment
if ( c u r r e n t R > 20 or c u r r e n t F > 15 )
adjustments[‘dynamic_threshold’] = adjust_threshold(level=‘high’)
elsif ( c u r r e n t R > 10 or c u r r e n t F > 5 )
adjustments[‘dynamic_threshold’] = adjust_threshold(level=‘medium’)
else:
adjustments[‘dynamic_threshold’] = adjust_threshold(level=‘low’)
Step 2: Receiver Gain Control
if ( c u r r e n t R > 15 or c u r r e n t F > 10 )
adjustments[‘gain_control’] = enhance_gain(method=‘AGC’, linearity=‘high’)
elsif ( c u r r e n t R < 5 and c u r r e n t F < 5 )
adjustments[‘gain_control’] = maintain_gain()
else
adjustments[‘gain_control’] = enhance_gain(method=‘AGC’, linearity=‘medium’)
Step 3: Advanced Filtering
if ( c u r r e n t R > 15 or c u r r e n t F > 10 or c u r r e n t D > 2 )
adjustments[‘N_filtering’] = apply_advanced_filter(method=‘adaptive_LMS’, intensity=‘high’)
elsif ( c u r r e n t R > 5 or c u r r e n t F > 5 )
adjustments[‘N_filtering’] = apply_advanced_filter(method=‘adaptive_LMS’, intensity=‘medium’)
else
adjustments[‘N_filtering’] = apply_basic_filter(method=‘low_pass’)
Step 4:
return adjustments

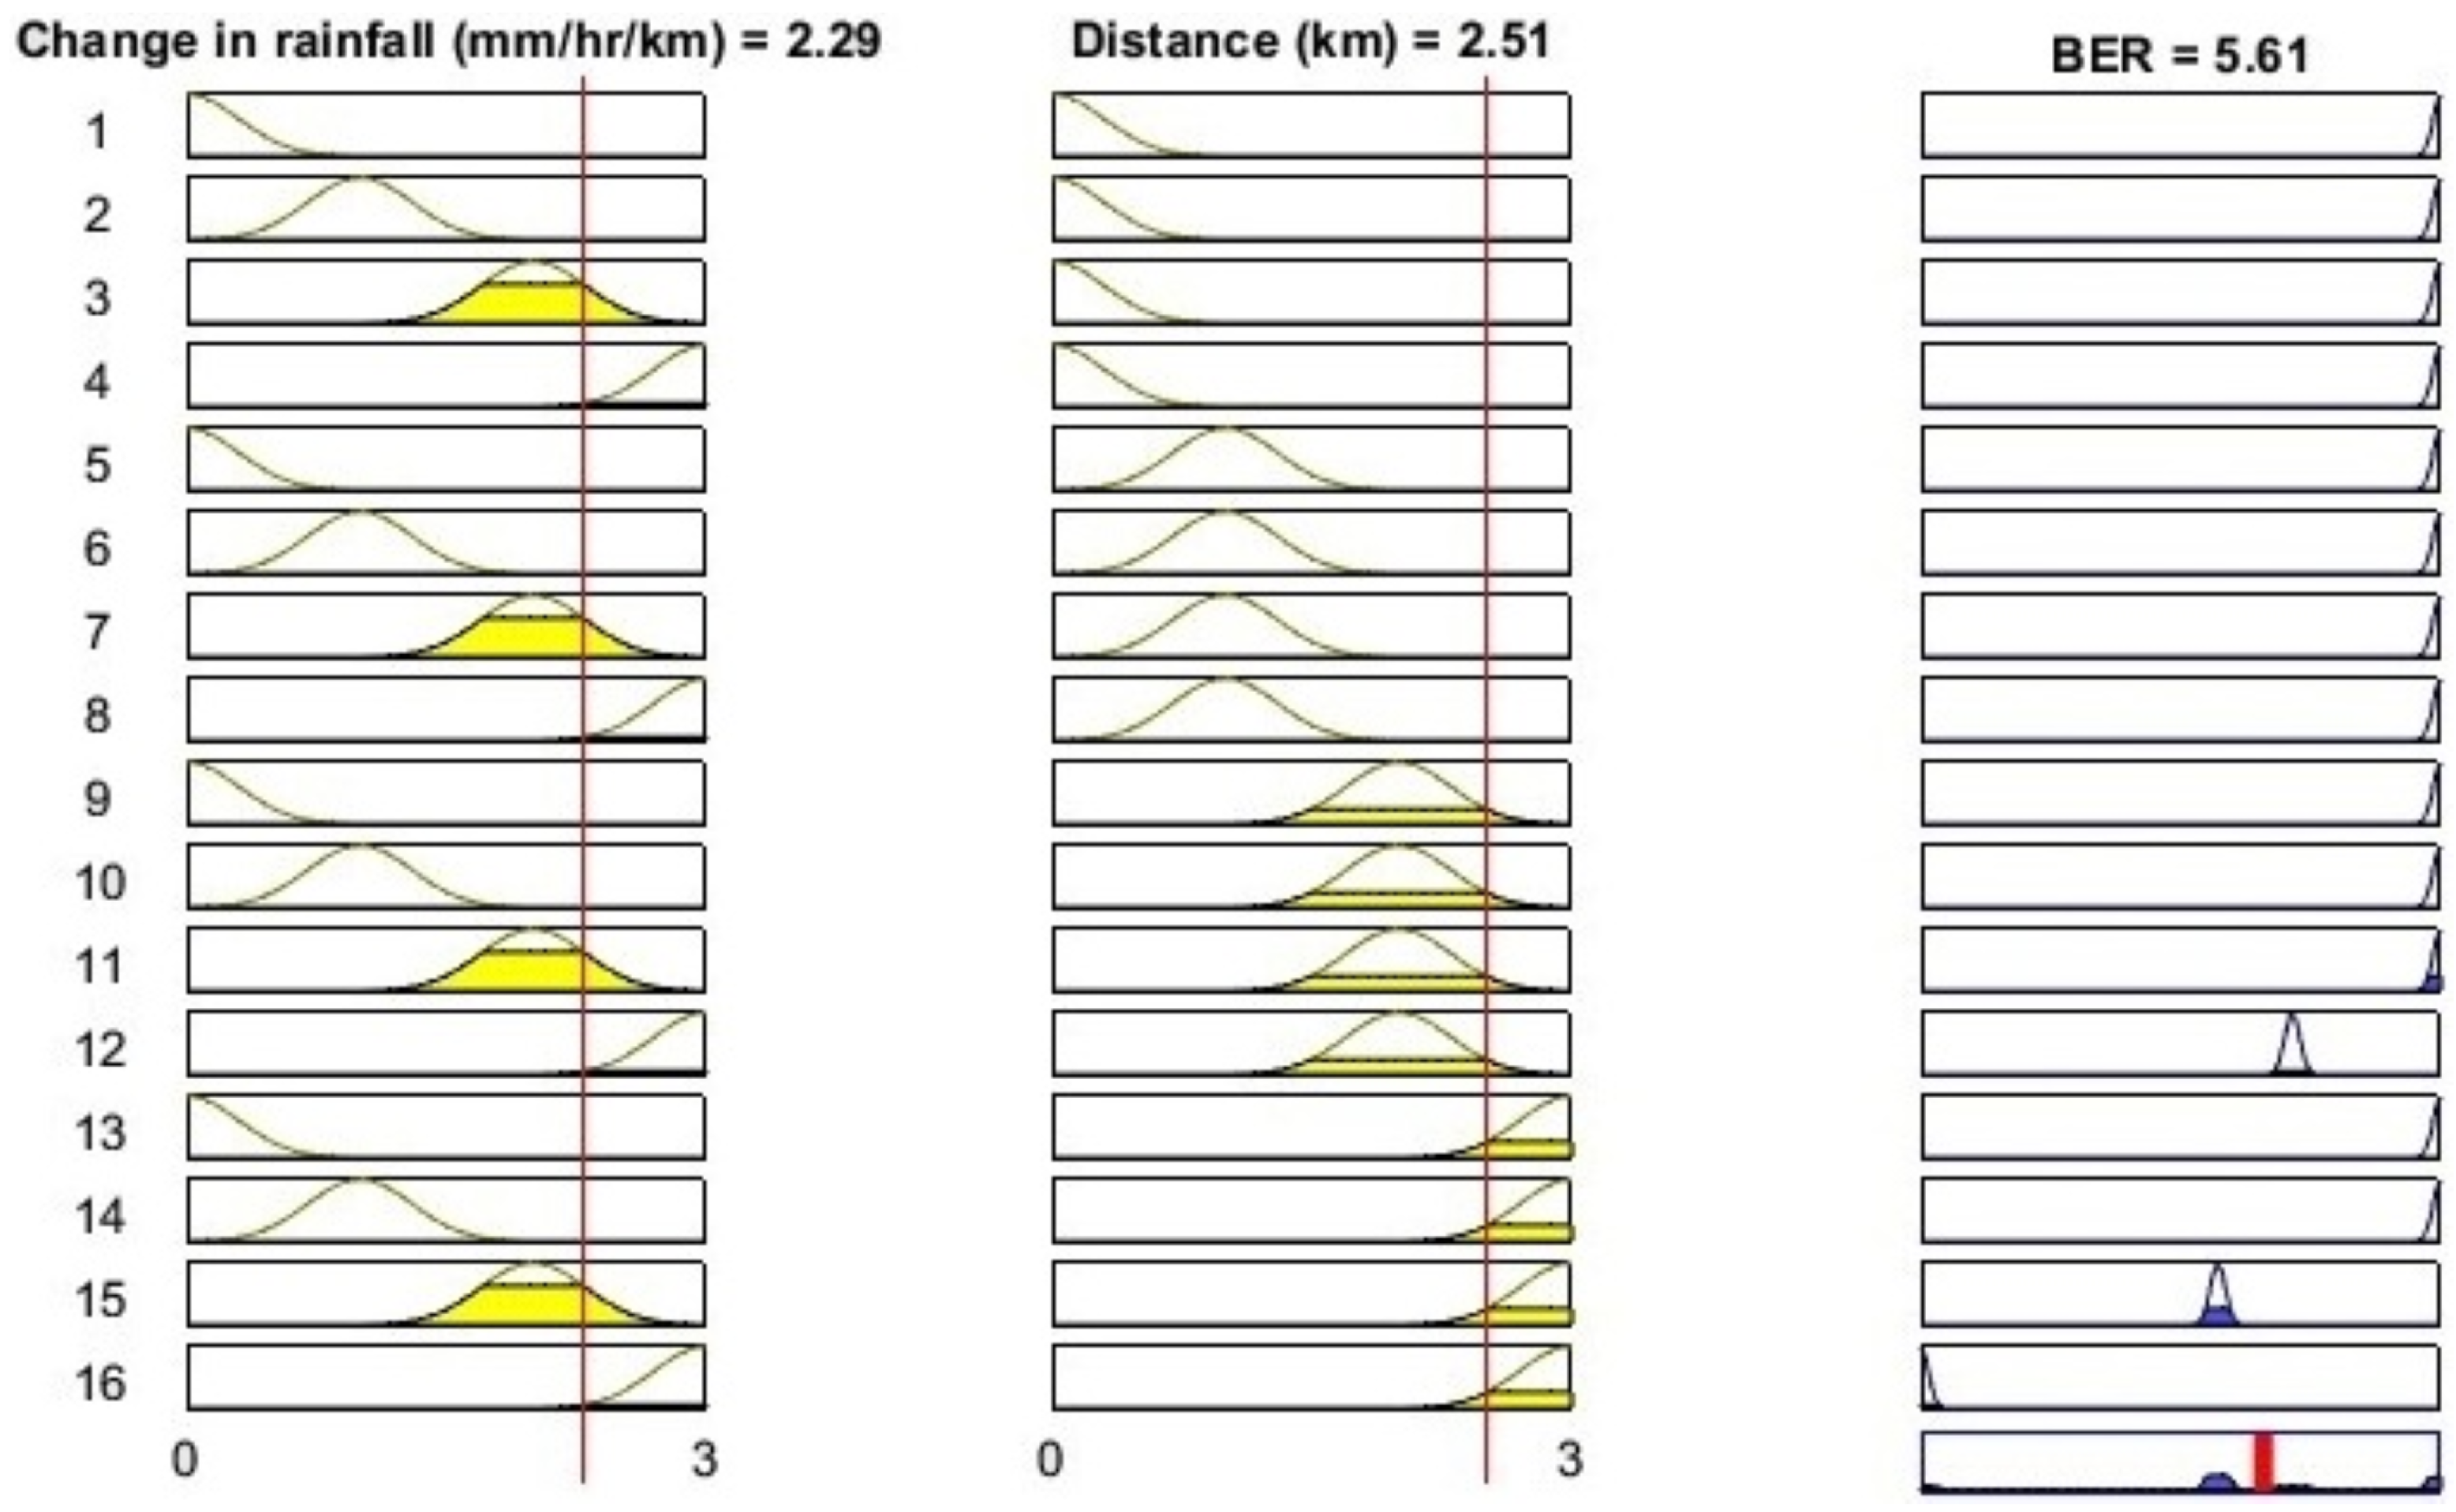
3.5.1. Fuzzy T-BER Computation Using FLC (Algorithm 1)

The following proposed Algorithm 1 outlines the steps for implementing the dynamic BER threshold adjustment using a fuzzy logic system in FSO. It is decomposed into eight distinct steps, each carefully designed to ensure the process of control is efficient.
  • Step 1—Define Fuzzy Membership Functions: Establish fuzzy membership functions that represent linguistic variables related to environmental factors, signal quality, and BER. Therefore, fuzzy sets (very low, low, medium, and high) for rain, fog, distance, and BER will be defined.
  • Step 2—Define the fuzzy output variable T-BER, which categorizes the dynamic BER threshold into three linguistic levels: Low, Medium, and High based on the severity of environmental conditions.
  • Step 3—Define Fuzzy Rules for T-BER: Develop a set of fuzzy logic rules to determine the target BER (T-BER) based on input conditions, using the defined membership functions.
  • Step 4—Create Fuzzy System: Build a fuzzy inference system (FIS) that processes the defined rules and membership functions to calculate outputs dynamically.
  • Step 5—Monitor Environmental Conditions: Continuously track environmental parameters such as rain ( current R ), fog ( current F ), and distance ( current D ) that could affect the signal in the FSO communication system.
  • Step 6—Calculate Dynamic BER Threshold: Using the fuzzy system, compute a dynamic threshold for BER based on the monitored environmental conditions and the defined rules. In the FSO system in this work, the fuzzy logic controller utilizes the max–min inference method. In this approach, the fuzzy operator AND selects the minimum value from the antecedents, while for aggregation, the maximum value is used. The defuzzification process then converts the fuzzy output from the inference mechanism into a precise value for the dynamic threshold device ( Fuzzy T B E R ). The Center of Gravity (COG) method is employed for defuzzification, as it delivers an accurate result by calculating the Weighted Average of multiple output membership functions [26].
    T B E R = G O C = x β Z ( x ) x d x x β Z ( x ) d x , ( if x is continuous )
    T B E R = G O C = x β Z ( x ) x d x x β Z ( x ) d x , ( if x is discrete )
  • Step 7—Monitor Actual BER: Regularly measure the actual BER of the FSO transceiver to detect fluctuations or changes in signal quality. The actual B E R is measured in real-time based on the current values of rain, fog, and distance ( current R , current F , and current D ).
  • Step 8—Decision Based on BER: If the measured BER ( actual B E R ) exceeds the dynamic threshold ( Fuzzy T B E R ) set by the fuzzy logic system, the system will trigger adjustments to improve communication quality (adjustments= AdjustReceiverSettings()). These actions can include three mechanisms: Dynamic Threshold Adjustment, Receiver Gain Control, or Noise Filtering. When the BER is below the dynamic threshold, the system maintains the current settings or optimizes resources (Request = MaintainSettings()).

3.5.2. Adaptive Receiver Control (Algorithm 2)

In this work, the adaptive control mechanism focuses on the receiver side of the SSM SAC-OCDMA system. The functions AdjustReceiverSettings() and MaintainSettings() are defined to dynamically optimize receiver performance based on real-time environmental conditions and BER monitoring.
  • AdjustReceiverSettings() function:
The AdjustReceiverSettings() function is designed to dynamically optimize the performance of the SSM SAC-OCDMA receiver when the actual BER exceeds the dynamic threshold ( Fuzzy T B E R ) set by the FLC system, indicating degraded communication quality due to adverse environmental conditions. The function includes three key mechanisms: Dynamic Threshold Adjustment, Receiver Gain Control, and Advanced Filtering. The Dynamic Threshold Adjustment mechanism, as defined in step 1 in Algorithm 2, modifies the BER detection threshold in real time based on environmental conditions such as rainfall rate, fog density, and propagation distance. By increasing the threshold value in severe conditions and lowering its value during favorable conditions, the system maintains an optimal balance between sensitivity and reliability, ensuring accurate data detection.
The second mechanism, Receiver Gain Control, as defined in step 2 in Algorithm 2, optimizes the amplification of the received signal. In conditions like heavy rain or dense fog, the system dynamically increases the receiver’s gain to enhance the SNR and to improve the clarity of the received signal. Similarly, in the stable conditions, the gain is maintained or slightly reduced to prevent noise amplification. To achieve this, Receiver Gain Control leverages Automatic Gain Control (AGC) and linear amplification techniques. AGC automatically adjusts the gain based on the signal strength, while maintaining linearity ensures that the signal shape remains intact, and it also preserves data integrity even under fluctuating conditions. Additionally, linear amplifiers ensure that the signal is amplified without introducing distortion, preserving the original signal shape, and maintaining data integrity even in fluctuating transmission environments.
The final mechanism, Advanced Filtering, as defined in Step 3 in Algorithm 2, plays a critical role in mitigating noise and interference, particularly under harsh environmental conditions. This mechanism dynamically applies filtering techniques based on real-time assessments of environmental factors such as rainfall rate, fog density, and propagation distance. In severe conditions, such as heavy rain or dense fog, the system utilizes adaptive filters to effectively suppress noise and enhance signal quality. In moderate conditions, it applies balanced filtering strategies that optimize noise reduction while maintaining system efficiency. Under stable conditions, basic filters, such as low-pass filters, are employed to minimize residual noise without adding unnecessary processing overhead.
To achieve noise reduction without distorting the original signal, the system leverages adaptive filtering techniques, notably the Least Mean Squares (LMS) algorithm. This adaptive approach allows the filter parameters to be dynamically adjusted in response to fluctuating noise levels, ensuring effective interference suppression while preserving the integrity of the signal. By continuously adapting to changing conditions, the Advanced Filtering mechanism significantly contributes to maintaining a low BER and enhancing the overall robustness and reliability of the SSM SAC-OCDMA receiver system.
  • MaintainSettings() function:
The MaintainSettings() function is designed to maintain the current receiver configuration when the BER is within acceptable limits. In this case, the system assumes that no further adjustments are necessary as long as performance remains stable.

3.6. Computational Efficiency and Real-Time Feasibility of the FLC

To ensure real-time adaptability in FSO communication systems, we analyze the computational efficiency and execution time of the proposed FLC system. The execution time of the FLC system directly impacts its ability to dynamically adjust the BER threshold based on varying environmental conditions such as rain, fog, and propagation distance.

3.6.1. Computational Complexity Analysis

The FLC system processes three input variables (distance, rain, and fog), which are respectively classified into four, three, and three states, making a total of thirty-six fuzzy rules. The computational cost of each processing stage is as follows:
  • Fuzzification:
Converts crisp inputs into fuzzy sets using triangular and trapezoidal membership functions, requiring basic arithmetic operations. The complexity is O ( 1 ) due to the fixed number of inputs.
  • Inference Mechanism:
Evaluates 36 fuzzy rules using Mamdani inference, which involves minimum/maximum operations. The computational complexity remains O ( 36 ) O ( 1 ) , ensuring efficient execution.
  • Defuzzification:
Uses the Centroid Method to compute the BER threshold, requiring a weighted sum over three output membership functions (low, medium, high). The complexity is O ( 3 ) O ( 1 ) .

3.6.2. Execution Time Estimation

Experimental results were executed on an Intel Core i7-1165G7 (2.80 GHz) computer with MATLAB’s fuzzy logic toolbox, which confirms that the FLC system takes 1–4 ms execution time per decision cycle. The breakdown of execution time is as follows:
  • Fuzzification: 0.2–1 ms
  • Inference (36-rule evaluation): 0.5–2 ms
  • Defuzzification (Centroid Method, 3 MFs): 0.3–1 ms
This execution time ensures real-time responsiveness, allowing the system to adapt to environmental variations without noticeable processing delays. Given its low computational complexity and execution time, the FLC system remains lightweight, making it feasible for implementation in low-power embedded platforms, including DSPs and FPGAs. Future optimizations may include hardware acceleration (FPGA/DSP) and rule reduction techniques to further enhance real-time performance.

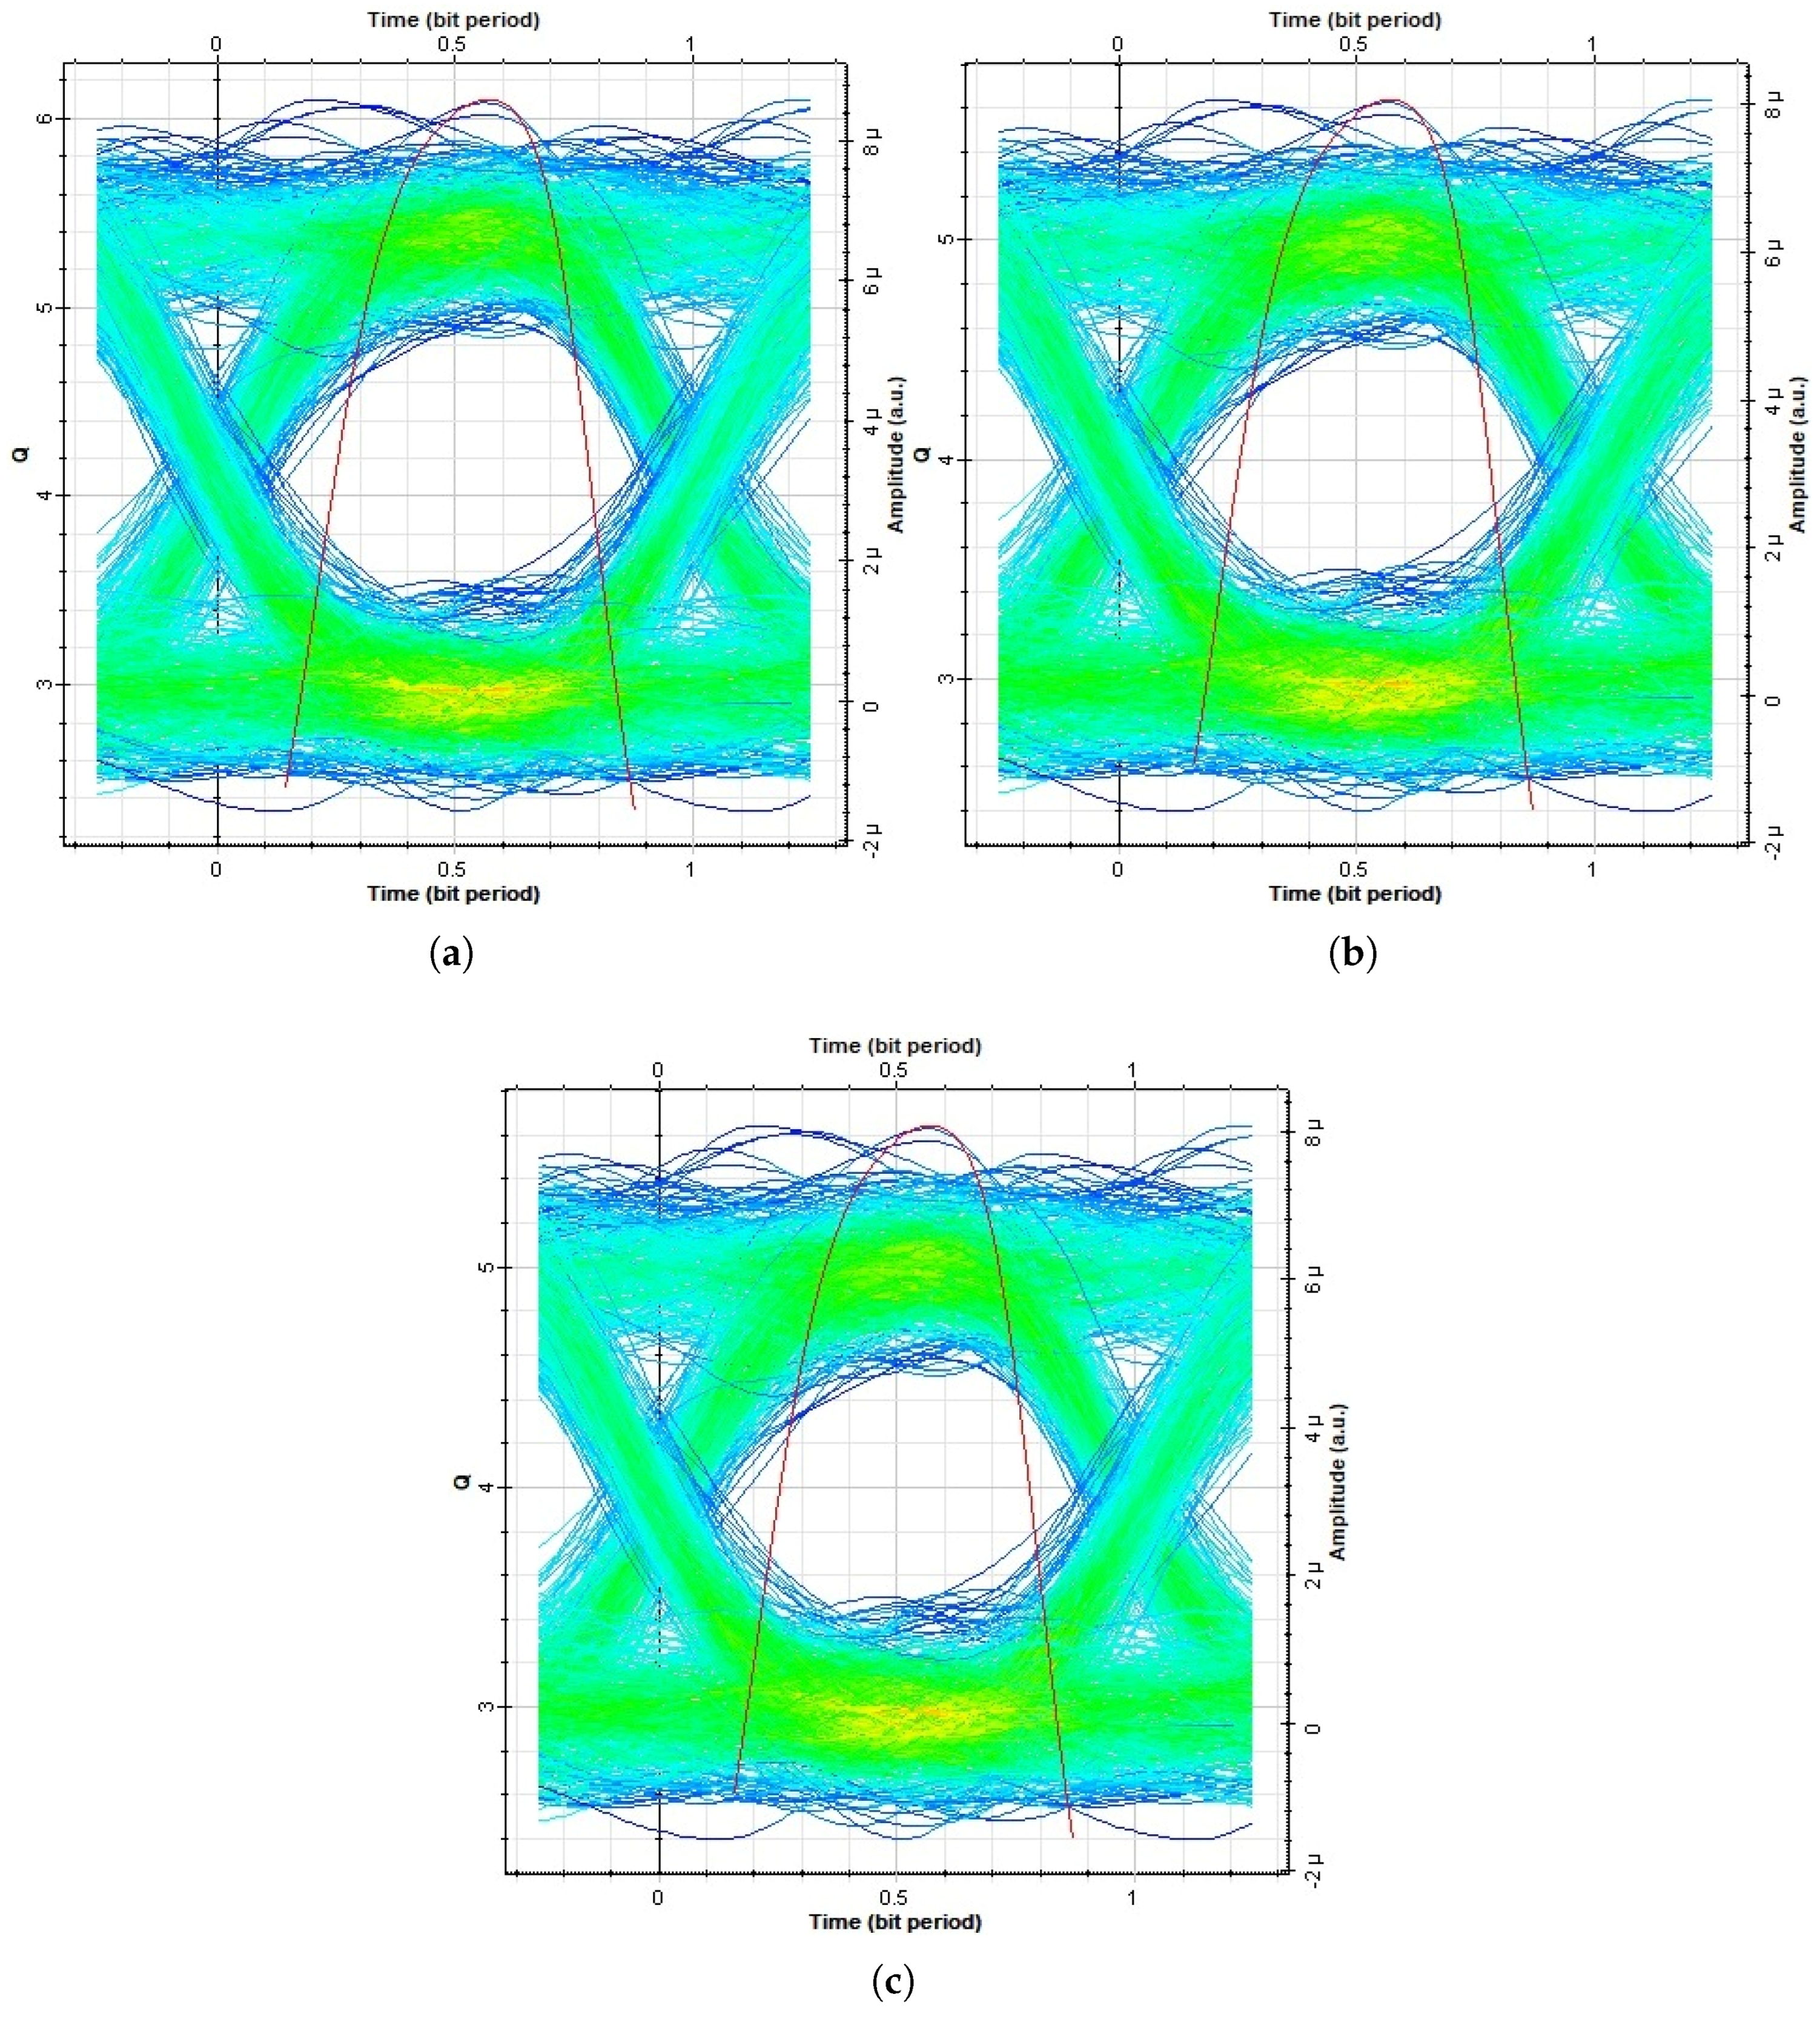
4. Results and Discussion

This section presents the results in two parts. The first subsection discusses the system’s performance under foggy and rainy weather conditions without FLC. The second subsection demonstrates the performance improvements achieved by incorporating FLC under the same conditions.

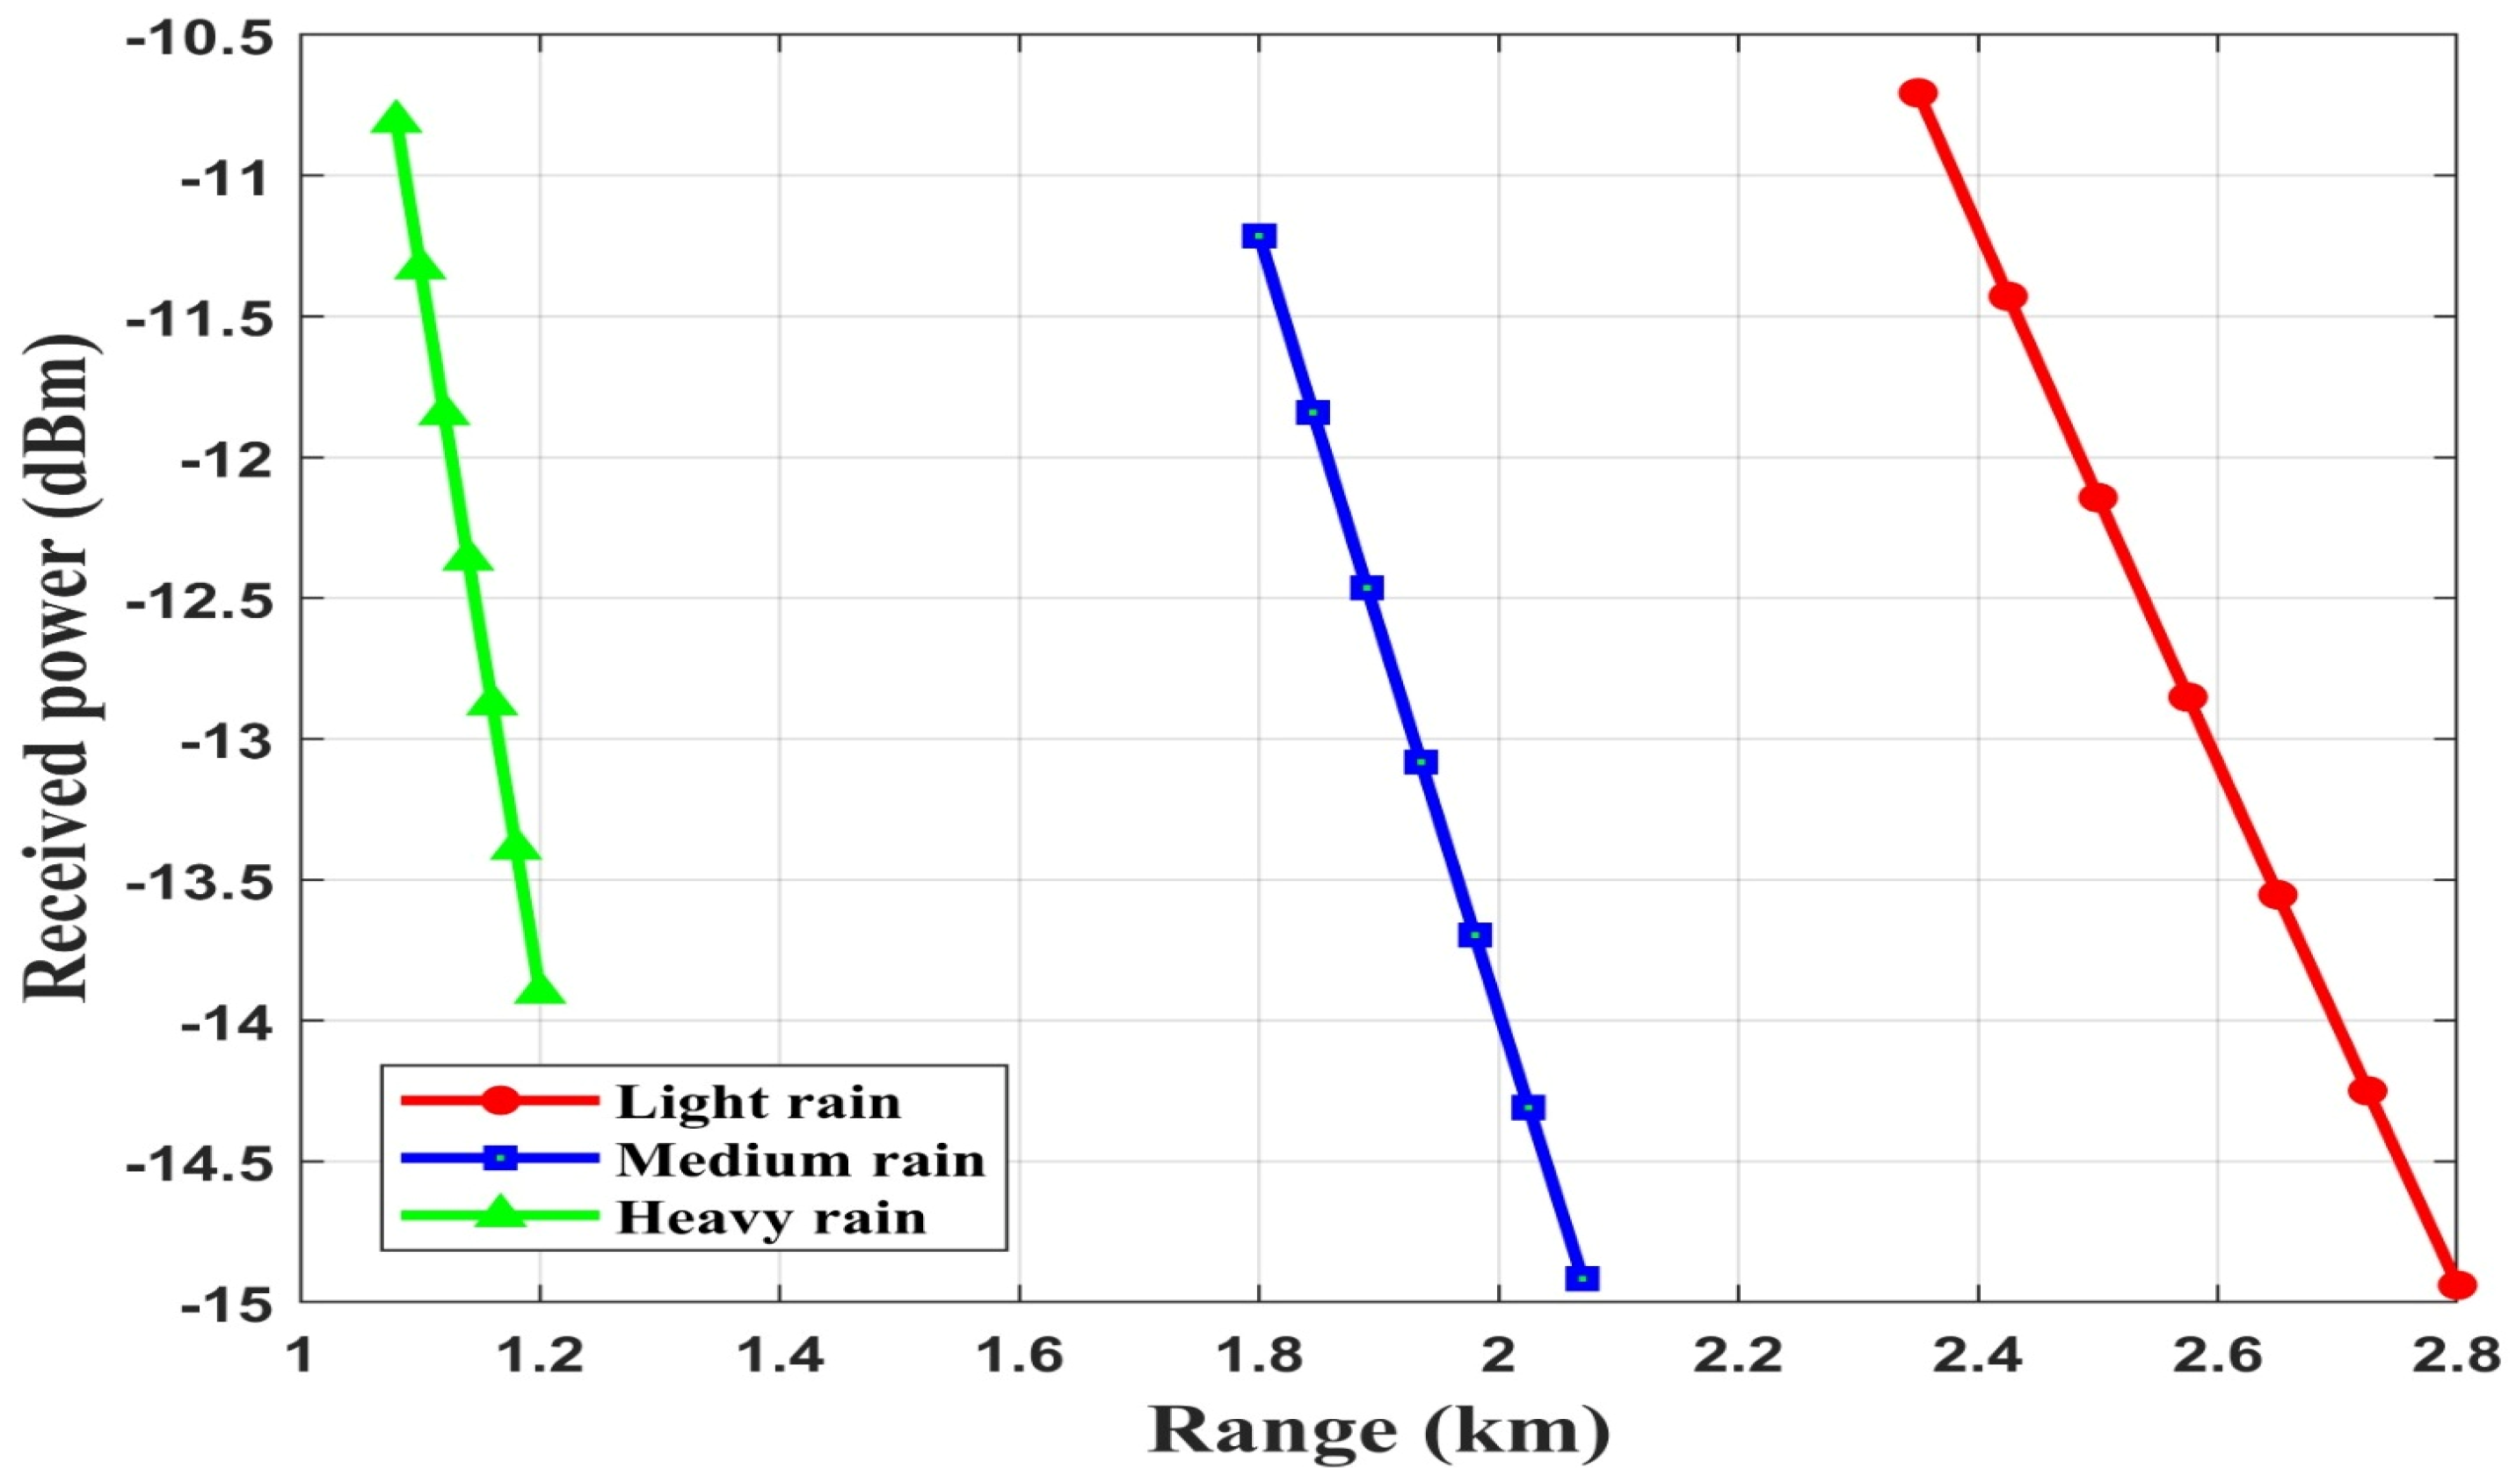
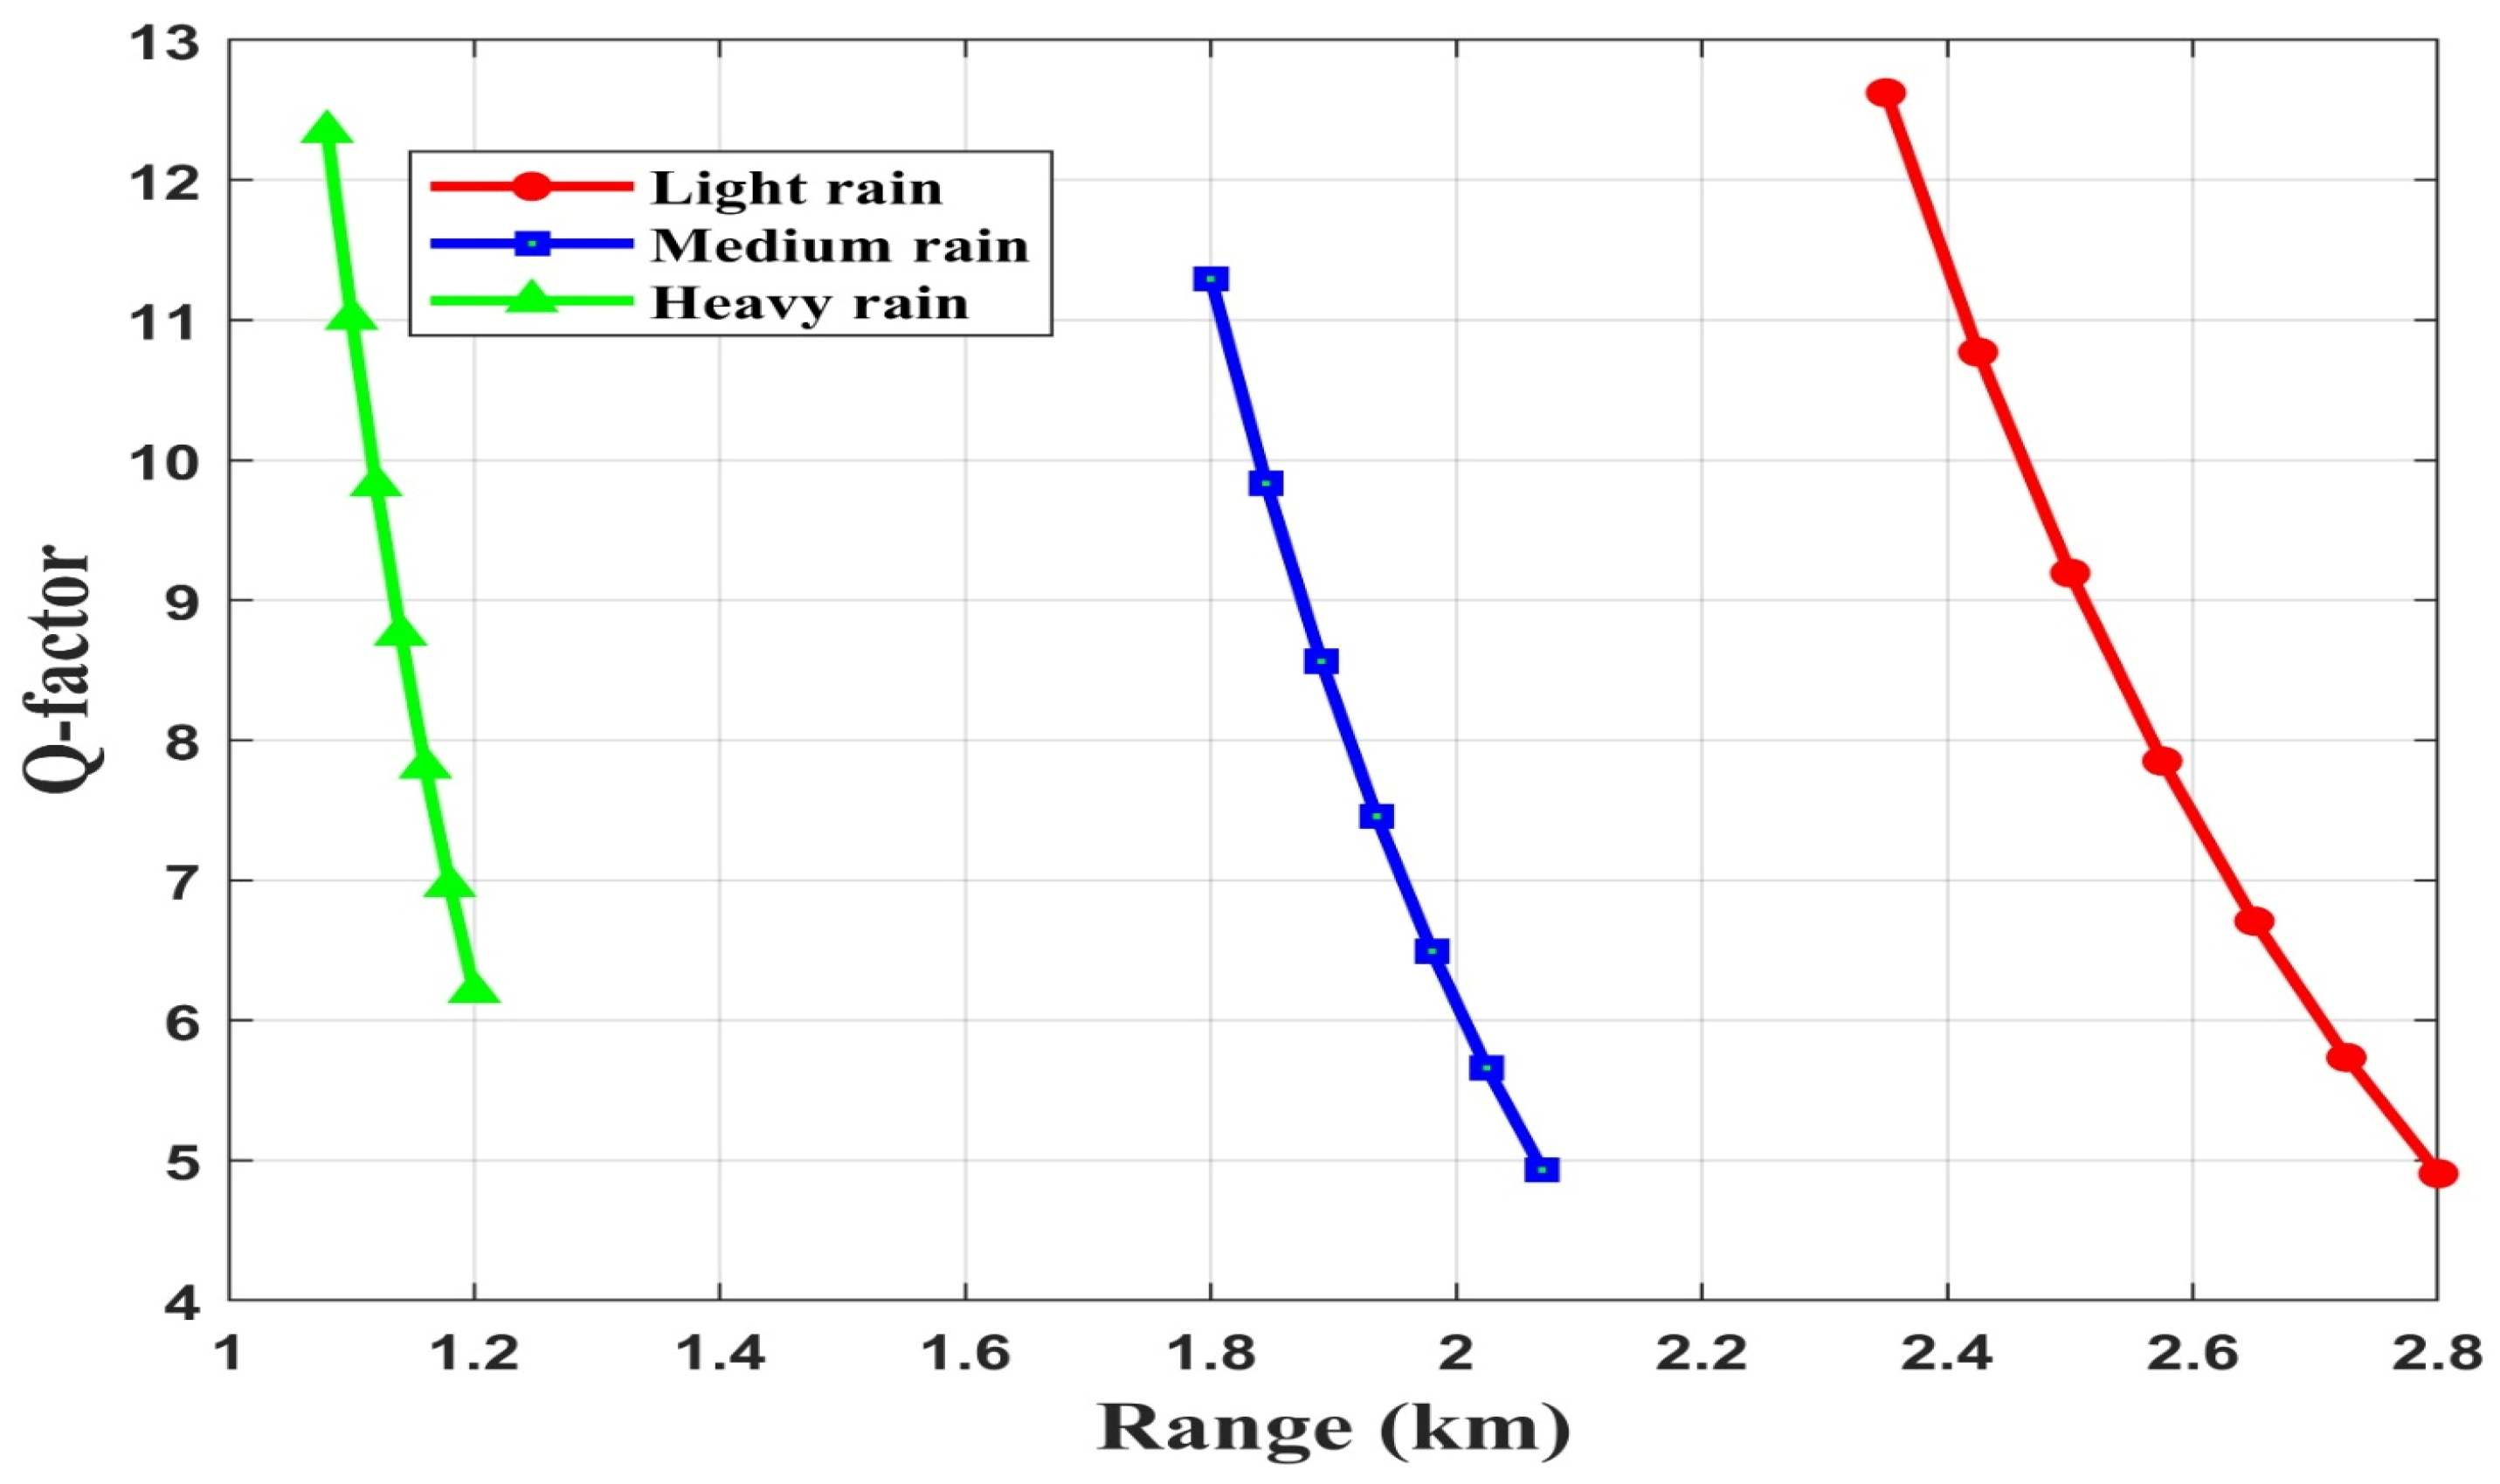
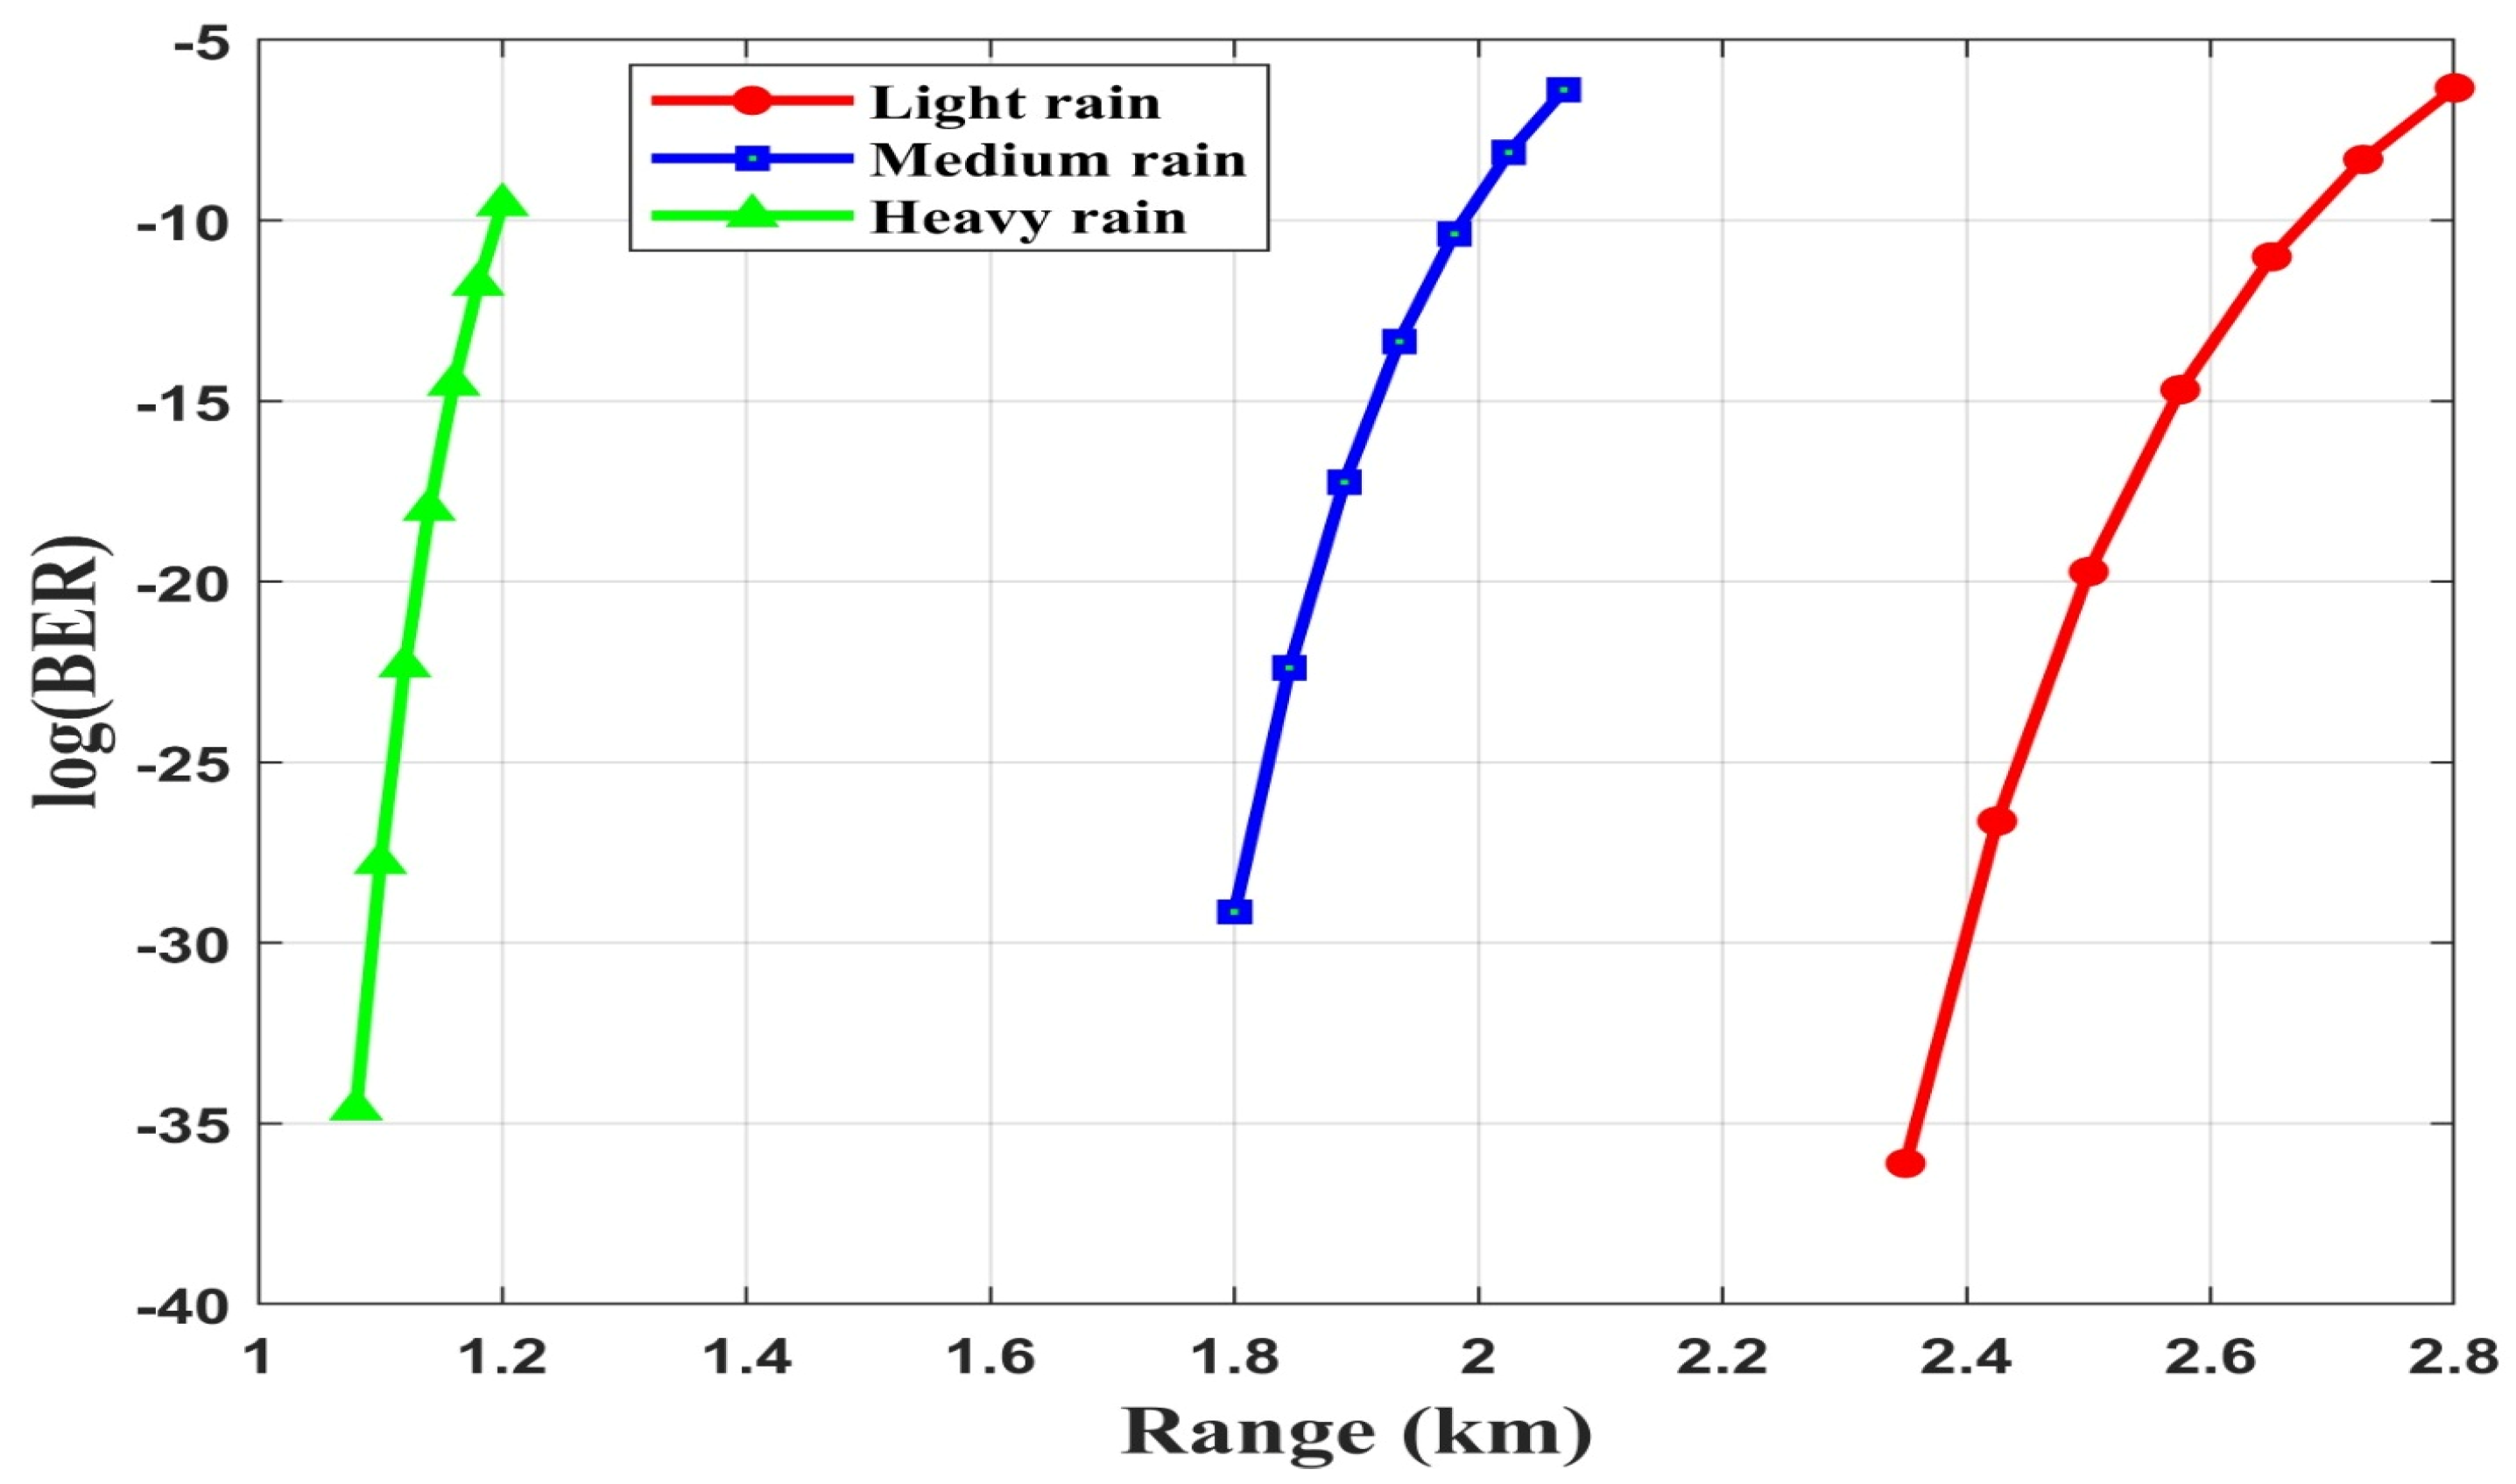
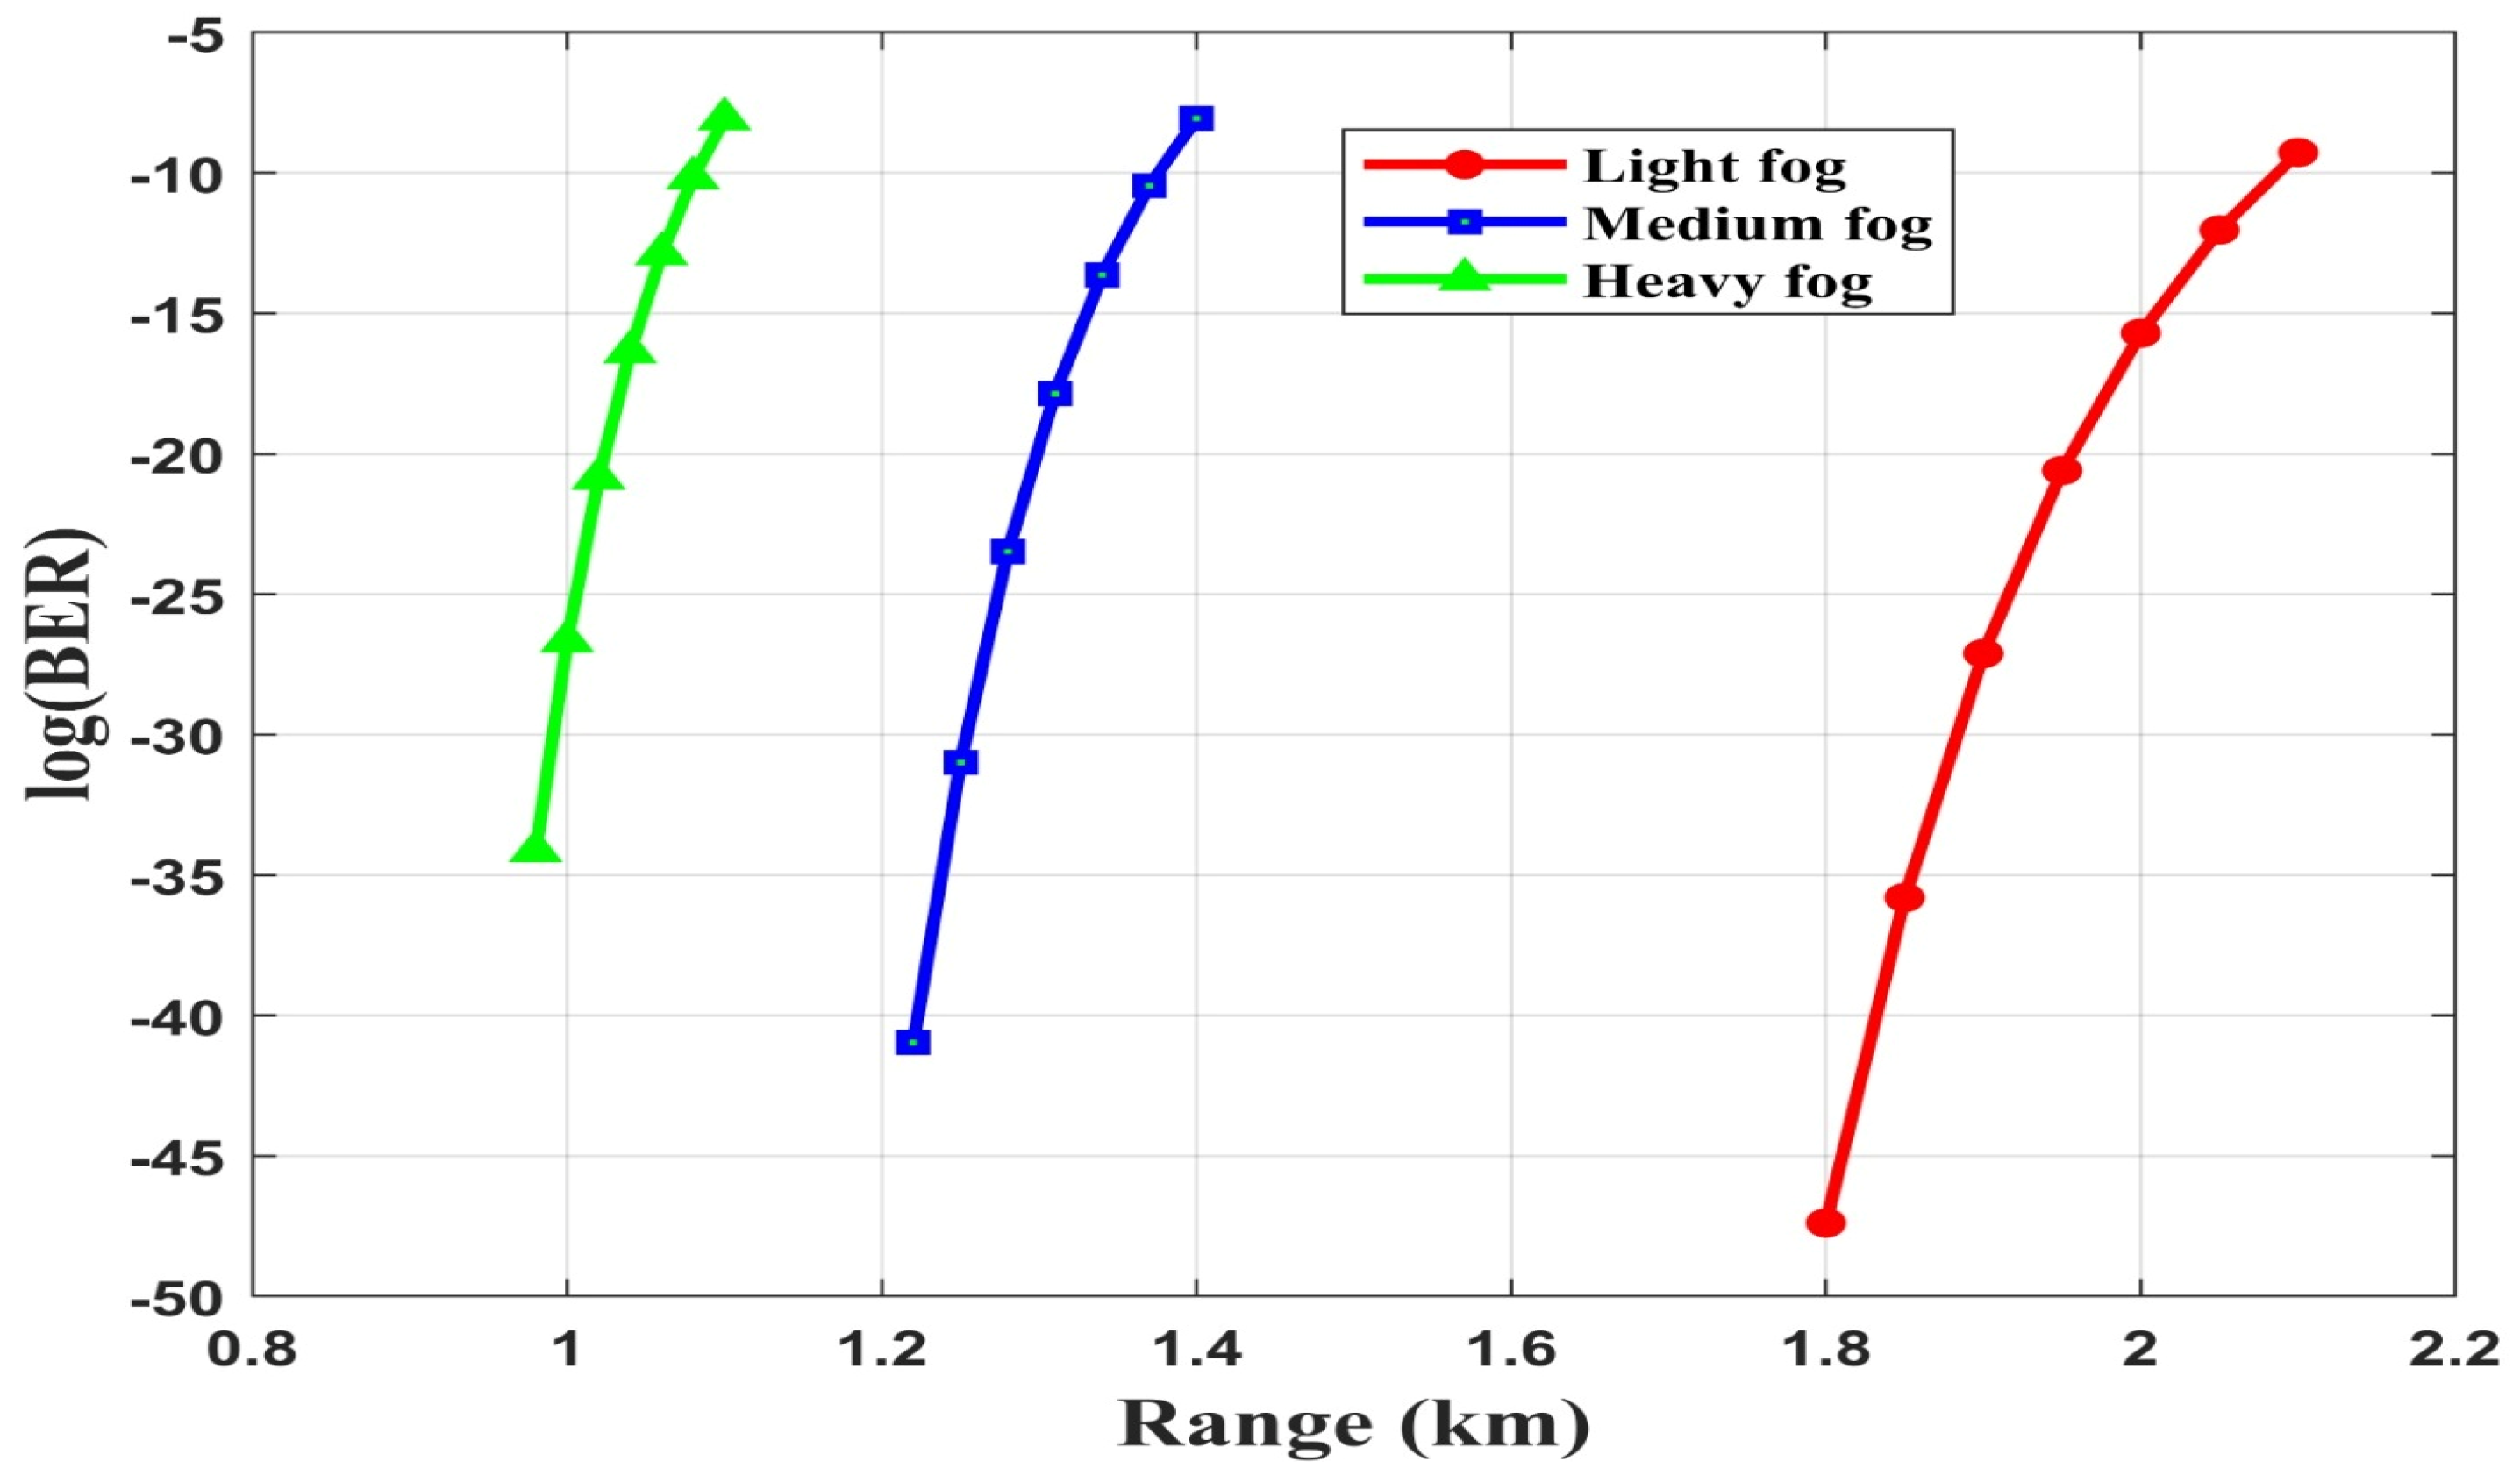
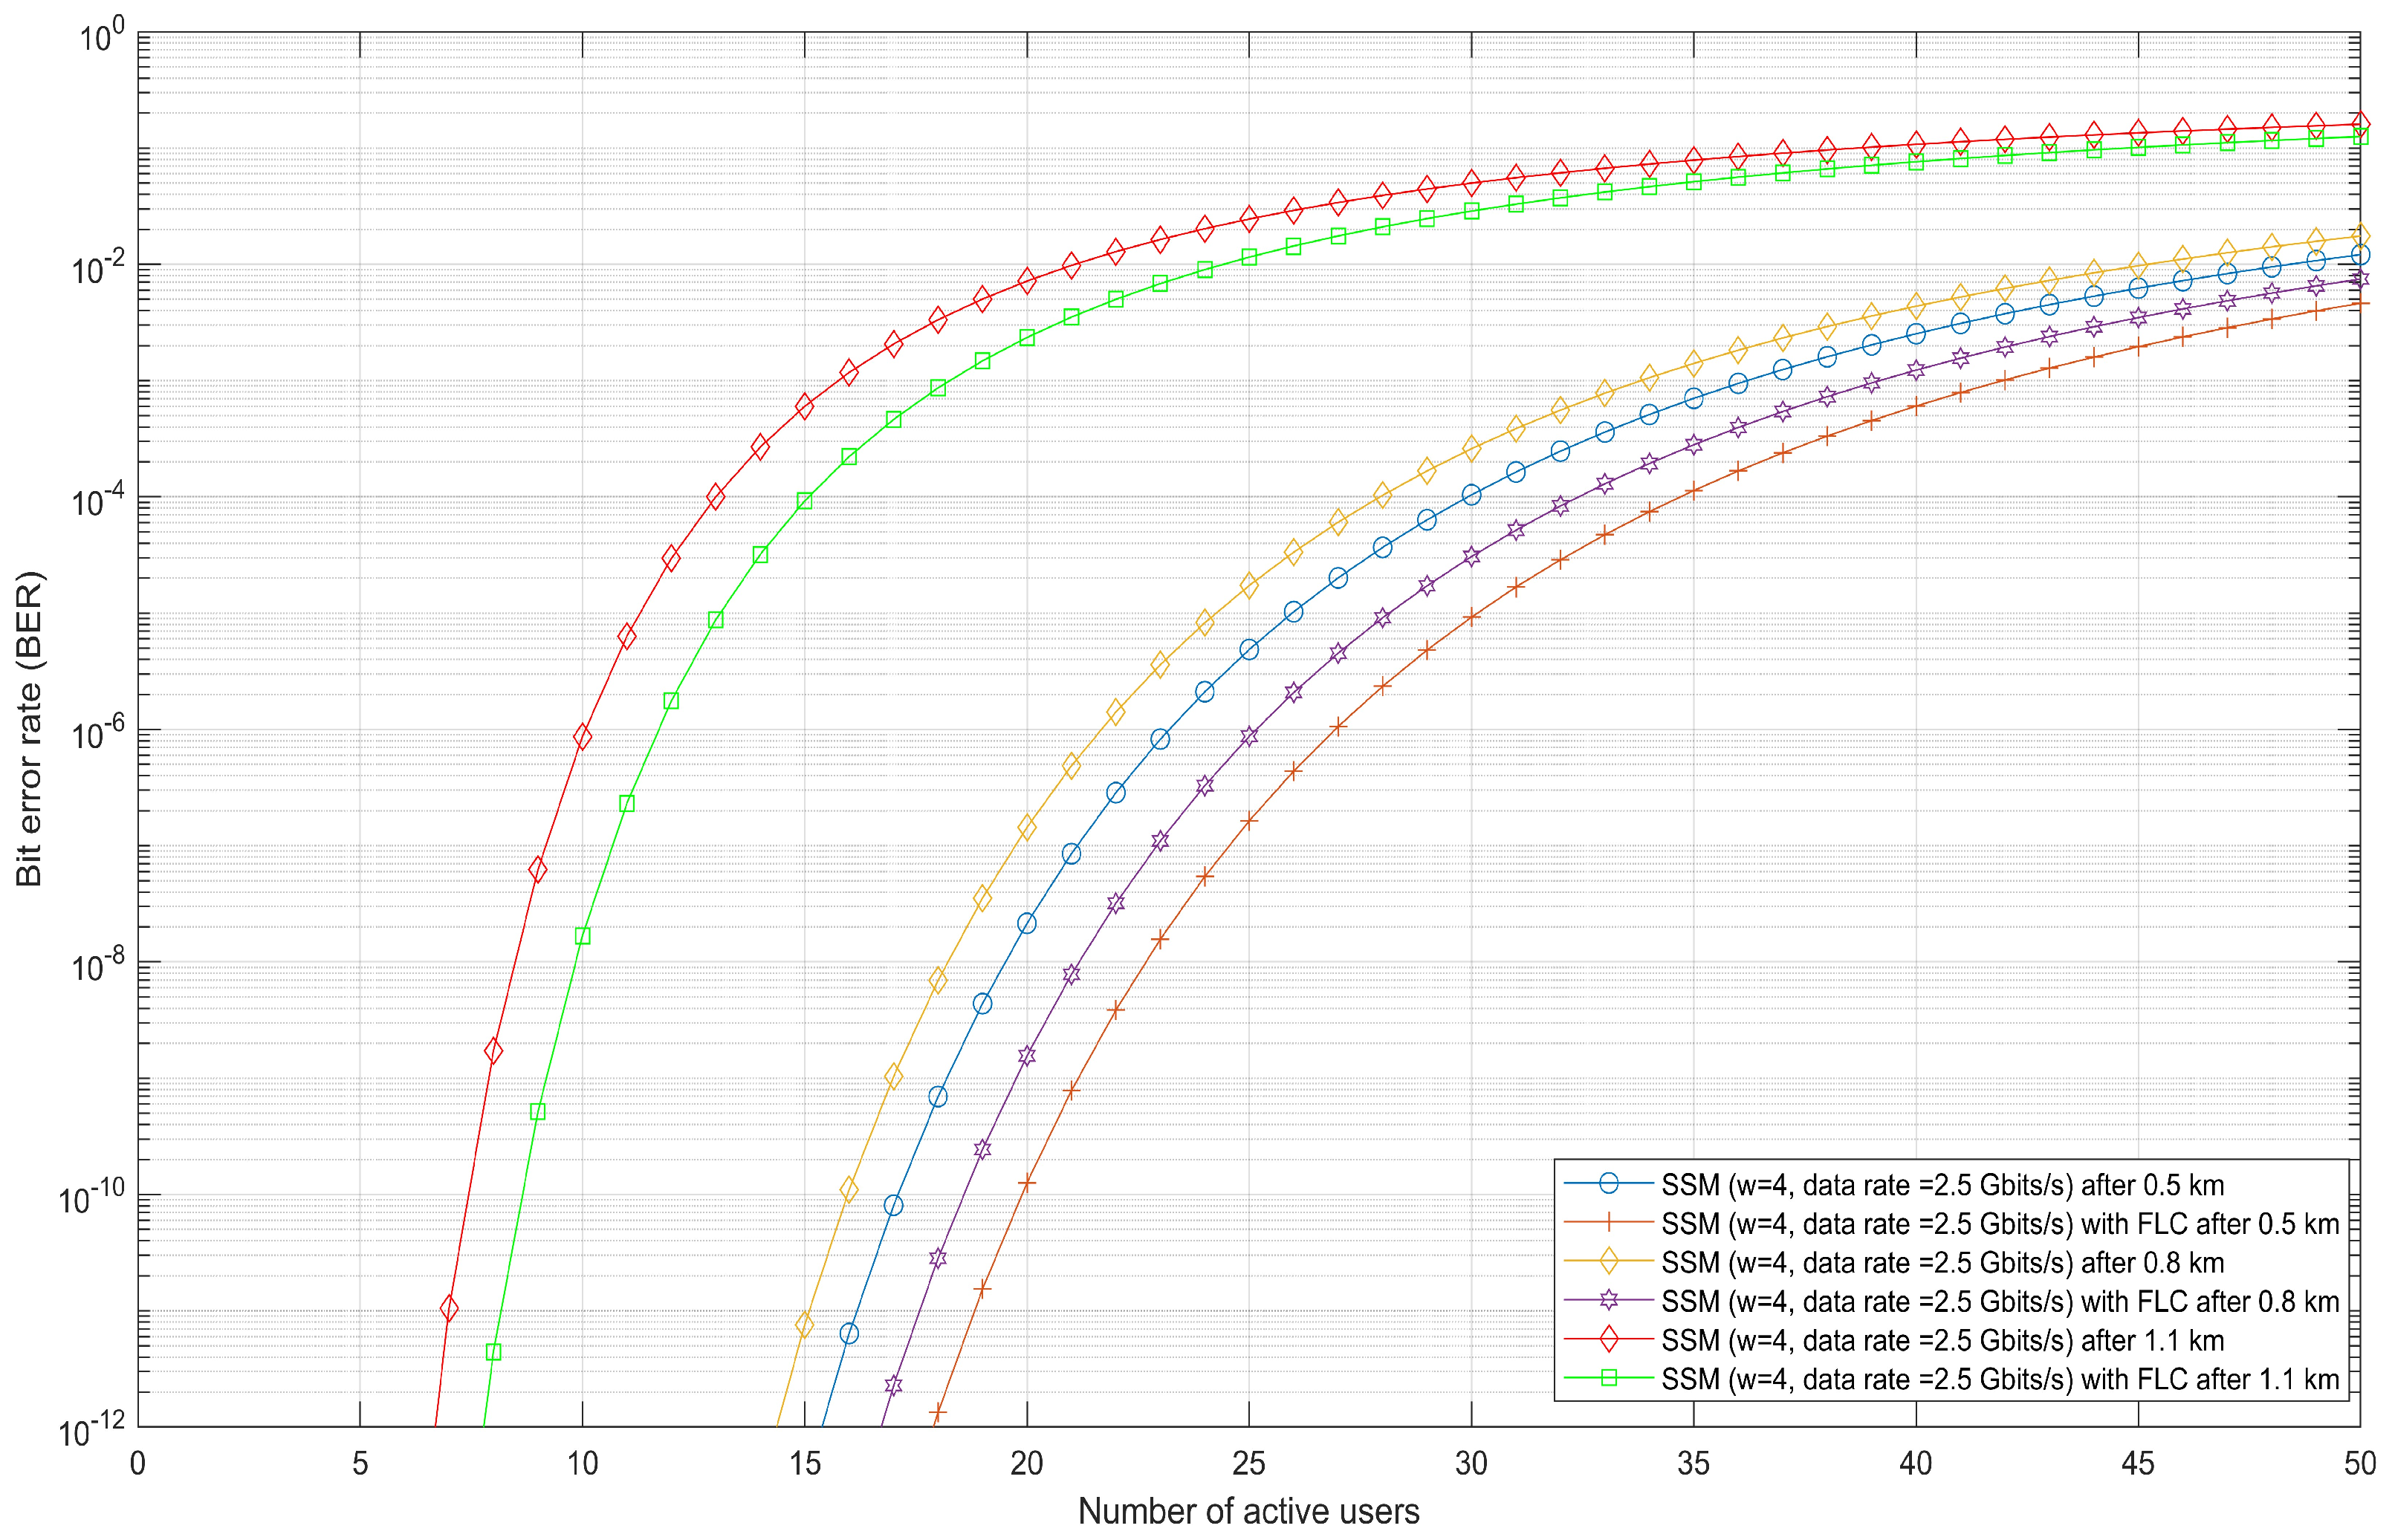
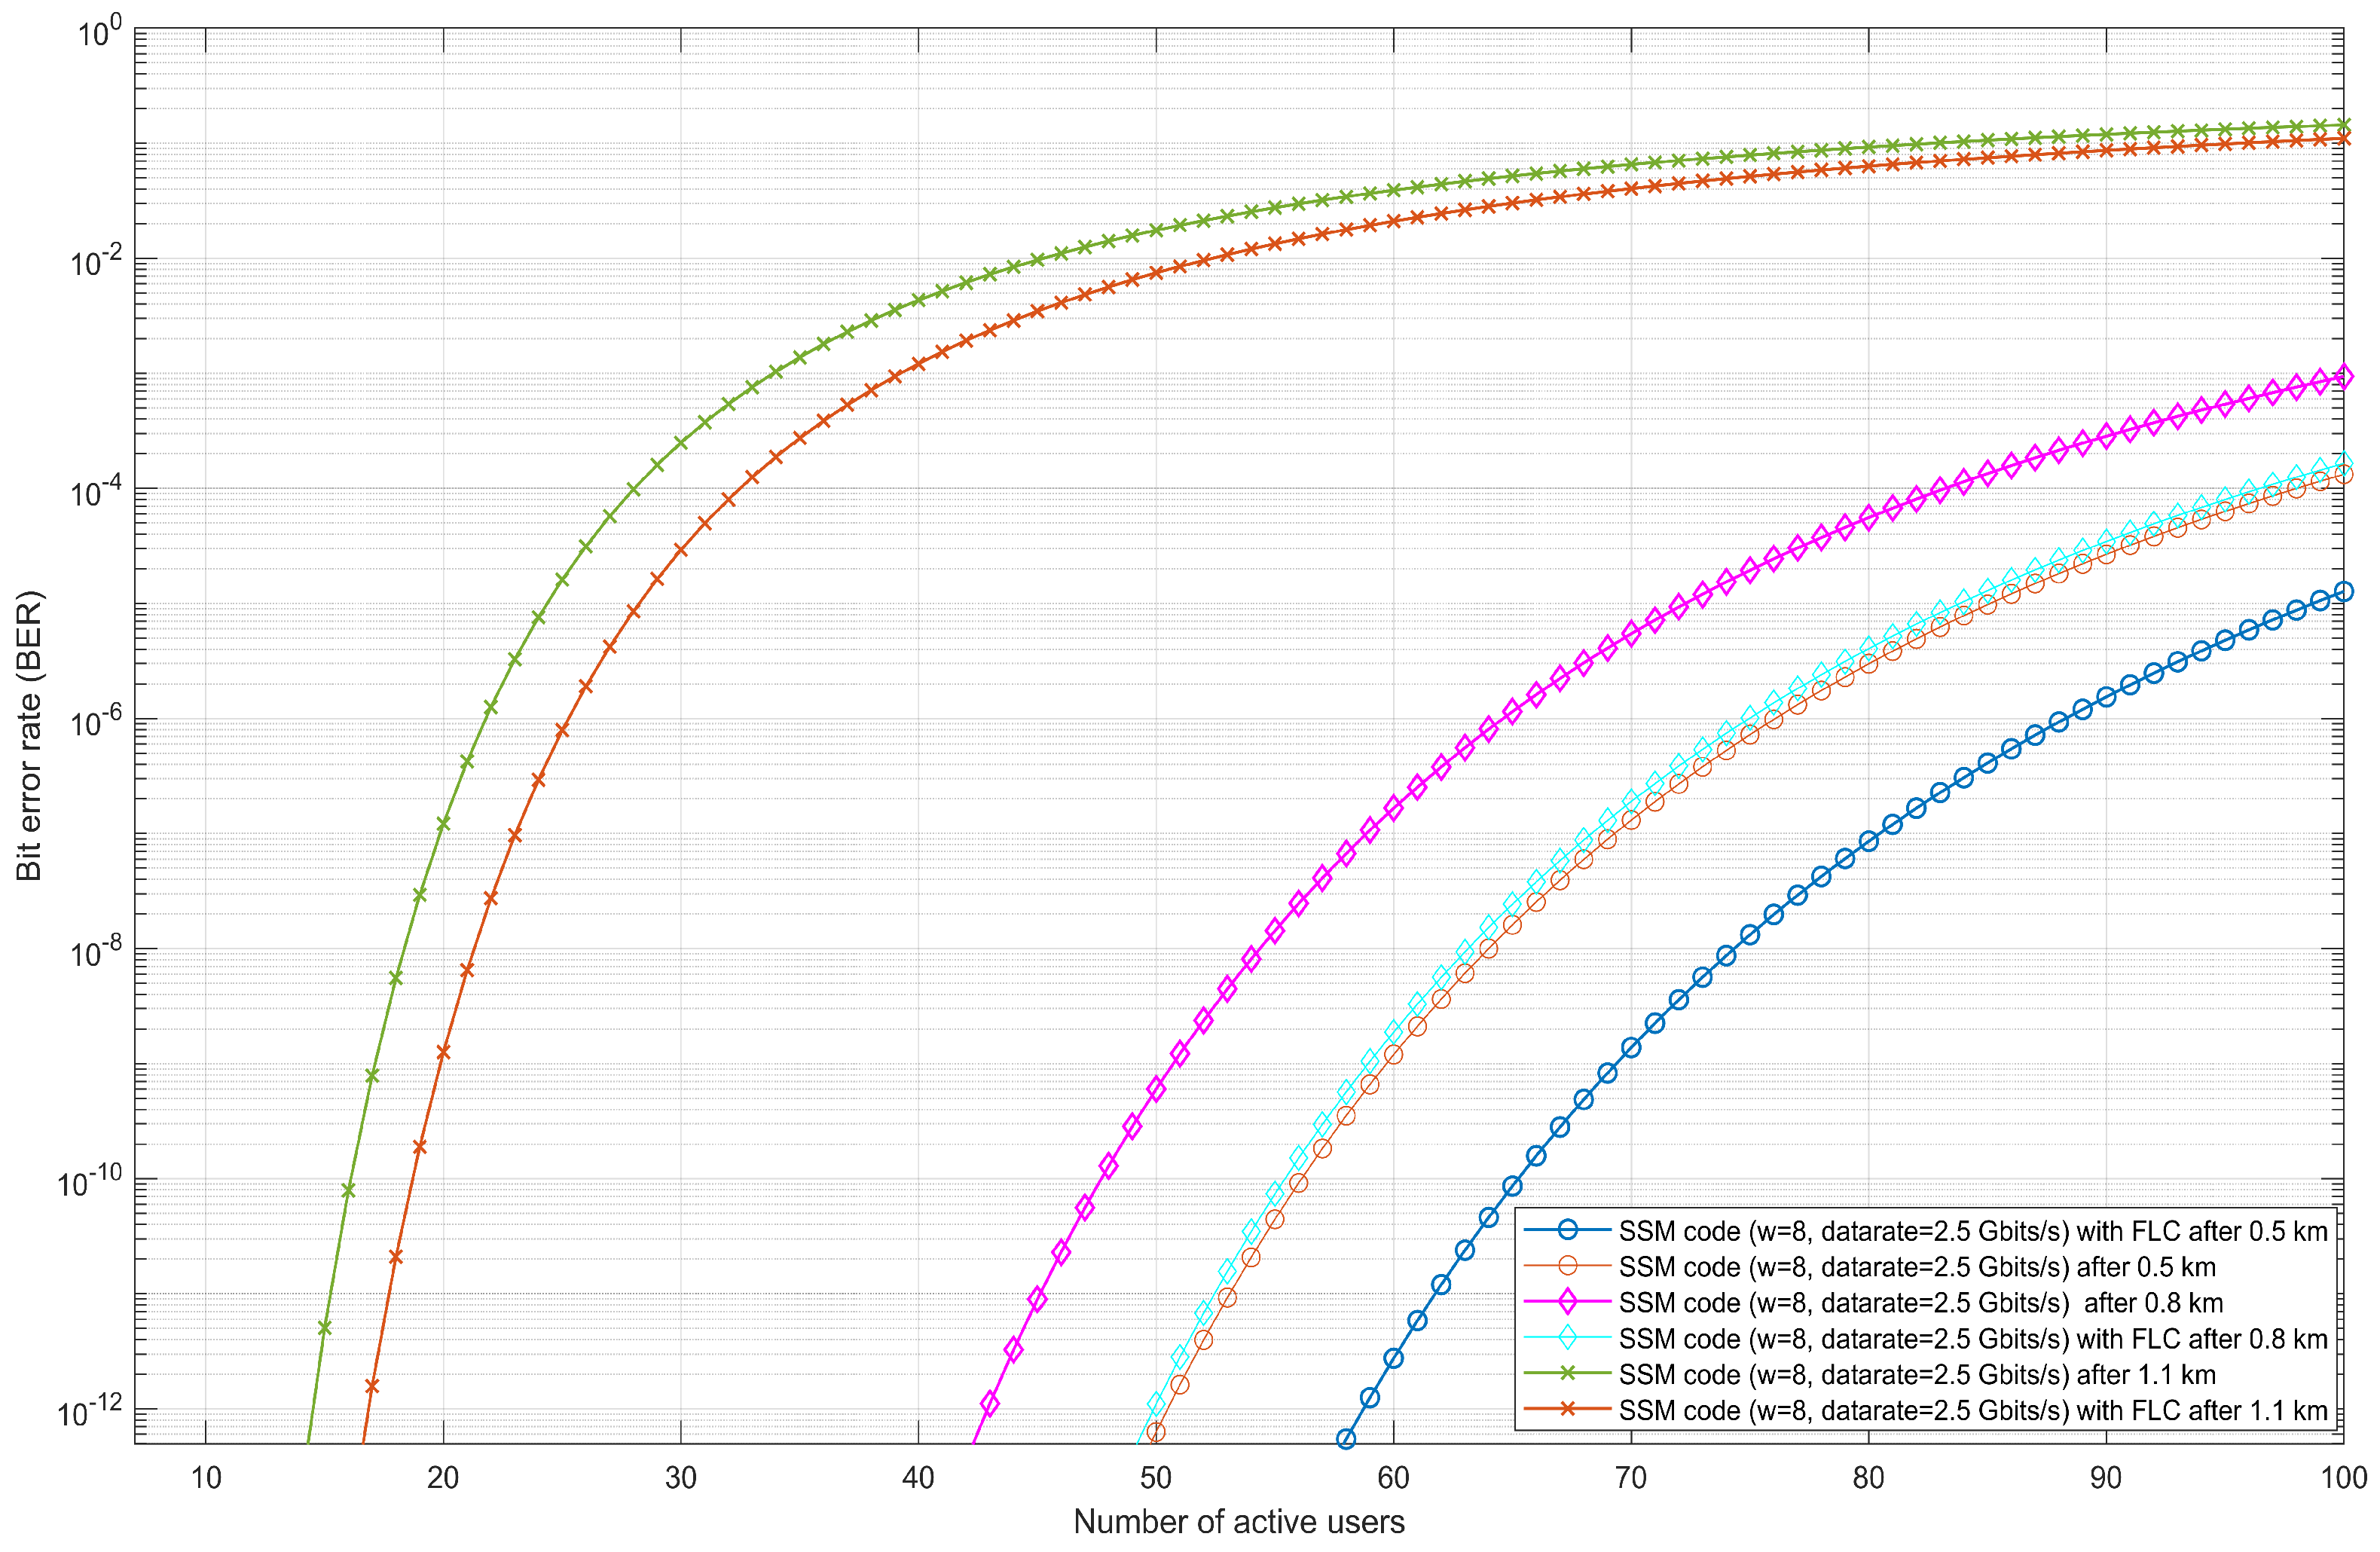
4.1. Performance Evaluation of FSO-SSM System Without FLC Under Rain and Fog

4.1.1. Rainy Weather

The impact of different rainfall rates for the proposed FSO system is investigated in this section. Figure 9 illustrates the relationship between received optical power and transmission distance under varying rainfall conditions. Results indicate a consistent trend showing that the received optical power decreases as both the FSO link distance and rainfall rate increase.
For instance, under LR, the received optical power at a distance of 2.8 km is −14.9 dBm. Maintaining a similar value of the received power level, the FSO range is reduced to 2.07 km when the rainfall rate is changed to MR. Finally, in the case of HR, the received optical power at an FSO link of 1.2 km is −13.8 dBm.
Figure 10 depicts the Q-factor performance across various transmission distances for LR, MR, and HR scenarios. The analysis reveals that rainfall-induced attenuation surpasses that of haze, leading to a decline in system performance and reducing the transmission distance.
Under LR, as shown in Figure 11, the system achieves a distance of 2.8 km with a log(BER) of −6.3, which is less compared to the distance observed under LH conditions. Maintaining the same log(BER) value, the FSO transmission distance decreases to 2.07 km under MR conditions. For HR, the signal propagates to a distance of 1.2 km.
Figure 12 presents the eye diagrams for channel 1 of the proposed FSO system employing SSM codes, evaluated at transmission distances of 2.8 km (LR), 2.07 km (MR), and 1.2 km (HR). The distinct and well-defined eye openings observed at these distances provide clear evidence of successful data reception under varying rain conditions.

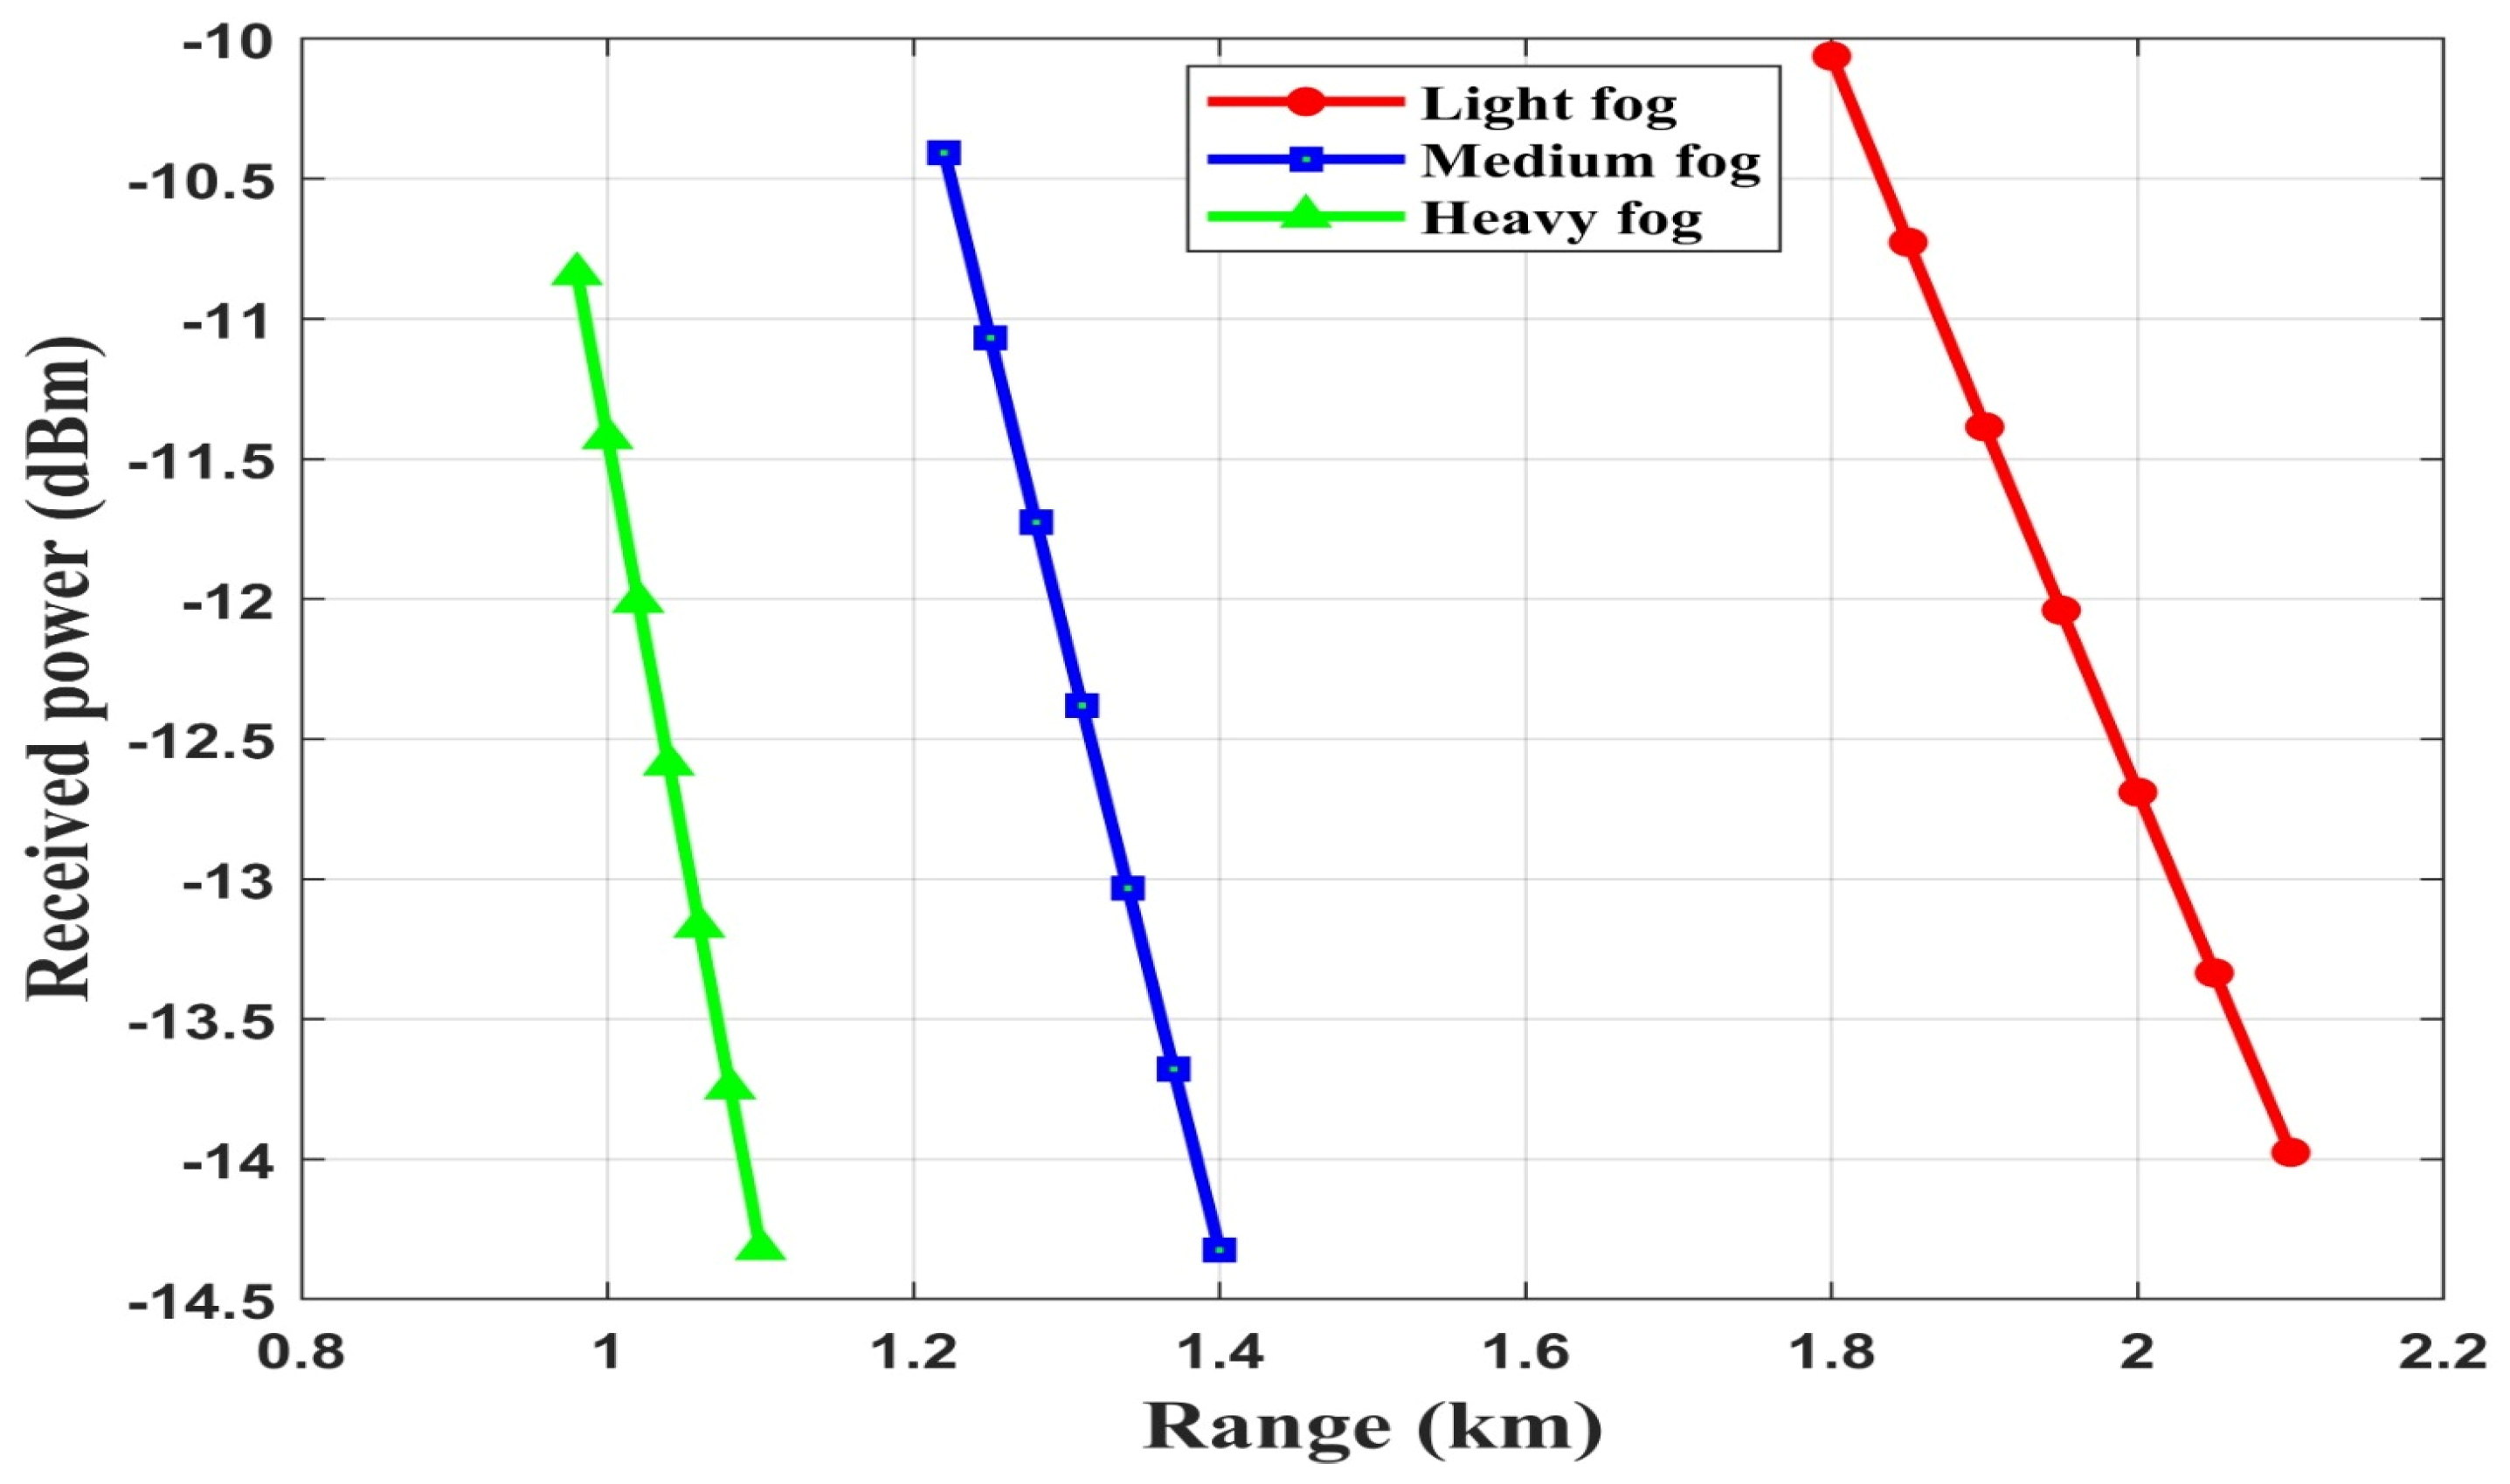
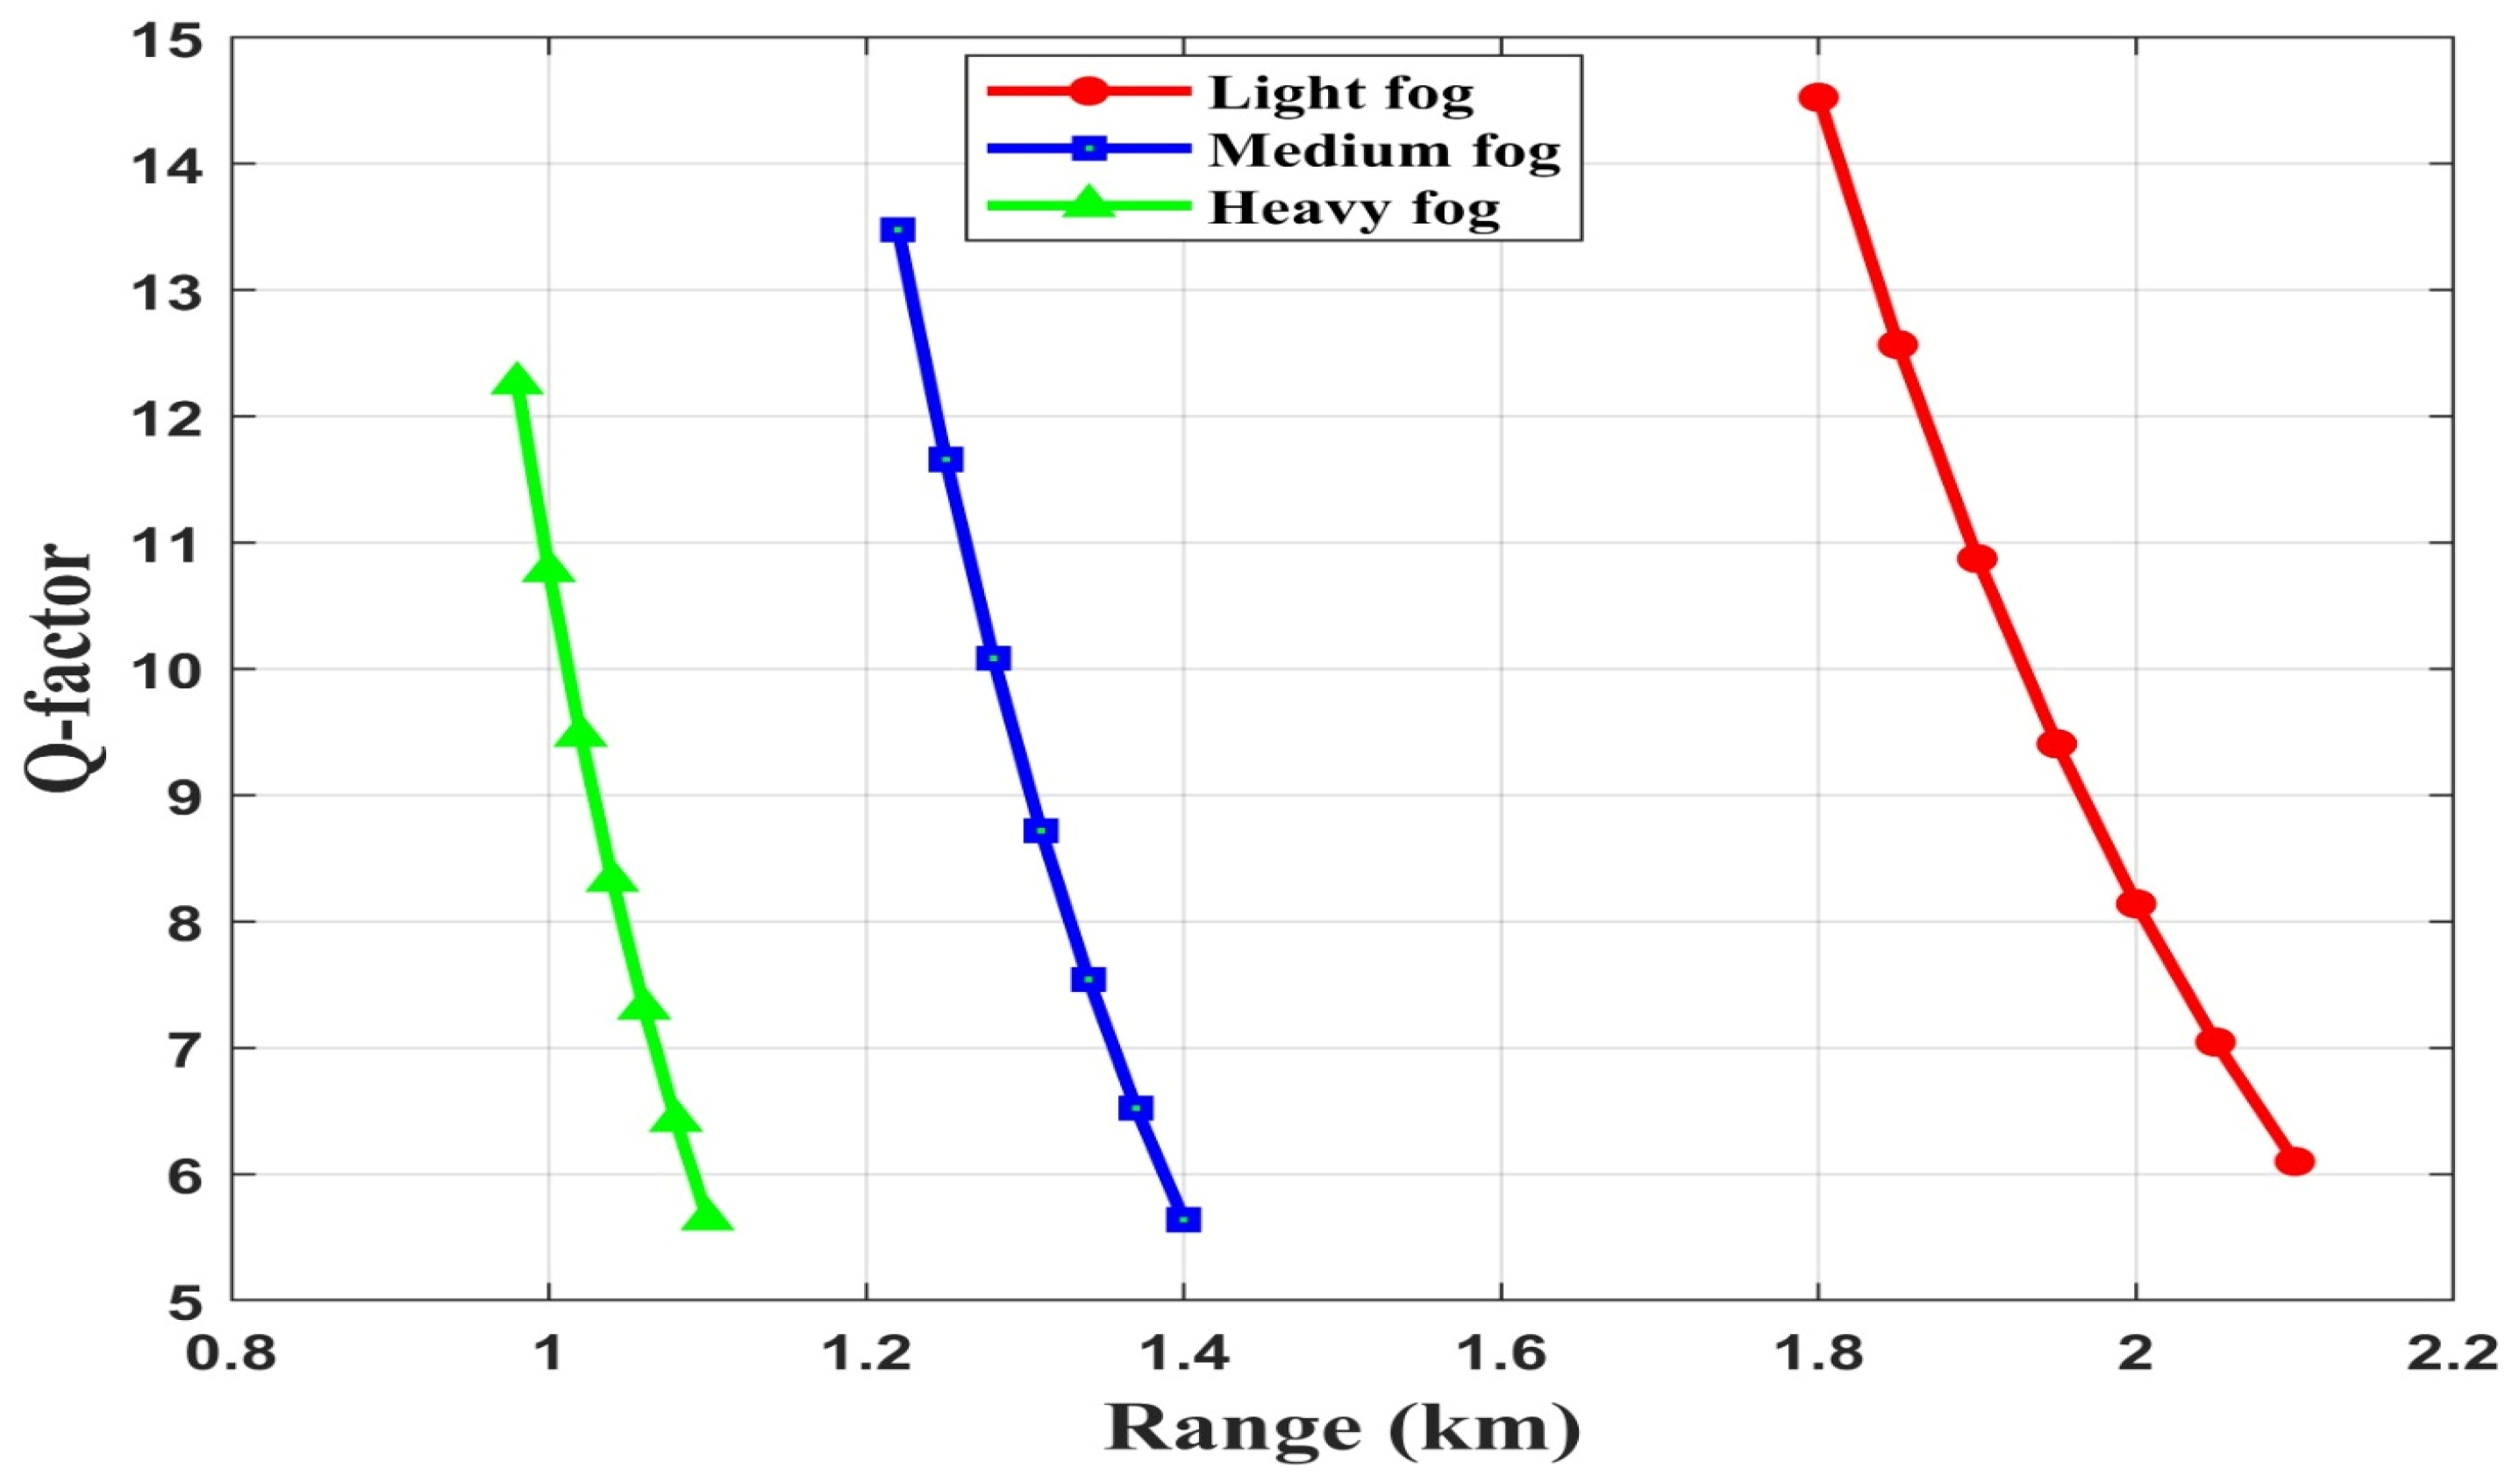
4.1.2. Foggy Weather

Foggy weather conditions present a more significant challenge to FSO transmission compared to hazy or rainy conditions due to higher attenuation levels. Consequently, the proposed system exhibits a reduced FSO transmission distance in foggy environments, as evidenced in Figure 13, Figure 14 and Figure 15. These figures illustrate the relationship between received optical power, Q-factor, and log(BER) with transmission distance in different fog conditions. Numerical values show that the longest FSO span of 2.1 km is achieved under LF conditions with a received optical power of approximately −14 dBm. As the fog intensity transitions to MF, this distance reduces to 1.4 km. Under HF conditions, an achievable distance is 1.1 km. This is because LF causes less signal attenuation than HF. The Q-factor at 2.1 km under LF conditions is 6. For MF, the Q-factor is 5.6 at 1.4 km. Maintaining the same Q-factor observed under MF conditions, the FSO range decreases to 1.1 km under HF conditions, which is shown in Figure 14. The log(BER) values at 2.1 km (LF), 1.4 km (MF), and 1.1 km (HF) are −9.2, −8, and −8, respectively. These values highlight the significant impact of fog on the performance of the proposed FSO system. With an increase in the fog density, the system transmission distance and signal quality are significantly affected, as shown in Figure 15.
Finally, Figure 16 displays the eye diagrams for channel 1 of the proposed FSO system utilizing SSM codes at transmission distances of 2.1 km (LF), 1.4 km (MF), and 1.1 km (HF). The wider eye openings across these distances serve as compelling evidence of successful data reception under varying fog conditions.

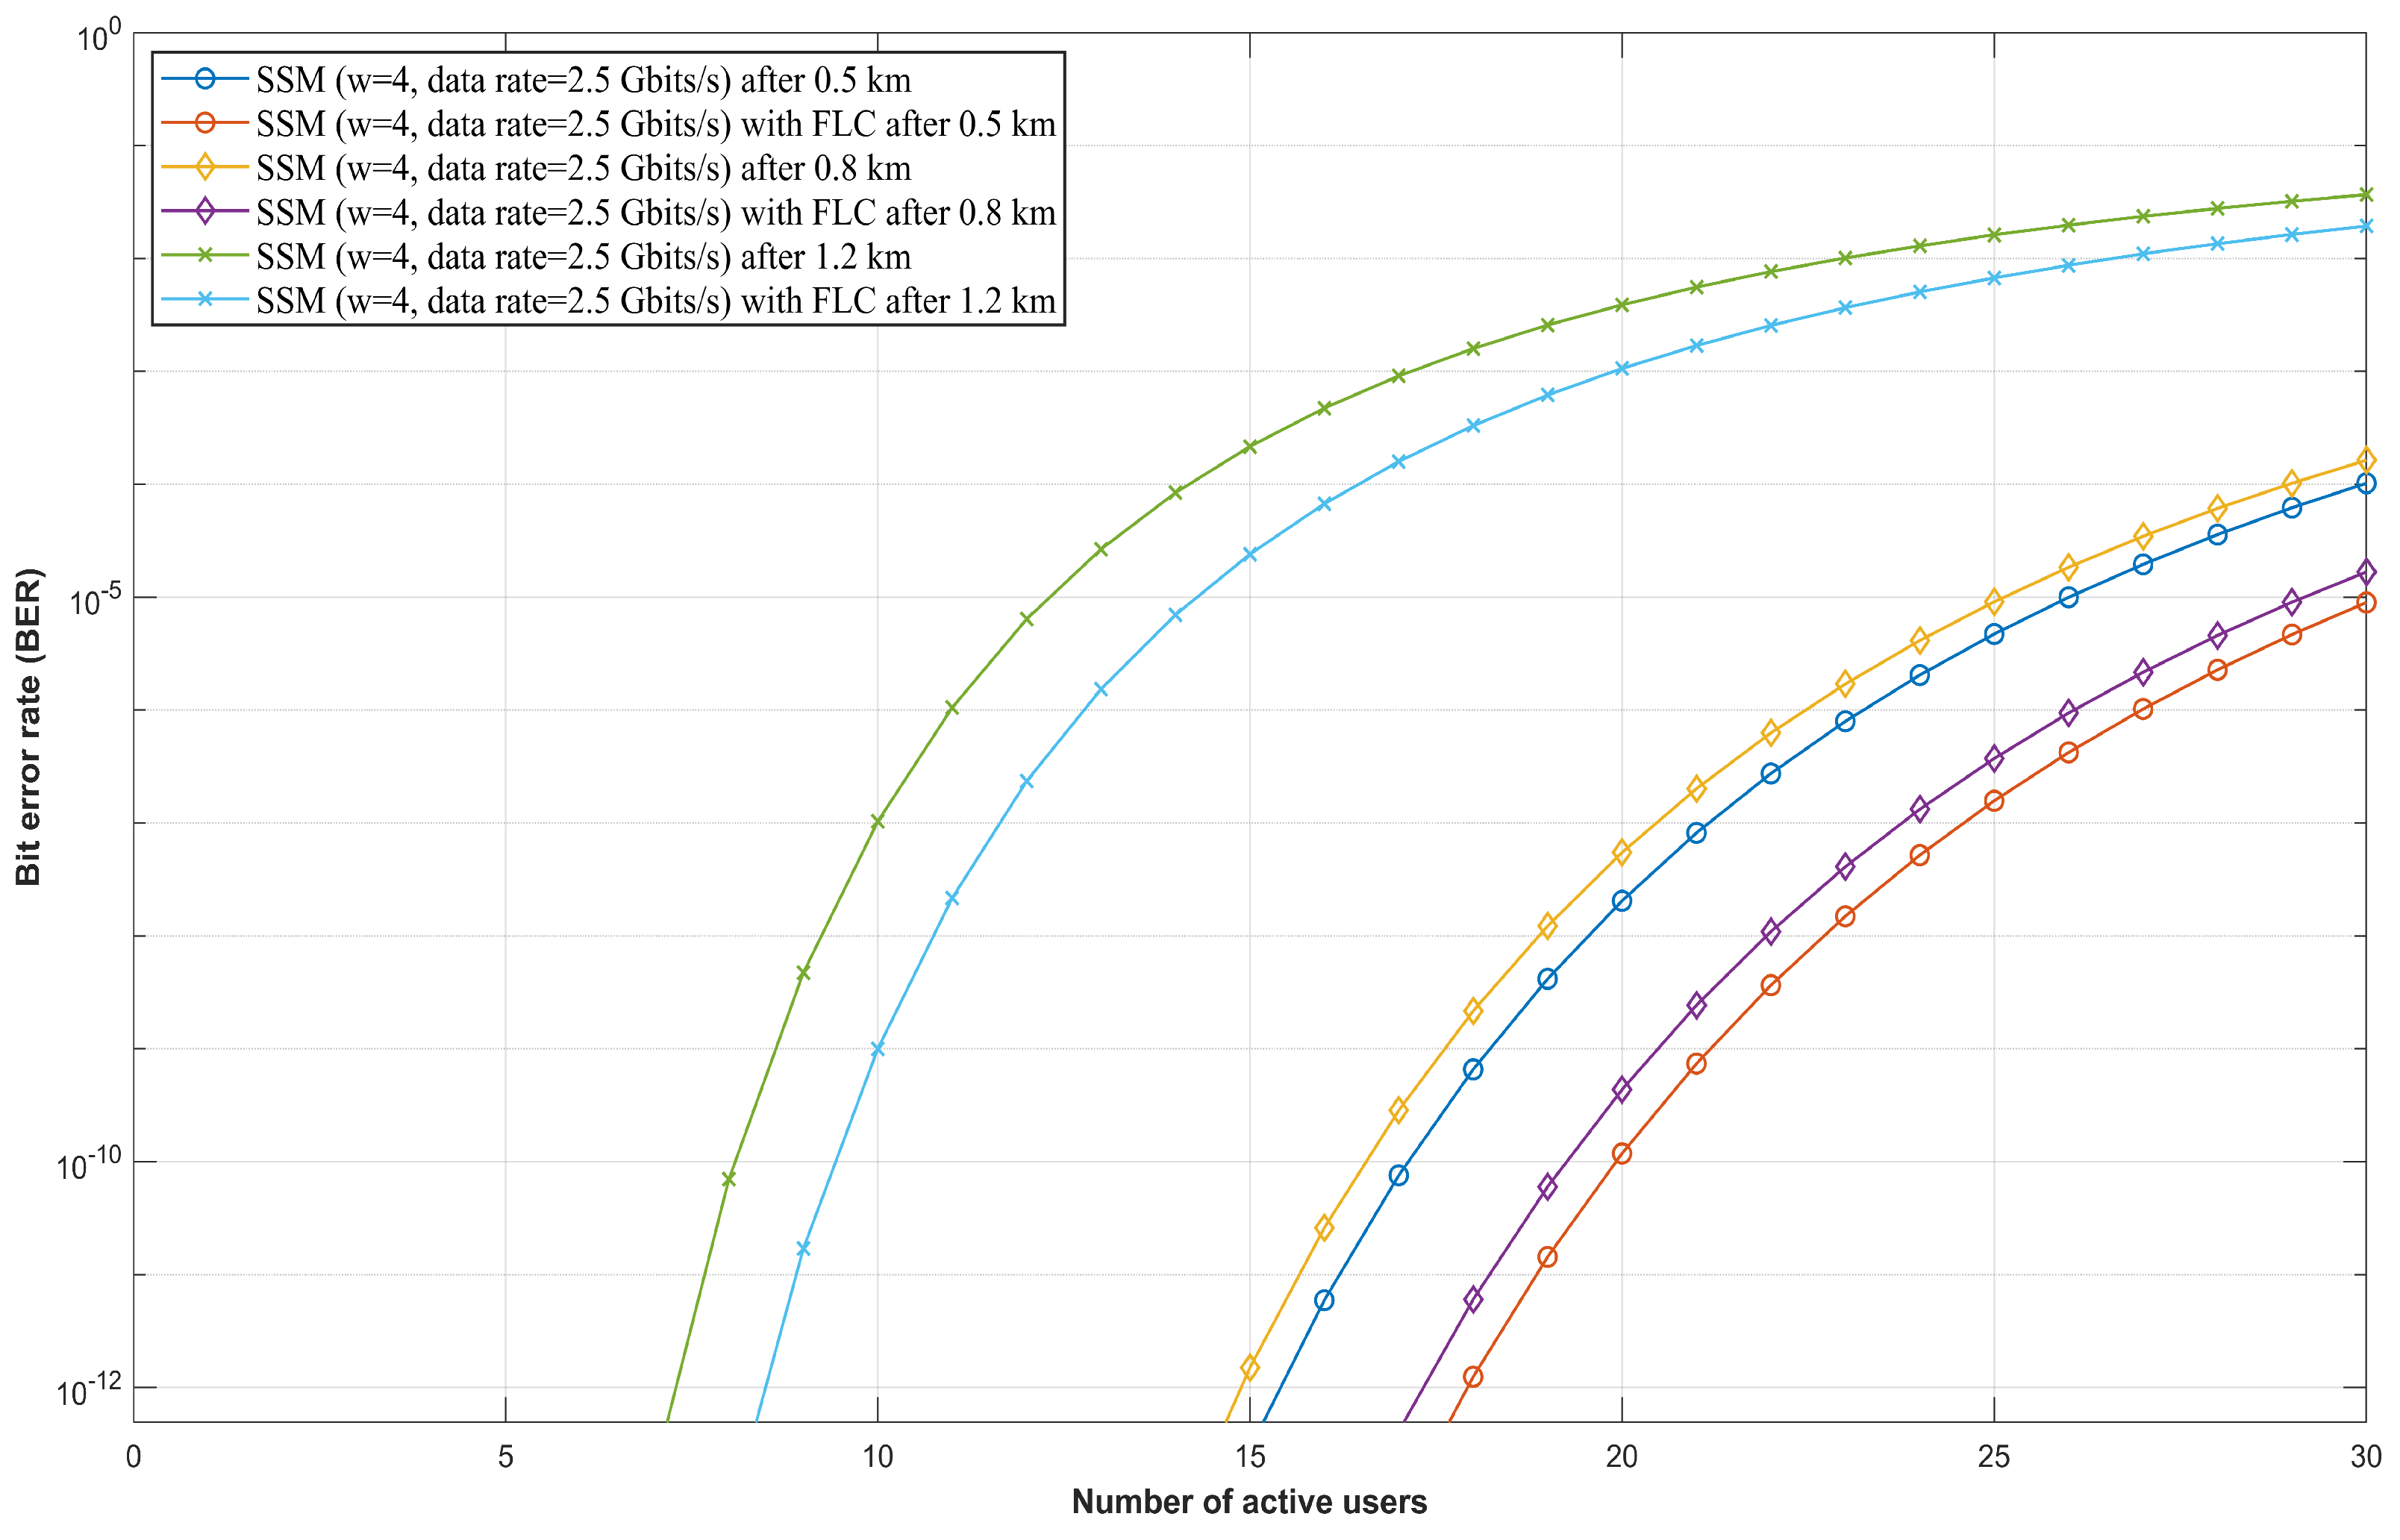
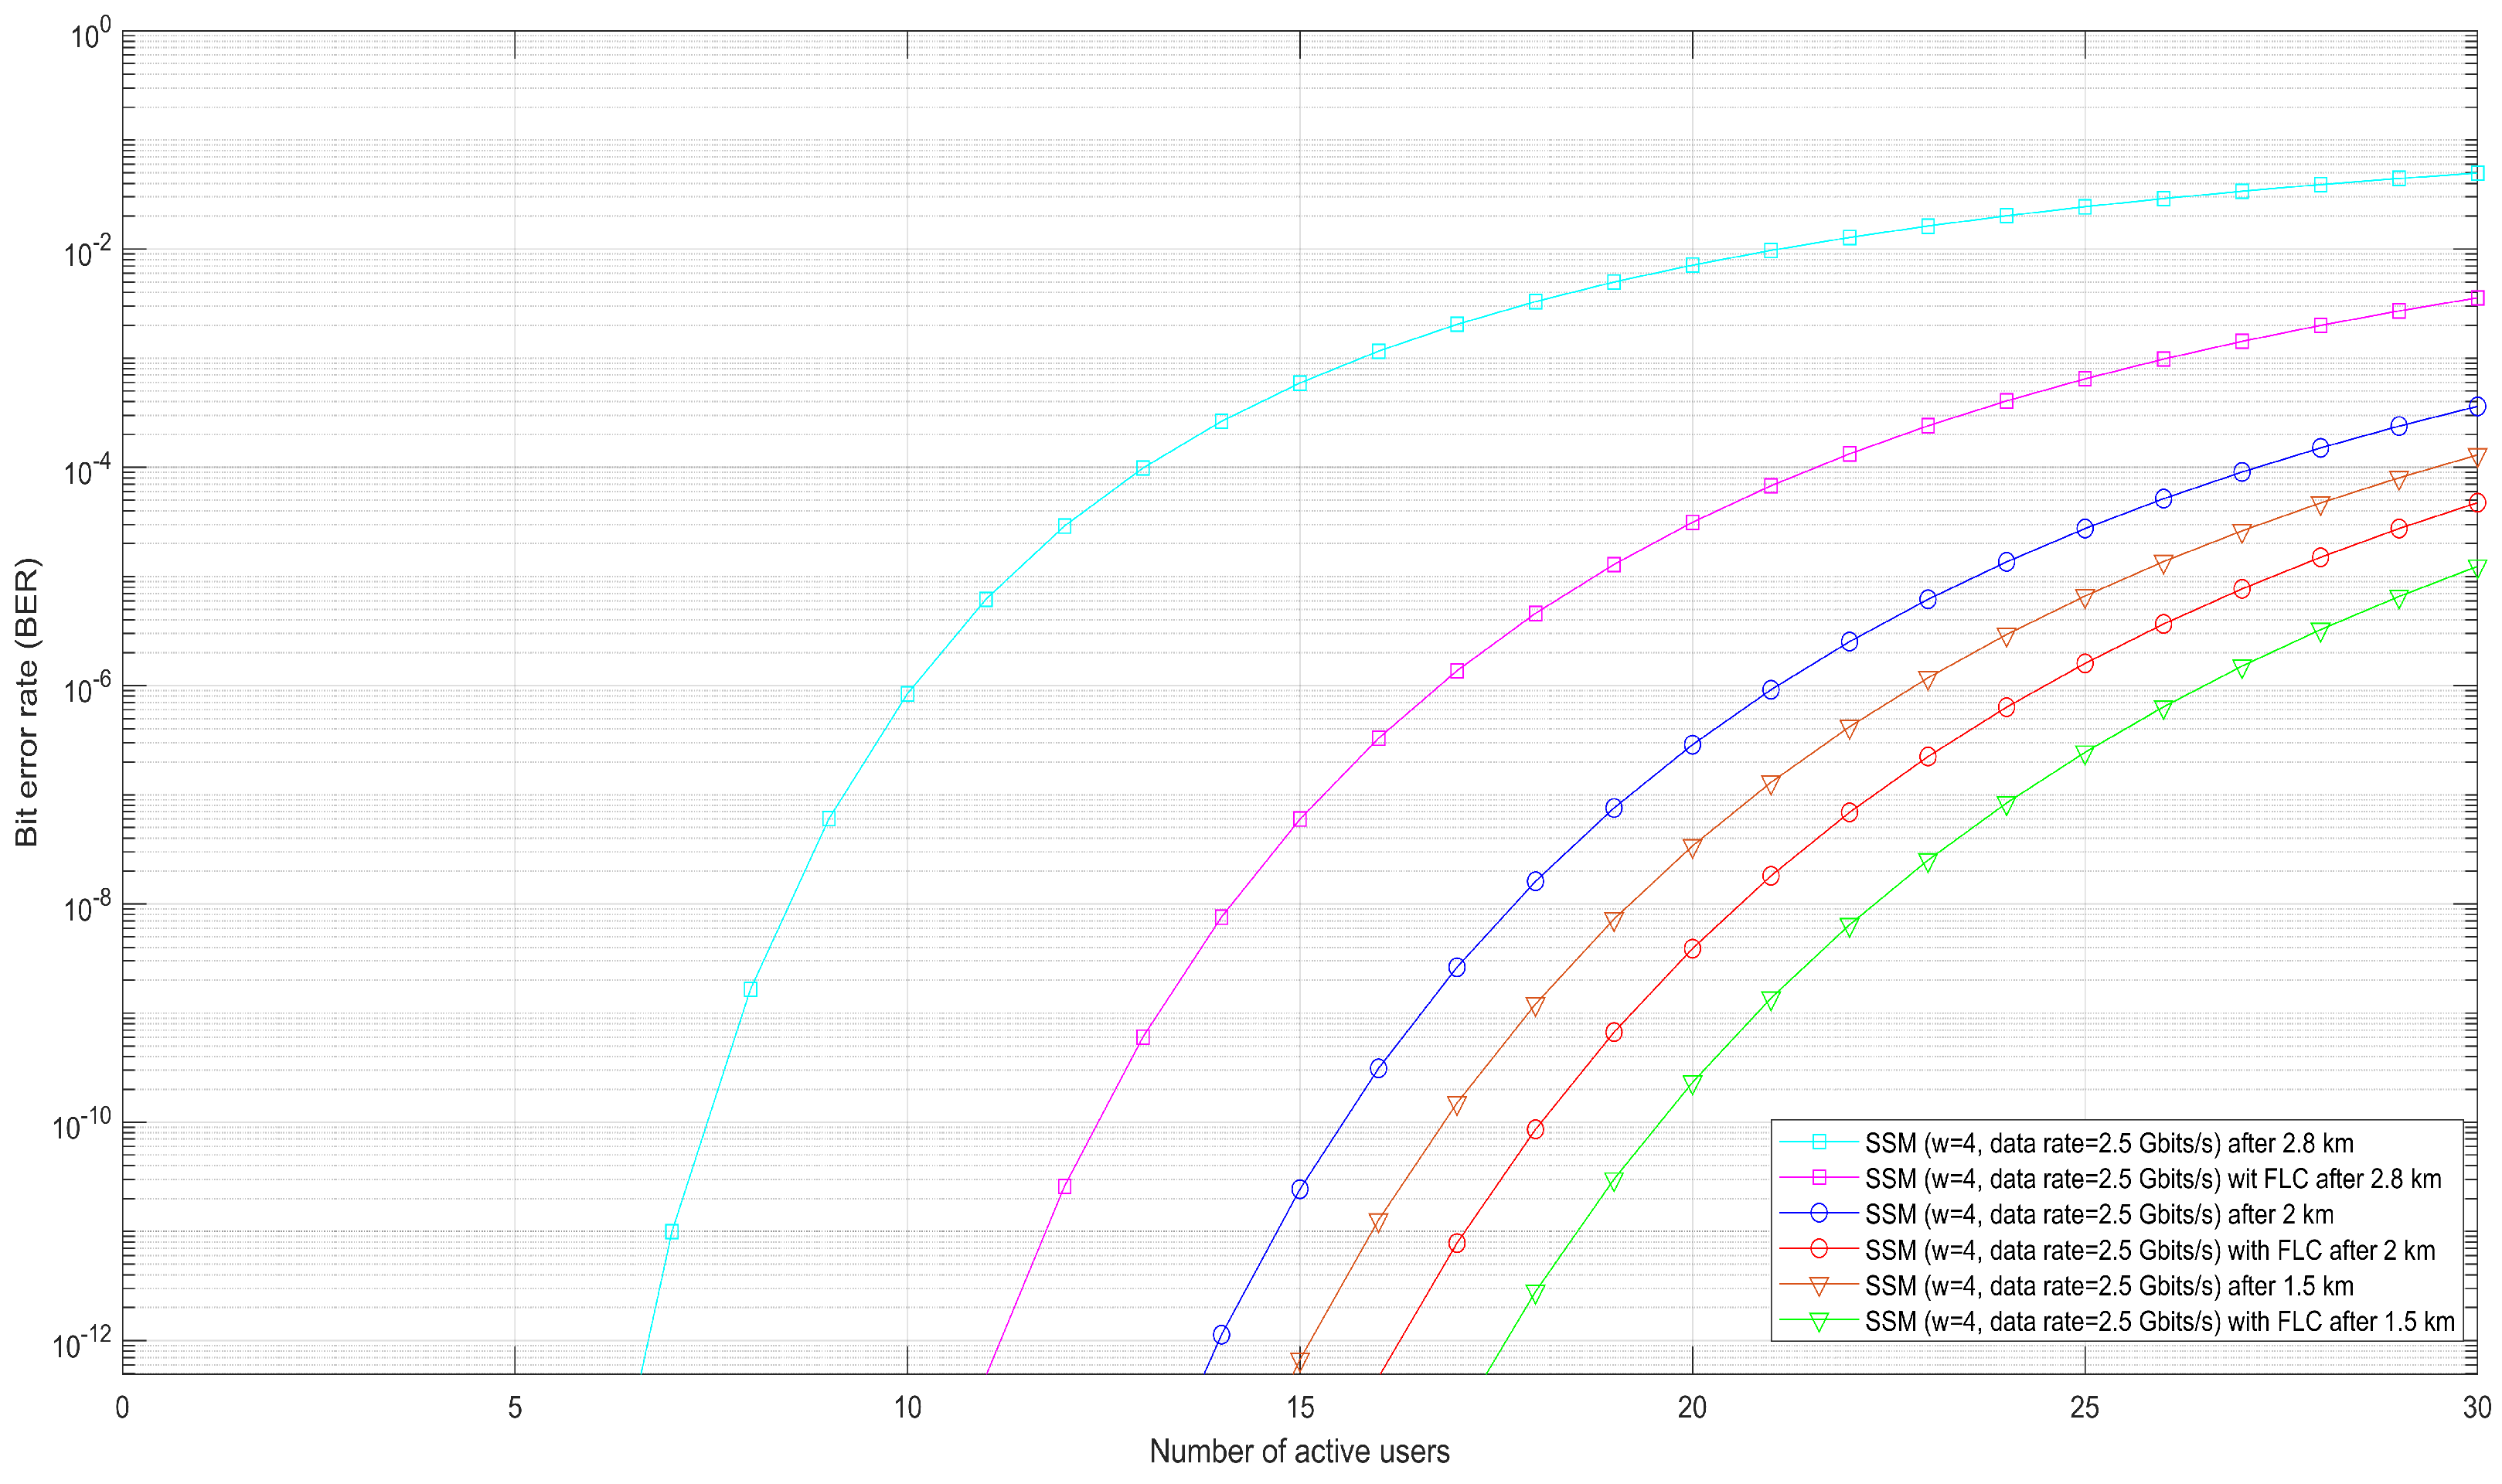
4.2. Performance Evaluation of FSO-SSM System with FLC Under Rain and Fog

The performance of the proposed FLC mechanism is evaluated by comparing BER outcomes with and without FLC under different weather impairments. Both graphical results and a quantitative summary table are provided to validate the adaptive behavior of the FLC.

4.2.1. Rainy Weather

Figure 17 shows the BER performance versus the number of users for a system employing an SSM code (w = 4) at 2.5 Gbps for different FSO spans/distances. Results are shown for both systems with and without FLC under HR conditions. Acceptable BER values for FSO systems typically range from 3.8 × 10 3 to 10 6 for many applications. However, more demanding applications, such as high-definition video streaming, require BER values of 10 9 or lower. As shown in Figure 17, at a BER of 10 3 , the system without FLC supports approximately 15 users at 1.2 km distance. Similarly, the system with FLC supports approximately 20 users at the same distance. Therefore, the FSO system with FLC results in a 33.33% improvement in the number of users compared to without FLC. This improvement is attributed to the FLC’s ability to dynamically adjust the threshold and transmission parameters to maintain reliable performance. Similarly, with an FSO link at a distance of 0.8 km, the system supports 17 and 20 users with and without FLC, respectively. Furthermore, when the distance is reduced to 0.5 km, the supported number of users increases to 18 and 23, respectively, with and without FLC and under the same transmission conditions.
Figure 18 illustrates the BER as a function of the number of users for the system employing SSM coding at 2.5 Gbps across various FSO propagation ranges, both with and without FLC under low rainfall conditions. At a BER of 10 9 and FSO range of 2.8 km, the system supports approximately 7 users without FLC and 12 users with FLC. This enhancement is due to FLC’s capability to continuously adapt the system threshold, fine-tuning transmission settings to ensure consistent performance. Furthermore, when the distance is reduced to 2 km, the system accommodates 15 users without FLC and 18 users with FLC. At 1.5 km, the number of supported users increases to 19 and 23 for the system without and with FLC, respectively, and under identical transmission conditions. In addition to the graphical evaluation, Table 5 presents a quantitative comparison of average BER values with and without the FLC under various rainfall conditions. The results show that the proposed FLC achieves BER improvements ranging from 90.32% to 98.69%, depending on the rainfall rate and number of users. This confirms the FLC’s ability to effectively adapt to rain-induced attenuation and significantly enhance system reliability across varying channel conditions. The improvement percentage in BER achieved by the FLC is calculated as follows:
Improvement   ( % ) = 1 BER FLC BER No - FLC × 100
To show up the spatial shape of each output for every two input combinations of the fuzzy model for distance (L) and rainfall (mm/h), the 3D surface is plotted in Figure 19 via MATLAB’s fuzzy logic toolbox.

4.2.2. Foggy Weather

Figure 20 presents the BER versus the number of supported users for an FSO system employing an SSM code at 2.5 Gbps under LF conditions. Figure 20 compares system performance with and without FLC across various FSO ranges. Maintaining a BER equal to 10 3 , the system without FLC supports 13 and 35 users at FSO spans of 1.1 km and 0.5 km, respectively. However, the corresponding values for the FLC-enabled system are 16 and 42 users with similar conditions. At a more stringent BER of 10 9 and FSO propagation range of 0.5 km, the system supports 18 and 22 users without and with FLC, respectively. At 1.1 km, these values decrease to six and eight users, respectively, which shows the detrimental effect of increased transmission distance on system capacity. The performance improvement observed with FLC is attributed to its ability to dynamically adjust system thresholds and optimize transmission parameters, thereby mitigating the negative impact of atmospheric attenuation.
Figure 21 shows the BER versus the number of simultaneous users for an FSO system using an SSM code at 2.5 Gbps under heavy fog (HF) conditions when w = 8. This compares system performance with and without FLC across various FSO ranges. At a BER of 10 3 , the system without FLC supports 28 and 100+ users at FSO spans of 1.1 km and 0.5 km, respectively. However, the corresponding values for the FLC-enabled system are 35 and 105 users with similar parameters. At a more stringent BER of 10 9 and FSO propagation range of 0.5 km, the system supports 70 and 85 users without and with FLC, respectively. At 1.1 km, these values decrease to 21 and 19 users, respectively, which further confirms the detrimental effect of increased transmission distance on system capacity. The performance improvement observed with FLC is attributed to its ability to dynamically adjust system thresholds and optimize transmission parameters, thereby mitigating the negative impact of atmospheric attenuation. Similarly, under foggy weather conditions, Table 5 confirms that the dynamic adjustment provided by the FLC maintains significantly lower BER levels compared to the system without FLC. Despite the severity of fog-induced attenuation, the FLC consistently improves system resilience across varying user loads, achieving BER improvements ranging from 98.39% to 99.17%. These results highlight the robustness of the proposed FLC in maintaining performance under highly absorptive and scattering atmospheric conditions.

5. Conclusions

In this paper, we proposed a fuzzy control system for SSM SAC-OCDMA receivers to dynamically tune the detection threshold level at the receiver unit due to variations in the weather conditions in an FSO network. The FLC system dynamically adjusts the receiver threshold values based on the received power values. The system with FLC can increase the network propagation distance. Alternatively, it supports a larger number of users with different weather conditions compared to an FSO system without FLC. An acceptable BER in FSO ranges from 3.8 × 10 3 to 10 6 for many applications, whereas for demanding applications such as high-definition video streaming, BER values in the range of 10 9 or lower may be required. Under low rain weather conditions, almost 7 and 12 users for a system without and with FLC for 2.8 km at BER of 10 9 were supported. Under low fog weather conditions, 18 and 22 users were supported for a system without and with FLC for 0.5 km when the BER is set to 10 9 . The proposed FSO system with FLC is shown to adjust BER threshold values automatically and dynamically to maintain a reliable performance by tuning transmission parameters that affect the received power. Numerical values show that the system with FLC outperforms a system without FLC receiver module by almost twice the number of simultaneous users. For future work, we will extend the FSO-FLC model to address atmospheric turbulence and analyze its impact on beam propagation and the received signal power to enhance BER threshold adaptation.

Author Contributions

Conceptualization, H.Y.A. and M.Z.; methodology, H.Y.A. and M.Z.; software, M.Z. and A.N.K.; validation, H.Y.A. and S.A.A.E.-M.; formal analysis, H.Y.A., M.Z., and A.N.K.; investigation, A.N.K. and S.A.A.E.-M.; resources, H.Y.A.; data curation, M.Z. and S.A.A.E.-M.; writing—original draft preparation, H.Y.A., M.Z., and S.A.A.E.-M.; writing—review and editing, A.N.K.; visualization, M.Z.; supervision, H.Y.A.; project administration, H.Y.A.; funding acquisition, M.Z. All authors have read and agreed to the published version of the manuscript.

Funding

This research was funded by Prince Sattam Bin Abdulaziz University under Project PSAU/2024/01/29746.

Institutional Review Board Statement

Not applicable.

Informed Consent Statement

Not applicable.

Data Availability Statement

Data are contained within the article.

Acknowledgments

The authors extend their appreciation to Prince Sattam bin Abdulaziz University for funding this research work through the project number (PSAU/2024/01/29746).

Conflicts of Interest

The authors declare no conflicts of interest.

Abbreviations

The following abbreviations are used in this manuscript:
OCDMAOptical Code-Division Multiple-Access
FSOFree-Space Optics
FLCFuzzy Logic Control
BERBit Error Rate
OWCOptical wireless communication
RFRadio Frequency
OFDMOrthogonal Frequency Multiplexing
WDMwavelength division multiplexing
SACSpectral Amplitude Coding
ONoCOptical Network-on-chip
SSMSingle Sigma Matrix

References

  1. Arnon, S.; Barry, J. Advanced Optical Wireless Communication Systems; Cambridge University Press: Cambridge, UK, 2012. [Google Scholar]
  2. Esmail, M.A.; Fathallah, H.; Alouini, M.-S. Analysis of fog effects on terrestrial Free Space Optical communication links. In Proceedings of the 2016 IEEE International Conference on Communications Workshops (ICC), Kuala Lumpur, Malaysia, 23–27 May 2016; pp. 151–156. [Google Scholar]
  3. Stathis, A.; Ntanos, A.; Lyras, N.K.; Giannoulis, G.; Panagopoulos, A.D.; Avramopoulos, H. Toward converged satellite/fiber 1550 nm DS-BB84 QKD networks: Feasibility analysis and system requirements. Photonics 2024, 11, 609. [Google Scholar] [CrossRef]
  4. Nadeem, F.; Kvicera, V.; Awan, M.S. Weather effects on hybrid FSO/RF communication link. IEEE J. Sel. Areas Commun. 2009, 27, 1687–1697. [Google Scholar] [CrossRef]
  5. Wani, M.Y.; Pathak, H.; Kaur, K.; Kumar, A. Free space optical communication system under different weather conditions. J. Opt. Commun. 2023, 44, 103–110. [Google Scholar] [CrossRef]
  6. Kaushal, H.; Kaddoum, G. Optical communication in space: Challenges and mitigation techniques. IEEE Commun. Surv. Tutor. 2016, 19, 57–96. [Google Scholar] [CrossRef]
  7. Khan, A.N.; Younis, U.; Mehmood, M.Q.; Zubair, M. Atmospheric propagation of space-fractional Gaussian-beam waves in a FSO communication system. Opt. Express 2022, 30, 1570. [Google Scholar] [CrossRef] [PubMed]
  8. Chaudhary, S.; Amphawan, A.; Nisar, K. Realization of free space optics with OFDM under atmospheric turbulence. Optik 2014, 125, 5196–5198. [Google Scholar] [CrossRef]
  9. Zabidi, S.A.; Al Khateeb, W.; Islam, M.R.; Naji, A.W. The effect of weather on free space optics communication (FSO) under tropical weather conditions. In Proceedings of the International Conference on Computer and Communication Engineering (ICCCE’10), Kuala Lumpur, Malaysia, 11–12 May 2010. [Google Scholar]
  10. Fadhil, H.A.; Amphawan, A.; Shamsuddin, H.A.; Abd, T.H.; Al-Khafaji, H.M.; Aljunid, S.A.; Ahmed, N. Optimization of free space optics parameters: An optimum solution for bad weather conditions. Optik 2013, 124, 3969–3973. [Google Scholar] [CrossRef]
  11. Khalighi, M.A.; Uysal, M. Survey on free space optical communication: A communication theory perspective. IEEE Commun. Surv. Tutor. 2014, 16, 2231–2258. [Google Scholar] [CrossRef]
  12. Moghaddasi, M.; Mamdoohi, G.; Noor, A.S.M.; Mahdi, M.A.; Anas, S.B.A. Development of SAC OCDMA in FSO with multi-wavelength laser source. Opt. Commun. 2015, 356, 282–289. [Google Scholar] [CrossRef]
  13. Abd El-Mottaleb, S.A.; Singh, M.; Chehri, A.; Ahmed, H.Y.; Zeghid, M.; Khan, A.N. Capacity enhancement for free space optics transmission system using orbital angular momentum optical code division multiple access in 5G and beyond networks. Energies 2022, 15, 7100. [Google Scholar] [CrossRef]
  14. Ijaz, M.; Ghassemlooy, Z.; Pesek, J.; Fiser, O.; Le Minh, H.; Bentley, E. Modeling of fog and smoke attenuation in free space optical communications link under controlled laboratory conditions. J. Lightw. Technol. 2013, 31, 1720–1726. [Google Scholar] [CrossRef]
  15. Israr, A.; Israr, A.; Khan, F.; Khan, F. Optimal modulation technique for MIMO FSO link. Wirel. Pers. Commun. 2019, 109, 695–714. [Google Scholar] [CrossRef]
  16. Olyaee, S.; Akbari, M. Performance analysis of total attenuation effects and different values of transmitter power on bit error rate and signal-to-noise ratio for free space optical communication. Recent Adv. Electr. Electron. Eng. 2022, 15, 234–242. [Google Scholar] [CrossRef]
  17. Takagi, T.; Sugeno, M. Fuzzy identification of systems and its applications to modeling and control. IEEE Trans. Syst. Man Cybern. 1985, 15, 116–132. [Google Scholar] [CrossRef]
  18. dos Reis, J.V.; Raddo, T.R.; Sanches, A.L.; Borges, B.H.V. Mitigation of environmental temperature variation effects using fuzzy systems and source-matched spreading codes for OCDMA networks. In Proceedings of the 2014 16th International Conference on Transparent Optical Networks (ICTON), Graz, Austria, 6–10 July 2014. [Google Scholar]
  19. ITU-R Recommendation P.1814, Prediction Methods Required for the Design of Terrestrial Free-Space Optical Links, ITU-R. 2007. Avalaible online: https://www.itu.int/rec/R-REC-P.1814-0-200708-I (accessed on 9 April 2025).
  20. ITU-R Recommendation P.1817, Propagation Data Required for the Design of Terrestrial Free-Space Optical Links, ITU-R. 2012. Available online: https://www.itu.int/rec/R-REC-P.1817-1-201202-I (accessed on 9 April 2025).
  21. Lyras, N.K.; Kourogiorgas, C.I.; Panagopoulos, A.D. Cloud attenuation statistics prediction from Ka-band to optical frequencies: Integrated liquid water content field synthesizer. IEEE Trans. Antennas Propag. 2017, 65, 319–328. [Google Scholar] [CrossRef]
  22. Iancu, I. A Mamdani type fuzzy logic controller. In Fuzzy Logic: Controls, Concepts, Theories and Applications; InTech: London, UK, 2012; pp. 325–350. [Google Scholar]
  23. Farghal, A.E.A. On the performance of OCDMA/SDM PON based on FSO under atmospheric turbulence and pointing errors. Opt. Laser Technol. 2019, 114, 196–203. [Google Scholar] [CrossRef]
  24. Singh, M.; Abd El-Mottaleb, S.A.; Aljunid, S.A.; Ahmed, H.Y.; Zeghid, M.; Nisar, K.S. Performance investigations on integrated MMF/FSO transmission enabled by OAM beams. Results Phys. 2023, 51, 106656. [Google Scholar] [CrossRef]
  25. Ahmed, H.Y.; Zeghid, M.; Mohyeldien, M.; Abd El-Mottaleb, S.A. Multi-dimensional Sigma Shift Matrix (nD-SSM) code with adaptable transmitter-receiver architecture to support multiclass users for SAC-OCDMA system. IEEE Access 2024, 12, 76919–76935. [Google Scholar] [CrossRef]
  26. dos Reis, J.V., Jr.; Raddo, T.R.; Sanches, A.L.; Borges, B.H.V. Fuzzy logic control for the mitigation of environmental temperature variations in OCDMA networks. J. Opt. Commun. Netw. 2015, 7, 480–488. [Google Scholar] [CrossRef]
Figure 1. FSO under different rain scenarios.
Photonics 12 00495 g001
Figure 2. Fuzzy logic model.
Photonics 12 00495 g002
Figure 3. OCDMA-PON-architecture-based FSO transmission: with FLC under rainy weather condition.
Photonics 12 00495 g003
Figure 4. Block diagram of FLC structure.
Photonics 12 00495 g004
Figure 5. Membership functions for rainfall Z ( Δ R ) and distances Z ( Δ L ) .
Photonics 12 00495 g005
Figure 6. Membership functions for the fuzzy set of the output Δ t h r e F L C .
Photonics 12 00495 g006
Figure 7. Fuzzy inference sets of rule base.
Photonics 12 00495 g007
Figure 8. Decision flow of the fuzzy logic controller (FLC) integrated in the FSO receiver.
Photonics 12 00495 g008
Figure 9. Received power vs. FSO range under rainy weather.
Photonics 12 00495 g009
Figure 10. Q-factor vs. FSO range under rainy weather.
Photonics 12 00495 g010
Figure 11. log(BER) vs. FSO range under rainy weather.
Photonics 12 00495 g011
Figure 12. Eye diagrams under (a) LR at 2.8 km, (b) MR at 2.07 km, and (c) HR at 1.2 km.
Photonics 12 00495 g012
Figure 13. Received power vs. FSO range under foggy weather.
Photonics 12 00495 g013
Figure 14. Q-factor vs. FSO range under foggy weather.
Photonics 12 00495 g014
Figure 15. log(BER) vs. FSO range under foggy weather.
Photonics 12 00495 g015
Figure 16. Eye diagrams under (a) LF at 2.1 km, (b) MF at 1.4 km, and (c) HF at 1.1 km.
Photonics 12 00495 g016
Figure 17. Number of active users vs. BER under HR weather condition.
Photonics 12 00495 g017
Figure 18. Number of active users vs. BER under LR weather condition.
Photonics 12 00495 g018
Figure 19. Three-dimensional surface of fuzzy model output of the two inputs: distance L (km) and rainfall (mm/h/km).
Photonics 12 00495 g019
Figure 20. Number of active users vs. BER under LF weather condition.
Photonics 12 00495 g020
Figure 21. Number of active users vs. BER under HF weather conditions.
Photonics 12 00495 g021
Table 1. Relation between rain intensity and attenuation.
Rain IntensityAttenuation (dB/km)
Storm59.7
Cloud burst20.99
Heavy rain (HR)19.28
Medium rain (MR)9.64
Light rain (LR)6.27
Drizzle0.44
Very clear0.22
Clear0.06
Table 2. Haze and fog conditions and their attenuation.
Weather ConditionAttenuation (dB/km)
Thin fog9
Light fog (LF)13
Medium fog (MF)16
Heavy fog (HF)22
Light haze (LH)1.537
Medium haze (MH)4.285
Table 3. Fuzzy control rules under rainy weather.
Weather ConditionVLLD ≤ 1 kmMD [1 km, 2 km]HD [2 km, 3 km]
CATh8Th8Th8Th8
Light rainTh8Th8Th8Th8
Moderate rainTh8Th8Th8Th5
Heavy rainTh8Th8Th5Th1
Table 4. Fuzzy control rules under foggy weather.
Weather ConditionVLLD ≤ 0.5 kmMD [0.5 km, 1 km]HD [1 km, 1.5 km]
CATh8Th8Th8Th8
Light fogTh8Th8Th8Th8
Medium fogTh8Th8Th8Th5
Heavy fogTh8Th8Th5Th1
Table 5. Average BER performance comparison with and without FLC.
Weather ConditionNo. of UsersBER with FLCBER Without FLCImprovement (%)
Low Rain22 6.44 × 10 9 4.20 × 10 7 98.47%
Medium Rain20 3.35 × 10 9 2.56 × 10 7 98.69%
Heavy Rain10 9.97 × 10 9 1.03 × 10 7 90.32%
Low Fog21 7.82 × 10 9 4.87 × 10 7 98.39%
Medium Fog19 2.25 × 10 9 1.90 × 10 7 98.82%
Heavy Fog9 5.17 × 10 9 6.24 × 10 7 99.17%
Disclaimer/Publisher’s Note: The statements, opinions and data contained in all publications are solely those of the individual author(s) and contributor(s) and not of MDPI and/or the editor(s). MDPI and/or the editor(s) disclaim responsibility for any injury to people or property resulting from any ideas, methods, instructions or products referred to in the content.

