1. Introduction
The increasing communication signal speed in optical fiber communication links rapidly intensifies signal distortion over the same transmission distance, significantly increasing the difficulty of equalization, which obstructs the upgrade and expansion of traditional intensity modulation direct detection (IMDD) communication systems [
1,
2]. In optical channels, signals are subject to linear noise, such as dispersion, nonlinear noise, such as self-phase modulation (SPM) noise, and noise generated by imperfections in amplifiers, such as amplified spontaneous emission (ASE) noise [
3]. To mitigate the impact of noise on signals, the mainstream channel noise equalization scheme is based on digital signal processing (DSP) technology using electronic chips [
4,
5,
6,
7]. However, due to the gradual failure of Moore’s Law, equalization schemes based on DSP chips have difficulty supporting the continued development of signal rates. And it requires a trade-off between power consumption due to computational complexity and equalization performance [
8,
9].
Artificial neural networks (ANNs) possess the advantages of strong flexibility and high universality [
10]. Compared to DSP technology, ANNs have a simpler training principle and require fewer hyperparameters to adjust [
11]. Therefore, the use of ANNs for distortion equalization has been widely discussed, especially recurrent neural networks (RNNs) [
12,
13] with recurrent memory characteristics. Reservoir computing (RC) is a form of RNN characterized only by the need to train the weights of the readout layer, while other weights are randomly generated and kept fixed [
14,
15,
16]. As a result, the training difficulty of RC is much lower than that of other types of RNN, significantly reducing computational complexity and power consumption. However, RC based on electronic chips [
17] still suffers from the separation of storage and computation latency inherent in the von Neumann architecture. And its computing speed is limited by advancements in the fabrication process of transistors. In addition, electronic chips also lose some phase information of optical signals due to the influence of the square-law relationship between optical intensity and current in photoelectric conversion.
The photonic reservoir computing (PhRC) chip can directly input optical signals, thereby increasing the bandwidth of signal processing and reducing latency [
18,
19,
20,
21]. Currently, the mainstream photonic reservoir computing schemes are classified into two types: virtual node-based and spatial node-based [
22,
23,
24,
25]. The virtual node-based scheme employs a loop as the primary structure, using the concept of time-division multiplexing to realize the functionality of the reservoir [
26]. However, its nodes have highly fixed connectivity, limiting their parallelism and flexibility. On the other hand, the spatial node-based scheme utilizes discrete devices to represent each node, which form a complex nonlinear dynamical system in physical space [
27]. The selection of node devices in this type is highly flexible, such as directional couplers (DCs), multimode interferometers (MMIs), and micro-ring resonators (MRRs). Furthermore, the connections between the nodes of a spatial node-based scheme can have more variety, enabling more complex designs and subsequently enhancing the equalization performance of reservoir channels. When the input and readout layers are positioned outside the reservoir, it facilitates easier design. In spatial-node-based PhRC, which employs internal nodes for both input and output purposes, the input and output waveguides create crossings as they traverse waveguide delay lines. Furthermore, if internal nodes are used only as input nodes and not as output nodes, this results in unused output ports, ultimately causing power loss.
In this paper, we propose four rectangular reservoir structures with varying numbers of nodes for channel equalization in IMDD systems. These structures are designed using the spatial-node scheme, where DCs serve as nodes and long waveguides provide delays between nodes. The input and output positions of the reservoir are designed on the outermost nodes, significantly reducing waveguide crossings compared to PhRC structures using internal nodes for input and output, thus minimizing noise and insertion loss. The input and reservoir layers are implemented based on silicon-on-insulator (SOI) technology, while the readout layer is realized in the electrical domain. Based on these four different reservoir layouts, we optimize and discuss parameters such as the number of nodes, DC splitting ratio, waveguide delay line length, and the number of input and output ports. Simulation results indicate that the number of nodes is basically proportional to the equalization capability of PhRC, but the optimal equalization result may not be achieved at the maximum possible number of nodes and needs to be optimized according to the equalization difficulty. When the 2 × 2 DC device splits light, achieving approximately equal output power from both output ports generally leads to better equalization results. Discussion on waveguide delay line lengths reveals an inverse relationship between waveguide delay line length and equalization performance. Although variations in the number of reservoir input ports have little impact on equalization effectiveness, an increase in the number of output ports enhances equalization performance. After parameter optimization, we compare the four layouts under isolated dispersion noise and ASE noise conditions and find that PhRC is more suitable for equalizing dispersion noise. We also investigate the impact of mixed noise in the channel and signal speed on PhRC equalization, discovering that all four layouts exhibit equalization effects at a transmission distance of 30 km and a signal speed of 50 Gb/s. Since most computations in our proposed PhRC equalizer are performed in the optical domain, it can be directly placed before the receiver to alleviate computational pressure. The design of its structure can also evolve into an all-optical structure in the future, which can further improve the equalization speed and bandwidth of optical signals.
2. Design of Photonic Reservoir Computing and Verification System
Photonic Reservoir Computing Structure
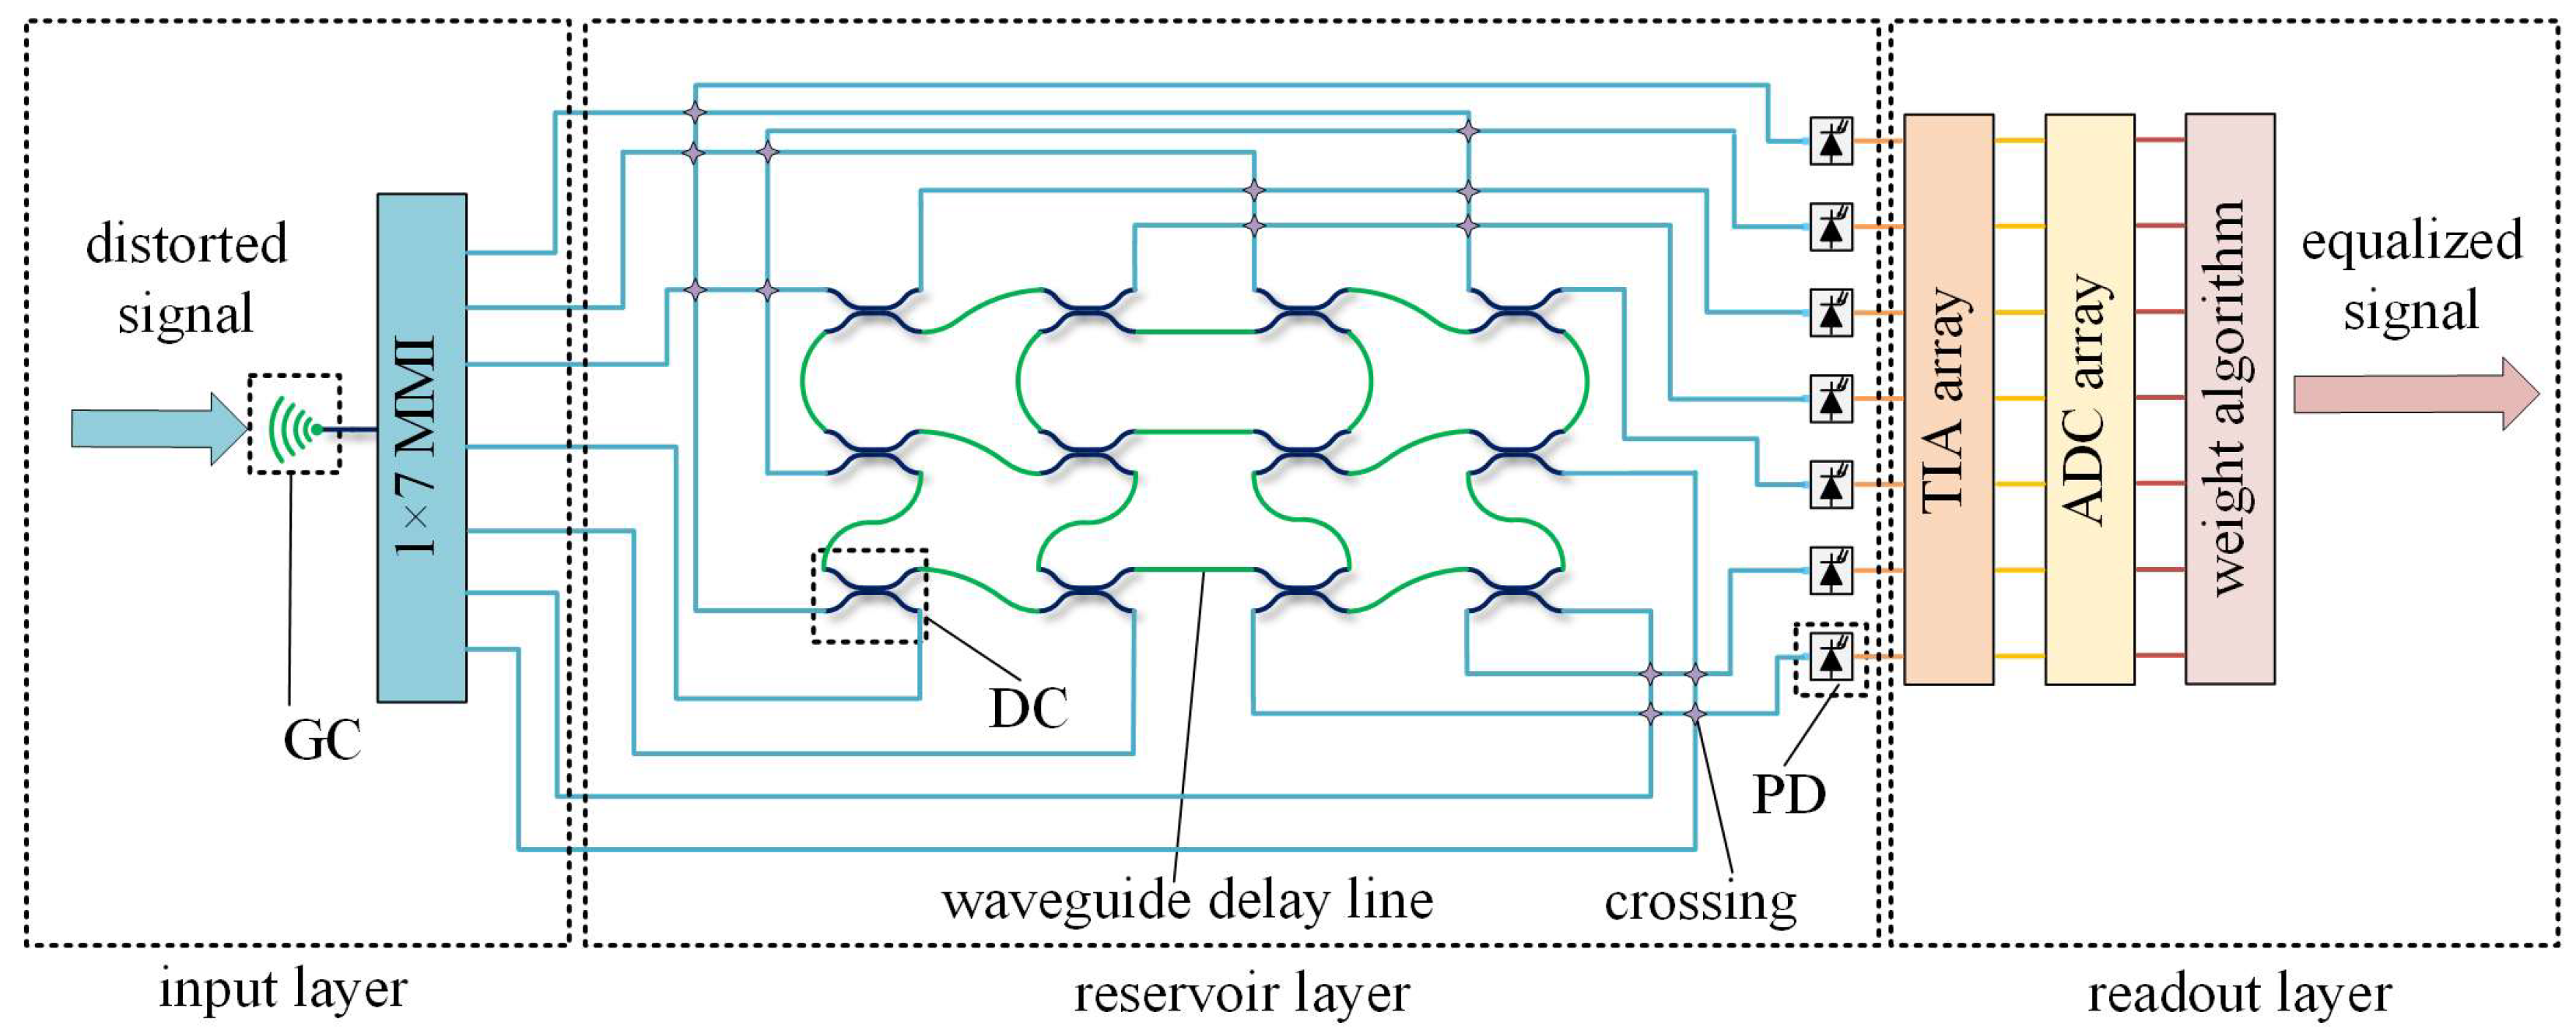
The PhRC architecture is divided into three layers: the input layer, the reservoir layer, and the readout layer. Each of these layers can be fabricated using complementary metal oxide semiconductor (CMOS) technology on SOI materials. Since the performance of the optical readout layer is similar to that of an optoelectronic readout layer equipped with ridge regression algorithms, in order to reduce the overall simulation time, all four PhRC structures in this paper adopt optoelectronic readout layers, with only the input layer and the reservoir layer implemented using photonic integrated devices. The rectangular reservoir layer structures with 12 nodes, 24 nodes, 36 nodes, and 48 nodes are shown in
Figure 1a, b, c, and d, respectively.
In the simulation, the input optical signal is a discrete time signal, and the state update equation between the input layer and the reservoir layer is as follows:
where
and
are vectors, representing the reservoir layer status and input layer status, respectively.
and
are matrices, representing the weights of input layer and output layer, respectively.
t and
t + 1 represent the current moment and the next moment, respectively. The state update equation between the reservoir layer and the readout layer is as follows:
where
is a vector, which represents the output signal of the output layer,
is a matrix, which represents the weight of the readout layer.
is the activation function.
Taking the 12-node layout as an example, the overall PhRC structure is shown in
Figure 2. In the input layer, the distorted optical signal output from the fiber enters the on-chip waveguide via a grating coupler (GC), and then it is equally divided into seven parts by a 1 × 7 MMI to enter the reservoir layer. The transmission relationship of the input layer is as follows:
where
,
, …,
are electric fields of the seven optical signals output from the input layer.
is the electric field of the distorted signal.
and
represent the insertion losses of GC and MMI, respectively, with the unit being dB.
In the reservoir layer, DCs and waveguide delay lines represent nodes and delay elements, respectively. To minimize the use of waveguide crossing devices within the reservoir layer, both the input and output positions are placed at the outermost nodes. The number of input and output ports in the reservoir layer is seven each, and their transmission relationship is as follows:
where
,
, …,
are the electric fields of the seven optical signals’ output from the reservoir layer. Due to the large number of devices in the reservoir, representing them in mathematical form would be relatively complex. Therefore, the transmission matrix is denoted by
. The length of the waveguide delay line in the reservoir layer is represented by a length coefficient, which is the ratio of the duration of signal transmission on the waveguide delay line to the time interval of symbols, as shown in the following equation:
where
is delay time of the waveguide delay line.
represents one symbol period. The splitting ratio of DC is represented using a splitting ratio coefficient, with the equation as follows:
where
represents the output power at the through port of DC, while
represents the input power.
In the readout layer, photodiodes (PDs) are used to convert the optical signal output from the reservoir into current signals. These current signals are then converted into voltage signals by a transimpedance amplifier (TIA) array. Subsequently, analog-to-digital converters (ADCs) are employed to sample and discretize the voltage signals before they are sent to a computer for weight training. Ultimately, the trained weights produce an equalized signal. The transfer equation for PD is as follows:
where
,
, …,
represent the output current of PDs.
,
, …,
are noises generated by PDs during photoelectric conversion. These noises follow a Gaussian distribution. The square-law relationship between optical intensity and current in PDs is crucial for implementing nonlinear activation functions.
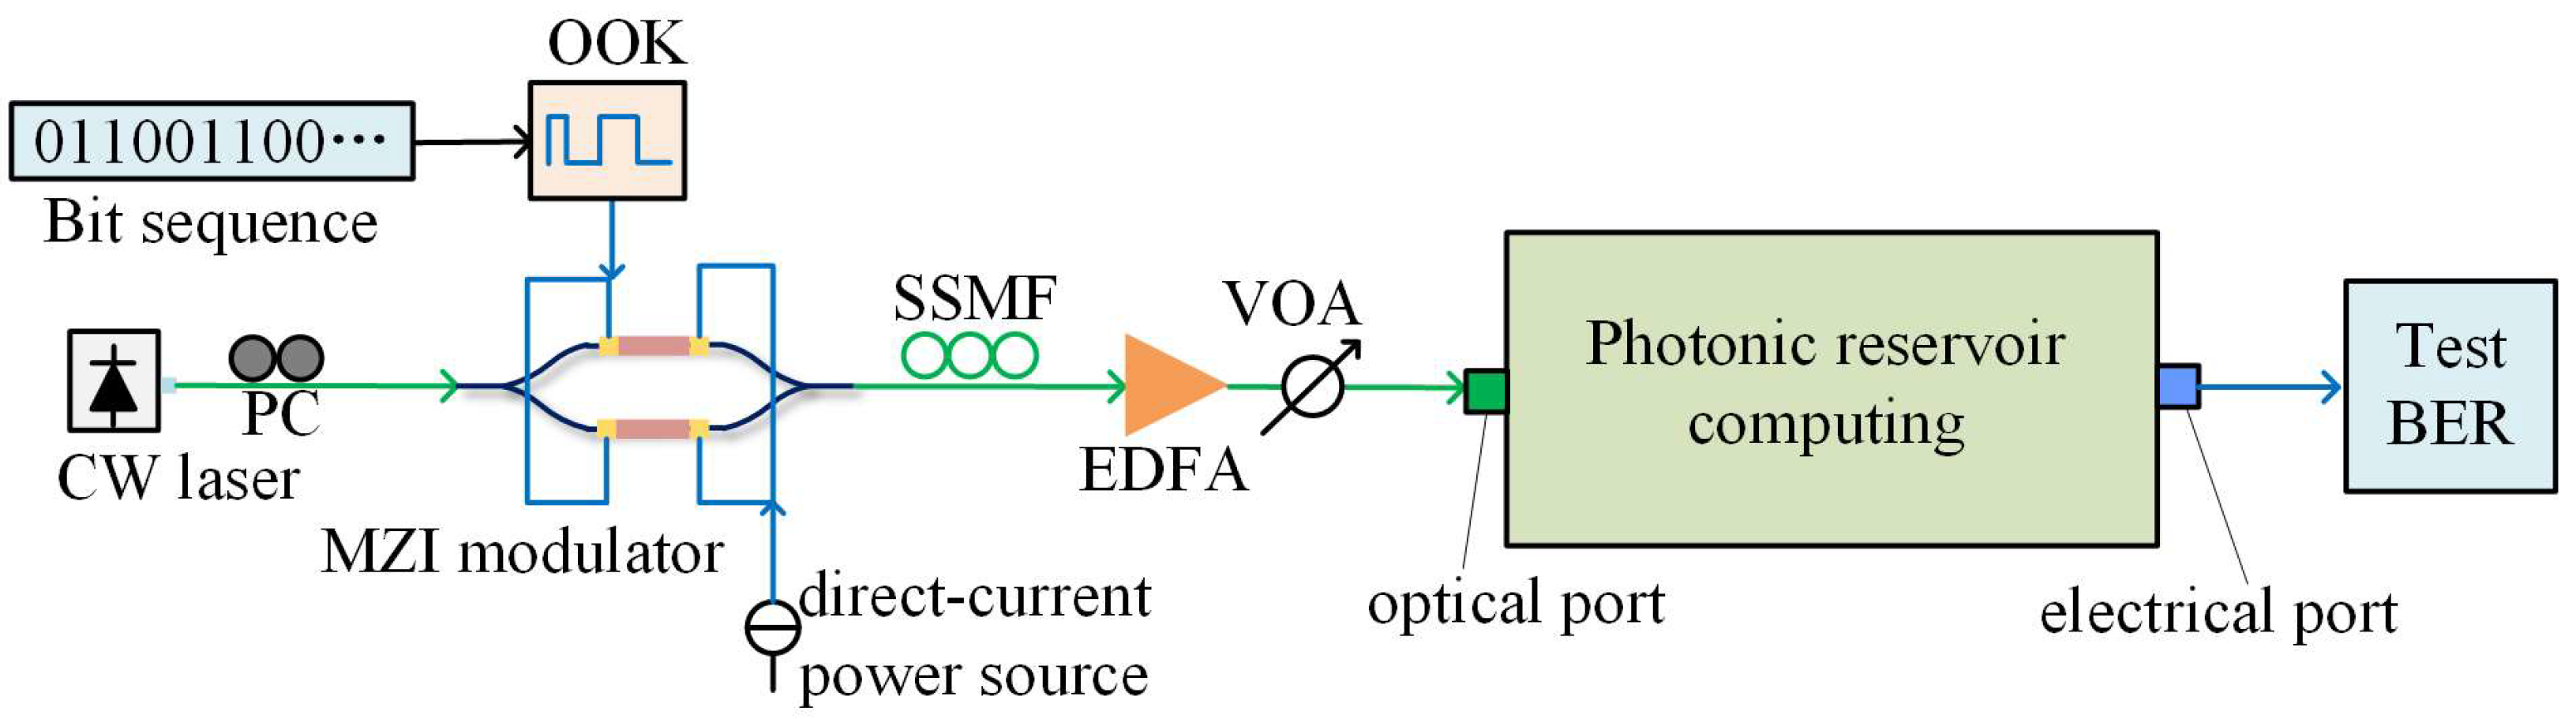
The IMDD system for channel noise equalization verification is shown in
Figure 3. A continuous-wave (CW) laser generates continuous light with a center wavelength of 1550 nm. The polarization controller (PC) can manipulate the polarization state within this link. Random bit sequences are generated using the Mason rotation method, and the on–off keying (OOK) modulation scheme is employed. The modulator utilizes a differential Mach Zehnder modulator (MZM). The modulated signal is then transmitted through standard single-mode fiber (SSMF), where it undergoes distortion due to noise in the channel. The erbium-doped fiber amplifier (EDFA) and variable optical attenuator (VOA) are utilized to control the optical power input into the PhRC, maintaining it at 20 dBm. The distorted signal is used as the input for the PhRC, where equalization is performed using the bit error rate (BER) of the equalized signal as the basis for judging equalization performance. The simulation system is implemented utilizing Python 3.8.0 as its foundational platform, featuring a distorted signal comprising a 25 Gb/s OOK signal that is generated through the transmission over a 20 km SSMF. The key parameters involved in the verification system and PhRC during the simulation are shown in
Table 1.
Due to the limitations of the simulation equipment, the symbol length of the input signal is 2
14, with 16 samples per symbol. Therefore, the BER is obtained based on the probability density function (PDF). After validating various distribution functions, it is determined that the PDF of each received symbol conforms to a Gaussian distribution. The BER is estimated using the following formula:
where
and
represent the probability of symbols “0” and “1”, respectively.
is the judgment threshold.
and
represent probability density function of symbols “0” and “1”.
3. Results and Discussion
3.1. Parameter Optimization of Reservoir Photonic Devices
In the reservoir layer of PhRC, besides the number of nodes affecting the equalization results, the splitting ratio of DCs and the length of waveguide delay lines also have significant impacts on the outcomes. Therefore, we study the equalization performance of PhRC when both factors and the number of nodes change. The distorted 25 Gb/S OOK signal is generated by a 20 km SSMF, of which the BER is 2.108 × 10⁻².
Due to the difficulty in fabricating DCs with a splitting ratio coefficient
of 0.1 and the high similarity in device characteristics
of between 0.2 and 0.8, values within the
range of 0.2 to 0.5 are selected for discussion. During optimization, the waveguide delay line coefficient is held constant at 0.1 while
is varied from 0.2 to 0.5 in increments of 0.1 to assess equalization ability. When the number of reservoir nodes ranged from 12 to 48, the impact of different
on noise equalization results is discussed for each reservoir layout, as shown in
Figure 4a.
The equalization performance across four PhRC reservoir layer layouts indicates that, except for the 12-node layout, all other PhRC layouts can reduce the BER of the distorted signal, during fluctuation of . Notably, the 36-node layout achieves an equalized signal’s BER of 1.859 × 10⁻⁵, representing a three-orders-of-magnitude reduction compared to the BER of the distorted signal. As the increases from 0.2 to 0.5, the BER of the equalized signals in all four PhRC layouts with different reservoir node counts exhibits a downward trend. This suggests that an unbalanced DC splitting is harmful to the equalization performance of PhRCs. This is because a significant bias in DC splitting towards one port results in reduced output power at the other port, weakening the influence of this low-power signal on the subsequent node. Similarly, a higher output power can significantly affect or even overshadow the signal at the next node, disrupting the intended information exchange. When the DC splitting is more balanced, signals interacting between nodes can more evenly incorporate information from each input path, thereby providing higher performance without change the node connection topology.
When comparing the four node counts individually, it is evident that the 12-node layout performs worst at of 0.2, 0.3, and 0.4, and second-worst at = 0.5. The 24-node layout is second-worst at of 0.2 and 0.3, worst at = 0.5, and only slightly better than the 36-node structure at 0.4. The 36-node layout is optimal at of 0.2 and 0.5, second-best at = 0.3, and second-worst only at = 0.4. The 48-node layout is second-best at of 0.2 and 0.5, optimal at all others. These results indicate that layouts with fewer nodes are more sensitive to changes in the DC splitting ratio and more challenging to achieve good channel noise equalization. At the four node count of PhRCs, the optimal result for the DC splitting ratio coefficient is 0.5.
The length of the waveguide delay line primarily influences the duration of signal interaction at each optical node, remaining fixed once the chip fabrication is completed. Due to the existence of insertion loss, the length of the waveguide delay line also affects the overall optical power loss within PhRC. Therefore, we only discuss cases where the waveguide delay coefficient
rid falls within the range of 0.1 to 1.0, incremented by 0.1. For a fair comparison, the
of DCs in all reservoir layouts is set to 0.5. Processing errors in long waveguides can introduce random phases to the optical signals transmitted through them. For a fair comparison, we average the BER values of the equalized signals generated from 50 sets of random phases. The equalization results are shown in
Figure 4b.
The BER of all four reservoir layouts with varying node counts exhibits an increasing trend as rid increases. Furthermore, none of the layouts demonstrate equalization effectiveness when rid exceeds 0.3. Except for the 12-node layout, the performance of the other layouts with different node counts is highly consistent across the various rid values, with the curves appearing nearly overlapping. This indicates that the equalization performance of the 24-node, 36-node, and 48-node layouts is relatively uniform across different delay line lengths. The 12-node layout achieves the best equalization performance under conditions where rid ranges from 0.2 to 1.0. This is attributed to the fewer nodes, resulting in better output power compared to layouts with more nodes. Although the 12-node layout yields better BER results, they remain within the same order of magnitude. The 24-node layout achieves the best result of BER = 3.073 × 10⁻⁴ at rid = 0.1, which is one order of magnitude lower than the BER of the distorted signal. The characteristics of the 36-node and 48-node layouts are very similar, both losing their equalization capability when rid > 0.2. The results indicate that, for the same equalization task, reservoir layouts with different node counts converge towards a preference for shorter waveguide delay lines. The optimal result for the waveguide delay line length coefficient is 0.1.
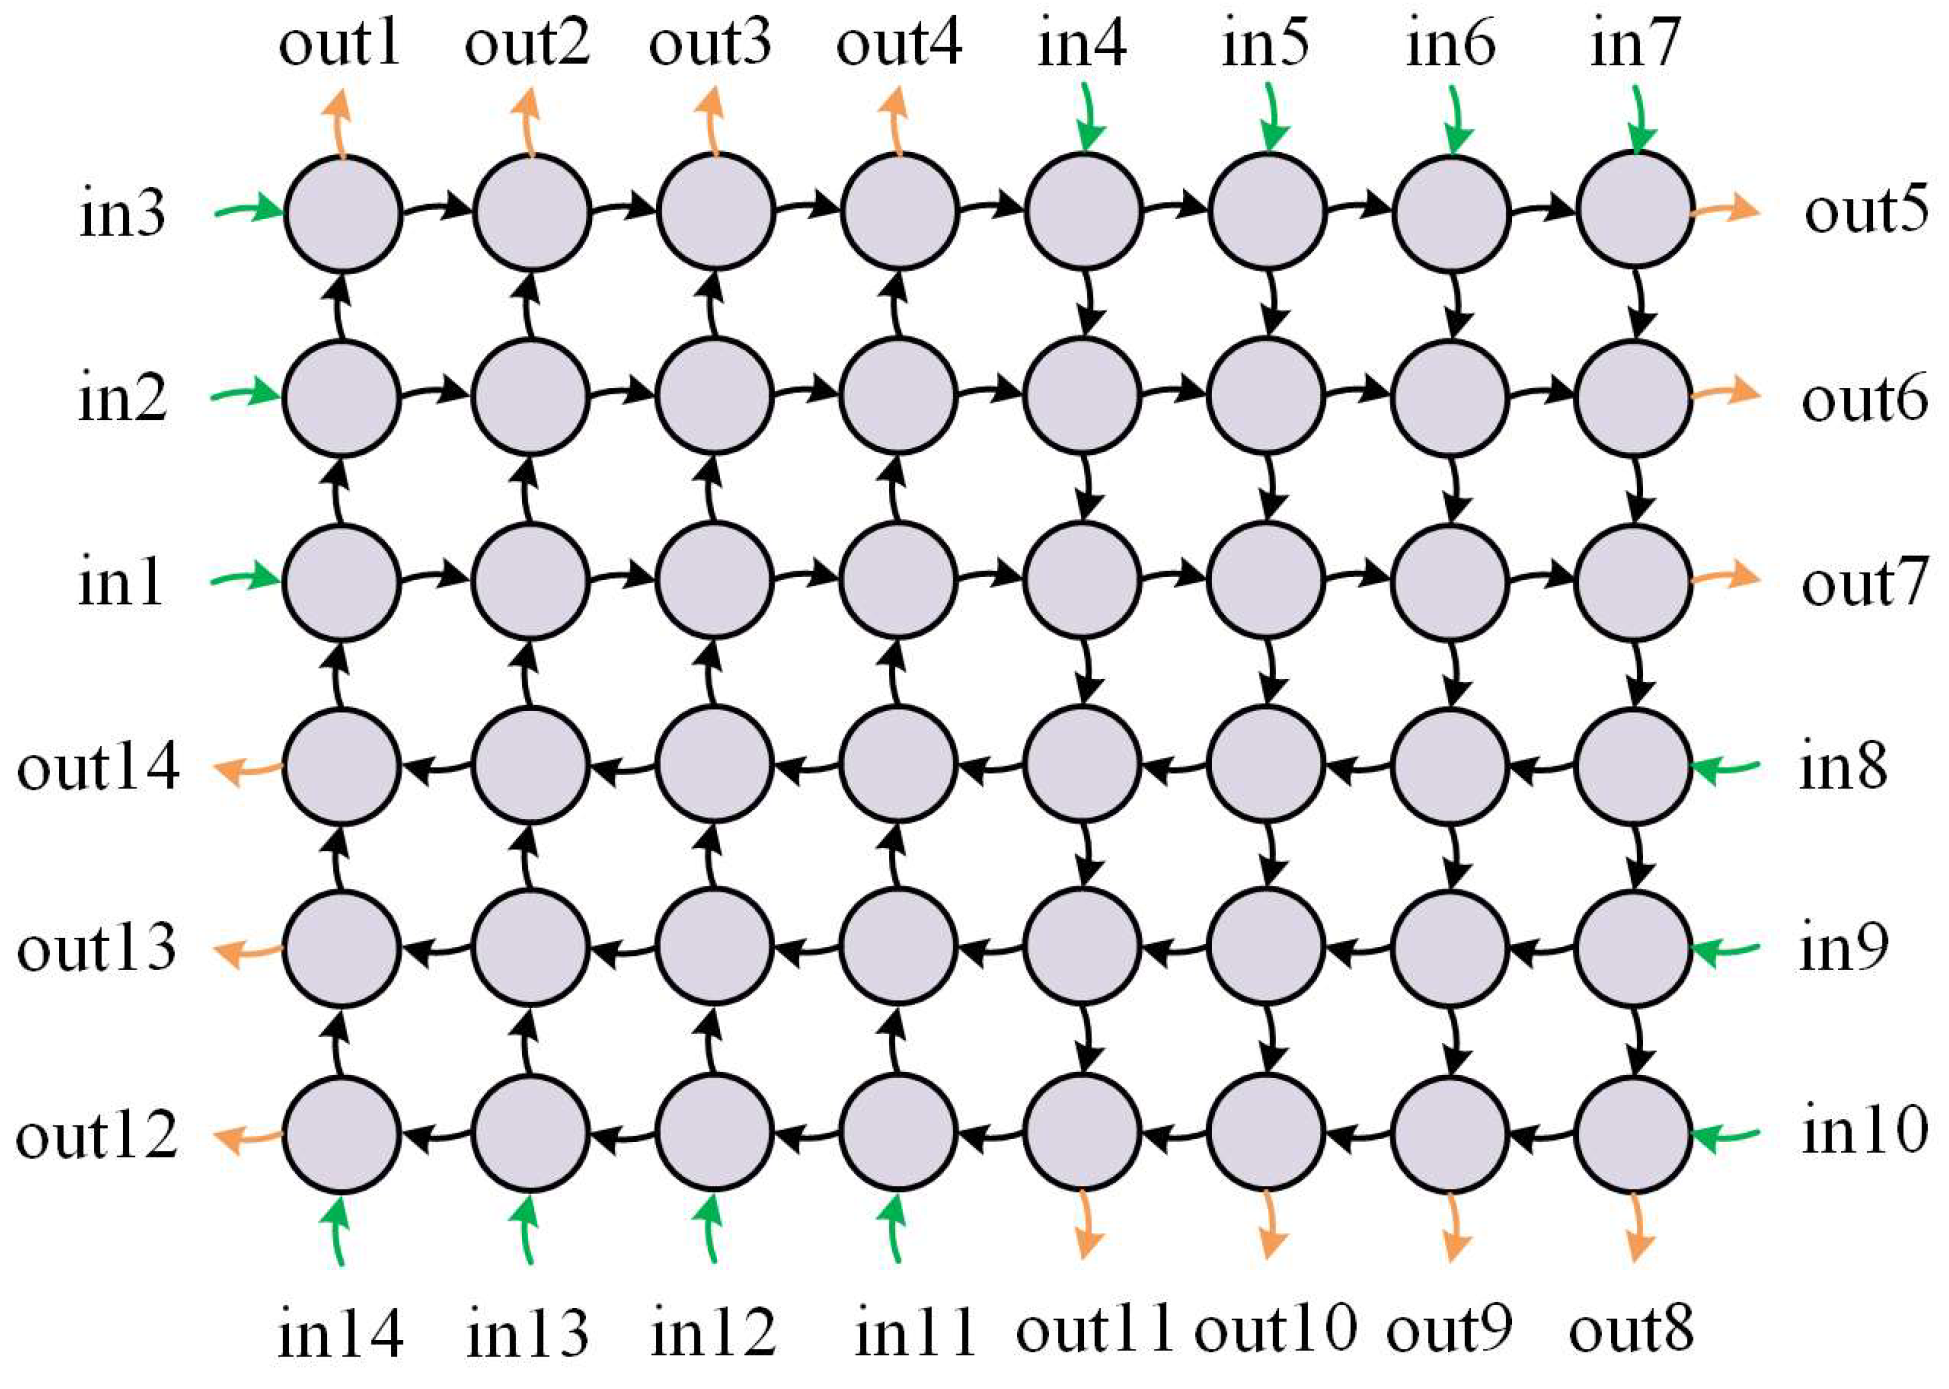
3.2. Optimization of Input and Output Port Counts
The equalization capability of different input and output port quantities was analyzed based on a 48-node layout. The input and output ports are distributed along the four sides of the rectangle, named in clockwise order, with a maximum of 14 ports each, as shown in
Figure 5.
When discussing the input port counts, the number of output ports is fixed at 14, while the number of input ports is varied from 2 to 14. The same approach is used when discussing the number of output ports. For a fair comparison, the insertion loss of the input layer’s beam splitter is set to 0. The distorted signal is a 25 Gb/s OOK and 50 Gb/s PAM4 signal transmitted through a 20 km fiber.
The equalization results for varying numbers of input nodes are shown in
Figure 6a. For both OOK and PAM4 modulation formats of the distorted signals, increasing the number of input nodes does not significantly change the final equalization outcome. When the number of input nodes increases from 2 to 14, the BER of the equalized signal fluctuates around the mean value. This is because the distorted input signal is equally divided by a beam splitter into multipath signals with the same power. Each of the split optical signals carries the same information into the reservoir, and regardless of the number of splits, the optical signal power entering the reservoir remains constant. This result demonstrates that the PhRC performance is insensitive to changes in the number of inputs.
The equalization results for different numbers of output ports are shown in
Figure 6b. Under both OOK and PAM4 modulation formats, from 2 to 14 output ports, the equalization capability of the PhRC generally exhibits an upward trend as the number of ports increases. However, at certain specific numbers of output ports, fewer ports may achieve a better BER after equalization. For instance, during OOK signal equalization, the BER at three output ports is significantly lower than the data points surrounding it. This phenomenon arises because some nodes output redundant information, and the inclusion of such redundant information can lead to slight instability in the final weight training process.
3.3. Equalization Performance for Different Types of Noise
In optical communication systems, dispersion generated by optical fibers and ASE noise caused by amplifiers are the main types of noise. To thoroughly verify the impact of single-type noise on the equalization performance of different reservoir layouts, the distorted signals are discussed under the condition of considering only dispersion noise and ASE noise. When generating single-type noise signals, an ideal signal generation system is used. The degree of noise is controlled through simulation parameters during transmission. Dispersion noise is obtained by transmitting through a special fiber model that only has dispersion parameters over distances of 10 km, 15 km, 20 km, and 25 km. ASE noise is simulated using Gaussian white noise and obtained under optical signal-to-noise ratio (OSNR) conditions of 0 dB, 5 dB, 10 dB, and 15 dB. When verifying the equalization performance, the reservoir parameters of each layout are adjusted to their optimal values.
The equalization results of dispersion noise are shown in
Figure 7a. When dealing with 10 km of fiber dispersion noise, the 24-node layout achieves the best equalization performance with a BER of 1.416 × 10
−14, which is followed by the 12-node layout, then the 48-node layout, and finally the 36-node layout. The worst performance has a BER of 7.449 × 10
−9. Under these conditions, the extreme difference in the equalized signal’s BER between the four layouts exceeds five orders of magnitude. According to mathematical principles, PhRCs with more nodes should possess greater capability and thus achieve better equalization performance. However, the simulation results show an opposite trend, when the transmission distance is less than 15 km. The reason for this phenomenon is that the BER of the distorted signal of 15 km is 2.043 × 10
−3, suggesting that the distortion is not significantly severe. Layouts with fewer nodes are fully capable of handling this level of distortion. Additionally, layouts with a greater number of nodes suffer from higher insertion losses, which reduces the power of the equalized signal. As a result, layouts with more nodes exhibit inferior equalization performance in this scenario. However, when the transmission task exceeds 20 km, the equalization performance improves with an increase in the number of nodes. This is because the BER of the distorted signal reaches as high as 1.549 × 10
−1 at 25 km, making the computational capability of reservoir structures with fewer nodes insufficient. In this scenario, the 48-node layout, which has the largest number of nodes, demonstrates a clear advantage with a BER of 1.373 × 10
−4, representing a three-orders-of-magnitude reduction compared to the distorted signal. Therefore, it is necessary to comprehensively consider the computational complexity of the problem and the number of reservoir nodes in PhRC when solving problems of varying complexity to achieve the highest cost-effectiveness.
The equalization results of PhRC with only ASE noise in the channel is shown in
Figure 7b. As the OSNR increases from 0 dB to 15 dB, there is a downward trend in the equalized signal’s BER from four layouts. PhRC has limited equalization performance at high OSNR. When OSNR at 0 dB, the BER of equalized signals from all architectures fails to achieve more than a one-order-of-magnitude reduction compared to the distorted signals. When the OSNR rises to 5 dB, the BER of the distorted signal is 1.506 × 10
−1. The equalized signal’s BER of the best-performing 48-node layout is 1.465 × 10
−2, representing a one-order-of-magnitude decrease. At OSNR values of 10 dB and 15 dB, the optimal layout is the 48-node one, which reduces the BER of the distorted signals by one and three orders of magnitude, respectively. These results indicate that as the impact of ASE noise reduces and OSNR improves, the equalization capability of PhRC becomes stronger. This is because when ASE noise is high and comparable to signal power, it is difficult to separate the noise from the signal, limiting the equalization capabilities of PhRC chips. When ASE noise decreases to a level where PhRC chips can fully exert their equalization effects, it is observed that the number of nodes and the equalization capability exhibit a positive correlation, suggesting that reservoir layouts with more nodes tend to exhibit superior equalization performance in the presence of ASE noise.
In practical optical fiber communication system links, noise is a mixture comprising dispersion, power attenuation, and nonlinear noise. We investigate the equalization performance of PhRC across various fiber transmission lengths, as illustrated in
Figure 8a. At a transmission length of 10 km, the 24-node layout achieves the best equalization result, BER = 1.651 × 10⁻¹², and yields a seven-orders-of-magnitude BER reduction after equalization. Given the relatively low difficulty of the equalization task at this point, the 12-node layout delivers a suboptimal outcome, whereas the equalization performances of the 36-node and 48-node layouts are inferior. As the transmission length increases to 20 km, the noise equalization task becomes more challenging. The equalization capabilities of the 12- and 24-node layouts begin to falter, resulting in higher BERs for their equalized signals compared to those of the 36-node and 48-node layouts. At a fiber transmission length of 30 km, the BER of the equalized signals decreases sequentially with increasing node count.
In addition to transmission length, signal speed also affects noise equalization. With the transmission length fixed at 20 km, we examine the equalization performance of PhRCs at different signal speeds, results as shown in
Figure 8b. At the lower signal speed of 10–20 Gb/s, the BER of the equalized signal decreases with increasing node count. However, as the signal speed rises to 30–50 Gb/s, while the 12-node and 24-node layouts still follow the positive correlation between node count and equalization capability, the equalization results for the 36-node and 48-node layouts exhibit opposite trends. This is because a reservoir layout with 36 nodes can meet the equalization requirements and achieve an optimal trade-off between the number of nodes and insertion loss. This demonstrates that, for specific tasks, there exists an optimal number of reservoir nodes, which is not necessarily the maximum within the selectable range.


