Article

Stability Assessment of Rydberg Electromagnetically Induced Transparency Locking via Optical Heterodyne Spectroscopy

School of Physics and Astronomy, Sun Yat-sen University, Zhuhai 519082, China
*
Author to whom correspondence should be addressed.
These authors contributed equally to this work.
Photonics 2025, 12(4), 374; https://doi.org/10.3390/photonics12040374
Submission received: 20 March 2025 / Revised: 9 April 2025 / Accepted: 10 April 2025 / Published: 13 April 2025

Abstract

:
Frequency locking to reference atomic lines using Rydberg electromagnetically induced transparency (EIT) has been recently introduced as an inexpensive and reliable technique for laser frequency stabilization. In this work, we carry out a systematic study of this technique using heterodyne beat spectroscopy. Two different commercial semi-conductor lasers are locked to the same reference frequency using EIT locking, and their relative frequency stability is analyzed and continuously monitored in real time. A substantial improvement in the laser frequency stability is achieved through searching for the optimal proportional–integral settings and EIT probe laser powers. The results show that the cutoff frequency of the beat signal can be lowered to less than 500 kHz. We also compare the frequencies of free running lasers with that of a locked laser and characterize their frequency drifts. This study is important in assessing the use of Rydberg EIT locking in atomic electrometers.

1. Introduction

Laser frequency stabilization is crucial in the field of atomic and molecular physics for laser cooling and trapping [1,2,3], time and frequency standards [4,5,6], quantum computing [7,8], and sensing [9,10]. Common factors that affect the stability of free running lasers include the environmental temperature and humidity conditions, mechanical vibrations, current driver noise, and residual spontaneous emission in the laser. Laser frequency stabilization techniques are designed to eliminate the resulting frequency drifts and narrow down the instantaneous laser linewidth, and they have become essential in conducting laser-related experimental research.
Currently, the most commonly used laser frequency stabilization techniques include Pound–Drever–Hall locking [11,12,13] and methods based on spectroscopy, such as saturated absorption spectroscopy (SAS) [14,15], modulation transfer spectroscopy [16,17,18], and electromagnetically induced transparency (EIT) [19,20,21]. In contrast to SAS used in many cold atom experiments [22,23], EIT locking is a novel method that offers simplicity for stabilization to atomic transitions over a wide range of wavelengths. It often relies on a ladder scheme of EIT involving a Rydberg energy level (Rydberg EIT). Given that the EIT probe laser is being locked on a transition from ground to intermediate states—for example, from 6 S 1 / 2 to 6 P 3 / 2 states in Cesium—it allows for the locking of the wavelength of the EIT coupling laser on any transition from the intermediate to Rydberg states, without requiring the modulation of the coupling laser frequency.
While this method holds great promise, a systematic study of its stability has not been performed yet. Therefore, optimizing the frequency locking parameters and effectively monitoring the frequency locking status remain critical and necessary tasks.
Beat spectroscopy transfers the frequency and phase information of a high-frequency signal to a signal of low frequency, and it is widely used in laser physics for laser linewidth measurement [24,25,26], frequency stability monitoring [13,27], and frequency locking [28,29]. Typically, the beat frequency signal can be observed by sending two lasers with close central wavelengths on a fast photodetector and monitoring the signal corresponding to their frequency difference [17,28]. The reference frequency laser may be provided by an optical frequency comb [4,30,31,32] or another continuous-wave laser [10,28,33] or generated through time-delaying one of the lasers under test in self-homodyne and self-heterodyne beat spectroscopies [34,35,36]. The beat frequency signal effectively captures the fluctuations in the tested laser frequency in real time and with high sensitivity [37]. Therefore, it serves as a powerful tool in monitoring the stability of laser frequency locking systems.
In this paper, we investigate the performance and optimization of Rydberg EIT-based laser frequency locking using heterodyne beat spectroscopy. We systematically examine the stability of two independently locked lasers—a 510 nm external-cavity diode laser (ECDL) and a frequency-doubled 510 nm distributed feedback (DFB) fiber laser—by generating and analyzing their beat notes.
By monitoring the beat frequency spectrum over time, we assess the relative stability of the locked lasers and characterize their relative fluctuations under different locking conditions. To enhance the frequency stabilization, we optimize key experimental parameters, including the proportional–integral (PI) controller settings and probe beam power, demonstrating their direct influence on the cutoff frequency of the beat signal. We also acquire the beat note in the case where one of the lasers is free-running and study the frequency drift of both lasers.
Our study contributes to the broader development of laser frequency stabilization, particularly for applications of atomic electrometry [38,39].

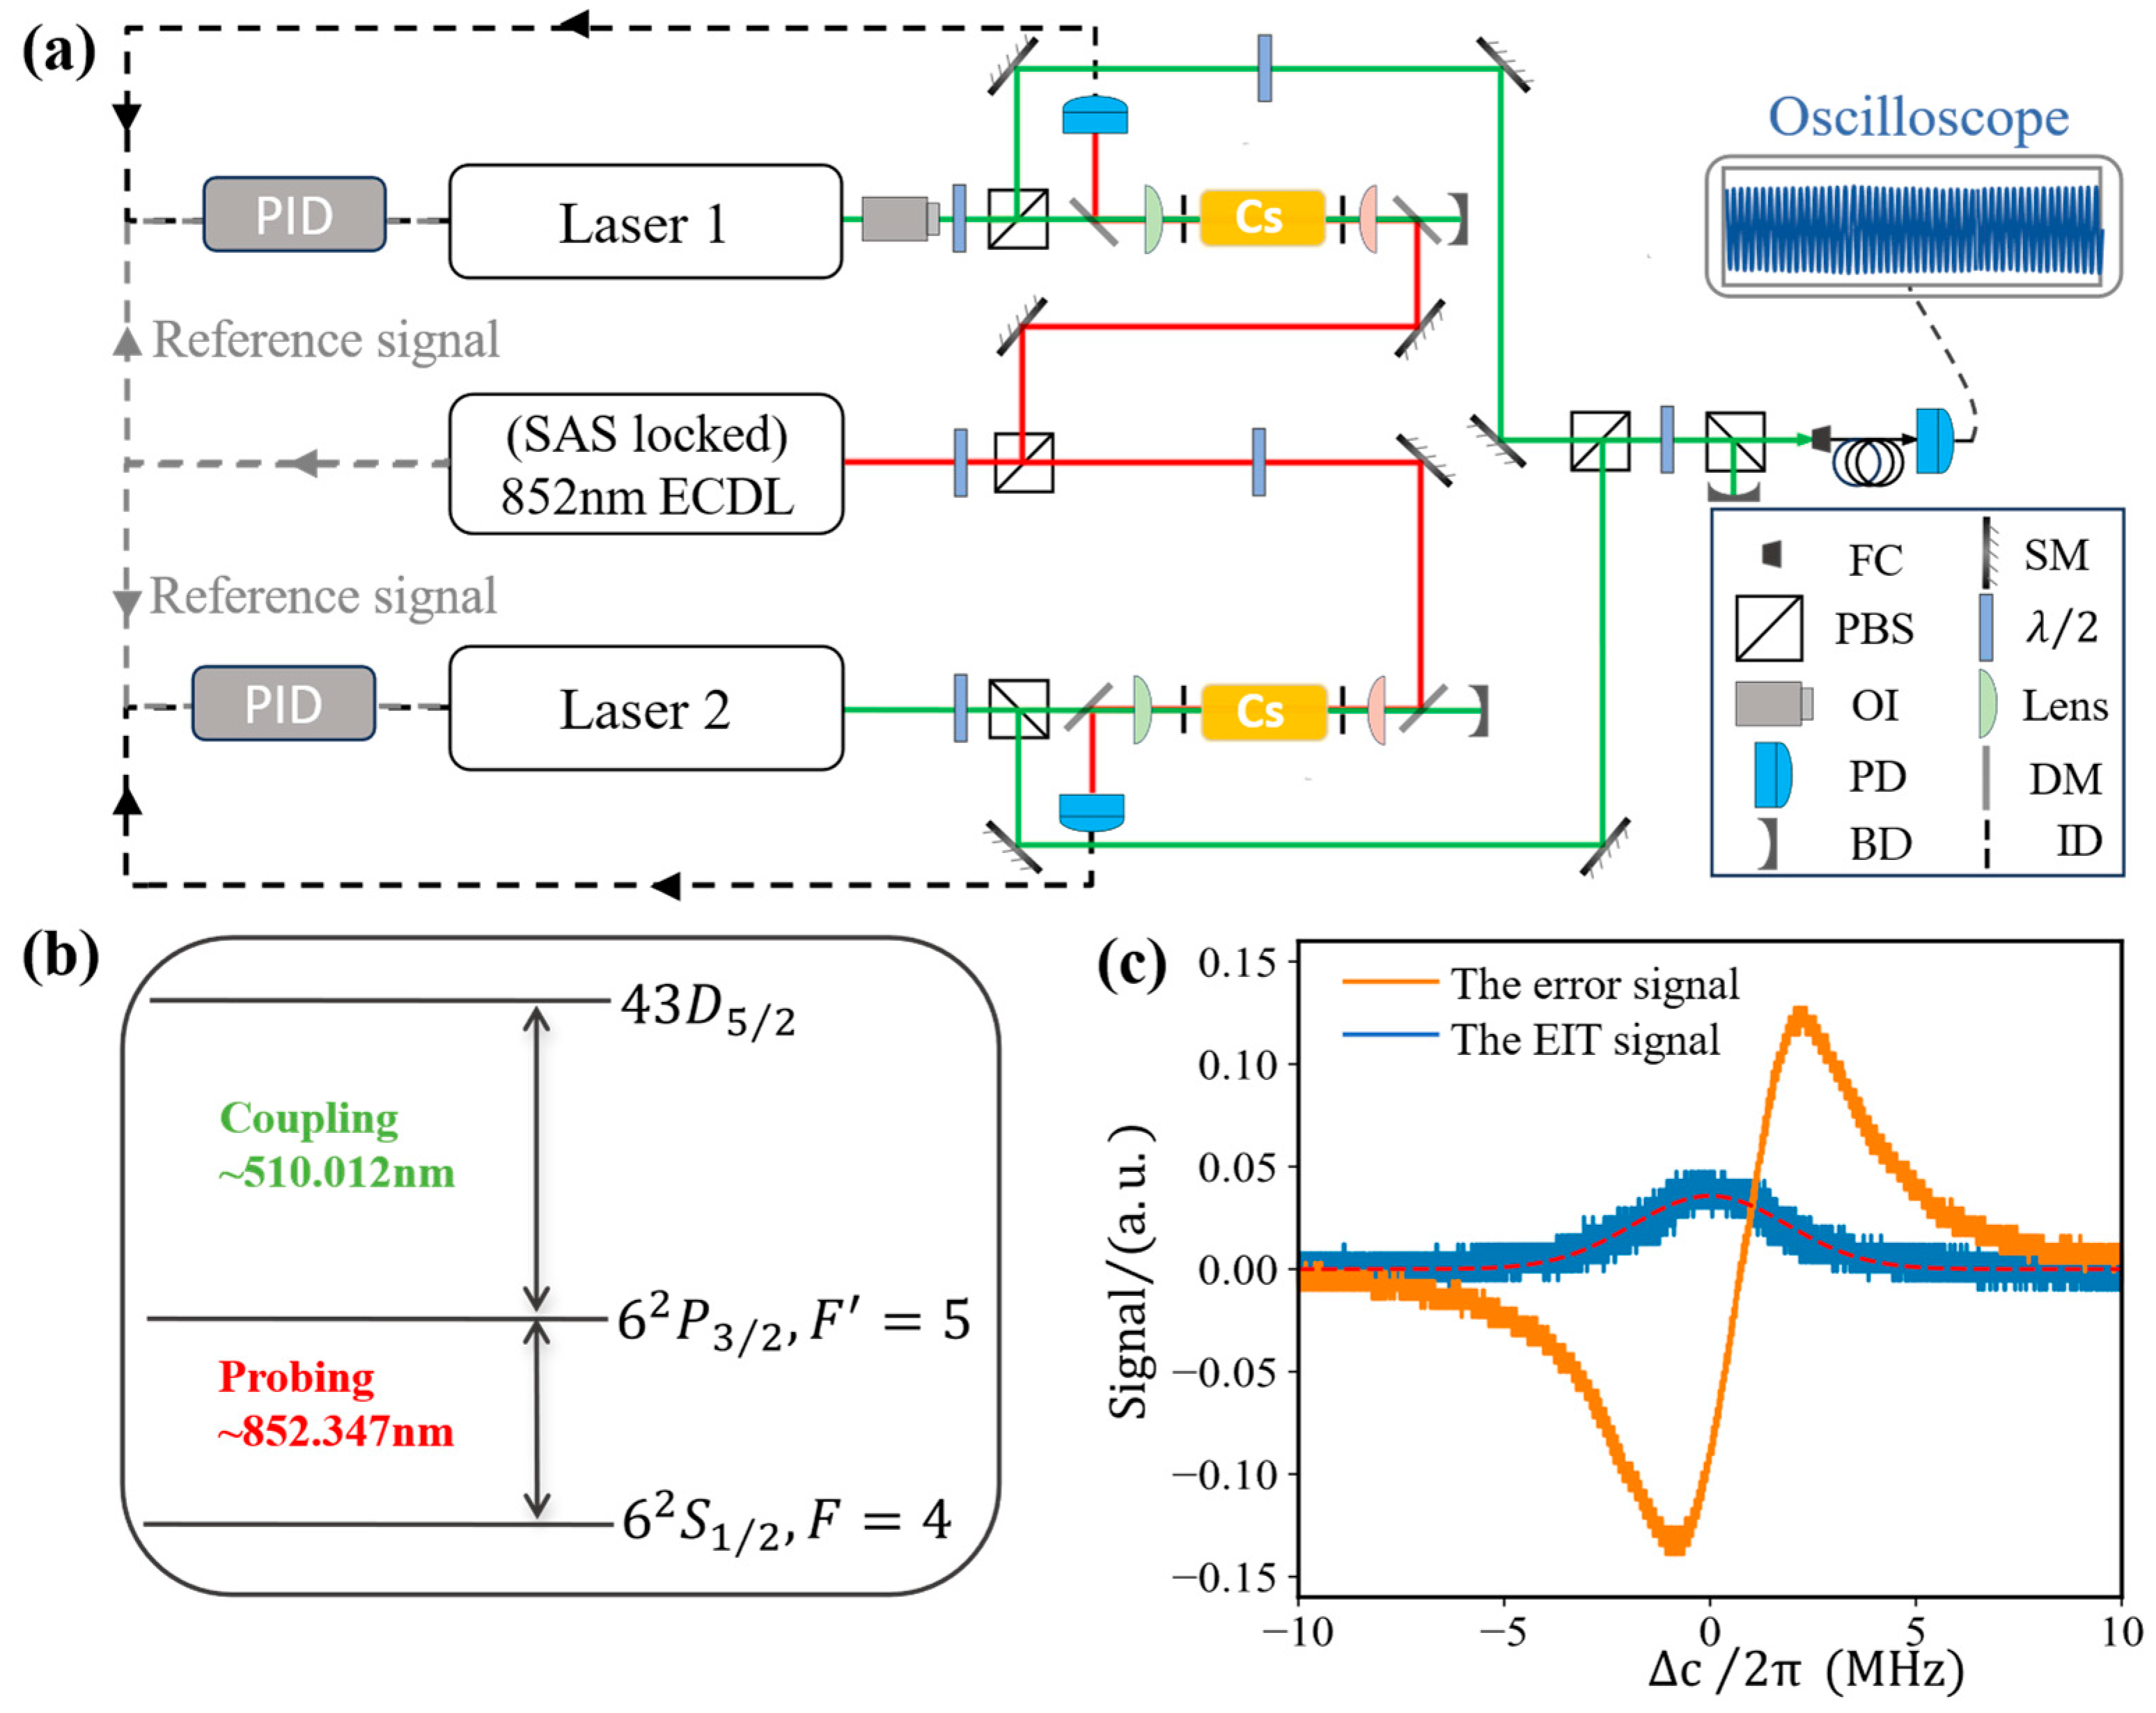
2. Experimental Setup

The experimental layout used for frequency locking to Cesium (Cs) atomic transitions and monitoring is shown in Figure 1a, including a frequency-stabilized 852 nm ECDL, two 510 nm lasers with optical paths and feedback loops for EIT locking, and the beat note spectroscopy setup. A 510 nm ECDL (Uniquanta, Beijing, China, ECL801-510) with a linewidth of 1 MHz and a frequency-doubled (DFB) fiber laser at 510 nm (Precilaser, Shanghai, China, FL-SF-1020-S) with a linewidth of 3.8 kHz serve as the EIT coupling lasers. Meanwhile, the 852 nm ECDL (Uniquanta, Beijing, China, ECL801-852) is employed as the probe laser and is locked on resonance with the | 6 2 S 1 / 2 , F = 4 | 6 2 P 3 / 2 , F = 5 D2 transition of Cs using SAS frequency locking. The relevant energy levels of Cs in this experiment are shown in Figure 1b. Throughout this work, the two coupling lasers are chosen to drive the | 6 2 P 3 / 2 , F = 5 | 43 D 5 / 2 transition.
In the two EIT setups used for locking, as displayed in Figure 1a, the probe and coupling beams have powers of 10 μW and 24 mW, respectively. They are counter-propagating and focused at the center of Cs vapor cells, which have a diameter of 10 mm and a length of 50 mm and are maintained at a temperature of 296 K. The waists ( 1 / e 2 radius) of the beams at focus are slightly different in the two setups. For the stabilization of the 510 nm ECDL (laser 1), the probe beam waist equals 103.35 μm, while the coupling beam is slightly elliptical with horizontal and vertical waists of ω x = 76.85 μm and ω y = 45.5 μm, respectively. For the frequency-doubled 510 nm DFB fiber laser (laser 2), the probe and coupling beam waists are 82.2 μm and 79.5 μm, respectively. The resonance in the probe transmission spectrum of Figure 1c versus frequency detuning Δ C of laser 2 illustrates the phenomenon of EIT. Due to EIT, the Cs vapor cell is transparent for the probe light when Δ C = 0 and is otherwise opaque due to the short lifetime of | 6 2 P 3 / 2 , F = 5 . A full width at half maximum of 4.4 MHz is inferred from a Gaussian fit of the EIT resonance in Figure 1c. Similarly, the EIT linewidth is 2.2 MHz for laser 1.
For the acquisition of spectra as in Figure 1c, it is important to ensure the precise calibration of the laser frequency. For this, after stabilizing the 852 nm ECDL frequency with SAS locking, we linearly and independently scan the two 510 nm lasers’ frequencies The via their internal piezoelectric transducers (PZT). In doing so, several EIT peaks are observed, revealing the hyperfine structure of 6 2 P 3 / 2 . In practice, the frequency interval of 168 MHz between the EIT peaks due to the | 6 2 P 3 / 2 , F = 4 and | 6 2 P 3 / 2 , F = 5 energy levels is employed for calibration and conversion between time and frequency during scanning [19].
One particularity of EIT locking is that it only requires the modulation of the frequency of the probe laser and not that of the coupling laser [20]. In our setup, the 27 kHz modulation signal used for the SAS locking of the probe laser is also employed for the EIT locking of the coupling lasers, as sketched in Figure 1a. More specifically, the modulation signal from the frequency-locking module of the 852 nm ECDL serves as the reference signal for the demodulation of the signal acquired with the photodetectors (PDs) via lock-in amplifiers (laser 1: Sine OE1022; laser 2: Sine OE1201), producing error signals. The error signals are fed back through a servo controller (laser 1: Uniquanta module; laser 2: New Focus LB1005), where a proportional–integral (PI) control circuit regulates the piezoelectric actuators (PZT) to stabilize the frequencies of the lasers.
To obtain the beat signals generated by the two 510 nm lasers, we first match the powers of the two laser beams and combine them with a HWP and a PBS, and we then obtain coherent superposition using a second PBS as an analyzer, as illustrated in Figure 1a. After spatial mode filtering with a 1-m-long single-mode optical fiber, the beat note is acquired with a PD (Thorlabs, USA, DET36A2) with a 25 MHz bandwidth when loaded with a 50   Ω resistor. The beat signal output from the PD is transmitted to an oscilloscope or a spectrum analyzer through a 2-m-long coaxial cable for analysis both in real time and in the frequency domain. To enhance the amplitude of the beat signal on the oscilloscope, a load resistor of 1   k Ω is connected to the detector, with the drawback of reducing the bandwidth of the detection and inducing impedance mismatch, as discussed further. Note that the 1   k Ω resistor has no noticeable influence on the measurement with the spectrum analyzer because of its 50   Ω input impedance.

3. Results

3.1. Simultaneous Locking of Two Coupling Lasers and Analysis of Beat Signal

In this section, we analyze the relative stability between the two locked coupling lasers using beat note spectroscopy. As shown in Figure 2a,b, the beat signal observed on the oscilloscope exhibits periodic oscillations at the frequency difference between the two lasers, as well as fluctuations in phase and frequency due to the lack of stability of the locking systems. Note that the DC component has been removed for convenience in this figure. Note as well that the amplitude of the oscillations is slightly reduced at a higher frequency difference between the two lasers due to the reduced bandwidth of the detector, as mentioned in the previous section. Therefore, such amplitude fluctuations are a direct indication of the degree of frequency stability of the lasers.
To more precisely quantify the frequency distribution characteristics of the beat signal, we perform a Fast Fourier Transform (FFT) on the signal in Figure 2a, and the results are shown in Figure 2c. After applying Gaussian fitting, we identify the −3 dB point where the amplitude drops to 0.707 of its maximum value. The frequency corresponding to this point is defined as the cutoff frequency. Based on the data analysis in Figure 2c, the cutoff frequency is determined to be 0.36 MHz.

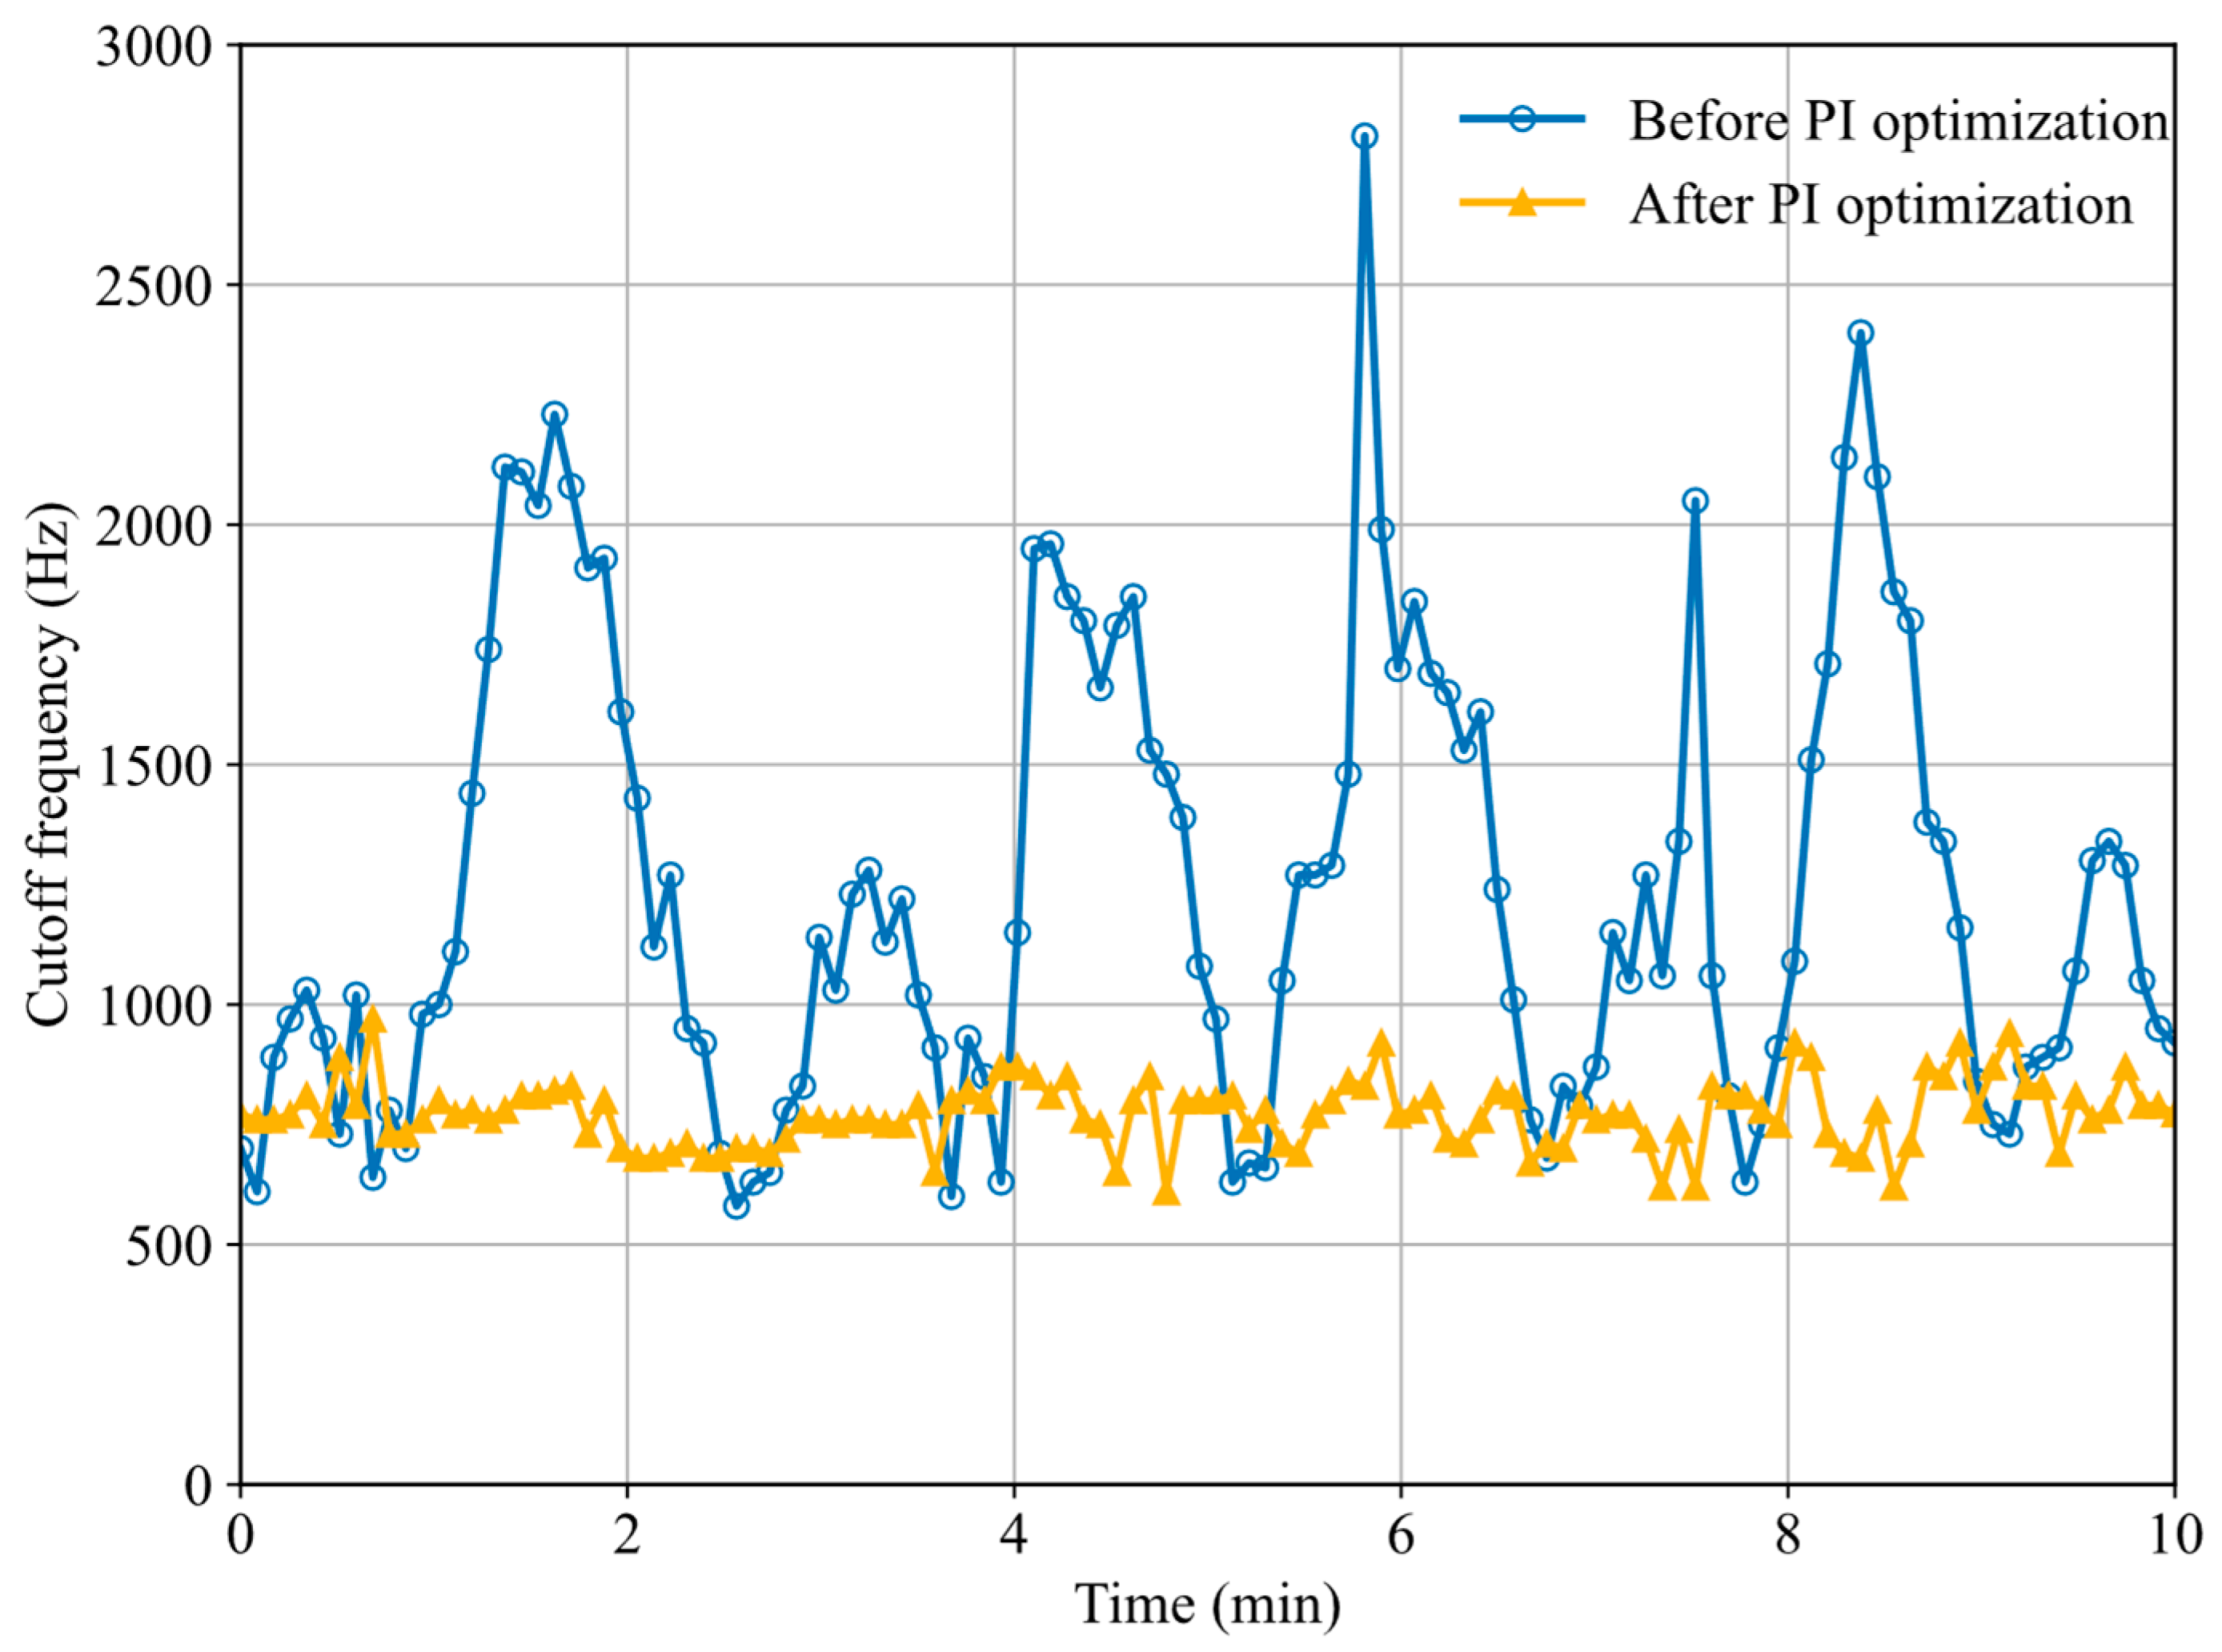
3.2. Optimizing Frequency Locking Parameters Through Beat Signal

Sending the beat signal into a spectrum analyzer enables the real-time monitoring of the cutoff frequency and the optimization of the different locking parameters. The measuring time used with the spectrum analyzer is 5 s, considerably larger than that used in Figure 2, which allows for a more precise measurement of the cutoff frequency. The cutoff frequency is defined as the frequency point on the spectrum where the power drops to 0.707 times the power of the reference point (−3 dB level). Here, the reference point corresponds to the minimum resolvable frequency of the spectrum analyzer within a 3 MHz bandwidth, typically of about 150 kHz.
The measurement of the cutoff frequency allowed us to optimize the PI values in the feedback loops of the two lasers. During this process, we observed that the integral gain (I value) before optimization was excessively high, causing significant fluctuations in the error signal. To address this, we reduced the I value and adjusted the proportional gain (p value) to an appropriate level, effectively mitigating this source of noise.
Figure 3 illustrates the effect of the PI values on the cutoff frequency during the optimization of laser frequency locking. As shown, the cutoff frequency exhibits significant fluctuations before optimization, exceeding 1 MHz. After optimization, the cutoff frequency is stabilized at around 700 kHz. This indicates that the frequency locking stability is significantly improved. Overall, by monitoring the cutoff frequency of the beat signal, we successfully identified the optimal PI parameters for the laser system.
After optimizing the PI values, we investigated the effect of EIT on the beat frequency signal by varying the power of the probe beam. As shown in Figure 4, the power of the probe beam in the laser 1 locking system was systematically varied from 5 μW to 40 μW, and the corresponding cutoff frequency was recorded using a spectrum analyzer. The experimental results indicate that increasing the probe beam power not only broadens the linewidth of the EIT signal in laser 1 but also raises the cutoff frequency. This phenomenon may be attributed to nonlinear optical effects, such as power broadening, induced at large probe powers. For probe powers below 20 μW, the cutoff frequency exhibits reduced fluctuations and is close to 750 kHz. As the probe beam power is increased, the significant broadening of the EIT spectrum is observed, accompanied by a notable rise in the cutoff frequency. These experimental findings indicate that a higher probe beam power substantially compromises the stability of the frequency-locking system. The residual frequency bandwidth of the 852 nm probe laser may also influence the EIT locks. However, the frequency noise induced on the two EIT locks by this finite bandwidth should be highly correlated and largely eliminated when acquiring the beat signal.
In our current laser system, power stabilization has not yet been implemented. Nevertheless, the coupling lasers feature good power stability, with power stability of 0.25% over ten hours for laser 2 and 1.73% for laser 1. Importantly, we found that the angle of the Cs cell significantly affected the frequency stabilization of laser 1. This effect likely occurs because the reflected light from the Cs cell at different angles enters back into laser 1 due to the insufficiency of the 30 dB optical isolator being employed. We have reduced this effect as much as possible, and it remains to be seen whether an additional optical isolator could further improve the stability of this laser.

3.3. Characterization of Beat Frequency Spectra in Partially Locked Dual-Laser Systems

In this section, optical heterodyne spectroscopy is employed to compare free-running and locked lasers. For this, we frequency-lock one of the two 510 nm lasers and linearly scan the frequency of the other one around the locked frequency. For convenience, time is converted to frequency in Figure 5 and Figure 6, based on our calibration of the PZT scanning speed.
The envelope of the beat signal in Figure 5a is limited by the frequency response of the detector and its width is close to 25 MHz, as expected for a 50   Ω load. However, the amplitude and shape of the beat signal exhibit unexpected variations depending on the load resistance and cable length from detector to oscilloscope in Figure 5b,c. Through experimental analysis, it was found that the distortion of the frequency response of the detector originates from electric impedance mismatch and the long coaxial cable. This electric impedance mismatch results in a high-energy reflection coefficient between the transducer and cable interface. Consequently, the high-frequency components of the signal form standing waves within the cable, leading to distortion and even to the appearance of side beats [40].
As illustrated in Figure 5, the power of the 510 nm laser used to generate the beat signal was adjusted from 0.7 mW to 5 mW, with laser 1 locked and laser 2 scanning. By systematically varying the load resistance and the length of the coaxial cable, we observed that longer cables exacerbate impedance mismatch, resulting in stronger signal reflections and an increased number of harmonic components, as demonstrated in Figure 5b. Furthermore, compared to the 50 Ω load resistor, the use of a 500 Ω resistor and a cable length of one meter significantly enhances the signal amplitude and improves the signal-to-noise ratio (SNR), albeit with the existence of a residual spectral flat band extending beyond the expected bandwidth of 2.5 MHz, as shown in Figure 5c.
With a cable length of 2 m and a load of 1   k Ω , the experimental results display smaller secondary oscillatory regions at frequency differences of several megahertz from a narrow center, whose positions and sizes may dynamically vary over time. While choosing a cable length of 2 m and a load of 1   k Ω may seem inappropriate, it appears that this choice is useful for time-domain analysis. The left spectrum in Figure 6a presents a symmetric beat note spectrum obtained when laser 2 is frequency-locked while laser 1 is scanned, whereas the right one, acquired when laser 1 and laser 2 are exchanged, is asymmetric.
We believe that the asymmetry is due to a dynamical effect where the central frequency of the laser varies during the scan. We have verified that this effect is reduced when a faster scanning speed of the PZT is used. As shown in Figure 6b, we collected the beat signals over a 21 min period for each scanned laser and measured the ratio of the spacing δf from the central beat to one of the side beats and the spacing ∆f between the two side ones. The blue solid line represents the relative variation δf/∆f when laser 2 is locked and laser 1 is scanned, while the red dashed line shows the variation in δf/∆f for the case where the roles of laser 1 and laser 2 are reversed. The variations are more significant in the latter case, highlighting the fact that the middle beat does not lie at the center between the side ones when laser 2 is scanned and that this position varies over the course of time.
While scanning the frequency of the unlocked laser with a slow triangle wave modulation applied to its PZT, we can also monitor the time at which the central beat is observed. The time between the scan synchronization trigger and the central beat observation time on the oscilloscope varies due to the frequency drift of the unlocked laser. Both lasers drift steadily, as shown in Figure 6c, and at a relatively similar pace. However, small oscillations are observed in Figure 6c, in addition to the overall drift. By combining the data from Figure 6b,c, it can be concluded that the oscillations of the central frequency arrival time and asymmetry are correlated. The central frequency of laser 2 not only drifts but also oscillates relatively rapidly, and this rapid oscillation is also observed to cause asymmetry in the EIT spectrum of laser 2 in Figure 6a. We speculate that this phenomenon originates from nonlinear frequency scanning using the PZT and is an inherent issue within the laser itself. Therefore, from this analysis, we find that the ECDL laser (laser 1) may be a better choice for frequency scanning in free-running mode.

4. Conclusions

In summary, we have analyzed the stability of the EIT locking scheme via heterodyne beat spectroscopy. For this, we have employed a single modulation signal to simultaneously lock the probe and two coupling lasers used in EIT and measured the beat between the coupling lasers.
By analyzing the beat note in the frequency domain, we have defined the cutoff frequency as a relevant parameter to quantitatively evaluate the locking stability. We optimized the PI settings and EIT probe power to determine suitable system locking parameters. Additionally, we observed unique beat signal patterns in the time domain between a locked reference laser and a free-running laser scanned in frequency, with the beat note distortion indicative of impedance mismatch and excessive cable lengths. These patterns allowed us to realize a time-domain analysis of the stability of frequency-scanned unlocked lasers.
In the future, improving the feedback mechanism of our 510 nm ECDL and using higher-performance optical isolators could enhance the locking stability. The external frequency modulation of the laser with a higher frequency could be used to increase the bandwidth of the lock.

Author Contributions

Q.Y. and Y.L. contributed equally. Conceptualization, T.V. and Q.Y.; methodology, Q.Y. and Y.L.; software, Y.L.; validation, Q.Y., Y.L., N.J. and H.L.; formal analysis, Y.L. H.L. and Q.Y.; investigation, N.J. and H.L.; resources, Y.L. and T.V.; data curation, Q.Y.; writing—original draft preparation, Q.Y.; writing—review and editing, T.V. and Q.Y.; supervision, T.V.; project administration, T.V.; funding acquisition, T.V. All authors have read and agreed to the published version of the manuscript.

Funding

This research was supported by the National Natural Science Foundation of China under grant numbers 12174460 and 92476111.

Institutional Review Board Statement

Not applicable.

Informed Consent Statement

Not applicable.

Data Availability Statement

Data are contained within the article.

Acknowledgments

During the preparation of this manuscript, the authors used ChatGPT-4 and DeepSeek for the purposes of polishing the manuscript’s grammar and syntax. The authors have reviewed and edited the output and take full responsibility for the content of this publication.

Conflicts of Interest

The authors declare no conflicts of interest.

References

  1. Prodan, J.; Migdall, A.; Phillips, W.D.; So, I.; Metcalf, H.; Dalibard, J. Stopping Atoms with Laser Light. Phys. Rev. Lett. 1985, 54, 992–995. [Google Scholar] [CrossRef] [PubMed]
  2. Chow, M.N.H.; Little, B.J.; Jau, Y.-Y. High-Fidelity, Low-Loss State Detection of Alkali-Metal Atoms in Optical Tweezer Traps. Phys. Rev. A 2022, 108, 032407. [Google Scholar] [CrossRef]
  3. Bouillon, A.; Marin-Bujedo, E.; Génévriez, M. Direct Laser Cooling of Rydberg Atoms with an Isolated-Core Transition. Phys. Rev. Lett. 2024, 132, 193402. [Google Scholar] [CrossRef]
  4. Wildi, T.; Ulanov, A.E.; Voumard, T.; Ruhnke, B.; Herr, T. Phase-Stabilised Self-Injection-Locked Microcomb. Nat. Commun. 2024, 15, 7030. [Google Scholar] [CrossRef]
  5. Takamoto, M.; Hong, F.-L.; Higashi, R.; Katori, H. An Optical Lattice Clock. Nature 2005, 435, 321–324. [Google Scholar] [CrossRef] [PubMed]
  6. Ludlow, A.D.; Boyd, M.M.; Ye, J.; Peik, E.; Schmidt, P.O. Optical Atomic Clocks. Rev. Mod. Phys. 2015, 87, 637–701. [Google Scholar] [CrossRef]
  7. Steane, A. Quantum Computing. Rep. Prog. Phys. 1998, 61, 117. [Google Scholar] [CrossRef]
  8. Shih, C.-Y.; Motlakunta, S.; Kotibhaskar, N.; Sajjan, M.; Hablützel, R.; Islam, R. Reprogrammable and High-Precision Holographic Optical Addressing of Trapped Ions for Scalable Quantum Control. npj Quantum Inf. 2021, 7, 57. [Google Scholar] [CrossRef]
  9. Farooq, A.; Alquaity, A.B.S.; Raza, M.; Nasir, E.F.; Yao, S.; Ren, W. Laser Sensors for Energy Systems and Process Industries: Perspectives and directions. Prog. Energy Combust. Sci. 2022, 91, 100997. [Google Scholar] [CrossRef]
  10. Guo, Y.; Shen, Y.; Tong, X.; Wu, H. Simultaneous Measurement of Vibration and Temperature Based on FBG and DBR Fiber Laser Beat Frequency Digital Sensing System. Opt. Fiber Technol. 2023, 75, 103155. [Google Scholar] [CrossRef]
  11. Black, E.D. An Introduction to Pound–Drever–Hall Laser Frequency Stabilization. Am. J. Phys. 2001, 69, 79–87. [Google Scholar] [CrossRef]
  12. Chao, Y.-X.; Hua, Z.-X.; Liang, X.-H.; Yue, Z.-P.; You, L.; Khoon Tey, M. Pound–Drever–Hall Feedforward: Laser Phase Noise Suppression beyond Feedback. Optica 2024, 11, 945. [Google Scholar] [CrossRef]
  13. Bai, W.-L.; Peng, W.-C.; Zhang, Q.-Y.; Wang, C.; Ao, Z.-Y.; Tong, X. Long Term Frequency Stabilization and Frequency Drift Suppression of the 313 Nm Laser. Chin. J. Phys. 2024, 89, 1500–1507. [Google Scholar] [CrossRef]
  14. Preston, D.W. Doppler-Free Saturated Absorption: Laser Spectroscopy. Am. J. Phys. 1996, 64, 1432–1436. [Google Scholar] [CrossRef]
  15. Utreja, S. Frequency Stabilization of Multiple Lasers to a Reference Atomic Transition of Rb. Sci. Rep. 2022, 12, 20624. [Google Scholar] [CrossRef] [PubMed]
  16. Preuschoff, T.; Schlosser, M.; Birkl, G. Optimization Strategies for Modulation Transfer Spectroscopy Applied to Laser Stabilization. Opt. Express 2018, 26, 24010–24019. [Google Scholar] [CrossRef]
  17. Lee, S. Compact Modulation Transfer Spectroscopy Module for Highly Stable Laser Frequency. Opt. Lasers Eng. 2021, 146, 106698. [Google Scholar] [CrossRef]
  18. Lee, S.; Moon, G.; Park, S.E.; Hong, H.-G.; Seo, S.; Kwon, T.Y.; Lee, S.-B.; Lee, J.H. Laser Frequency Stabilization in the 10−14 Range via Optimized Modulation Transfer Spectroscopy on the 87Rb D2 Line. Opt. Lett. 2023, 48, 1020–1023. [Google Scholar] [CrossRef]
  19. Mohapatra, A.K.; Jackson, T.R.; Adams, C.S. Coherent Optical Detection of Highly Excited Rydberg States Using Electromagnetically Induced Transparency. Phys. Rev. Lett. 2007, 98, 113003. [Google Scholar] [CrossRef]
  20. Jiao, Y.; Li, J.; Wang, L.; Zhang, H.; Zhang, L.; Zhao, J.; Jia, S. Laser Frequency Locking Based on Rydberg Electromagnetically Induced Transparency. Chin. Phys. B 2016, 25, 053201. [Google Scholar] [CrossRef]
  21. Yang, K.; Mao, R.; An, Q.; Sun, Z.; Fu, Y. Laser Frequency Locking Method for Rydberg Atomic Sensing. Chin. Opt. Lett. 2023, 21, 021407. [Google Scholar] [CrossRef]
  22. Park, C.Y.; Yoon, T.H. Efficient Magneto-Optical Trapping of Yb Atoms with a Violet Laser Diode. Phys. Rev. A 2003, 68, 055401. [Google Scholar] [CrossRef]
  23. Elgin, J.D.; Heavner, T.P.; Kitching, J.; Donley, E.A.; Denney, J.; Salim, E.A. A Cold-Atom Beam Clock Based on Coherent Population Trapping. Appl. Phys. Lett. 2024, 115, 033503. [Google Scholar] [CrossRef] [PubMed]
  24. Legero, T.; Matei, D.G.; Häfner, S.; Grebing, C.; Weyrich, R.; Riehle, F.; Sterr, U.; Zhang, W.; Robinson, J.; Sonderhouse, L.; et al. 1.5 Μm Lasers with Sub 10 mHz Linewidth. Phys. Rev. Lett. 2017, 118, 263202. [Google Scholar]
  25. Bai, Z.; Zhao, Z.; Qi, Y.; Ding, J.; Li, S.; Yan, X.; Wang, Y.; Lu, Z. Narrow-Linewidth Laser Linewidth Measurement Technology. Front. Phys. 2021, 9, 768165. [Google Scholar] [CrossRef]
  26. Hu, S.; Lv, P.; Guan, C.; Li, S.; Qin, H.; Li, X.; Chen, X.; Zhan, L.; Wang, W.; Xiao, Y.; et al. Study on Linewidth and Phase Noise Characteristics of a Narrow Linewidth External Cavity Diode Laser. Sensors 2024, 24, 1103. [Google Scholar] [CrossRef]
  27. Wu, Y.; Qin, F.; Ding, Z.; Xu, R.; Li, D. Research on the Frequency Stabilization System of an External Cavity Diode Laser Based on Rubidium Atomic Modulation Transfer Spectroscopy Technology. Photonics 2024, 11, 298. [Google Scholar] [CrossRef]
  28. Uehara, T.; Tsuji, K.; Hagiwara, K.; Onodera, N. Optical Beat-Note Frequency Stabilization between Two Lasers Using a Radio Frequency Interferometer in the Gigahertz Frequency Band. Opt. Eng. 2014, 53, 124109. [Google Scholar] [CrossRef]
  29. Li, V.; Diorico, F.; Hosten, O. Laser Frequency-Offset Locking at 10-Hz-Level Instability Using Hybrid Electronic Filters. Phys. Rev. Appl. 2022, 17, 054031. [Google Scholar] [CrossRef]
  30. Idjadi, M.H.; Kim, K.; Fontaine, N.K. Modulation-Free Laser Stabilization Technique Using Integrated Cavity-Coupled Mach-Zehnder Interferometer. Nat. Commun. 2024, 15, 1922. [Google Scholar] [CrossRef]
  31. Shen, Z. Increase in the Signal-to-Noise Ratio of the Beat Note between a Frequency Comb and a Continuous-Wave Laser. Phys. Rev. Appl. 2024, 21, 034066. [Google Scholar]
  32. Schimpf, D.N.; Olgun, H.T.; Kalaydzhyan, A.; Hua, Y.; Kärtner, F.X. Frequency-Comb-Based Laser System Producing Stable Optical Beat Pulses with Picosecond Durations Suitable for High- Precision Multi-Cycle Terahertz-Wave Generation and Rapid Detection. Opt. Express 2019, 27, 11037–11056. [Google Scholar] [CrossRef] [PubMed]
  33. Siddharth, A.; Attanasio, A.; Bianconi, S.; Lihachev, G.; Zhang, J.; Qiu, Z.; Bancora, A.; Kenning, S.; Wang, R.; Voloshin, A.S.; et al. Piezoelectrically tunable, narrow linewidth photonic integrated extended-DBR lasers. Optica 2024, 11, 1062–1069. [Google Scholar] [CrossRef]
  34. Hill, J.C.; Holland, W.K.; Kunz, P.D.; Cox, K.C.; Penttinen, J.-P.; Kantola, E.; Meyer, D.H. Intra-Cavity Frequency-Doubled VECSEL System for Narrow Linewidth Rydberg EIT Spectroscopy. Opt. Express 2022, 30, 41408. [Google Scholar] [CrossRef]
  35. Ludvigsen, H.; Bodtker, E. New method for self-homodyne laser linewidth measurements with a short delay fiber. Opt. Commun. 1994, 110, 595–598. [Google Scholar] [CrossRef]
  36. Ali, A.H.; Abdul-Wahid, N. Analysis of Self-Homodyne and Delayed Self-Heterodyne Detections for Tunable Laser Source Linewidth Measurements. IOSR J. Eng. 2012, 2, 1–6. [Google Scholar]
  37. Zhou, T.; Qi, X.; Wang, Q.; Xiong, W.; Duan, J.; Zhou, X.; Chen, X. Frequency-stabilized diode laser at 780 nm with a continuously locked time over 100 h. Chin. Opt. Lett. 2010, 8, 496. [Google Scholar] [CrossRef]
  38. Jing, M.; Hu, Y.; Ma, J.; Zhang, H.; Zhang, L.; Xiao, L.; Jia, S. Atomic superheterodyne receiver based on microwave-dressed Rydberg spectroscopy. Nat. Phys. 2020, 16, 911–915. [Google Scholar] [CrossRef]
  39. Sedlacek, J.; Schwettmann, A.; Kübler, H.; Löw, R.; Pfau, T.; Shaffer, J.P. Microwave electrometry with Rydberg atoms in a vapour cell using bright atomic resonances. Nat. Phys. 2012, 8, 819–824. [Google Scholar] [CrossRef]
  40. Rathod, V.T. A Review of Electric Impedance Matching Techniques for Piezoelectric Sensors, Actuators and Transducers. Electronics 2019, 8, 169. [Google Scholar] [CrossRef]
Figure 1. (a) Experimental setup of the frequency locking system. The optical components in the legend are as follows: fiber collimator (FC); polarizing beam splitter (PBS); optical isolator (OI); biased silicon detector (PD); beam dump (BD); steering mirror (SM); half-wave plate (λ/2); dichroic mirror (DM); and iris diaphragm (ID). (b) Energy level diagram of Cesium showing the atomic transitions relevant for locking. (c) EIT signal (blue thick line) and corresponding error signal (orange thin line) versus Δ C for laser 2. The dashed red line is the result of a Gaussian fit.
Photonics 12 00374 g001
Figure 2. Processing and analysis of the beat frequency signal after the simultaneous locking of the two 510 nm lasers. (a) Time-domain representation of the beat frequency signal. (b) Zoomed-in view of the beat frequency signal observed during 0.3 ms. (c) Beat signal in the frequency domain obtained after Fast Fourier Transform (FFT) of the signal in (a). The red dashed line is used to mark the −3 dB cutoff frequency.
Photonics 12 00374 g002
Figure 3. Comparison of beat cutoff frequency before and after optimization of PI values.
Photonics 12 00374 g003
Figure 4. Variations in various experimental quantities as a function of the probe beam power of laser 1. Red triangles: cutoff frequency. Yellow squares: error signal amplitude. Blue circles: EIT linewidth.
Photonics 12 00374 g004
Figure 5. The beat signal, with the total power P of 5 mW out of the fiber, is generated by scanning laser 2 while laser 1 is locked. (a) The load resistance R is 50 Ω and the length of the cable is 1 m. (b) R is 50 Ω and the length of the cable is 3 m. (c) R is 500 Ω and the length of the cable is 1 m. The inset in (a) shows the EIT transmitted probe power of laser 2, where the offset has been subtracted (solid line) and subjected to Gaussian fitting (dashed line). In (ac), the dashed lines are Gaussian fits of the EIT spectra of laser 2. The signals are given in volt units as measured by the photodetectors.
Photonics 12 00374 g005
Figure 6. (a) Spectra of unlocked and frequency-scanned lasers. The left figure corresponds to the beat note obtained when laser 2 is locked while laser 1 is frequency-scanned. In the right figure, the roles of laser 1 and laser 2 are exchanged. Time is measured with respect to a trigger used for laser frequency scanning. In addition, EIT spectra (orange solid lines) and their Gaussian fits (black dashed lines) are displayed, similarly to what was done in the inset of Figure 5a. (b) Variation in the ratio between the frequency interval δf and the total interval ∆f as a function of time. (c) Center frequency drift of unlocked lasers measured with the beat signals in (a).
Photonics 12 00374 g006
Disclaimer/Publisher’s Note: The statements, opinions and data contained in all publications are solely those of the individual author(s) and contributor(s) and not of MDPI and/or the editor(s). MDPI and/or the editor(s) disclaim responsibility for any injury to people or property resulting from any ideas, methods, instructions or products referred to in the content.

