Article

Femtosecond Third-Order Nonlinear Electronic Responses of 2D Metallic NbSe2

by
Cecília L. A. V. Campos
1,*,
Igor Gonçalves
1,
Jessica E. Q. Bautista
1,
Alyson Carvalho
1,
Ali M. Jawaid
2,
Robert Busch
2,
Richard Vaia
2 and
Anderson S. L. Gomes
1,*
1
Departamento de Física, Universidade Federal de Pernambuco, Recife 50670-901, PE, Brazil
2
Materials and Manufacturing Directorate, Air Force Research Laboratories, Wright-Patterson AFB, Dayton, OH 45433, USA
*
Authors to whom correspondence should be addressed.
Photonics 2024, 11(10), 930; https://doi.org/10.3390/photonics11100930
Submission received: 27 August 2024 / Revised: 26 September 2024 / Accepted: 27 September 2024 / Published: 30 September 2024

Abstract

:
This manuscript reports on the third-order nonlinear optical responses of two-dimensional metallic NbSe2 suspended in acetonitrile (ACN). The standard Z-scan technique was employed with 190 fs optical pulses at 790 nm, a repetition rate of 750 Hz, and an intensity ranging from 30 to 300 GW/cm2. A self-focusing nonlinear refractive index (NLR), n 2 = + ( 1.8 ± 0.1 ) × 1 0 15 cm2/W, and a nonlinear absorption (NLA) coefficient, α 2 = + ( 3.5 ± 0.2 ) × 1 0 2 cm/GW, were measured, with the NLA arising from a two-photon process. Aiming to further understand the material’s electronic nonlinearities, we also employed the Optical Kerr Gate (OKG) to evaluate the material’s time response and measure the NLR coefficient in an optical intensity range different from the one used in the Z-scan. For optical pulses of 170 fs at 800 nm and a repetition rate of 76 MHz, the modulus of the NLR coefficient was measured to be n 2 = 4.2 ± 0.5 × 10 14 cm2/W for intensities up to 650 MW/cm2, with the material’s time response limited by the pulse duration. The ultrafast time response and electronic optical nonlinearities are explained based on the material’s 2D structure.

1. Introduction

Among the recently studied nanomaterials, two-dimensional layered transition metal dichalcogenides (2D-LTMDs) stand as one of the most promising due to their relatively easy and already well-controlled fabrication processes [1,2,3]. A critical advantage of 2D-LTMDs over graphene—the 2D material that triggered the research in the so-called flatland world [4]—arises from the fact that they exist in semiconducting, semimetallic, and metallic forms, which opens a myriad of potential applications, as reviewed in Refs. [5,6,7]. Nonlinear optical studies comprising a variety of 2D nanomaterials have been published over the last few years, including an extended survey of nonlinear optics in different materials [8]. Particularly for 2D LTMDs, the reviews in Refs. [9,10,11] present NLO results for distinct LTMDs either in suspension or as monolayer/multilayer films on a substrate, as well as different types of nonlinear responses, including second- and third-order nonlinearities. Our group has studied several 2D LMTDs nanoflakes in liquid suspension, which includes semiconducting MoS2, MoSe2, MoTe2, and WS2, semimetallic WTe2 and ZrTe2, and metallic NbS2 and NbSe2. The results have recently been reviewed in Ref. [12], where the diversity of techniques employed in the original publications was summarized, from second-order methods (such as second harmonic generation and hyper Rayleigh scattering) to methods leading to third-order nonlinearities (Z-scan, Optical Kerr gate, photoacoustic Z-scan, and spatial self-phase modulation). These methods allowed the study of thermal and non-thermal nonlinearities, with time responses ranging from about 300 ms for the former to 100–200 fs (limited by the laser pulse duration) for the latter.
Among the studied 2D-LTMDs, metallic NbS2 was evaluated using the Z-scan technique in the femtosecond regime [13], whereby both the nonlinear refractive index and nonlinear absorption coefficient were measured as a function of incident intensity. In Ref. [14], the Optical Kerr gate (OKG) was employed to directly study the time response of MoS2, ZrTe2, NbS2, and NbSe2, as well as the modulus of the third-order nonlinear coefficient, n 2 . It is worth noting that the Z-scan method readily gives the sign and magnitude of the nonlinear refractive index and nonlinear absorption, from which the modulus of χ ( 3 ) can be inferred. Suppose such a measurement is performed with femtosecond pulses and a low repetition rate to avoid thermal effects (mainly when using colloidal samples). In that case, the ultrafast electronic-type response is typically measured, which can be confirmed by the complimentary OKG technique, as shown for NbS2 in Refs. [13,14].
Unlike NbS2 and other widely explored LTMDs, thus far, there are few works in the literature regarding the nonlinear optical response of NbSe2, for which we summarize the most relevant as follows. For the 2D-layered structures in suspension, the study reported in Ref. [14] employed the OKG technique at 800 nm, 180 fs pulses, and a 76 MHz repetition rate in an intensity range of the order of 100 MW/cm2, for which the material exhibited electronic third-order NLR, while NLA was not observed. For a different spectro-temporal regime, the authors of Ref. [15] reported an optical limiting (OL) behavior under 532 nm laser excitation for NbSe2 dispersions prepared via liquid-phase exfoliation. In Ref. [16], using the same liquid-phase exfoliation technique, the researchers observed third-order nonlinearities attributed to the self-phase modulation (SSPM) of NbSe2 in the visible range using continuous wave (CW) excitation and, in a separate study [17], they employed a controlled fractal growth of 2D NbSe2 films to enhance their third-order nonlinearity in the nanosecond regime significantly, optimizing the OL at 532 nm and 1064 nm. The SSPM technique was also employed in Ref. [18] to investigate third-order optical nonlinearities of LTMDs in suspension, including NbSe2, revealing that under CW or high repetition rate ( MHz) mode-locked lasers, thermally induced nonlinearities are prominent and should not be used to infer intrinsic electronic properties of such materials.
Given the scarcity of studies on the electronic optical properties of 2D metallic NbSe2, particularly in the femtosecond regime, this manuscript aims to thoroughly investigate the third-order nonlinear response of 2D NbSe2 in suspension under femtosecond excitation in the near-infrared spectral region. For this purpose, we employed the Z-scan technique with optical intensities ranging from 30 to 300 GW/cm2, optical pulses of 190 fs at 790 nm, and a repetition rate of 750 Hz. This approach allowed us to evaluate the material’s third-order NLR and NLA. Furthermore, by applying the OKG technique for intensities up to 650 MW/cm2 (170 fs optical pulses, 800 nm, and 76 MHz), we obtained information regarding the magnitude of the NLR for this intensity range, besides the electronic time response of the material. These results contribute significantly to a complete picture of the third-order nonlinear response of liquid-suspended 2D NbSe2 in the femtosecond regime, bringing an in-depth understanding that will pave the way for potential applications in advanced photonic and optoelectronic devices.

2. Materials and Methods

2.1. Two-Dimensional Metallic NbSe2

NbSe2 in the trigonal prismatic (2H) phase is metallic at room temperature, becoming a superconductor at around 7 K [19,20]. It undergoes a charge density wave distortion at around 30 K before reaching the superconducting state. The redox exfoliation method prepared the NbSe2 nanoflakes studied in this work, as detailed in Refs. [21,22]. In short, redox chemistry reactions perform exfoliation through the in situ generation of polyoxometalates (POMs). As a first step, bulk powders are suspended in acetonitrile (ACN) and treated with a mild oxidant (cumyl hydroperoxide), which generates soluble metalates. These metalates are assembled, and subsequent adsorption is achieved via the addition of hydroquinone, which acts as a reductant. Adsorption of these POMs results in delamination via layer charging by assembled POMs. Further, the exfoliated nanomaterial is extracted from the bulk nanomaterials via centrifugal separation. The exfoliated monolayer NbSe2 flakes are obtained with successive sedimentation/redispersion cycles in fresh anhydrous ACN. The flakes had a lateral dimension of 210 ± 128 nm and a height of 4.1 ± 0.3 nm, inferred from atomic force microscopy (AFM) (see SI in Ref. [21]). They were suspended in ACN. The composition and morphological analysis, reported in Ref. [21] and its support information, includes, besides AFM, high-resolution transmission electron microscopy (HRTEM), X-ray photoelectron spectroscopy (XPS), UV–vis/near-infrared (NIR) spectroscopy, and Raman spectroscopy. Figure 1 shows the UV-Vis spectra of the NbSe2 exfoliated in ACN, recorded on a UV spectrophotometer (UV-1800, SHIMADZU, Kyoto, Japan). As a metallic nanomaterial, there are no excitonic features, and the smooth spectrum shows the absorption profile, which presents a low absorption at 790 nm. Nevertheless, thermal nonlinearities can be observed even in this low absorption spectral region depending on the excitation source and experimental regime, as discussed in Ref. [18]. Therefore, it is essential to isolate the NLO response of interest from occasional thermal nonlinearities, which requires different approaches depending on the experimental technique employed, as discussed in the following section for the Z-scan and the OKG experiments.

2.2. Z-Scan Technique and Setup

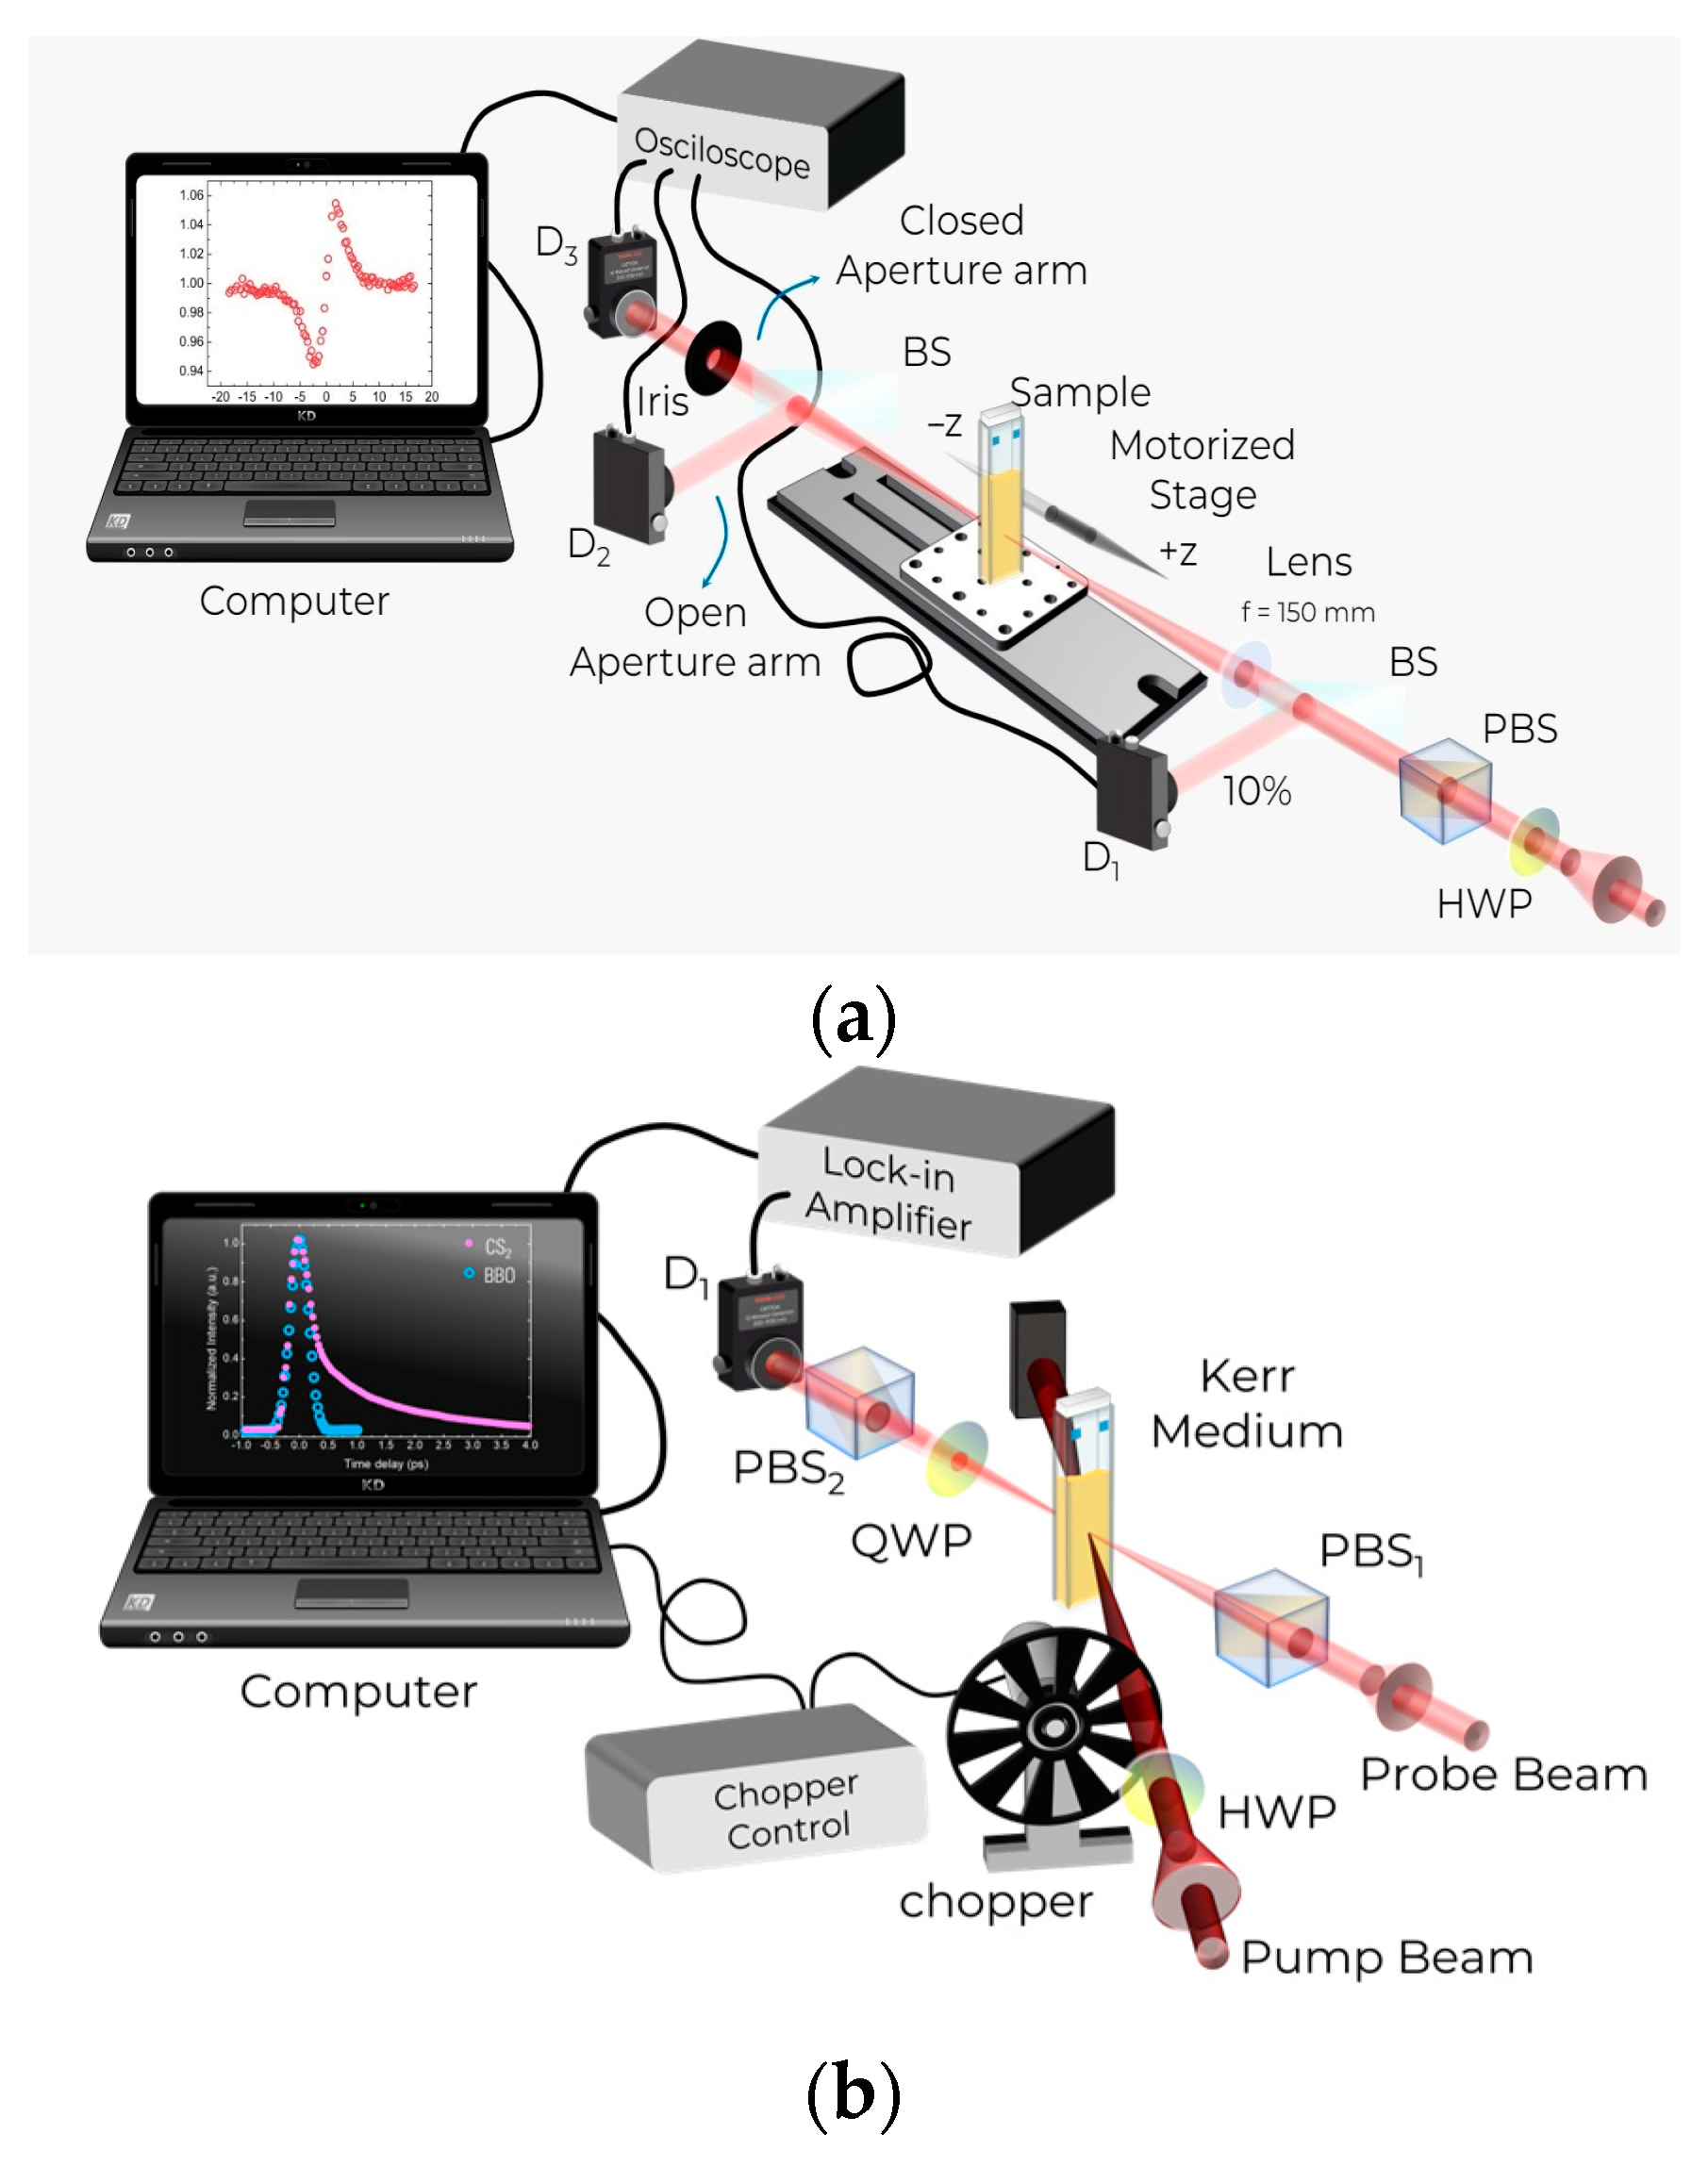
The experimental Z-scan method, first demonstrated by Sheik-Bahae and coworkers [23], is a well-established technique that relies on the wavefront distortion, which is intensity-induced, leading to a spatial self-phase modulation arising from the nonlinear refractive index of the medium [23,24]. Experimentally, the sample is scanned in the Z-direction of a focused beam, and the transmitted light is collected by a photodetector (PD). When the whole beam is collected by the PD (so-called open aperture, OA), the samples’ NLA or saturated absorption (SA) coefficient can be inferred—as well as its origin—through theoretical fitting. On the other hand, if a small aperture is placed in front of the PD (known as closed aperture design, CA), the NLR coefficient is directly measured in sign and magnitude, provided that the beam intensity is known. A simplified scheme of the Z-scan setup is depicted in Figure 2a.
The Z-scan can give information about the magnitude and signal of optical nonlinearities. Some variations in the technique deal with thermal load nonlinearities, primarily present in liquids and many glassy materials, especially when excited with CW or quasi-CW (high repetition rate, several MHz) light sources [25]. The Z-scan is also sensitive to the polarization state of the excitation source and can be used to discriminate among thermal, molecular orientation, and pure electronic refractive nonlinearities, as discussed in Ref. [26]. To perform our experiments, a linearly-polarized pulsed femtosecond laser source (PHAROS, Light Conversion, Vilnius, Lithuania) with a temporal width of 190 fs, coupled with a collinear optical parametric amplifier (TOPAS, Light Conversion, Vilnius, Lithuania) that operated at a centered wavelength of 790 nm, was used. The pulses were adjusted to a repetition rate of 750 Hz to prevent thermal effects. The femtosecond pulses were focalized in a 20 μ m diameter spot at the focal plane by a 150 mm focusing lens. Then, as required by the Z-scan technique, the sample (1 mm quartz cuvette containing the liquid suspension) was scanned through the ± Z direction. As typically occurs on ultrafast timescales (femtoseconds to picoseconds optical pulses) at low repetition rate, we expect purely electronic nonlinearities due to using femtosecond optical pulses with a repetition rate of 750 Hz, as corroborated by our experimental results presented and discussed in the Results section.

2.3. Optical Kerr Gate Technique and Setup

The Optical Kerr Gate technique is employed to investigate third-order nonlinear optical properties of materials. In our experimental setup, we used a femtosecond-mode-locked Ti: Sapphire laser operating at 800 nm to generate ultra-short pulses with a duration of approximately 170 femtoseconds and a repetition rate of 76 MHz. These pulses are split into a pump and a probe beam, both linearly polarized, with their polarizations set at a 45° angle relative to each other. That is the polarization configuration that gives the more significant OKG signal. As the pump beam interacts with the sample, it induces a transient change in the refractive index due to the Optical Kerr effect, which leads to the rotation of the probe’s polarization, provided that the pump and probe overlap in space and time within the sample. After passing through the sample, the probe beam is then directed toward a polarization beam splitter (PBS2) that acts as an analyzer. The PBS2 is oriented to transmit only the probe’s component that has experienced polarization rotation. The transmitted light is then detected by a photodetector (D1). A lock-in amplifier synchronized with an optical chopper modulating the pump beam is used to improve the signal-to-noise ratio of the OKG signal (Figure 2b). Because of the quasi-CW regime, we can expect a pulse-to-pulse thermal load. However, the OKG is not sensitive to thermal nonlinearities once it relies on the polarization rotation of the probe beam, provided that the pump and probe overlap in both space and time within the sample. This allows us to gather information about the ultrafast third-order nonlinearity, even when using high repetition rate laser sources.
The OKG setup operates by varying the time delay between the pump and probe beams. The temporal profile of the material’s nonlinear optical response can be determined by measuring the intensity of the transmitted probe light as a function of this delay. This measurement provides information on the magnitude of the third-order nonlinear susceptibility and the dynamics of the material’s response. The OKG technique is widely used to study ultrafast optical processes in various materials, offering detailed insights into their nonlinear optical behavior. Figure 2b illustrates the basic (OKG) setup. A quarter-wave plate (QWP) placed after the sample adjusts the leakage of the probe beam through the PBS2 (analyzer), resulting in the system operating in the heterodyne regime.
Additionally, the extensive review in Ref. [24] provides a comprehensive and detailed description of the standard experimental setups for the OKG and Z-scan techniques.

3. Results

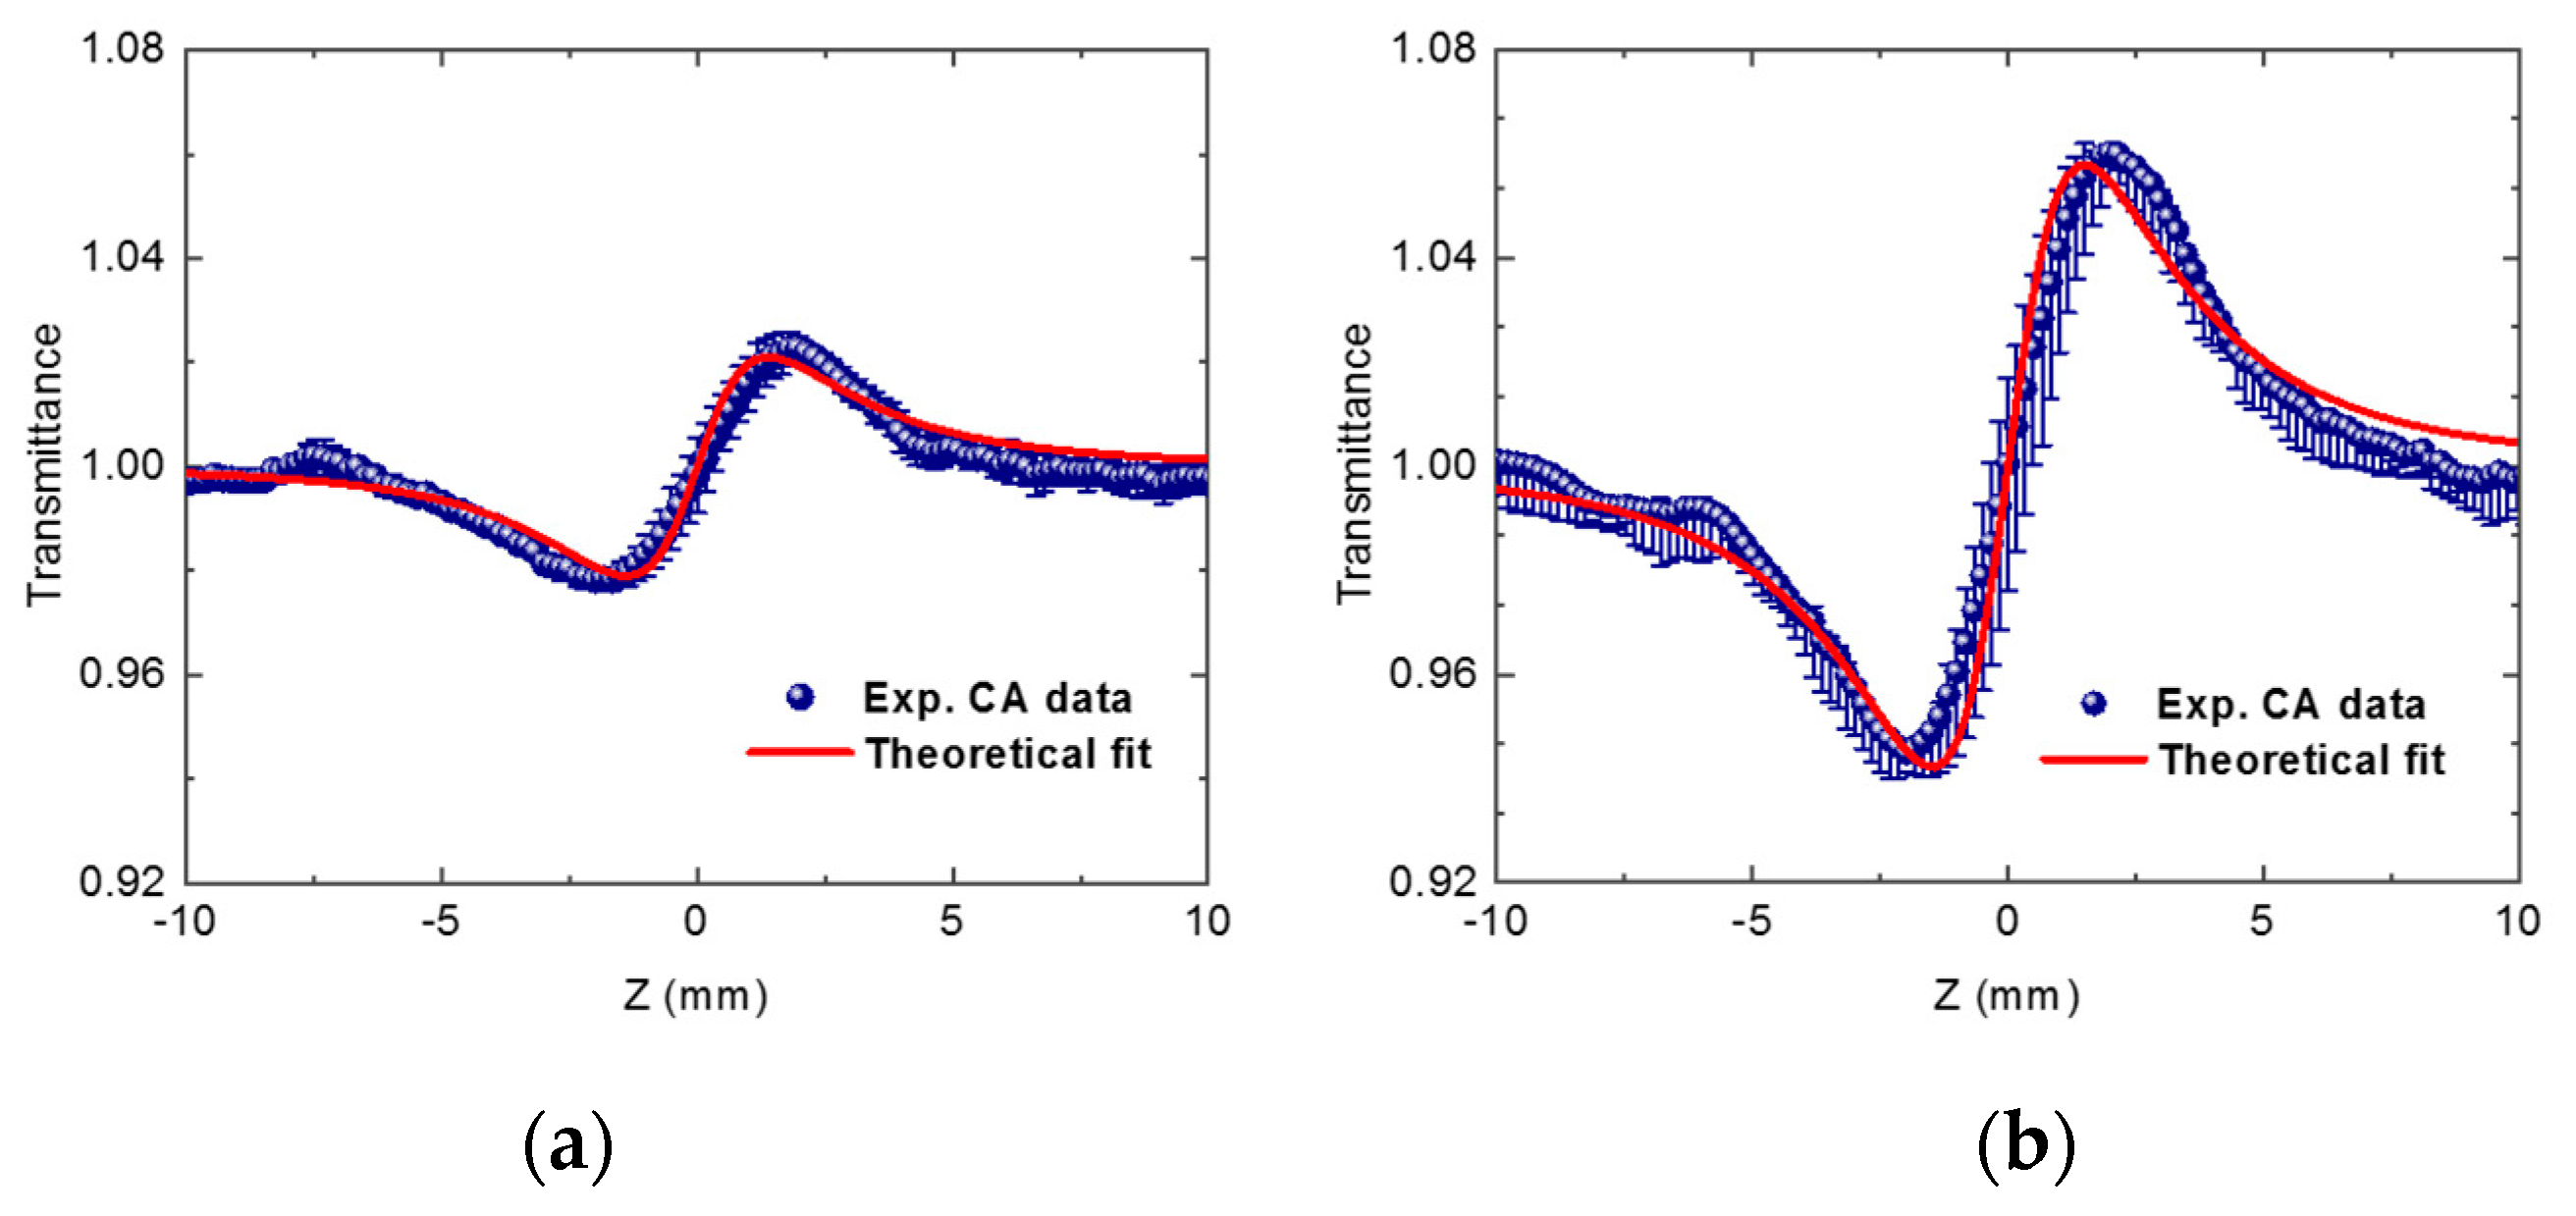
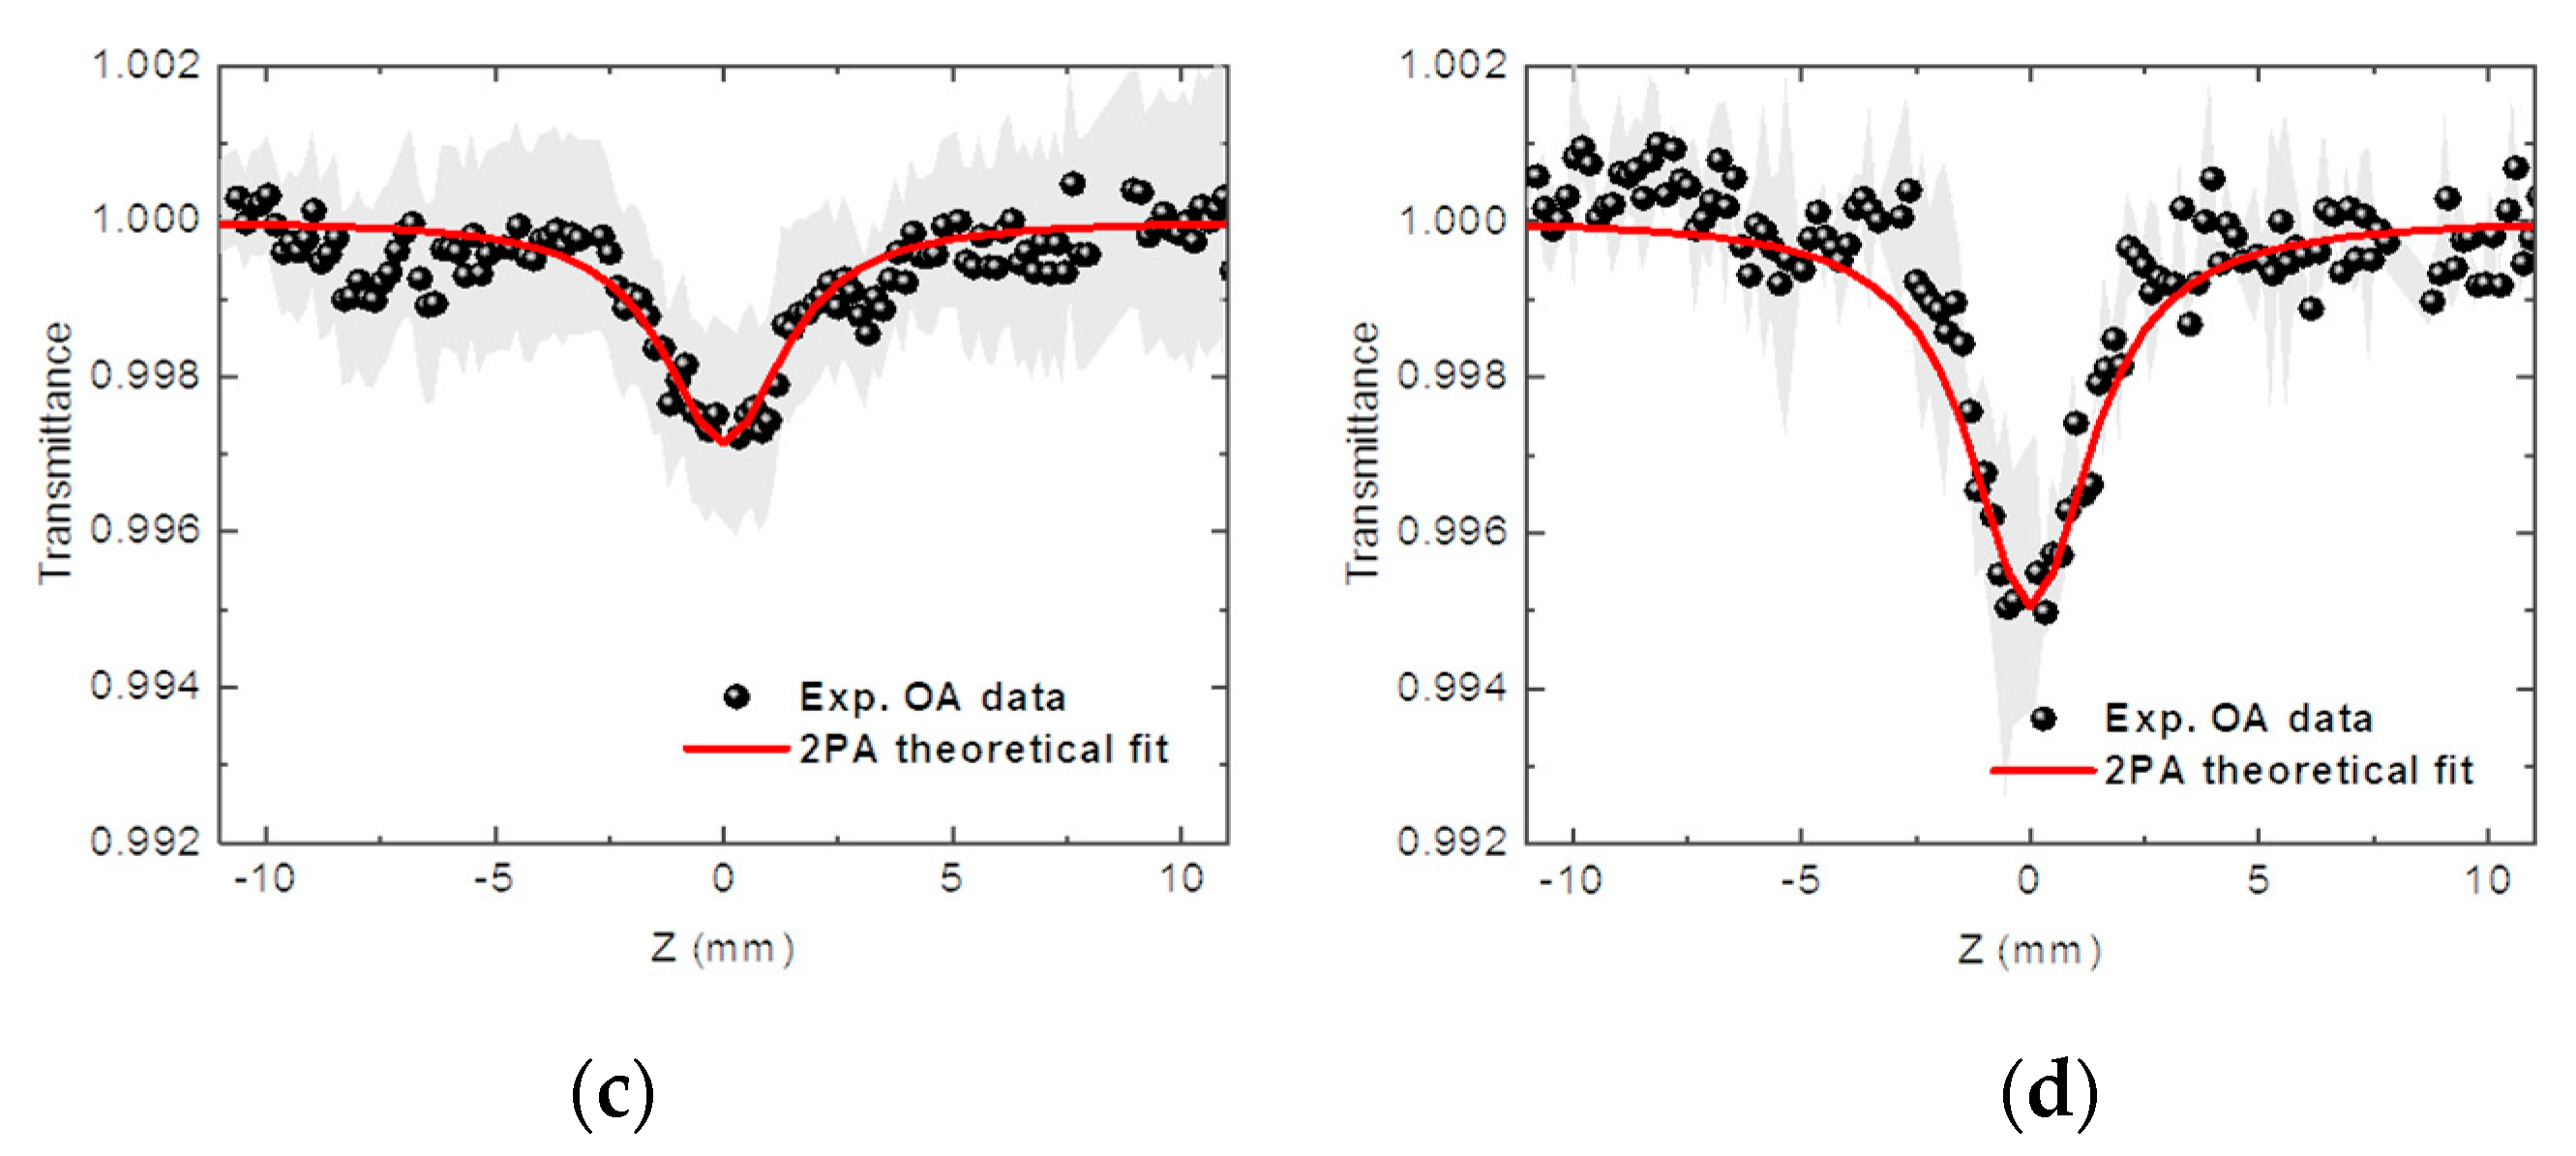
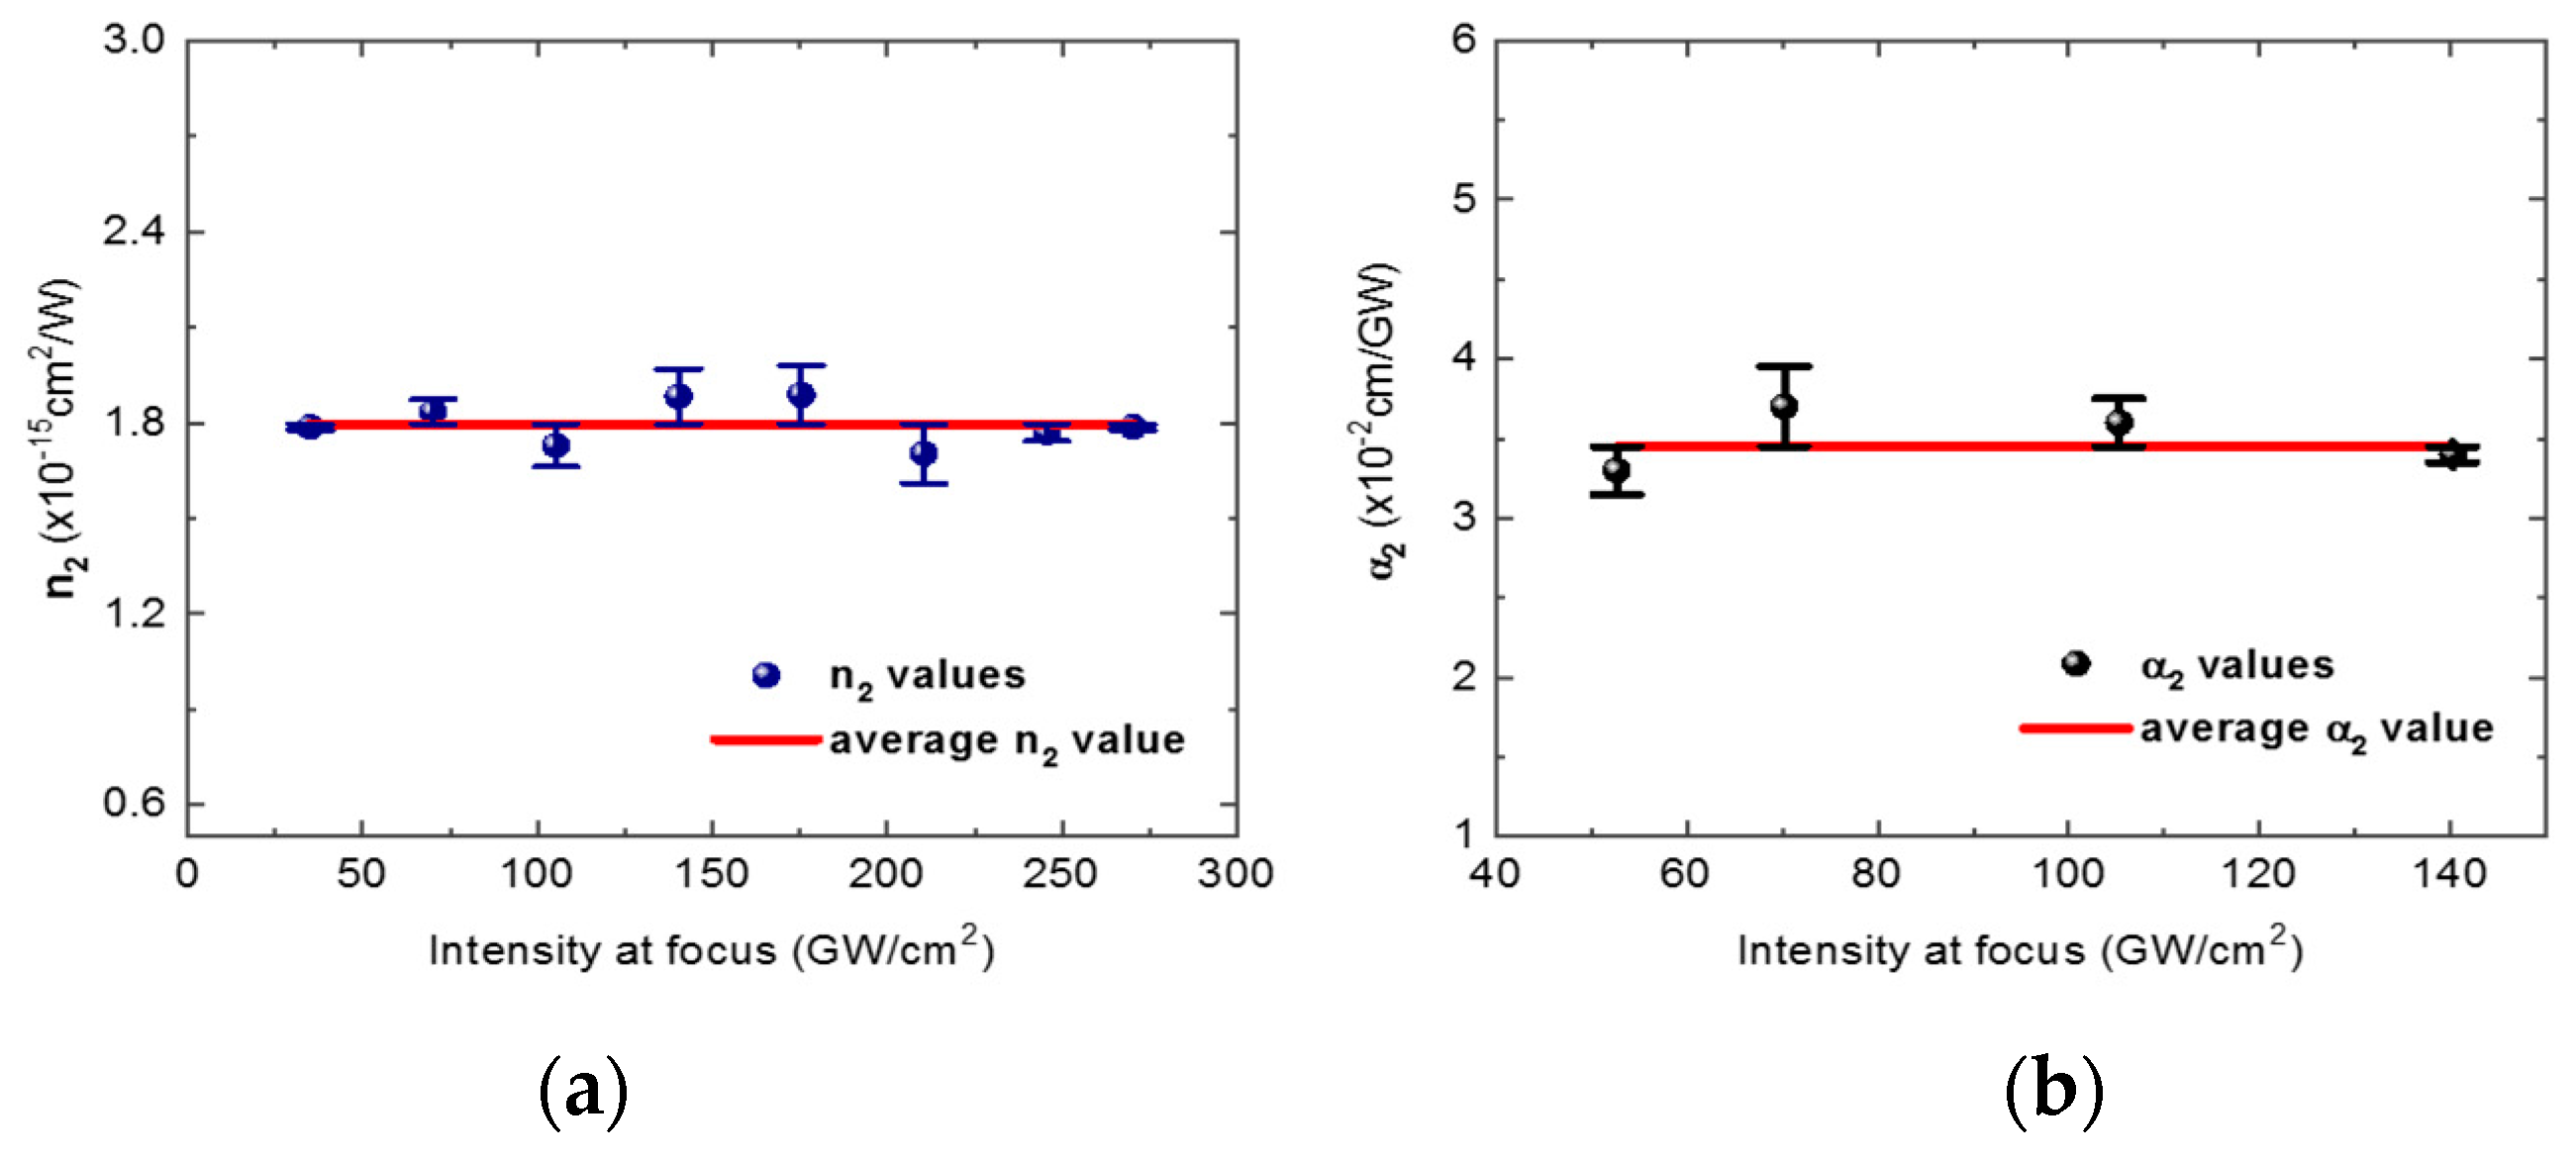
Representative curves from the Z-scan measurements are presented in Figure 3. The data (dots) and their corresponding theoretical fits (solid red lines) are shown. Figure 3a,b are CA measurements showing a positive (self-focusing) NLR at two different intensities (70.2 and 210.4 GW/cm2). Since thermal nonlinearities are associated with a negative third-order nonlinear refractive index, the closed-aperture measurements revealed a dominance of electronic NLO response, as expected due to the femtosecond optical pulses at a low repetition rate of 750 Hz. Figure 3c,d display OA experimental curves for optical intensities of 70.2 and 140.3 GW/cm2, respectively. From the theoretical curve, which will be discussed later, we anticipate that a two-photon absorption (2PA) process takes place. Figure 4a regards the measured n 2 as a function of the peak intensity at focus ( I 0 ), from where we can observe no intensity-dependence within the range of optical intensities applied, meaning that only the third-order effect is taking place. The average NLR coefficient obtained was n 2 = + ( 1.8 ± 0.1 ) × 10 15 cm2/W. Figure 4b exhibits the NLA coefficient ( α 2 ) versus I 0 plot, again showing no intensity dependence and an average value of α 2 = + ( 3.5 ± 0.2 ) × 10 2 cm/GW retrieved from theoretical adjustments of the experimental data.
Figure 5 displays the OKG signal curves for N b S e 2 suspended in ACN. The experimental conditions are the same as for Carbon Disulfide (CS2), used as a reference material (the OKG data for CS2 can be found in Figure S1 of the Supplementary Materials). From the experimental curves, it was possible to observe a linear relation between the peak of the OKG signal and the pump intensity (Figure 5), allowing us to retrieve the term ( I O K G / I p u m p ) S , i.e., the slope of the curve that best fits the experimental data points (see Equation (4)). The calculation of the magnitude of the nonlinear refractive index, n 2 , also required accounting for the probe beam leakage and the effective sample length ( L e f f ). To measure n 2 , we relied on the well-characterized value of n 2 C S 2 = 3.1 ± 1.0 × 10 19 m2/W for C S 2 , measured under a similar spectro-temporal regime employed in our experiments as a reference [27]. This comprehensive approach ensured that effects intrinsic to the heterodyne regime of our OKG configuration were carefully considered, yielding a value of n 2 N b S e 2 = ( 4.2 ± 0.5 ) × 10 14 cm2/W for N b S e 2 , indicating a significant nonlinear optical response.
The temporal width of the pulses at the sample position, measured through independent intensity autocorrelation using the Beta Barium Borate (BBO) crystal signal, was determined to be 170 fs, which is comparable to the OKG signal observed for N b S e 2 (Figure 5). By varying the time delay between the pump and probe beams, the temporal dynamics of N b S e 2 were assessed, revealing a fast response like that observed for N b S 2 [14]. Both materials exhibit rapid polarization rotation of the probe beam, indicating that their nonlinear optical responses closely follow the pulse duration. In contrast, the solvent (ACN) and also the C S 2 shows slower responses, with characteristic decay times of 1.66 ps and 1.82 ps, respectively. This comparison underscores the efficient and swift nonlinear optical behavior of N b S e 2 and N b S 2 , highlighting their superior performance relative to the more gradual responses observed in ACN and C S 2 .

4. Theory and Discussion

For the third-order NLR coefficient calculations, the following CA Z-Scan equation has been employed [23]:
T z 1 + 4 Δ Φ 0 3 z / z 0 z / z 0 2 + 1 z / z 0 2 + 9 ,
where Δ Φ 0 3 = ( 2 π / λ ) n 2 I 0 L e f f is the third-order wavefront phase distortion, λ is the laser wavelength, L e f f = 1 exp ( α 0 L ) α 0 1 is the effective sample length, α 0 is the linear absorption coefficient, and L is the sample geometrical length. z 0 is defined as the Rayleigh parameter and depends on the beam waist at the focal point. One can indirectly determine the material’s n 2 values for each I 0 by setting the Δ Φ 0 ( 3 ) as a free parameter in Equation (1) and theoretically fitting the normalized transmittance curves ( T ( z ) ) from experimental data, as shown in Figure 3a,b. For the NLA theoretical analysis, the intensity losses within the sample follow the differential equation:
d I d z = α 0 I α 2 I 2 ,
where I is the optical intensity, z is the longitudinal displacement, α 0 is the linear absorption, and α 2 is the two-photon NLA coefficient. The second term on the right-hand side of Equation (2) stands for a 2PA process. It is possible to solve Equation (2) numerically to compute the theoretical normalized transmittance curves to fit the experimental OA Z-scan data, as displayed in Figure 3c,d. We considered the incoming femtosecond laser pulses to have spatially and temporally Gaussian profiles, which is appropriate for describing our laser source.
Our findings revealed that, for femtosecond optical pulses with intensities ranging from 30 to 300 GW/cm2 at 790 nm, the NLR coefficient of NbSe2 suspended in ACN is about two orders of magnitude higher than that for most of the organic solvents including ACN [28]. Based on Z-scan measurements for a similar intensity range as the one employed in the present work, the authors of Ref. [13] reported n 2 A C N = + 1.9 × 10 17 cm2/W. This means that the third-order NLR of the entire suspension is greatly affected by the NbSe2 nonlinear response, which dominates over the solvent (ACN) contribution. A significant difference in behavior was observed when comparing our findings for NbSe2 with those reported for NbS2 in Ref. [13]. Although both materials are metallic and synthesized using the same process, in the NbS2 system, a sign reversal of the third-order NLR occurred at a specific critical intensity of approximately 22 GW/cm2. The authors qualitatively attributed this sign reversal behavior to the changes in the sign of the NLA associated with saturation of 2PA and nonlinear scattering. Both saturation of 2PA and nonlinear scattering were not observed in the present work regarding NbSe2, which may explain why the intensity dependence in n 2 was also not observed (Figure 4a). However, the sensitivity of our system was limited inferiorly to 30 GW/cm2, which is above the critical intensity associated with the sign reversal for NbS2 [13]. The NLR for the NbS2 measured above the critical intensity in Ref. [13] was n 2 N b S 2 = + ( 3.0 ± 0.2 ) × 10 16 cm2/W, which is about six times lower than the one measured for NbSe2 in the present work, i.e., n 2 N b S e 2 = + ( 1.8 ± 0.1 ) × 10 15 cm2/W.
For the experimental OKG setup employed in this work, the OKG signal can be described as
I O K G 2 π λ Δ ϕ L L   n 2 I p u m p I p r o b e ,
where λ is the probe wavelength, Δ ϕ L is the phase shift acquired by the probe, L is the sample length, I p u m p is the pump intensity beam, and n 2 is the magnitude of the nonlinear refractive index of the medium. This relation highlights the direct effect of the nonlinear phase shift on the Kerr signal, which can be utilized to measure n 2 by comparing the OKG signal of a sample to that of a standard reference material. As detailed in Ref. [14], to quantitatively determine n 2 , we used
n 2 S n 2 R = I O K G I p u m p S I O K G I p u m p R L R L S T R T S I P r o b e R I p r o b e S ,
where n 2 S and n 2 R are the nonlinear refractive indices for the sample and reference, respectively. The terms L S and L R refer to the effective lengths, T S e T R to the probe leakages, I p r o b e S and I p r o b e R to the probe intensities and I p u m p S and I p u m p R to the pump intensities for the sample and reference. The OKG signal after the analyzer is denoted by I O K G S and I O K G R . Given the low absorbance of the N b S e 2 (see Figure 1), the effective length was approximated as the cuvette length (1 mm). The measured NLR using the OKG technique was n 2 N b S e 2 = ( 4.2 ± 0.5 ) × 10 14 cm2/W in modulus.
In Ref. [14], the authors also employed the OKG to measure the ultrafast third-order optical responses of some 2D-LTMDs, including metallic NbS2 and NbSe2. The structures were suspended in ACN and evaluated under a spectro-temporal regime similar to ours (800 nm, ~180 fs) with optical intensities of the order 100 MW/cm2. The values reported for the nonlinear coefficients were n 2 N b S e 2 = 5.3 ± 0.7 × 10 14 cm2/W (in good agreement with the one reported in the present work using the same OKG technique) and n 2 N b S 2 = ( 9.3 ± 0.5 ) × 10 15 cm2/W, the former again showing an NLR coefficient about six times greater than the one measured for NbS2. Within the intensity range employed, the magnitude of n 2 for both materials are about one order of magnitude greater than the ones reported from the Z-scan measurements, but the OKG technique is not sensitive to the sign of n 2 , just to its magnitude, and the increased n 2 in modulus is in accordance with the asymptotic behavior observed for NbS2 below its critical intensity [13]. Table 1 summarizes all the nonlinear coefficients measured in this study, comparing them with relevant literature.
No NLA was observed for NbSe2 up to 600 MW/cm2. However, we could observe a 2PA process for intensities ranging from 30 to 300 GW/cm2 using the Z-scan technique, which can be understood based on the material’s band structure. For metallic NbSe2 layered structures, studies on density functional theory (DFT) have computed the electronic band structure (EBS) and the density of states (DOS), predicting the possibility of one-photon absorption and 2PA process for incident laser photons with energies around 1.56 eV (790 nm of wavelength) [29]. Nevertheless, as argued in Refs. [13,14], one-photon absorption at 790 nm is unlikely in the NbSe2 system due to the Pauli blocking effect, which corroborates with the very low linear absorbance presented by our NbSe2 sample in this spectral region, as presented in Figure 1. Increasing the input optical intensity to the range between 30 GW/cm2 and 300 GW/cm2, a 2PA process takes place, as shown in our experimental results (Figure 3c,d). Since the NbSe2, as well as the NbS2, are metallic materials that possess similar EBS and DOS, the 2PA phenomena for high intensities in NbSe2 may be occurring due to van Hove singularities at the K point in the Brillouin zone of the material [30].

5. Conclusions

In summary, we investigated the femtosecond electronic nonlinearities of metallic NbSe2 in ACN suspension. Using the standard Z-scan method with intensities up to ~300 GW/cm2, the third-order nonlinear coefficients were measured to be n 2 = + 1.8 ± 0.1 × 10 15 cm2/W and α 2 = + 3.5 ± 0.4 × 10 2 cm/GW, with the NLA nonlinearities arising from a 2PA process. No NLA was observed for the lower intensity range (up to 600 MW/cm2). From the OKG technique, the third-order NLR measured was n 2 = ( 4.2 ± 0.5 ) × 10 14 cm2/W in modulus, which is in agreement with a previous report on the literature. The ultrafast time response of the electronic optical nonlinearity was also measured to be in the femtosecond range, following the pulse duration. Since there is still limited literature regarding NbSe2 NLO responses, the data reported here add to the knowledge of the nonlinear optical properties of such material, which will be useful as a basis for the design of all-optical applications. Since there is still limited literature regarding NbSe2 NLO responses, the data reported here add to the knowledge of the nonlinear optical properties of such material in the femtosecond regime and 800 nm spectral region and paves the way for future work to explore different spectro-temporal regimes. A complete picture of the nonlinear optical properties of the material will be useful as a basis for the design of all-optical applications.

Supplementary Materials

The following supporting information can be downloaded at https://www.mdpi.com/article/10.3390/photonics11100930/s1, Figure S1: OKG signal measured for CS2.

Author Contributions

Conceptualization, C.L.A.V.C., I.G. and A.S.L.G.; methodology, C.L.A.V.C., I.G., J.E.Q.B. and A.C.; software, I.G. and J.E.Q.B.; validation, R.B., A.M.J., R.V. and A.S.L.G.; formal analysis, C.L.A.V.C., R.B., R.V. and A.S.L.G.; investigation, C.L.A.V.C., I.G., J.E.Q.B. and A.C.; resources, A.S.L.G.; data curation, C.L.A.V.C., I.G. and A.C.; writing—original draft preparation, C.L.A.V.C., I.G., A.C. and A.S.L.G.; writing—review and editing, C.L.A.V.C., I.G. and A.S.L.G.; visualization, C.L.A.V.C., I.G., A.C. and A.S.L.G.; supervision, A.S.L.G.; project administration, A.S.L.G.; funding acquisition, A.S.L.G. All authors have read and agreed to the published version of the manuscript.

Funding

This research was funded by CNPq, CAPES, and FACEPE (Brazilian agencies) and also performed under the INCT of Photonics Project (Grant number 465763/2014-6), and Air Force Office of Scientific Research (FA9550-20-1-0381).

Institutional Review Board Statement

Not applicable.

Informed Consent Statement

Not applicable.

Data Availability Statement

Data underlying the results presented in this paper are not publicly available at this time but may be obtained from the authors upon reasonable request.

Acknowledgments

A.G. thanks to CNPq, CAPES, and FACEPE, and also the Air Force Office of Scientific Research (USA) for the financial support. A.G. is thankful to Cléber Mendonça, Leonardo de Boni, and their team, from the Physics Institute USP-São Carlos, Brazil, for using the femtosecond laser system under the INCT of Photonics framework.

Conflicts of Interest

The authors declare no conflicts of interest.

References

  1. Alam, S.; Chowdhury, M.A.; Shahid, A.; Alam, R.; Rahim, A. Synthesis of Emerging Two-Dimensional (2D) Materials—Advances, Challenges and Prospects. Flat. Chem. 2021, 30, 100305. [Google Scholar] [CrossRef]
  2. Song, L.; Song, M.; Lu, Z.; Yu, G.; Liang, Z.; Hou, W.; Liao, Q.; Song, Y. Recent Advances of Preparation and Application of Two-Dimension van Der Waals Heterostructure. Coatings 2022, 12, 1152. [Google Scholar] [CrossRef]
  3. Lei, Y.; Zhang, T.; Lin, Y.C.; Granzier-Nakajima, T.; Bepete, G.; Kowalczyk, D.A.; Lin, Z.; Zhou, D.; Schranghamer, T.F.; Dodda, A.; et al. Graphene and beyond: Recent Advances in Two-Dimensional Materials Synthesis, Properties, and Devices. ACS Nanosci. Au 2022, 2, 450–485. [Google Scholar] [CrossRef] [PubMed]
  4. Han, S.A.; Bhatia, R.; Kim, S.W. Synthesis, Properties and Potential Applications of Two-Dimensional Transition Metal Dichalcogenides. Nano Converg. 2015, 2, 17. [Google Scholar] [CrossRef]
  5. Yin, P.; Jiang, X.; Huang, R.; Wang, X.; Ge, Y.; Ma, C.; Zhang, H. 2D Materials for Nonlinear Photonics and Electro-optical Applications. Adv. Mater. Interfaces 2021, 8, 2100367. [Google Scholar] [CrossRef]
  6. Joseph, S.; Mohan, J.; Lakshmy, S.; Thomas, S.; Chakraborty, B.; Thomas, S.; Kalarikkal, N. A review of the synthesis, properties, and applications of 2D transition metal dichalcogenides and their heterostructures. Mater. Chem. Phys. 2023, 297, 127332. [Google Scholar] [CrossRef]
  7. McCreary, A.; Kazakova, O.; Jariwala, D.; Al Balushi, Z.Y. An outlook into the flat land of 2D materials beyond graphene: Synthesis, properties and device applications. 2D Mater. 2021, 8, 013001. [Google Scholar] [CrossRef]
  8. Moody, G.; Sorger, V.J.; Blumenthal, D.J. Post-2000 Nonlinear Optical Materials and Measurements: Data Tables and Best Practices. J. Phys. Photonics 2023, 5, 035001. [Google Scholar]
  9. Autere, A.; Jussila, H.; Dai, Y.; Wang, Y.; Lipsanen, H.; Sun, Z. Nonlinear Optics with 2D Layered Materials. Adv. Mater. 2018, 30, e1705963. [Google Scholar] [CrossRef]
  10. Zhou, L.; Fu, H.; Lv, T.; Wang, C.; Gao, H.; Li, D.; Deng, L.; Xiong, W. Nonlinear Optical Characterization of 2D Materials. Nanomaterials 2020, 10, 2263. [Google Scholar] [CrossRef]
  11. Ahmed, S.; Jiang, X.; Wang, C.; Kalsoom, U.E.; Wang, B.; Khan, J.; Muhammad, Y.; Duan, Y.; Zhu, H.; Ren, X.; et al. An Insightful Picture of Nonlinear Photonics in 2D Materials and Their Applications: Recent Advances and Future Prospects. Adv. Opt. Mater. 2021, 9, 2001671. [Google Scholar] [CrossRef]
  12. Gomes, A.S.; Campos, C.L.; de Araújo, C.B.; Maldonado, M.; da Silva-Neto, M.L.; Jawaid, A.M.; Busch, R.; Vaia, R.A. Intensity-Dependent Optical Response of 2D LTMDs Suspensions: From Thermal to Electronic Nonlinearities. Nanomaterials 2023, 13, 2267. [Google Scholar] [CrossRef]
  13. Maldonado, M.; da Silva Neto, M.L.; Vianna, P.G.; Ribeiro, H.B.; Gordo, V.O.; Carvalho, I.C.; Menezes, L.d.S.; de Araújo, C.B.; de Matos, C.J.S.; Seixas, L.; et al. Femtosecond Nonlinear Optical Properties of 2D Metallic NbS2 in the near Infrared. J. Phys. Chem. C 2020, 124, 15425–15433. [Google Scholar]
  14. Carvalho, A.J.; Campos, C.L.; Valente, D.; Jawaid, A.M.; Busch, R.; Vaia, R.A.; Gomes, A.S. Near-Infrared Ultrafast Third-Order Nonlinear Optical Response of 2D NbS2, NbSe2, ZrTe2, and MoS2. Opt. Lett. 2023, 48, 2297–2300. [Google Scholar] [CrossRef] [PubMed]
  15. Liang, C.; Wang, E.; Li, X.; Wang, J.; Liu, Y.; Chen, B.; Chen, H.; Liu, Y.; Peng, X. Optical limiting performances of transitional metal dichalcogenides MX2 (M = V, Nb, Ta; X = S, Se) with ultralow initial threshold and optical limiting threshold. Chin. Opt. Lett. 2022, 20, 021901. [Google Scholar] [CrossRef]
  16. Jia, Y.; Liao, Y.; Wu, L.; Shan, Y.; Dai, X.; Cai, H.; Xiang, Y.; Fan, D. Nonlinear optical response, all optical switching, and all optical information conversion in NbSe2 nanosheets based on spatial self-phase modulation. Nanoscale 2019, 11, 4515–4522. [Google Scholar] [CrossRef]
  17. Wang, B.; Ma, B.; Wang, K.; Zhang, H.; Zhang, Z.; Song, T.; Wang, S.; Chen, M.; Li, S.; Wang, Q.; et al. Fractal Growth of 2D NbSe2 for Broadband Nonlinear Optical Limiting. Adv. Funct. Mater. 2024, 34, 2401490. [Google Scholar] [CrossRef]
  18. Bautista, J.E.; Campos, C.L.; da Silva-Neto, M.L.; de Araujo, C.B.; Jawaid, A.M.; Busch, R.; Vaia, R.A.; Gomes, A.S.L. Intensity-Dependent Thermally Induced Nonlinear Optical Response of Two-Dimensional Layered Transition-Metal Dichalcogenides in Suspension. ACS Photonics 2023, 10, 484–492. [Google Scholar] [CrossRef]
  19. Silva-Guillén, J.Á.; Ordejón, P.; Guinea, F.; Canadell, E. Electronic structure of 2H-NbSe the CDW state single-layers. 2D Mater. 2016, 3, 035028. [Google Scholar] [CrossRef]
  20. Ugeda, M.M.; Bradley, A.J.; Zhang, Y.; Onishi, S.; Chen, Y.; Ruan, W.; Ojeda-Aristizabal, C.; Ryu, H.; Edmonds, M.T.; Tsai, H.-Z.; et al. Characterization of collective ground states in single-layer NbSe2. Nat. Phys. 2016, 12, 92–97. [Google Scholar] [CrossRef]
  21. Jawaid, A.; Che, J.; Drummy, L.F.; Bultman, J.; Waite, A.; Hsiao, M.-S.; Vaia, R.A. Redox Exfoliation of Layered Transition Metal Dichalcogenides. ACS Nano 2017, 11, 635–646. [Google Scholar] [CrossRef] [PubMed]
  22. Jawaid, A.M.; Ritter, A.J.; Vaia, R.A. Mechanism for Redox Exfoliation of Layered Transition Metal Dichalcogenides. Chem. Mater. 2020, 32, 6550–6565. [Google Scholar] [CrossRef]
  23. Sheik-Bahae, M.; Said, A.A.; Wei, T.-H.; Hagan, D.J.; Van Stryland, E.W. Sensitive measurement of optical nonlinearities using a single beam. IEEE J. Quantum Electron. 1990, 26, 760–769. [Google Scholar] [CrossRef]
  24. de Araújo, C.B.; Gomes, A.S.; Boudebs, G. Techniques for nonlinear optical characterization of materials: A review. Rep. Prog. Phys. 2016, 79, 036401. [Google Scholar] [CrossRef]
  25. Gomes, A.S.L.; Falcão Filho, E.L.; Rativa, D.; de Araujo, R.E.; de Araújo, C.B. Thermally managed eclipse Z-scan. Opt. Express 2007, 15, 1712. [Google Scholar] [CrossRef]
  26. Moysés, R.M.; Barbano, E.C.; Misoguti, L. Discrimination of thermal, molecular orientation, and pure electronic refractive nonlinearities using the polarization-resolved Z-scan technique. JOSA B 2023, 40, C60–C66. [Google Scholar] [CrossRef]
  27. Couris, S.; Renard, M.; Faucher, O.; Lavorel, B.; Chaux, R.; Koudoumas, E.; Michaut, X. An experimental investigation of the nonlinear refractive index (n2) of carbon disulfide and toluene by spectral shearing interferometry and z-scan techniques. Chem. Phys. Lett. 2003, 369, 318–324. [Google Scholar] [CrossRef]
  28. Iliopoulos, K.; Potamianos, D.; Kakkava, E.; Aloukos, P.; Orfanos, I.; Couris, S. Ultrafast third order nonlinearities of organic solvents. Opt. Express 2015, 23, 24171–24176. [Google Scholar] [CrossRef]
  29. Silva-Guillén, J.Á.; Ordejón, P.; Guinea, F.; Canadell, E. Electronic structure of 2H-NbSe2 single-layers in the CDW state. 2D Mater. 2016, 3, 035028. [Google Scholar] [CrossRef]
  30. van Loon, E.G.; Rösner, M.; Schönhoff, G.; Katsnelson, M.I.; Wehling, T.O. Competing Coulomb and electron-phonon interactions in NbS2. Quantum Mater. 2018, 3, 32. [Google Scholar] [CrossRef]
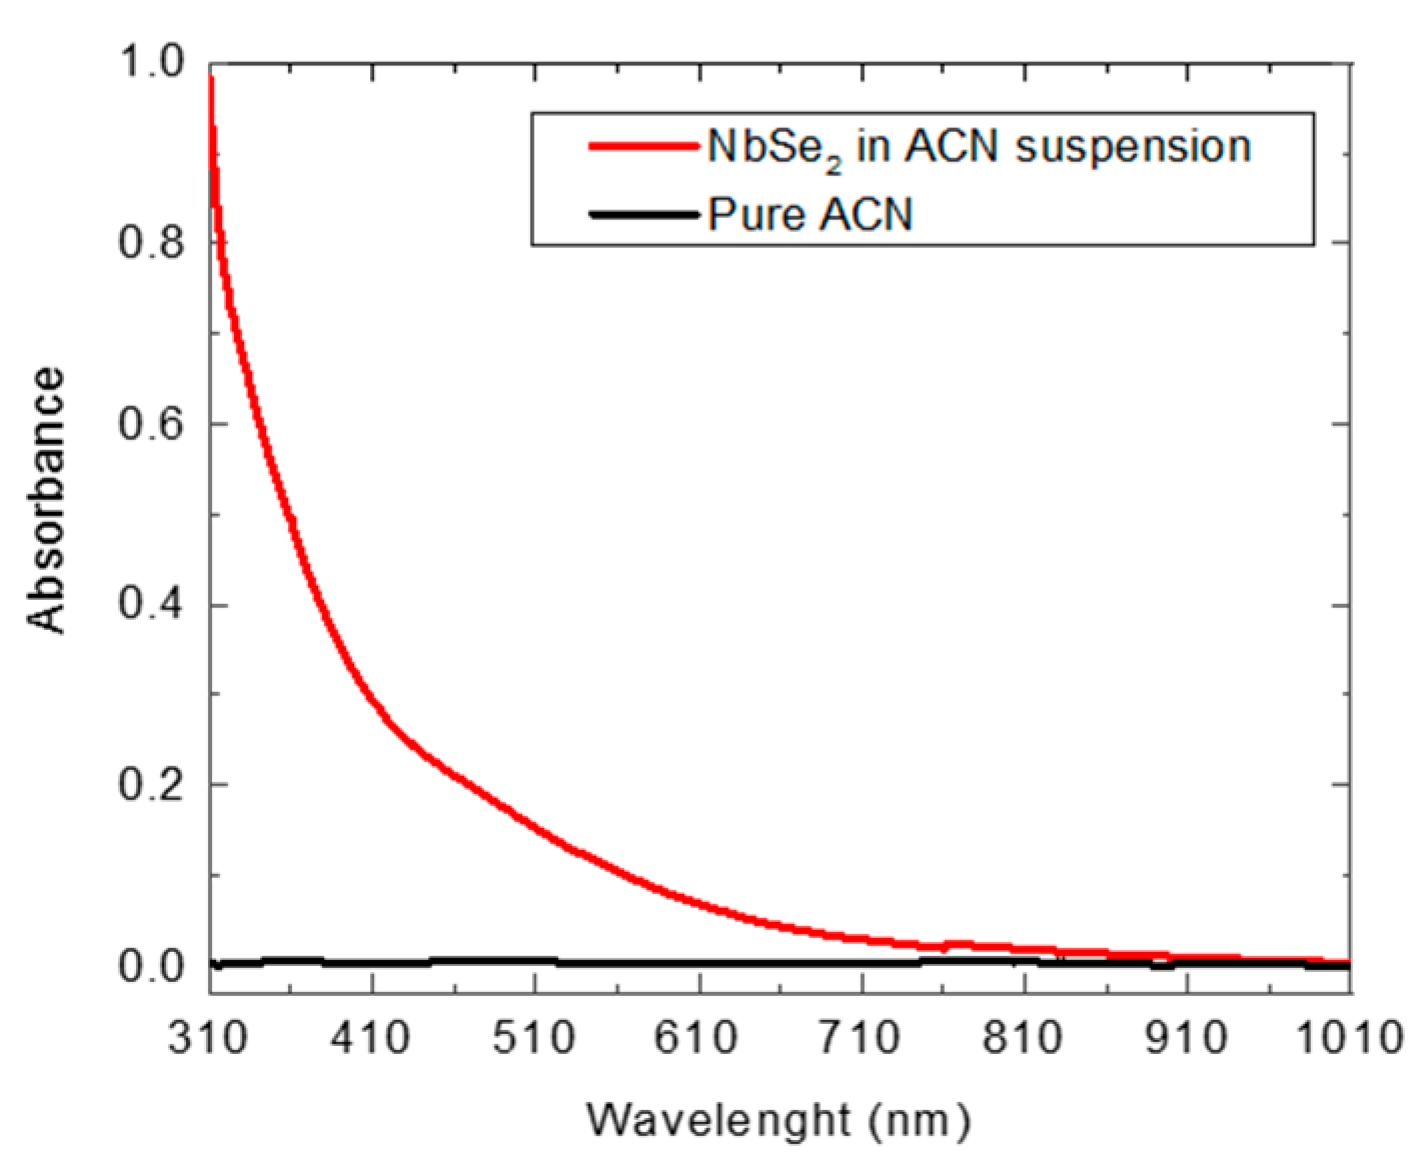
Figure 1. Absorbance spectra of the 2D metallic NbSe2 in ACN suspension (red) and the pure ACN spectra (black). Notice that the pure ACN exhibits a deficient absorption.
Photonics 11 00930 g001
Figure 2. Schematics of the experimental setups (out-of-scale) (a) Z-Scan; (b) Optical Kerr Gate. PBS—polarization beam splitter; D1, D2, and D3—Photodetectors (PD); HWP—half-wave plate; QWP—quarter waveplate.
Photonics 11 00930 g002
Figure 3. Experimental results (dots) and theoretical fits (red lines) from the Z-Scan method: (a) CA Z-Scan results at 70.2 GW/cm2; (b) CA Z-Scan results at 210.4 GW/cm2; (c) OA Z-Scan results at 70.2 GW/cm2; (d) OA Z-Scan results at 140.3 GW/cm2. The errors (bars for CA and shadows for OA) are the standard deviation of the mean for four successive transmittance measurements for each pump intensity. In the OA measurements, the maximum error is about 3%.
Photonics 11 00930 g003aPhotonics 11 00930 g003b
Figure 4. NLR and NLA coefficients versus peak intensity at focus: (a) n 2 × I 0 plot in the intensity range from ∼30 to 270 GW/cm2, exhibiting the average value (red line) of n 2 = + 1.8 ± 0.1 × 10 15 cm2/W; (b) α 2 × I 0 plot in the intensity range from ∼50 to 140 GW/cm2, showing a two-photon NLA coefficient of α 2 = + 3.5 ± 0.2 × 10 2 cm/GW.
Photonics 11 00930 g004
Figure 5. OKG signal measured for N b S e 2 suspended in ACN. The inset is the maximum (peaks) OKG signal versus pump intensity. The error bars are the standard deviations of 10 successive measurements for each pump intensity.
Photonics 11 00930 g005
Table 1. Nonlinear optical coefficients for 2D metallic NbSe2 and NbS2 suspended in ACN obtained in the present work and related literature for similar spectro-temporal regimes.
MaterialTechnique | n 2 | (cm2/W) α 2 (cm/GW)Ref.
NbSe2Z-Scan a ( 1.8 ± 0.1 ) × 10 15 3.5 ± 0.2 × 10 2 This work
OKG b ( 4.2 ± 0.5 ) × 10 14 Not observed
NbS2Z-Scan ( 3.0 ± 0.2 ) × 10 16 2.1 × 10 1 [13]
OKG ( 9.3 ± 0.5 ) × 10 15 Not observed[14]
ACNZ-Scan 1.9 × 10 17 Negligible[13]
CS2Z-Scan ( 3.1 ± 1 ) × 10 15 1.0 × 10 2 [27]
a 790 nm, 190 fs, 750 Hz, 30–300 GW/cm2; b 800 nm, 170 fs, 76 MHz, 200–600 MW/cm2.
Disclaimer/Publisher’s Note: The statements, opinions and data contained in all publications are solely those of the individual author(s) and contributor(s) and not of MDPI and/or the editor(s). MDPI and/or the editor(s) disclaim responsibility for any injury to people or property resulting from any ideas, methods, instructions or products referred to in the content.