Article

A Novel Two-Stage Approach for Nonlinearity Correction of Frequency-Modulated Continuous-Wave Laser Ranging Combining Data-Driven and Principle-Based Strategies

by
Shichang Xu
1,2,
Guohui Yuan
1,2,
Hongwei Zhang
1,2,
Chunyu Hou
1,2,
Zhirong Li
1,2,
Pansong Zhang
1,2,
Wenhao Xu
1,2 and
Zhuoran Wang
1,2,*
1
College of Information and Communication Engineering, University of Electronic Science and Technology of China, Chengdu 611731, China
2
Yangtze Delta Region Institute (Quzhou), University of Electronic Science and Technology of China, Quzhou 324000, China
*
Author to whom correspondence should be addressed.
Photonics 2025, 12(4), 356; https://doi.org/10.3390/photonics12040356
Submission received: 16 February 2025 / Revised: 28 March 2025 / Accepted: 8 April 2025 / Published: 9 April 2025
(This article belongs to the Special Issue The Interaction between Photonics and Machine Learning)

Abstract

:
The frequency linearity of a frequency-swept light signal is critical for ensuring the precision of Frequency-Modulated Continuous-Wave (FMCW) laser ranging systems. A two-stage nonlinearity correction mechanism for frequency-swept light is proposed, combining both data-driven and principle-based approaches. In the main correction stage utilizing an electro-optic phase-locked loop (EO-PLL), high temporal resolution phase detection is achieved. To address the failure of the EO-PLL caused by a bandwidth limitation of the digital loop filter (DLF), a novel pre-correction mechanism is developed based on a data-driven approach. In this mechanism, the neural network (NN) model establishes a mapping relationship between the input and output of the real laser-modulation system, which effectively simulates this physical system and avoids the risk of trial-and-error damage. Afterwards, the Soft Actor–Critic (SAC) model interacts with the NN model and trains a decision-making agent to determine the optimal modulation strategy for the nonlinearity pre-correction of the frequency-swept light. During the training process of the SAC agent, both the modulation strategy and the accuracy of evaluating the strategy’s effectiveness are optimized. Moreover, in contrast to the basic Actor–Critic model, the SAC model enhances the exploration of modulation possibilities by maximizing entropy expectation of random strategy, thereby improving the robustness of the pre-correction mechanism. Finally, the frequency-swept characteristic analysis experiment proves that integrating NN-SAC with EO-PLL enables frequency locking under the reduced bandwidth of the DLF. Additionally, through actual ranging experiments, it is also demonstrated that the proposed mechanism significantly enhances ranging precision, repeatability, and stability. Therefore, by integrating data-driven and principle-based approaches, this investigation offers an innovative perspective for the nonlinearity correction of FMCW laser ranging and, furthermore, electro-optic control scenarios.

1. Introduction

LiDAR (Light Detection and Ranging) technology has emerged as a critical tool in various applications, including autonomous vehicles, robotics, and remote sensing. Among the different LiDAR technologies, Frequency-Modulated Continuous-Wave (FMCW) laser ranging has gained significant attention due to its high resolution, long measurement range, and ability to operate in challenging environmental conditions [1,2,3]. This method uses a frequency-swept light with periodic frequency changes as the probe light and achieves ranging through the principle of optical interference.
The modulation methods for frequency-swept light mainly include two forms, internal modulation [4,5] and external modulation [6], among which the former has faster frequency modulation speed, simpler structure, higher output power, and better cost performance compared to the latter. The linearization of frequency sweeping is the key to ranging precision. To suppress the nonlinearity caused by the internal semiconductor active material and thermal effects of internal modulation, the modulating current has to be controlled carefully. The control methods mainly include iterative control [7,8], the resampling method [9,10], the frequency comb method [11,12], phase-locked loop control [13,14], etc. The iterative method is based on the real-time feedback of the beat signal frequency from the correction branch, continuously controlling the frequency-swept laser to restore a new frequency-swept light; this light then generates a new beat frequency signal through the correction branch, continuously repeating this cycle to achieve iterative correction. The resampling method is based on the sampling principle, taking the peak and valley positions of the beat signal from the correction branch as the clock basis to downsample the beat signal from the measurement branch. The sampling signal is then reprocessed and used as the basis for nonlinearity correction. The practical implementation of this ranging method necessitates an optical delay fiber with a minimum quadruple length relative to the measurement distance, consequently imposing constraints in extended-ranging applications. The frequency comb method is used to achieve nonlinearity correction by selecting the optical frequency output of the frequency-swept laser. This methodology entails both intricate system architecture and elevated control complexity. The phase-locked loop (PLL) control requires the construction of a PLL branch, which uses the error between the beat signal from this branch and a standard reference signal as feedback to correct the nonlinearity of frequency-swept light in real time.
Compared to all the previous proposals, the PLL control method has a high-performance potential, which can suppress the frequency and phase noise of the frequency-swept light and enhance dynamic coherence [15], achieving almost completely linear modulation [16]. Chen et al. [17] designed a frequency-swept laser based on PLL control, which can lock the optical frequency sweeping velocity and generate a frequency excursion of 117.69 GHz. Deng et al. [18] proposed a self-adapted two-point modulation type-II digital PLL to generate frequency-swept light with both a wide normalized chirp-bandwidth and a fast chirp rate simultaneously. Integrating a continuous-time electro-optic phase-locked loop, Feng et al. [15] developed a wideband FMCW laser radar whose ranging precision could reach 558 μm.
However, if the initial frequency of the beat signal input to the PLL is out of the bandwidth range of the digital loop filter, the phase of the beat signal cannot lock to that of the reference signal. Therefore, it is necessary to perform a pre-correction before implementing the PLL control to ensure that the frequency of the beat signal input into the PLL meets this initial requirement. The pre-correction methods are often implemented by introducing principle-based control, such as iterative control [19], repetitive control [16], etc.
The conventional pre-correction method requires rigorous principal derivation and substantial tests, which cause the pre-correction effect to be heavily related to prior knowledge and complex tuning. Therefore, to avoid introducing additional control in the hardware before implementing the PLL control, this work intends to fully explore the potential of a data-driven approach to optical modulation and develop a neural network–Soft Actor–Critic (NN-SAC) mechanism to achieve pre-correction. Specifically, we adopt the neural network (NN) [20] to construct an input–output mapping model between the modulating current i(t) and the frequency fMZI(t) of the beat signal in the correction subsystem thus characterizing their complex implicit relationship through a data-driven method. Then, reinforcement learning (RL) is used to interact with the NN model. The core idea of RL is to construct a decision-making agent to build an optimal strategy for system optimization [21]. Specifically, this agent performs a strategy on the present state and receives a reward corresponding to the resulting state transition, which quantitatively evaluates the effectiveness of its strategy. Thus, through continuous trial-and-error while interacting with the system, the agent is trained and can progressively refine its strategy to maximize the reward, ultimately achieving optimal control of the system state [22]. Considering the adaptability of the pre-correction model to uncertainty and randomness, we chose the SAC algorithm [23] to train this agent. By using NN-SAC as the pre-correction mechanism for the PLL main correction, the data-driven and principle-based methods are strongly combined to efficiently achieve two-stage correction for FMCW frequency-swept light nonlinearity. This work may provide an innovative paradigm for solving optical control issues.
This paper is organized as follows: Section 2.1 elaborates on the FMCW ranging principle and the significance of frequency-sweeping linearity. Afterwards, the electro-optic phase-locked loop (EO-PLL) control method we designed to correct the nonlinearity of the frequency-swept light is illustrated in Section 2.2. In Section 2.3, the NN-SAC algorithm is introduced to realize a pre-correction to ensure the effectiveness of the EO-PLL. In Section 3, we verify the effectiveness of the two-stage nonlinearity correction mechanism combining NN-SAC and EO-PLL through controlled experiments. Finally, the conclusion is provided in Section 4.

2. Materials and Methods

2.1. FMCW Ranging Principle

FMCW laser ranging is based on the principle that the beat signal frequency is proportional to the optical path difference. As shown in Figure 1, the frequency-swept laser generates a frequency-swept light whose frequency varies continuously from low to high during each modulation period T. This light is split into two beams by a splitter, one of which is the probe light, and the other is the local light. The probe light is transmitted through a circulator and collimator before being emitted to the target and then reflected back. The reflected light is also received by the collimator and the circulator, as well as interferes with the local light through a coupler to create the beat signal, whose frequency is represented by f(t) as follows:
f t = f LOCAL t f REFLECTED t
where f LOCAL ( t ) and f REFLECTED t refer to the frequencies of local light and reflected light, respectively. Then, the distance d can be determined by the following equation:
d = T c 2 n B f
where c and n refer to the speed of light and the refractive index of the medium in space, respectively. T and B refer to the modulation period and frequency excursion, respectively, which are determined by the frequency-swept laser.
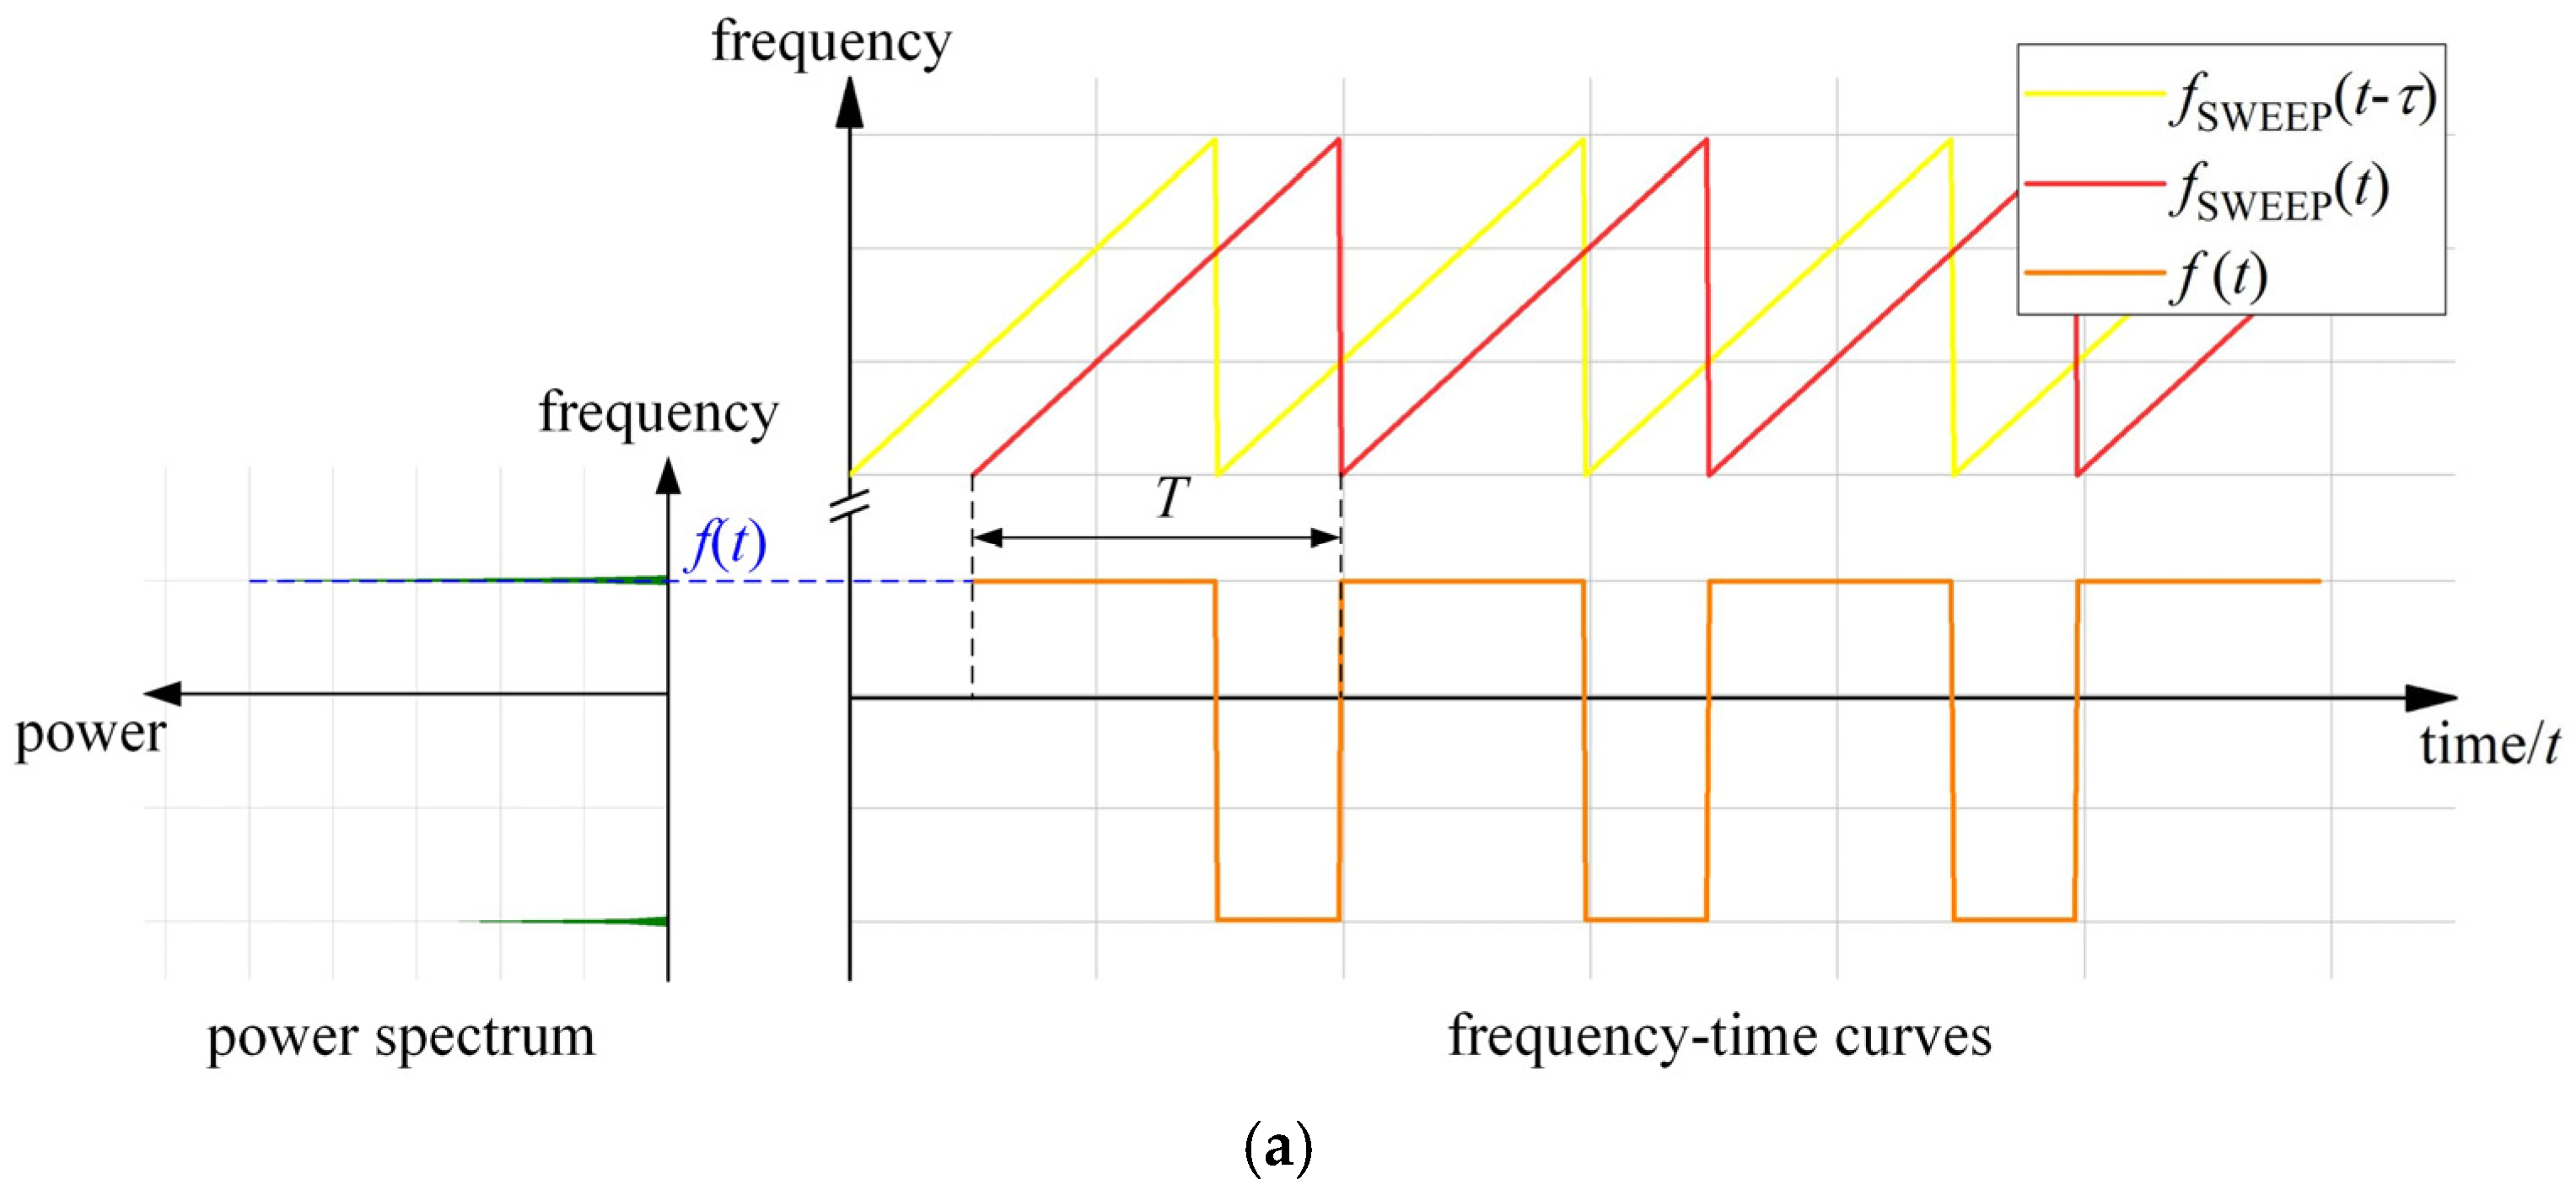
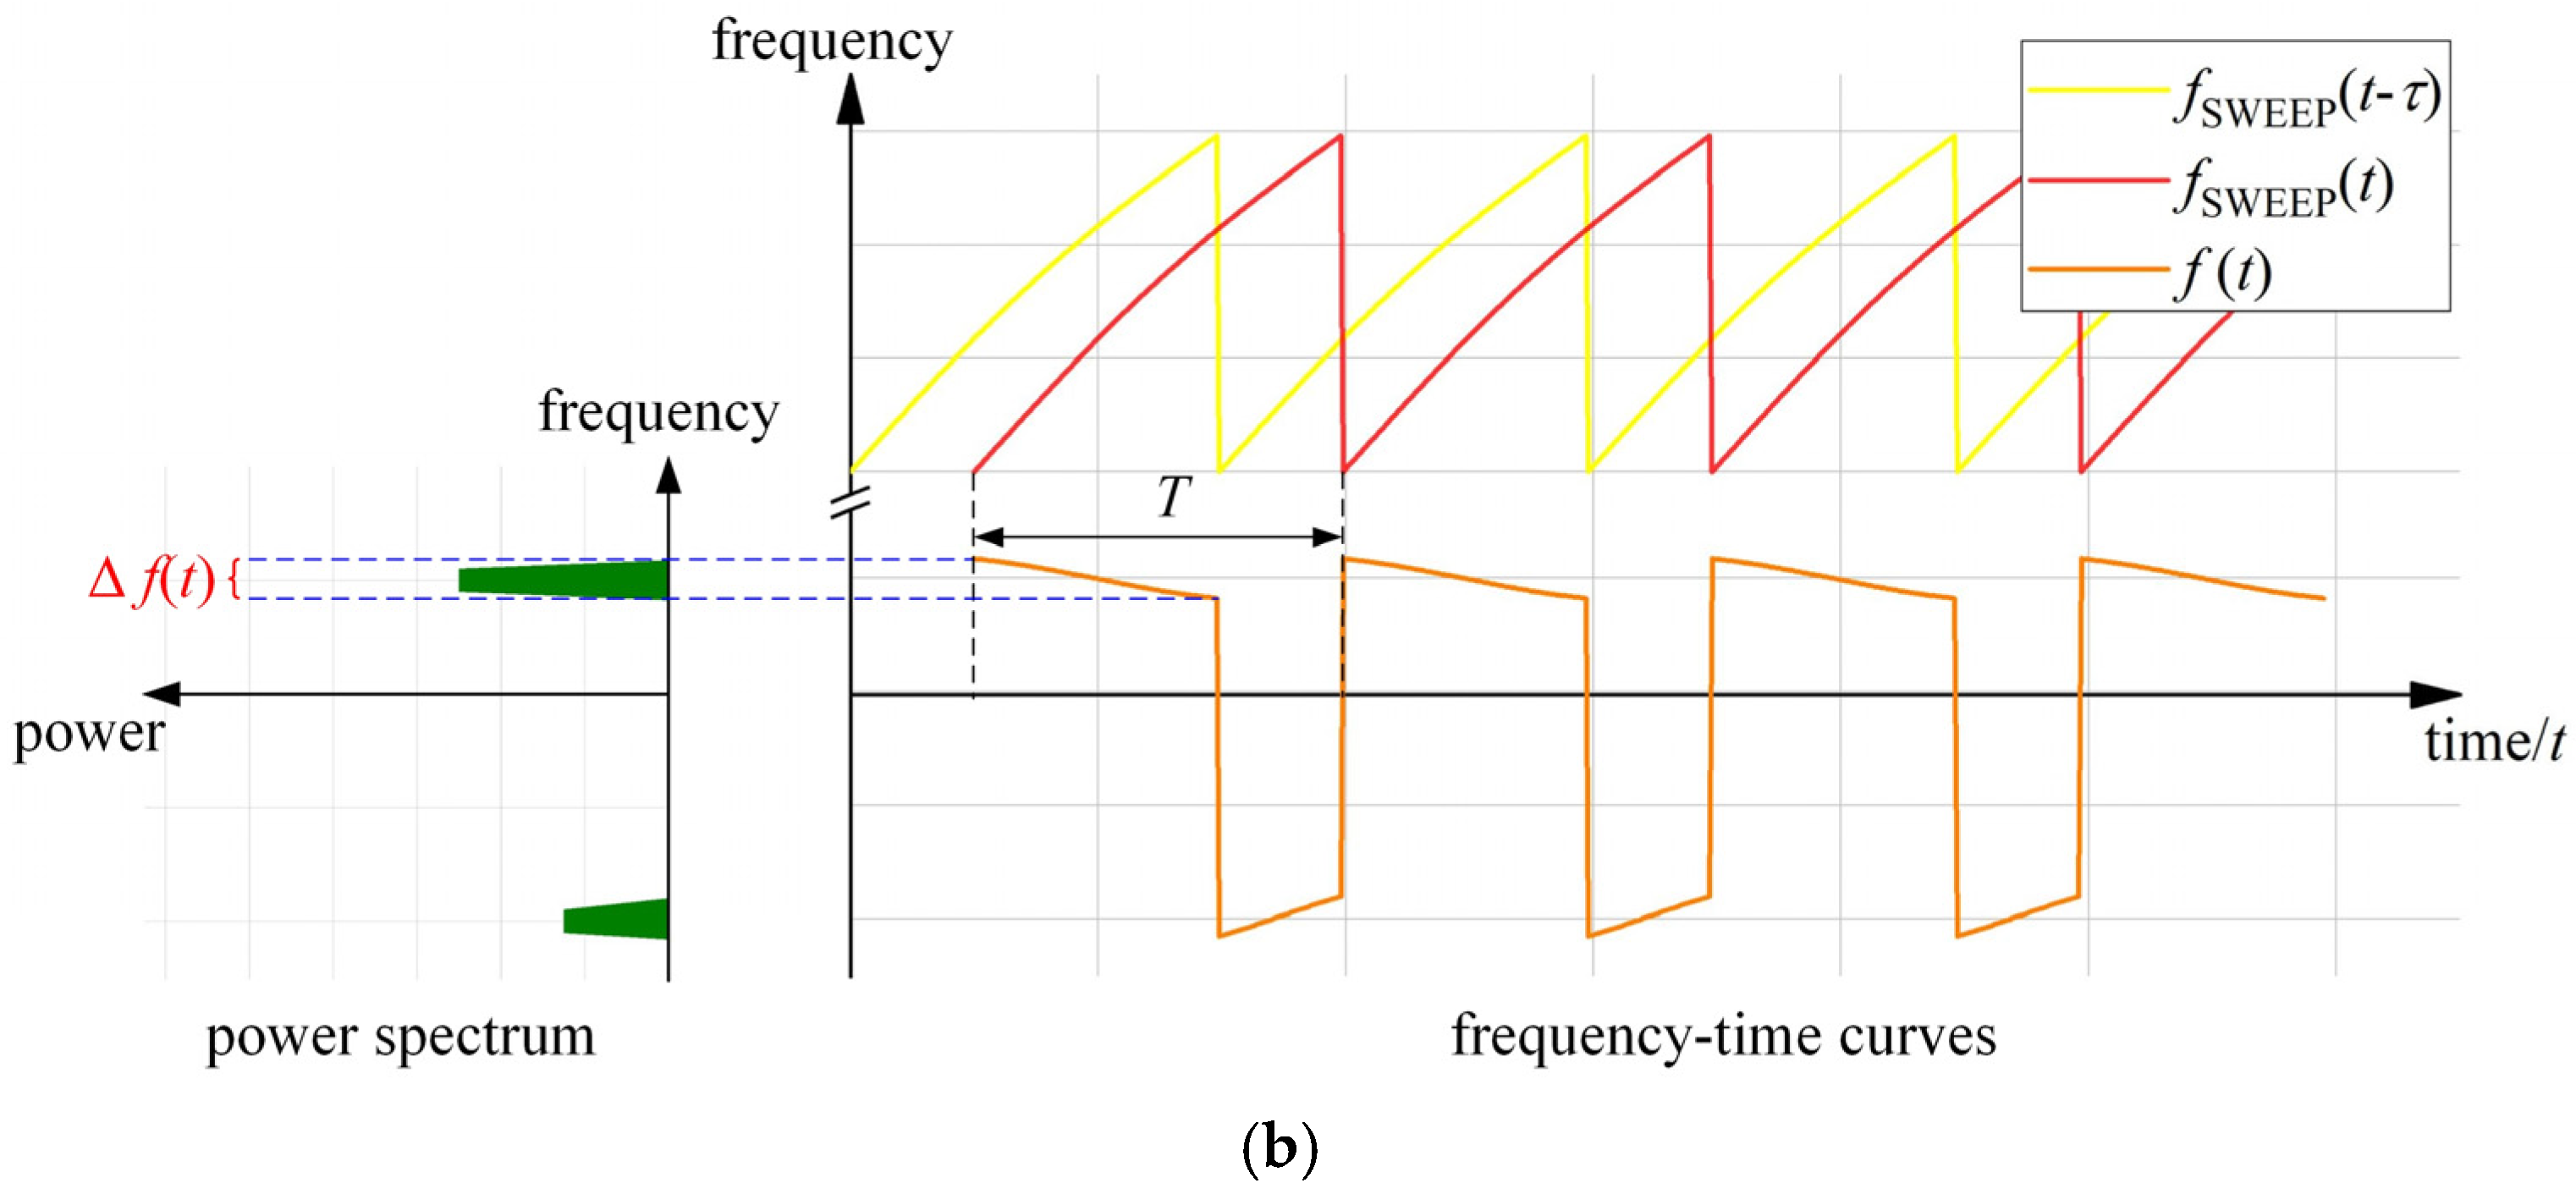
The linearization of frequency-sweeping is the key to ranging precision. As illustrated in Figure 2a, when the light frequency changes with perfect linearity, the frequency difference between the local light and the reflected light remains constant throughout most of each modulation period T. And this difference represents the frequency f(t) of the beat signal. Concerning the power spectrum, a sharp peak will be generated at this fixed frequency, thus the distance information can be precisely determined by Equation (2). However, in practice, the linearity of the frequency-swept light is distorted by many issues. As shown in Figure 2b, the nonlinearity of the frequency-swept light causes the frequency f(t) of the beat signal to no longer be a definite fixed value. In terms of the power spectrum, the beat signal also becomes broadened, and the ranging information cannot be obtained accurately. Therefore, we use an additional beat frequency signal sMZI as the indicator for the nonlinearity correction of the frequency-swept light.

2.2. The Main Correction Based on EO-PLL

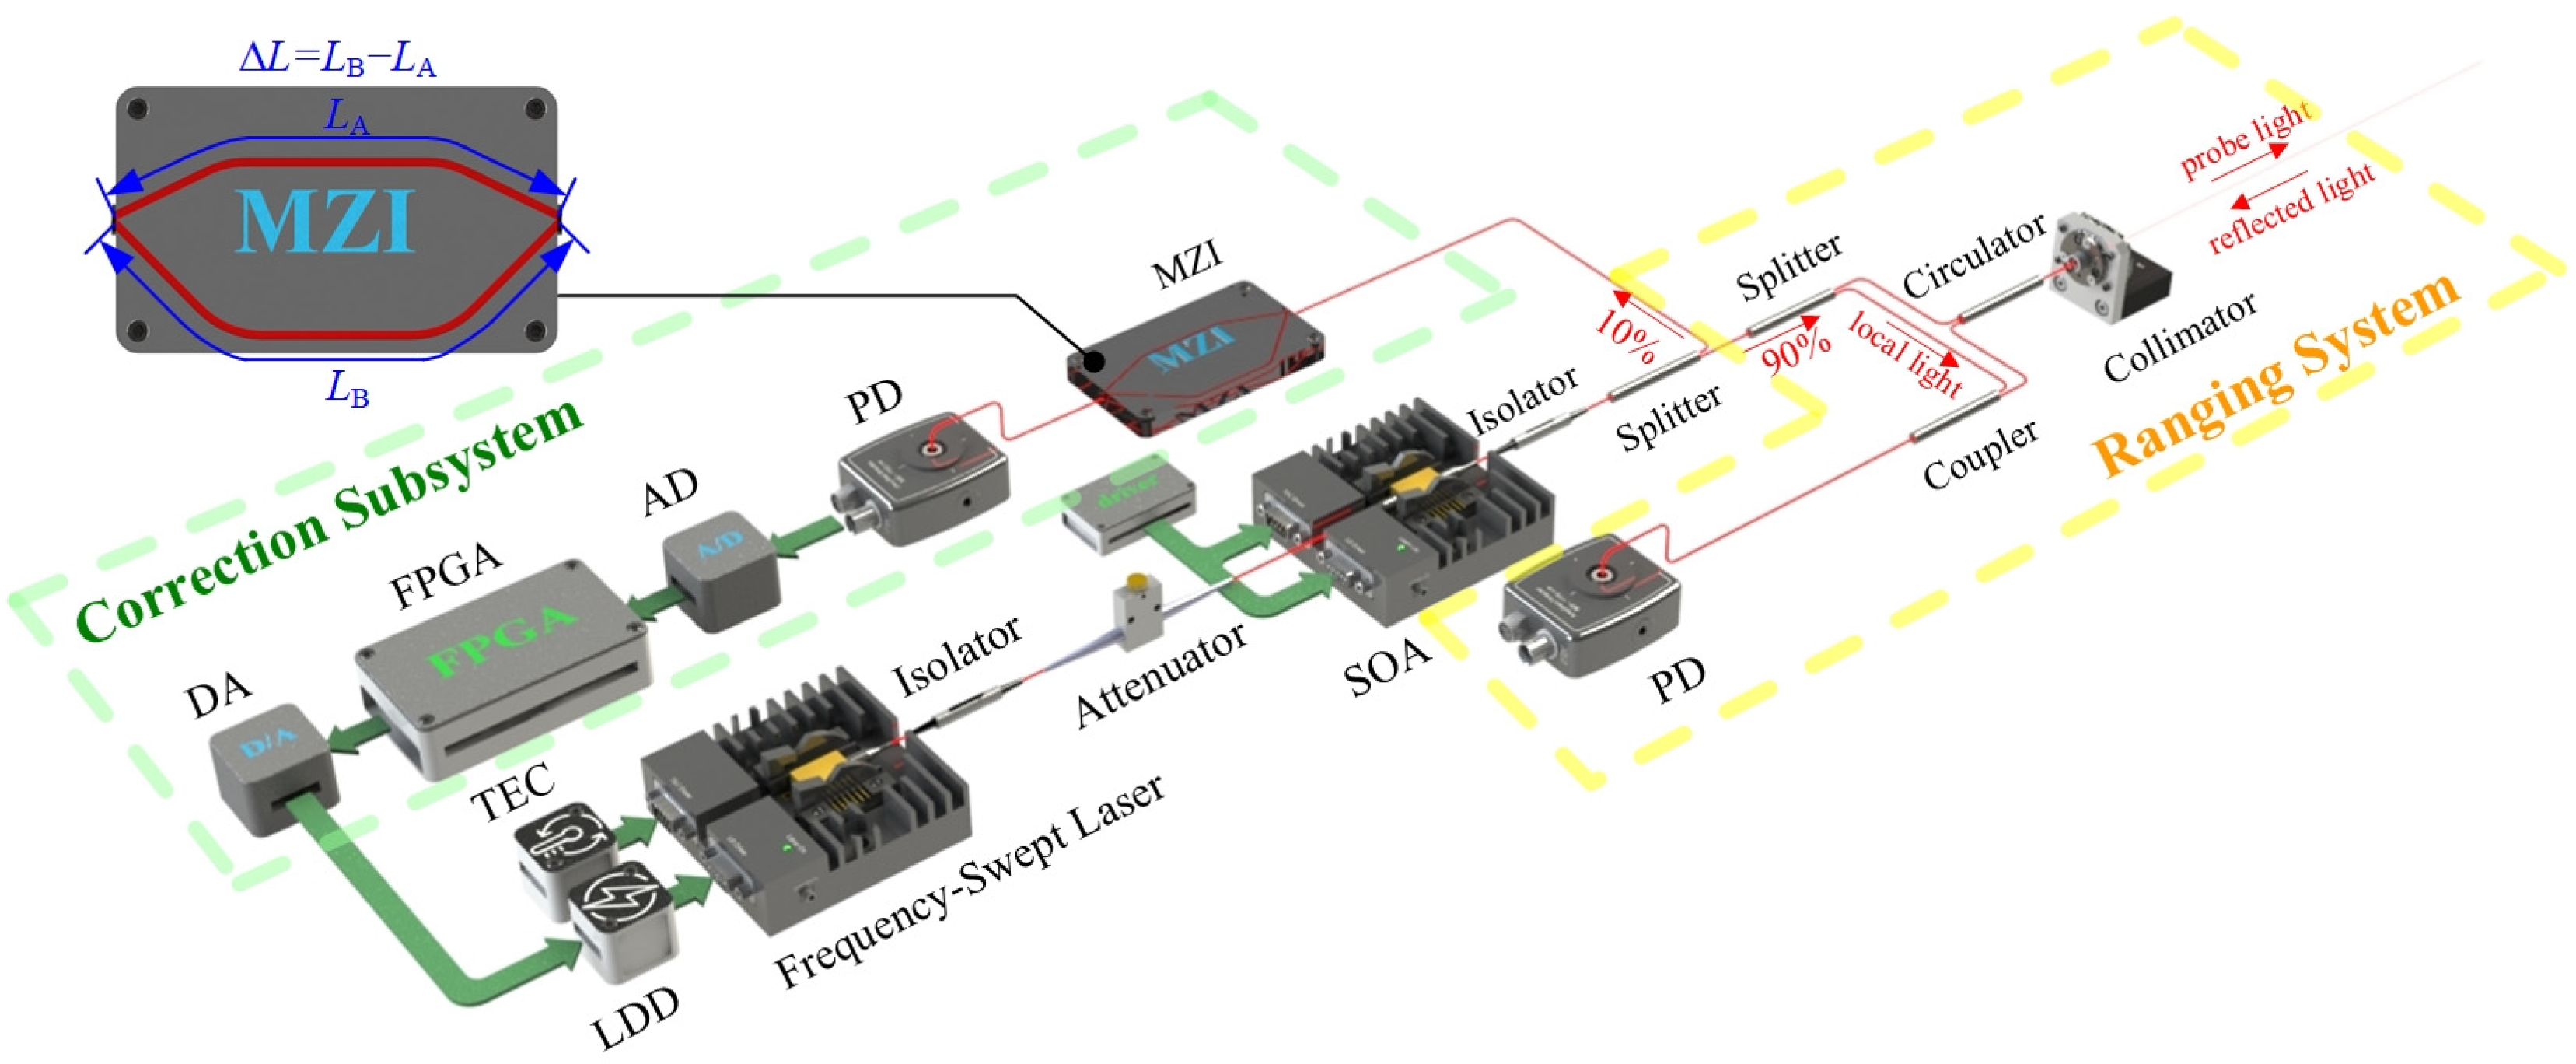
As illustrated in Figure 3, a correction subsystem has been integrated into the measurement system. The frequency-swept light generated from the frequency-swept laser is fed into a semiconductor optical amplifier (SOA) to maintain power stability. Then, the light is split into two beams by a splitter, with 10% entering the correction subsystem and 90% entering the ranging system. The subsystem is equipped with a Mach–Zehnder Interferometer (MZI) and a photodetector (PD), etc. The MZI has two built-in branches sA and sB, which have lengths of LA and LB, respectively, and their optical path difference is ΔL. They also generate a beat signal sMZI similar to Equation (1). The frequency fMZI(t) of sMZI(t) can be expressed as follows:
f MZI ( t ) = f A ( t ) f B ( t ) = f A ( t ) f A ( t τ ) τ = Δ L / c
where τ refers to the delay time of sB relative to sA, which is determined by their optical path difference ΔL, and c is the speed of light.
The frequency fMZI(t) of the beat signal in the correction subsystem is expressed as follows:
f MZI ( t ) = d φ SWEEP ( t ) d t / 2 π = τ d f SWEEP ( t ) d t
where φ SWEEP ( t ) and f SWEEP ( t ) refer to the phase and frequency of the frequency-swept light, respectively.
It is clear that the frequency fMZI(t) of the beat signal sMZI(t) can only be a single value when the change rate of f SWEEP t remains constant. Therefore, to generate a linear frequency-swept light, we use fMZI(t) as an indicator. This work utilizes a correction mechanism based on electro-optic phase-locked loop (EO-PLL) control to continuously drive fMZI(t) toward a fixed value, effectively correcting the nonlinearity of the frequency-swept light during the process. Specifically, the EO-PLL is a negative real-time feedback control, with phase error as the control quantity. This control is implemented on a Field Programmable Gate Array (FPGA). By forcing the output phase φMZI(t) of the MZI to follow the preset reference signal, the EO-PLL locks the MZI’s frequency fMZI(t) to the reference signal frequency, as the frequency is a time derivative of the phase.
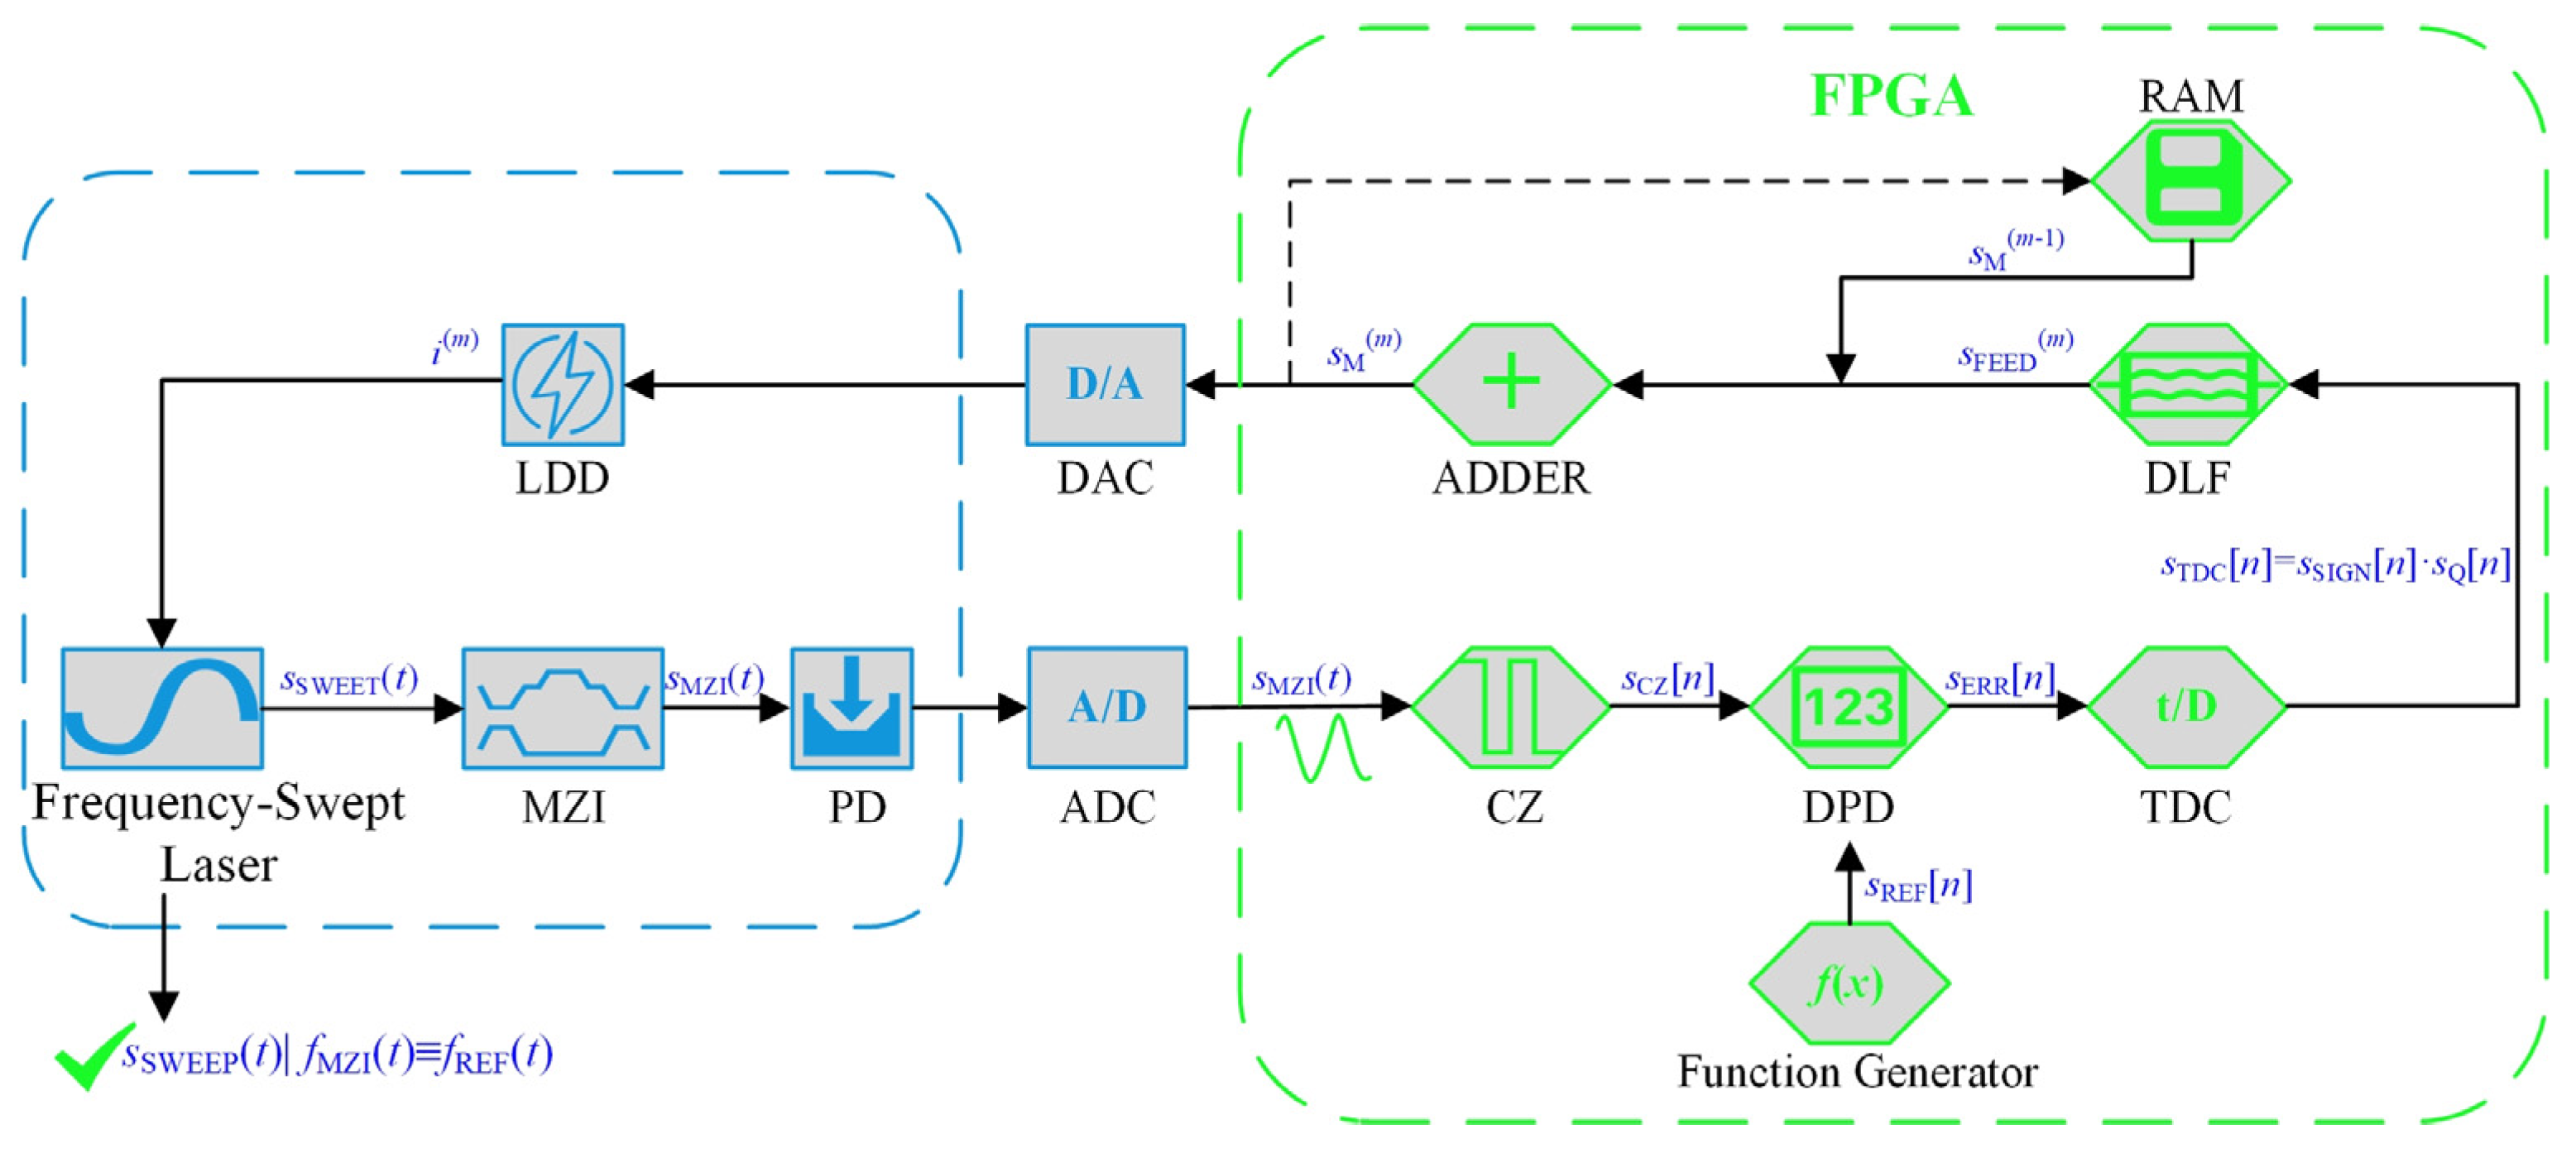
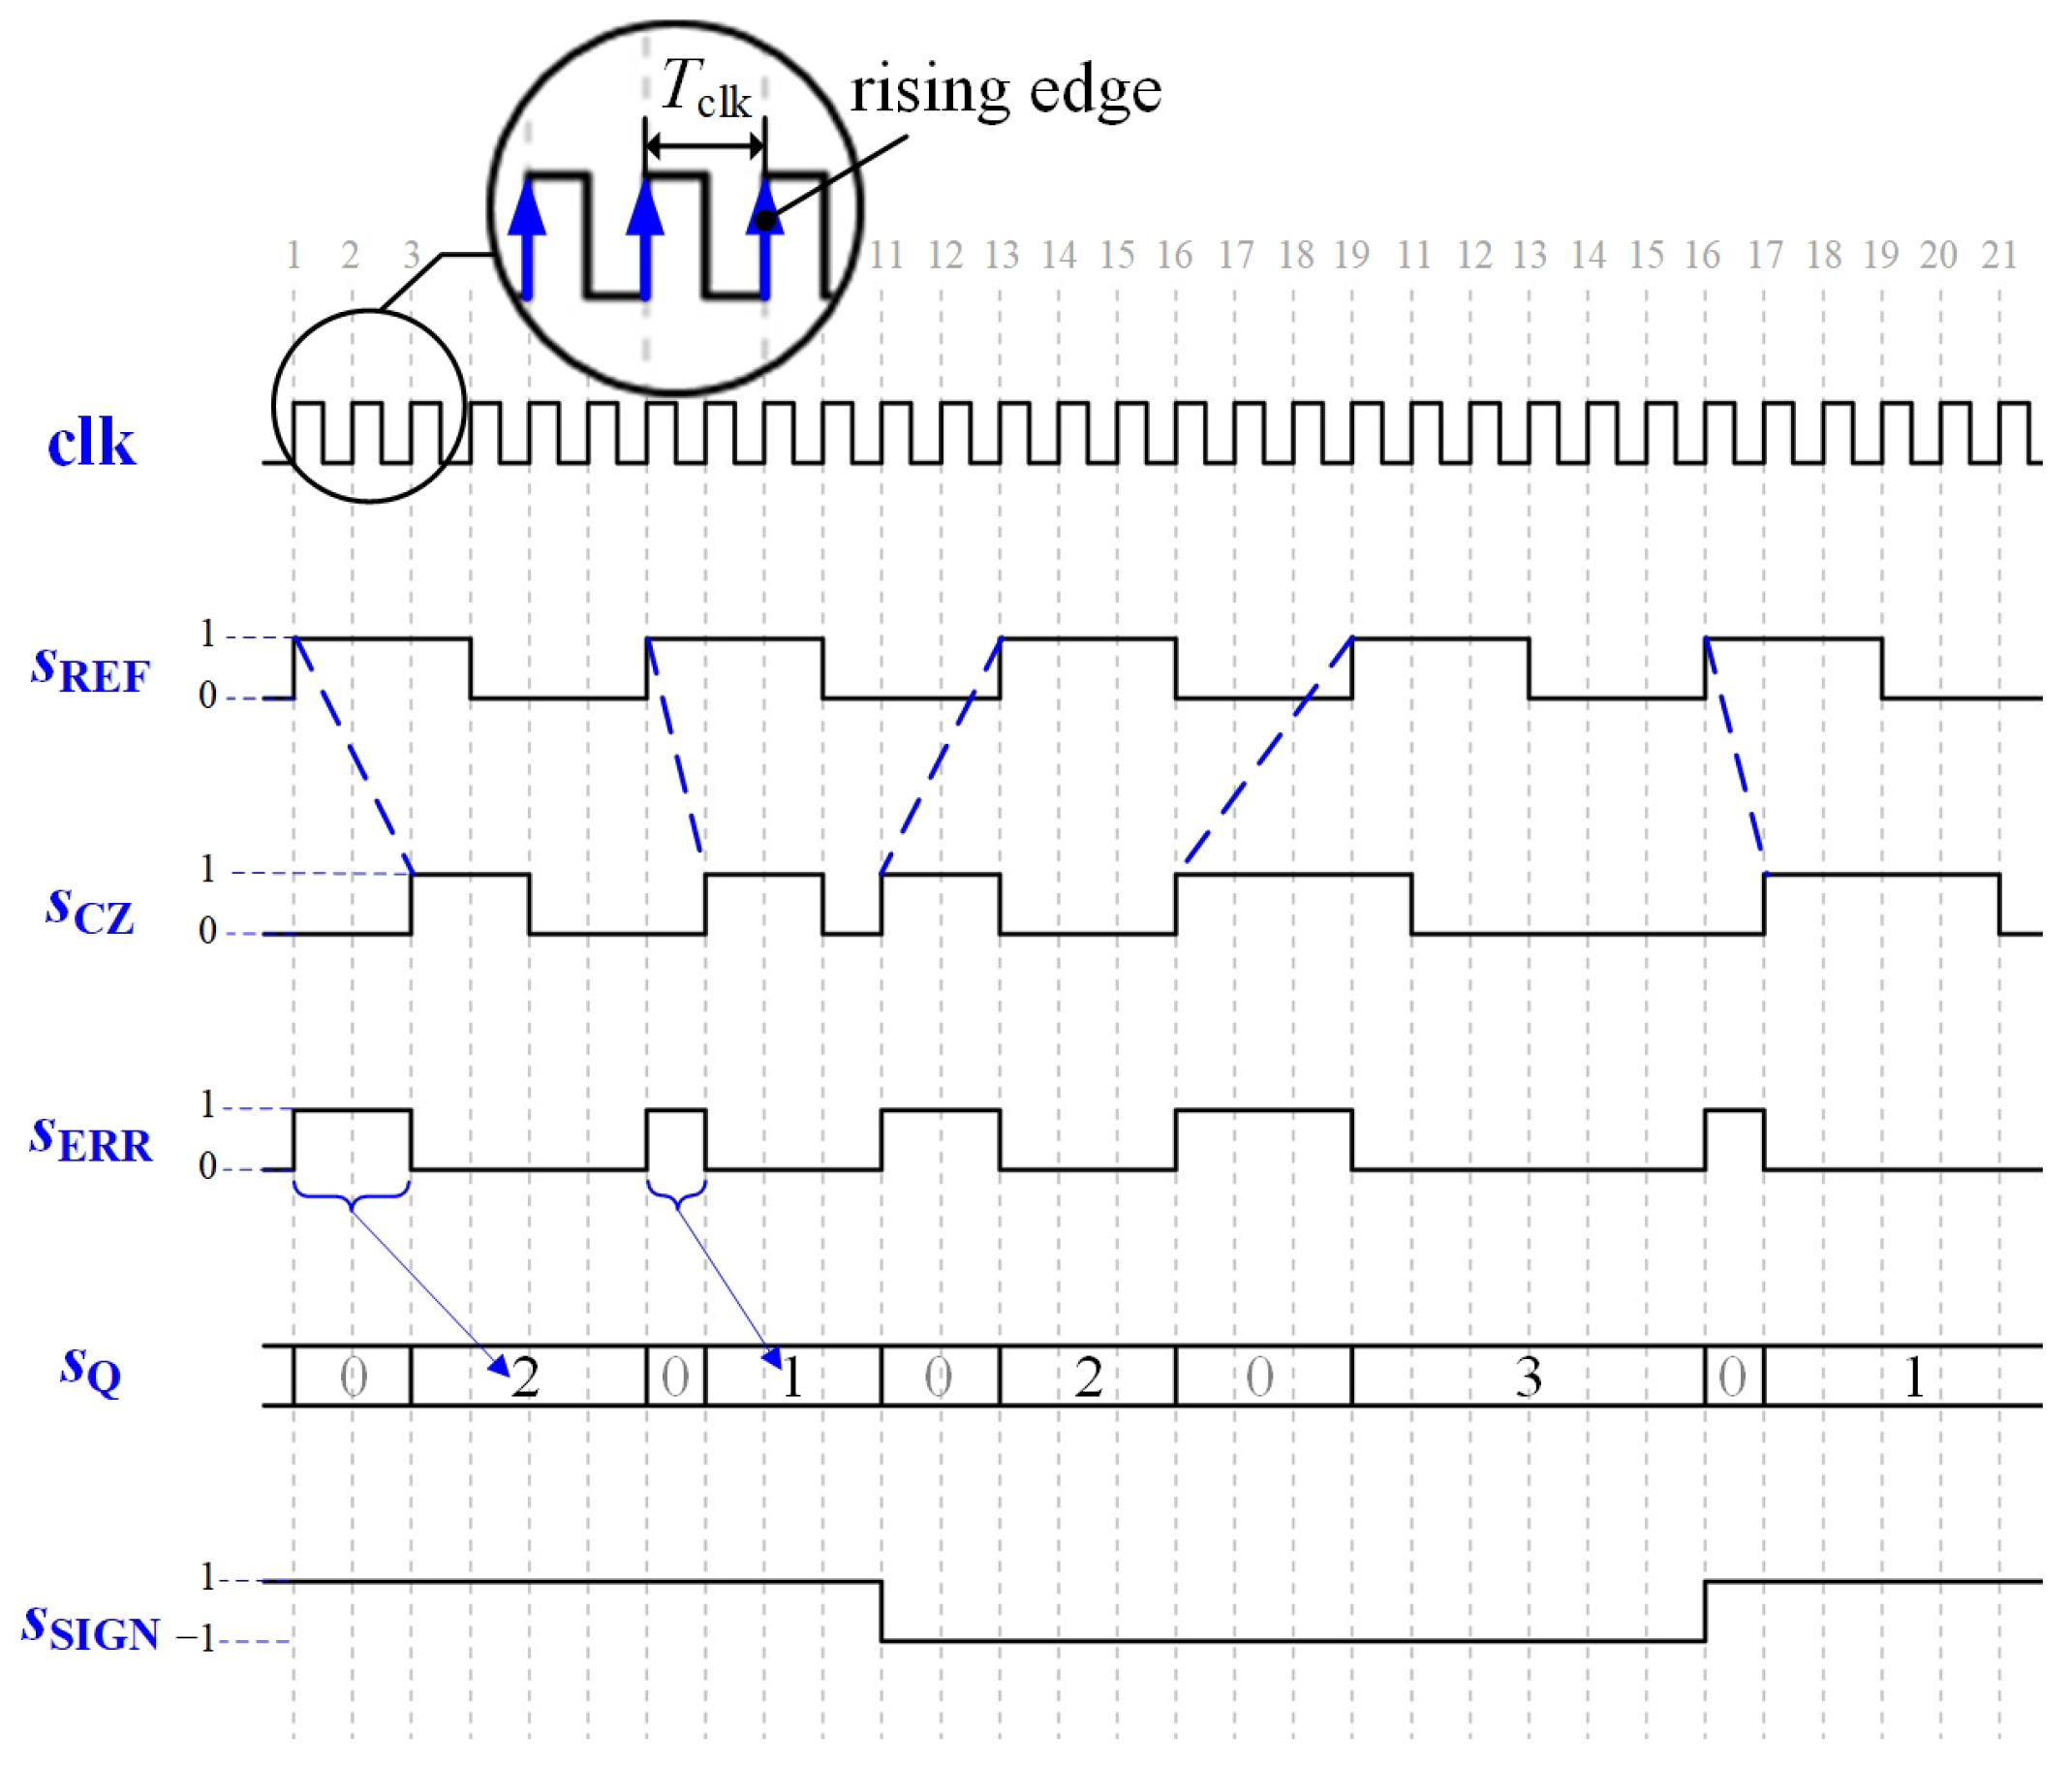
Specifically, as shown in Figure 4, the beat signal generated by the MZI is converted into a digital signal sMZI(t) by the analog-to-digital converter (ADC) and then converted into a square wave signal sCZ[n] by the cross-zero circuit (CZ), as in the following:
s CZ [ n ] = 1 ,   if   s n T clk > 0 0 ,   if   s n T clk 0
where Tclk refers to the system clock cycle of FPGA, i.e., the interval time between adjacent pulses, and n refers to the cycle order number. In this work, all signal changes are updated on the rising edges of the pulses.
Then, sCZ[n] is fed into the digital phase detector (DPD) and compared with the preset reference signal sREF[n], which is a square wave signal with periodic and regular phase changes, and its frequency is denoted as fREF. The DPD then outputs an error signal sERR[n], as expressed in the following equation:
s ERR [ n ] = 1 ,   if   s CZ [ n ] s REF [ n ] 0 ,   if   s CZ [ n ] = s REF [ n ]
Subsequently, sERR[n] is sent into the time-to-digital converter (TDC) to obtain the error quantized signal sQ[n], as follows:
s Q [ n ] = 0 ,                              if   s ERR [ n ] = 1 c o u n t c l k s ERR = 1 ,   if   s ERR [ n ] = 0   and   s ERR [ n 1 ] = 1 s Q [ n 1 ] ,                if   else
where c o u n t c l k s ERR = 1 represents the number of clock cycles during which sERR remains at one before transitioning from one to zero. It directly corresponds to the number of cycles by which sCZ[n] presently leads or lags to sREF[n].
Furthermore, the TDC can also determine the lead–lag relationship between sCZ[n] and sREF[n] and determine the sign signal sSIGN[n] that represents this relationship. Specifically, if sCZ[n] leads to sREF[n], sSIGN[n] = −1; otherwise, sSIGN[n] = 1.
In order to make the phase-locked process easier to understand, Figure 5 shows the timing diagram of DPD and TDC, where the error quantization value (sQ[n]) and the lead–lag sign (sSIGN[n]) can be determined at each clock cycle, resulting in the time-to-digital conversion signal sTDC[n], as follows:
s TDC [ n ] = s SIGN [ n ] s Q [ n ]
Then, sTDC[n] is fed into a digital loop filter (DLF) to remove high-frequency noise and oscillations, resulting in a feedback correction signal sFEED(m) (Figure 4), which characterizes the difference between the present (the m-th PLL correction cycle) beat signal of the MZI and the reference signal. Finally, sFEED(m) is fed together with the modulation signal sM(m−1) from the previous clock cycle (stored in the Random Access Memory (RAM)) into an adder to generate a new modulation signal sM(m). Then, sM(m) is converted into an analog signal by the digital-to-analog converter (DAC) and sent to the laser diode driver (LDD) to generate a modulation current i(m), thereby controlling the frequency-swept laser to generate a new modulated frequency-swept light signal and enter the next cycle. Thus, a negative feedback correction is completed within the m-th PLL correction cycle. After several cycles, the EO-PLL system will reach a locked state, which means that the frequency fMZI(t) of the beat signal generated by the MZI will continuously approach the preset reference signal’s frequency fREF(t). As mentioned in Figure 2, if the frequency of a beat signal is stable at a single constant value, it means that the frequency-swept light generated by the frequency-swept laser has high linearity. Thus, in this work, by introducing DPD and TDC combined with the high-frequency clock of the FPGA, the phase error between sMZI and sREF is converted into high-precision digital values in real time, which significantly improves the time resolution and subsequently enhances the phase detection accuracy compared to the conventional PLL control.

2.3. The Pre-Correction Based on NN-SAC

The DLF not only performs filtering functions but also determines nearly all critical characteristics of the PLL, including stability, lock-in bandwidth, and lock-in speed. When the initial frequency difference between the input signal sMZI and the reference signal sREF falls within a specific range, the locking mechanism of the EO-PLL ensures that sMZI tracks the phase variations of sREF, thereby preventing their phase difference from diverging indefinitely over time. The successful locking of the EO-PLL entirely depends on the initial frequency difference between sMZI and sREF. If this value exceeds a defined threshold, the locking mechanism will fail. This threshold corresponds to the lock-in bandwidth determined by the DLF. Therefore, the time-to-digital conversion signal sTDC[n] output by TDC must be within the lock-in bandwidth of DLF to continuously and effectively correct the frequency-swept light and ultimately lock it. However, the bandwidth of DLF cannot be too high, as it may reduce the locking accuracy by introducing more noise signals. In this work, a pre-correction step based on NN-SAC is performed before the EO-PLL control to weaken the nonlinearity of the frequency-swept light, thereby making sTDC fall within the bandwidth of DLF in the initial cycle of EO-PLL, even if the bandwidth is small. We implement this nonlinearity pre-correction by using a data-driven mechanism instead of the conventional principle-based approaches.

2.3.1. NN Model

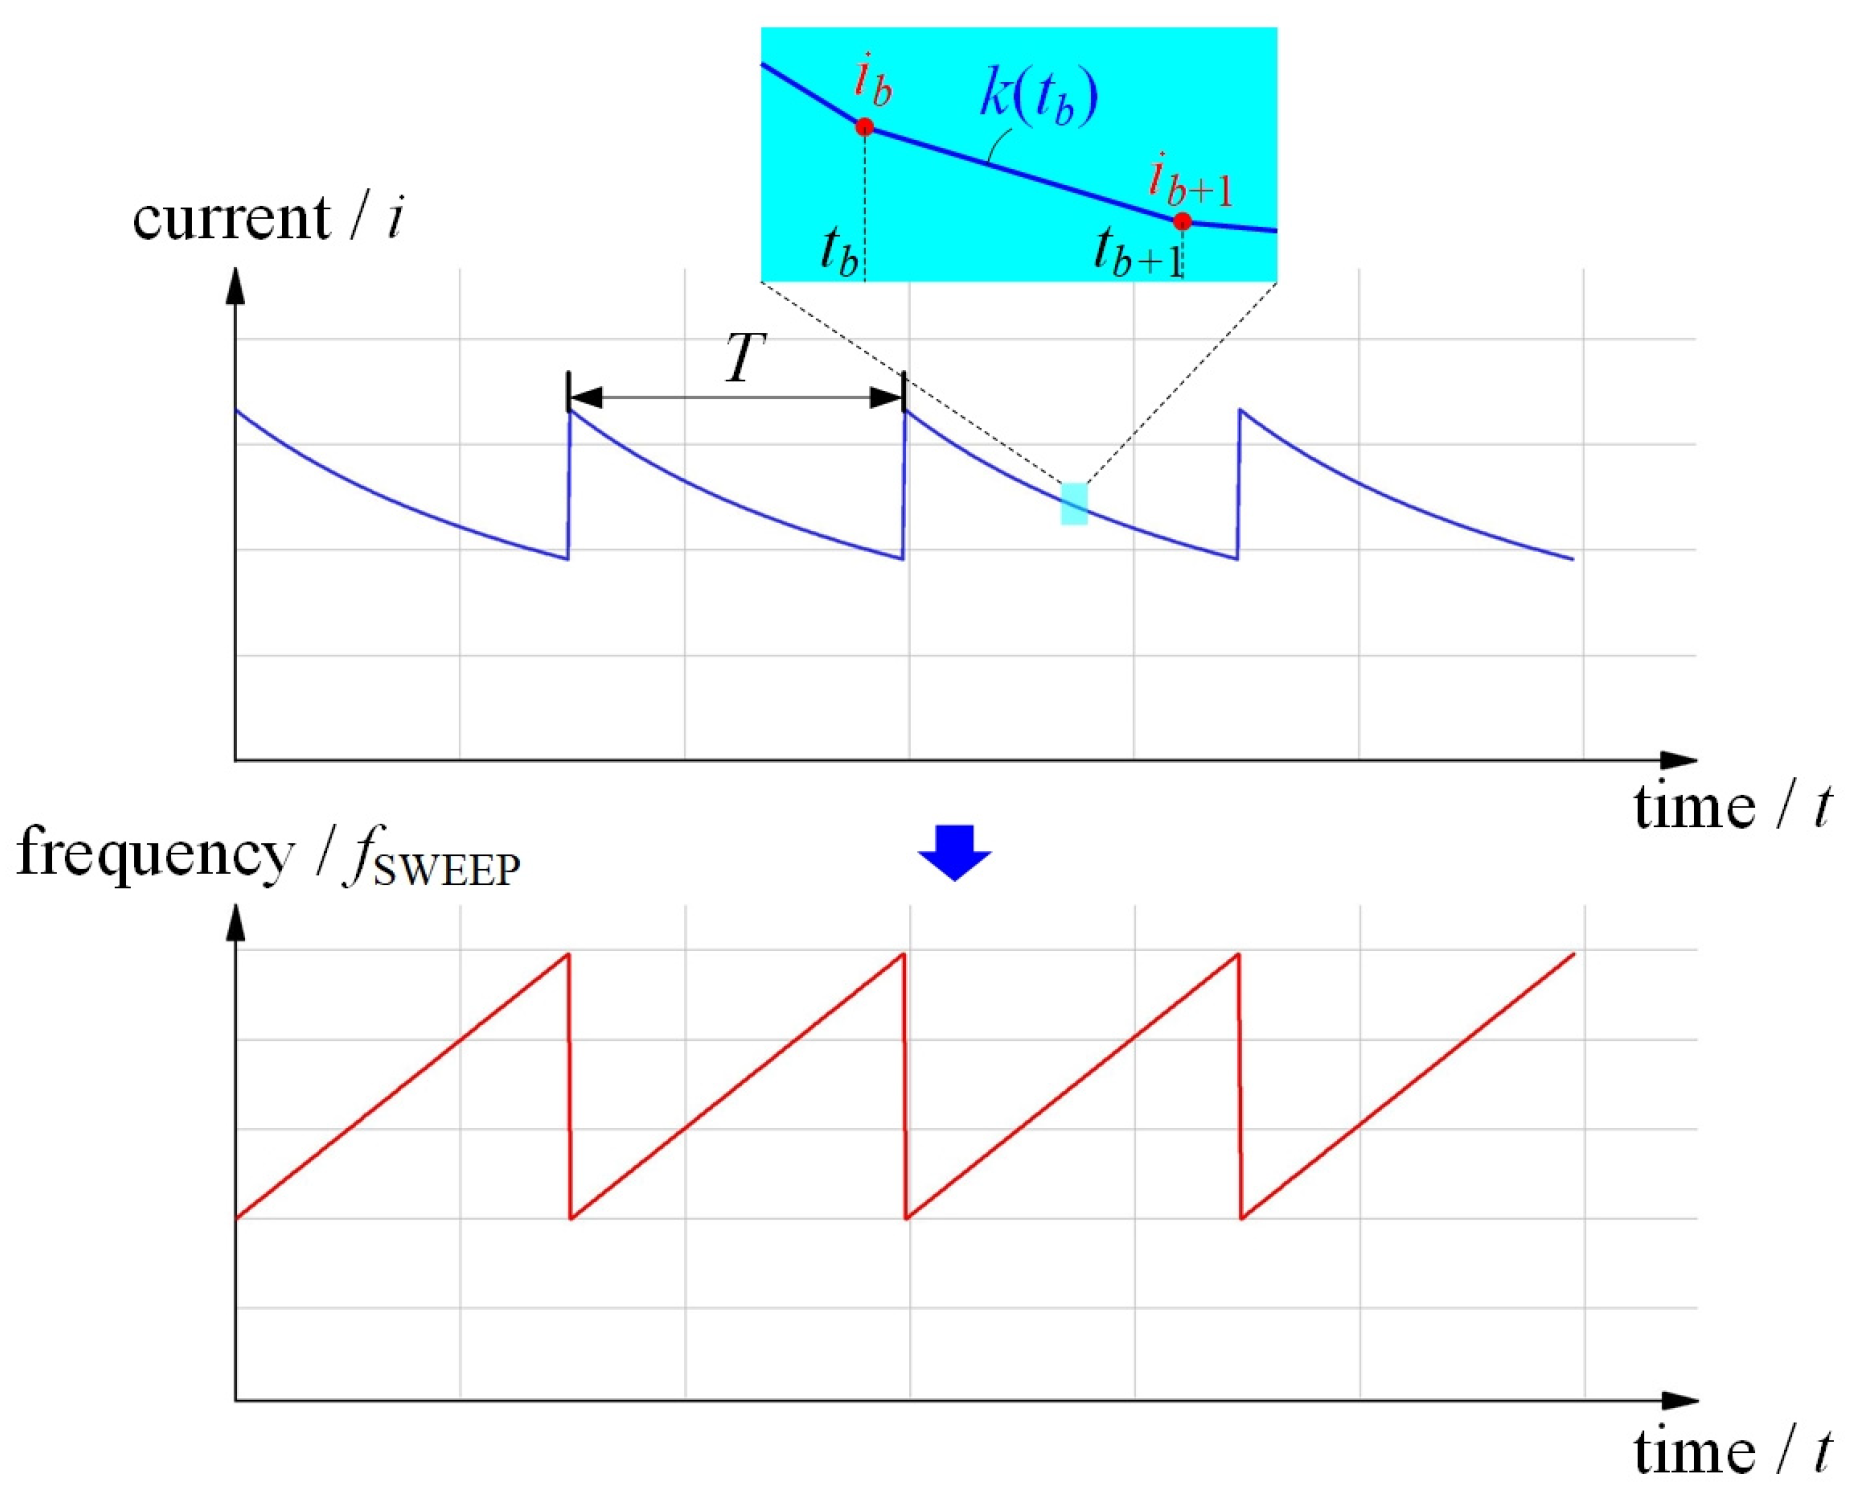
As shown in Figure 6, the beat signal sMZI(t) obtained from the MZI in the correction subsystem is used as an indicator to correct the modulation current slope k(tb) at control points (take the b-th point as an example) in each modulation period T, so that the modulation current output at the (b + 1)-th control point changes from ib to ib+1, driving the freqency-swept laser. Each current change is defined as a step. Since there are N uniformly distributed control points within each period T, there are a total of N steps. To establish the mapping relationship between the modulation current slope k(t) and the frequency fMZI(t) of the MZI’s beat signal, we develop a neural network (NN) model.
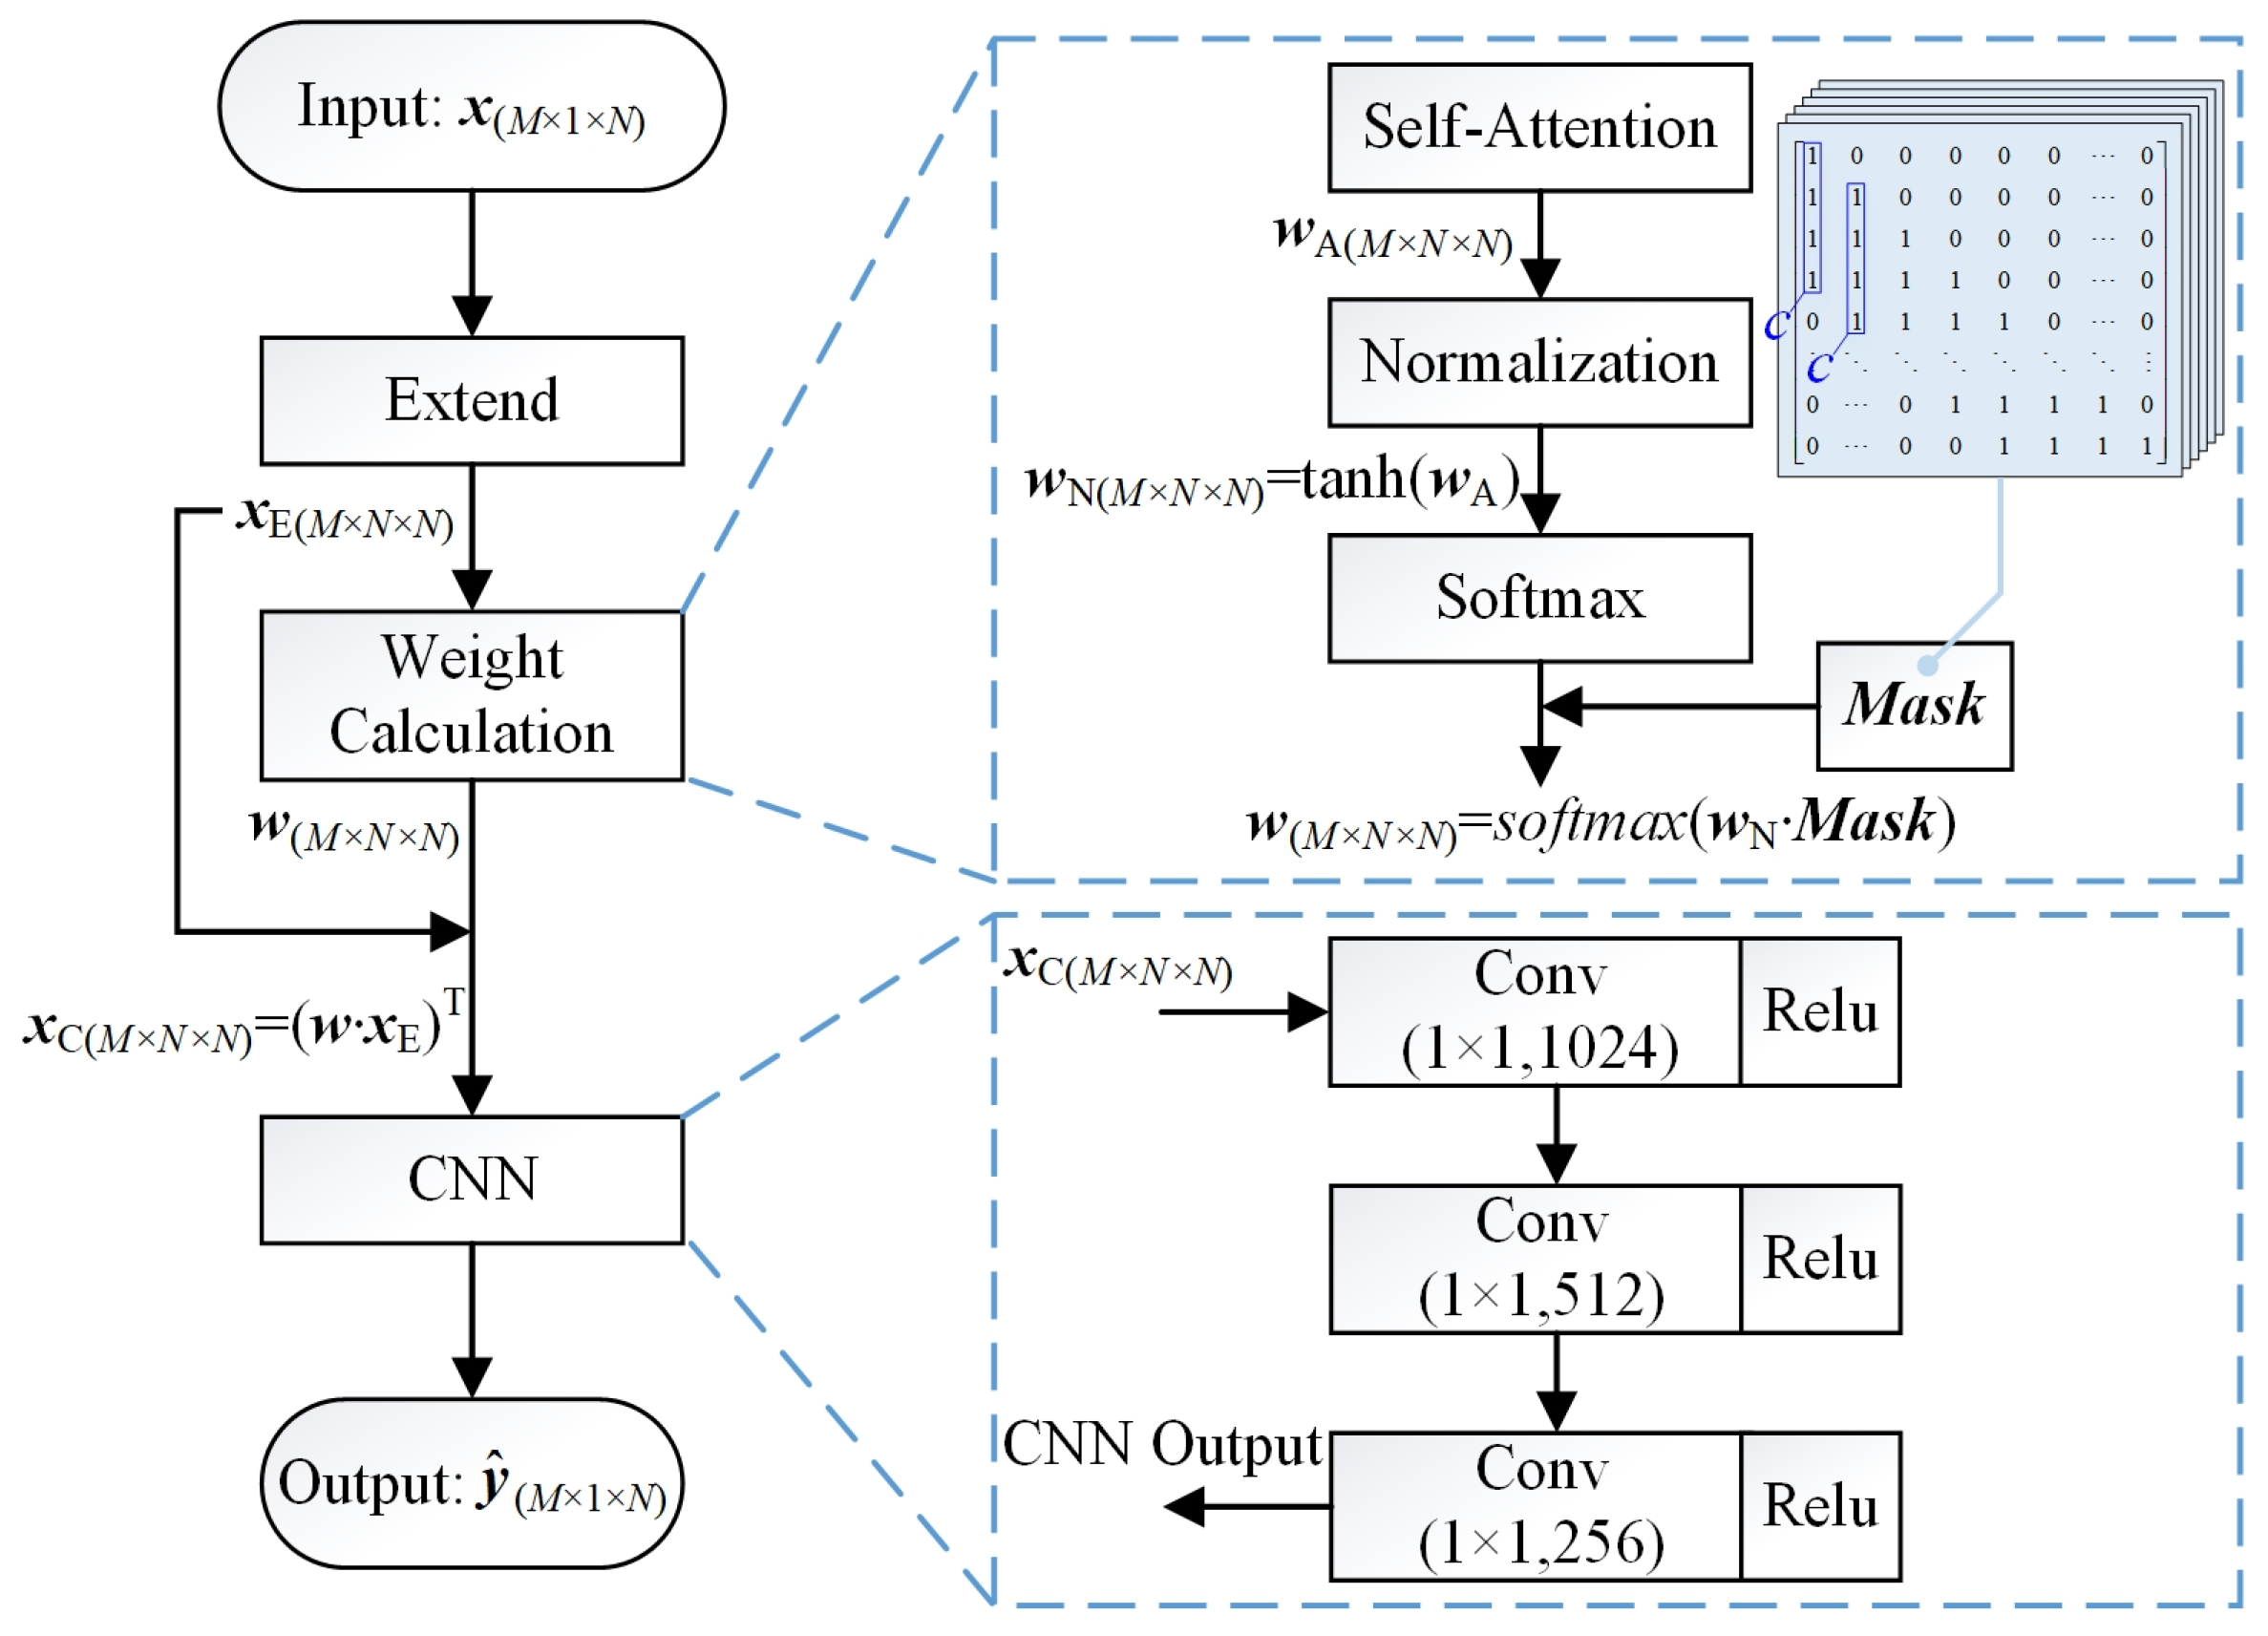
The dataset is the set of current slopes corresponding to N control points within multiple modulation periods collected from the real physical platform (i.e., the correction subsystem as shown in Figure 3), and the labels are the beat signal frequencies fMZI(t) at these control points. Each sample can be represented as {[k(t1), fMZI(t1)], [k(t2), fMZI(t2)], …, [k(tN), fMZI(tN)]}. The construction of the NN model is shown in Figure 7, where M batches are extracted from the dataset as input x(M×1×N) and extended to xE(M×N×N). Then, the weight w is determined through the weight calculation module. Thereafter, xC(M×N×N) is determined by the transpose of the product of w and xE. It is worth noting that we have designed a mask matrix in the weight calculation module. This design ensures that the output corresponding to the present control point is only affected by the first c control points (including the present point itself). Such an architecture better aligns with real-world logic, where the beat signal frequency fMZI(t) at any given moment within the modulation period T can only be influenced by the present and preceding parameters. Specifically, the frequency fMZI(t) is determined by the slope values k(t − Δt) to k(t) within a short preceding time window Δt, rather than being affected by future moments. Finally, after passing through three convolutional neural network (CNN) layers and removing the second dimension, the output y ^ M × 1 × N is determined, i.e., the beat signal frequencies corresponding to all N control points in the modulation periods of M batches.
During the training process of the NN model, random noise can lead to overfitting. To address this issue, we collect the beat signal frequency fMZI(t) multiple times under the same input of current to construct the database samples. Meanwhile, using the smooth L1 L SL 1 y ^ , y as the loss function, it is defined as follows:
L SL 1 y ^ , y = 1 M N a = 1 M b = 1 N y ˜ a , b y ˜ a , b = α 2 y ^ a , b y a , b 2 ,   if   y ^ a , b y a , b < α y ^ a , b y a , b α 2 ,   otherwise
where y ^ is the predicted value output from the NN model, and y is the true value. The parameter α is the coefficient of the loss function. Compared to other loss functions such as L1 and L2, the Smooth L1 loss function can more effectively reduce the sensitivity of neural networks to noise, thereby avoiding overfitting.
By constructing the NN, we actually have achieved a simulation model of the real physical system. In the training process of reinforcement learning (illustrated in Section 2.3.2), the modulation strategy made by the decision-making agent only needs to interact with this model, not the real system, so as to prevent the optical components from damage. In this way, using data-driven method effectively compensates for trial-and-error risks of conventional principle-based methods due to the incomplete prior knowledge.

2.3.2. SAC Agent Model

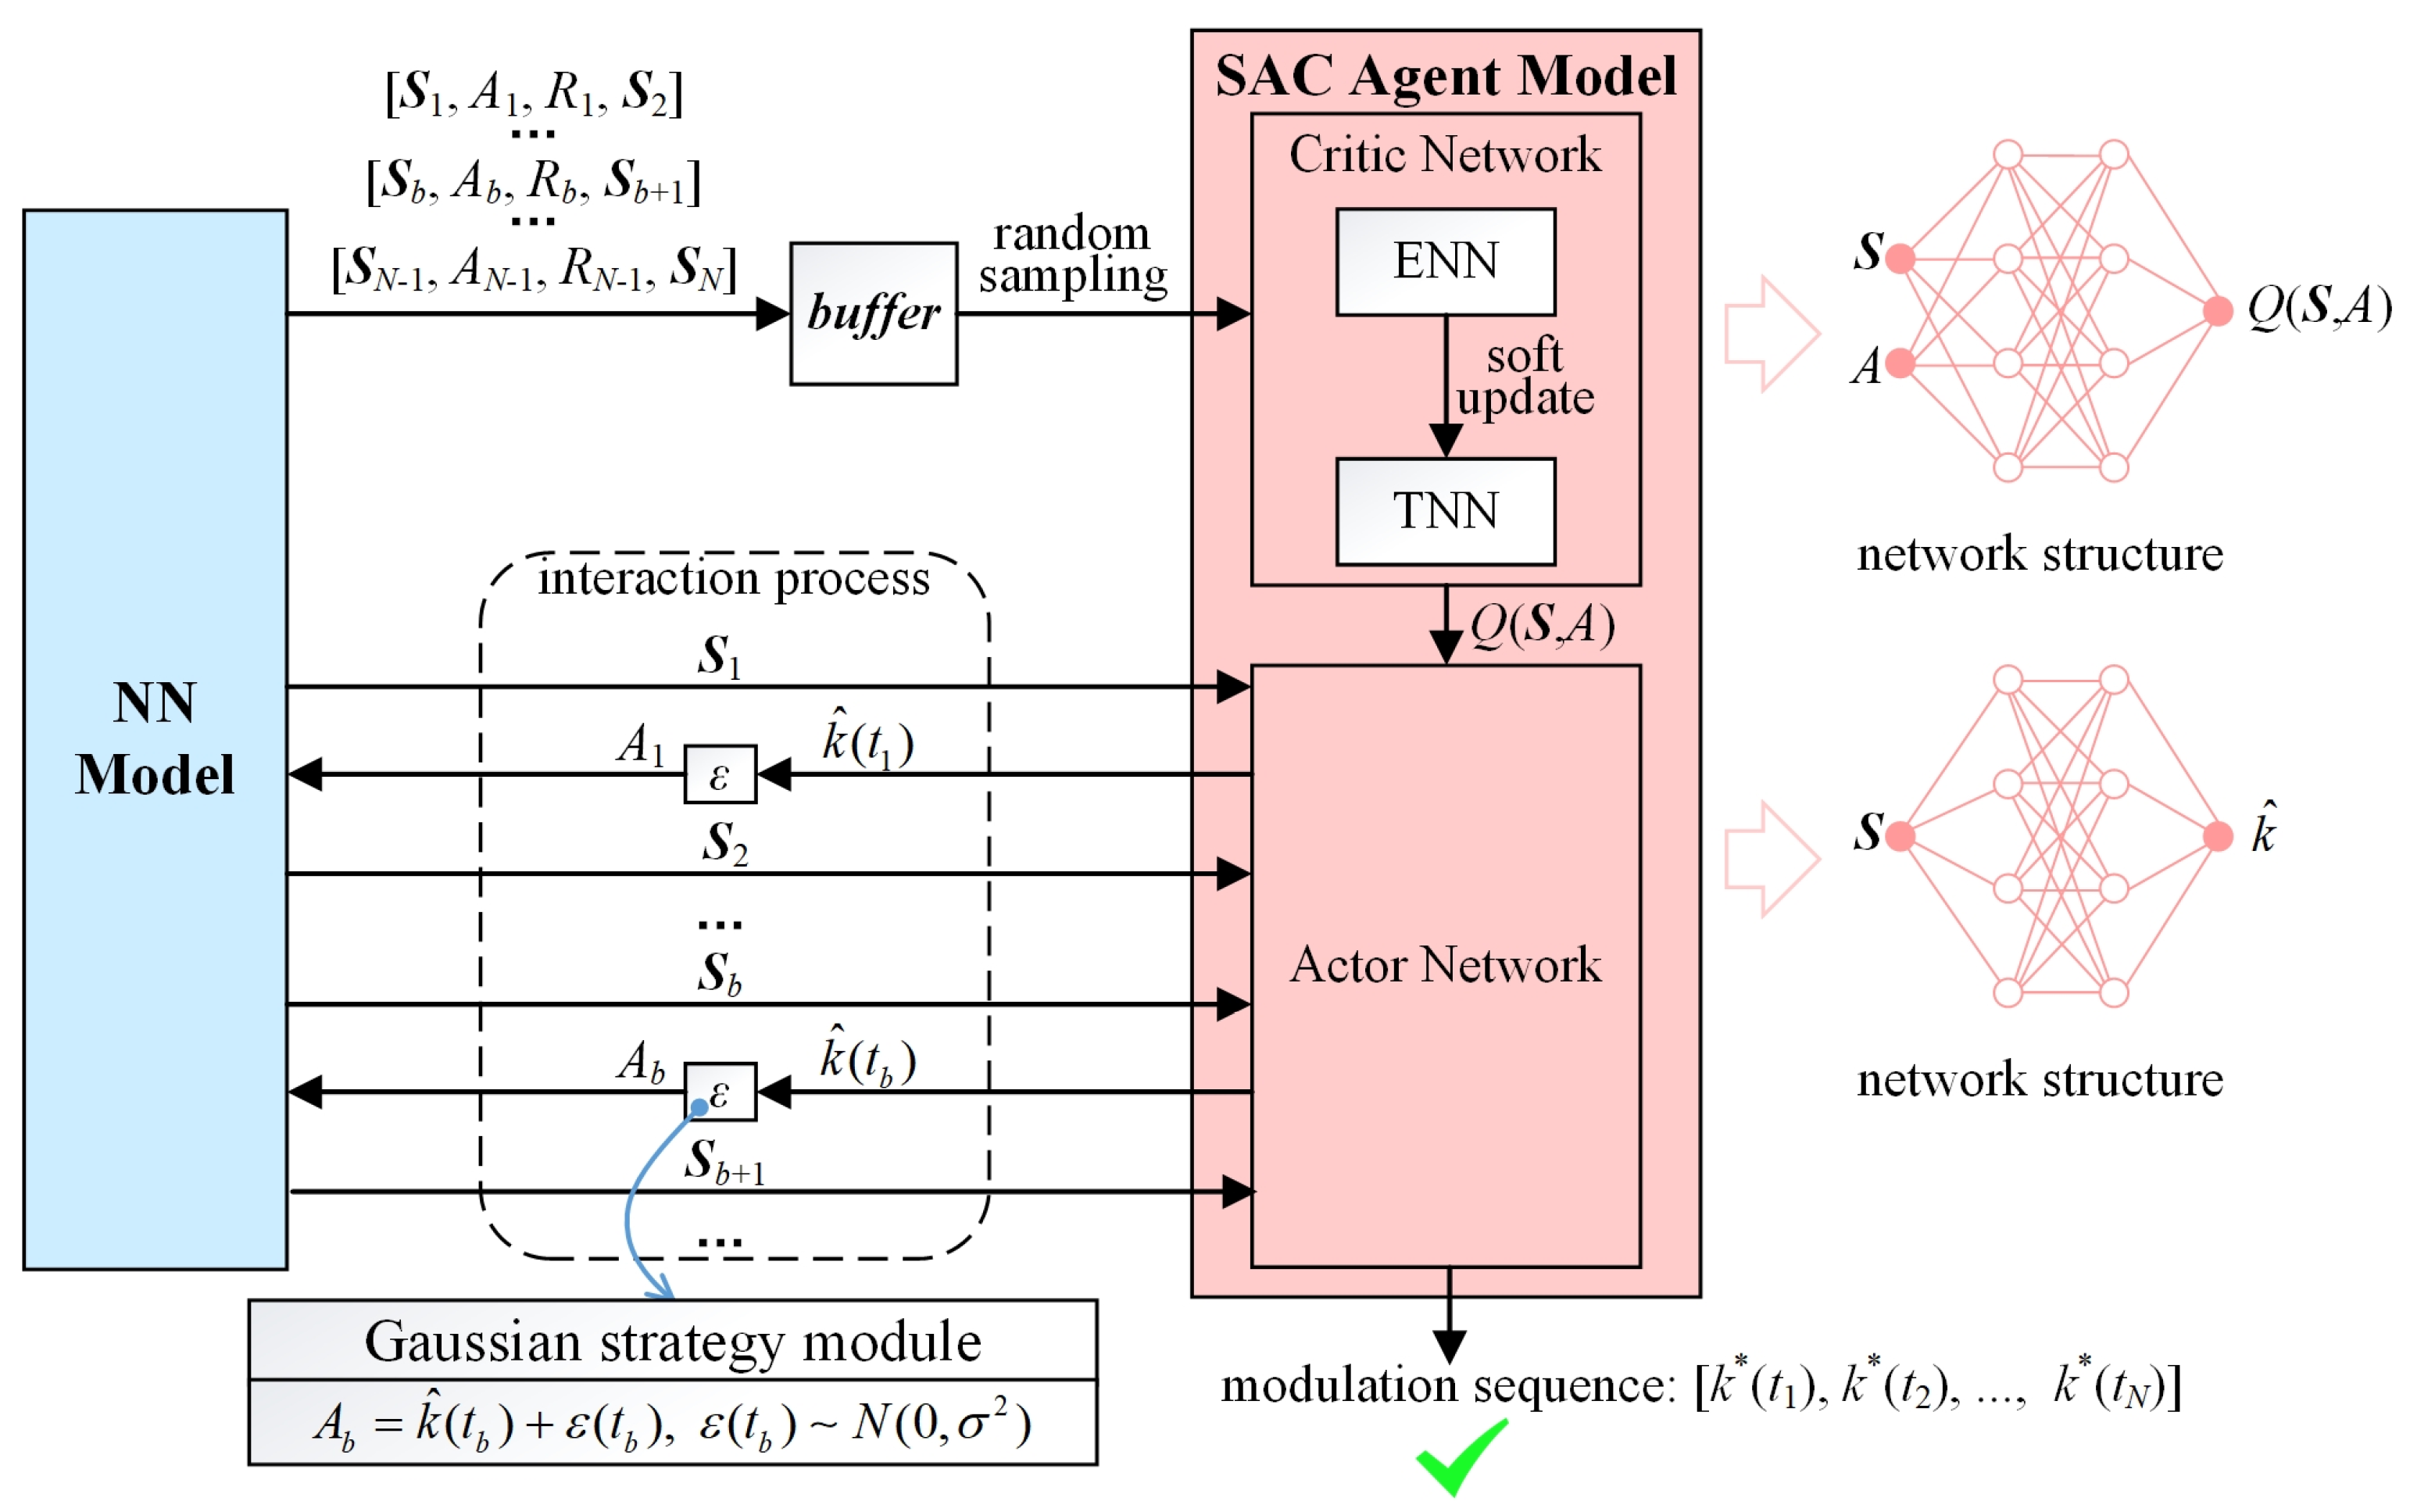
The SAC algorithm is used to train an agent to make intelligent modulation decisions. As shown in Figure 8, the agent consists of an actor network and a critic network. As the name suggests, the actor network makes decisions, while the critic network evaluates the impact of these decisions on the system state, prompting the actor network to make better decisions next time. Meanwhile, the critic network continuously improves in this process to make more accurate evaluations of the decisions. This process is like a theater actor refining their performance based on a critic’s feedback. The actor uses the feedback to enhance their craft and deliver a more captivating show. The critic evolves their evaluative skill over time too. And this evolution ensures that the critic’s assessment becomes increasingly objective and insightful.
In this work, the actor network interacts with the NN model. The NN model sends the virtual state Sb of a certain control point (take the b-th control point as an example) within the modulation period to the actor network, and then the actor network outputs a predicted modulation current slope k ^ t b , which adds a random noise ε(tb) through the Gaussian strategy module to generate an action Ab. Then, Ab is returned to make the NN model output a new state from Sb to Sb+1. The state Sb is defined as in the following equation:
S b = n o r m a l i z a t i o n i t b ,   f MZI t b ,   f MZI t b f MZI t b 1
where normalization(xb) = (xbxmin)/(xmaxxmin), and xmax and xmin represent the maximum and minimum values of the state parameters, respectively, during the modulation period T.
The random noise ε(tb) in the Gaussian strategy module follows a Gaussian distribution, i.e., ε(tb)~N(0,σ2). A higher variance σ2 indicates random actions with greater uncertainty. To balance the exploration–exploitation trade-off during training, this value is designed to decay progressively with the number of episodes.
The reward Rb is used to quantify the effect of Ab, defined as follows:
R b S b , A b = n o r m a l i z a t i o n f MZI ( t b + 1 ) f REF
It means that the closer the beat signal frequency fMZI(tb+1) (virtual) is to the ideal frequency fREF, the higher the reward. This is also consistent with the corresponding description as shown in Figure 2, where the closer the frequency of the beat signal is to a constant value, the higher the linearity of the frequency-swept light.
The objective of the optimization of the agent is to simultaneously maximize the expectation of reward and the entropy of the random strategy.
π * = argmax π j = b N E S j ~ B u f f e r E A j ~ π R j S j , A j β log π A j | S j
where π* denotes the target strategy, buffer denotes the replay buffer, E denotes the expectation, and E A j ~ π β log π A j | S j refers to the entropy of the random strategy π. Parameter β refers to the exploration coefficient, whose value undergoes self-adaptive dynamic adjustments aligned with training progression. The larger β is, the stronger the exploration ability of the training process, thereby avoiding falling into the local optima.
To train the critic and actor networks of the agent, samples are randomly selected from the reply buffer. The buffer is composed of many quadruples [Sb, Ab, Rb, Sb+1] generated by the interaction between the actor network and NN model. In the beginning, multiple sequences are generated through the continuous interaction and added to the buffer until a certain buffer size is reached. Then, the training process begins, and the actor network updated in the present epoch and the NN model interact again to generate a new quadruple sequence {[S1, A1, R1, S2], [S2, A2, R2, S3], …, [SN, AN, RN, SN+1]}. Then, these N quadruples in this sequence are added to the buffer. Meanwhile, N quadruples are randomly removed from the buffer. Then, a new epoch of training begins, and the process repeats continuously. Thus, we adopt a replay caching mechanism with updates to make the agent can learn from historical experience.
The critic network is designed to evaluate the effectiveness of the present strategy, consisting of the evaluate neural network (ENN) and target neural network (TNN). The loss function LCN(θENN, θTNN) of the critic network is defined as follows:
L CN θ ENN , θ TNN = E Q S b , A b | θ ENN Q * S b , A b | θ TNN Q S b , A b = E j = b N γ j R j | S b , A b Q * S b , A b = E R b S b , A b + γ b max A b + 1 Q * S b + 1 , A b + 1
where θENN and θTNN represent the parameters of ENN and TNN, respectively. The optimization goal of the critic network is to converge the error between these two networks. Q(Sb, Ab) represents the state-action value function, which is used to characterize the cumulative reward from present (the b-th control point) until the end of the modulation period (the N-th control point) under the present state Sb and action Ab. Q* (Sb, Ab) represents the target value function. The parameter γ represents the discount factor, whose value is set to be less than one. This design ensures that future control points located farther from the current control point exhibit progressively diminished contributions to the assessment of the current state-action value. The soft update of TNN is defined as follows:
θ TNN Γ θ ENN + 1 Γ θ TNN
where Γ denotes the update step size. The implementation of the TNN network enhances the stability of the optimization process and prevents the critic network from diverging.
Therefore, by training the critic network, an accurate evaluation mechanism for the effectiveness of the modulation strategy is obtained.
As for the actor network, it is used to optimize the modulation strategy π and its loss function is defined as in the following equation:
L AN θ AN = E S b ~ b u f f e r , A b ~ π Q S b , A b β log π A b | S b
where E S b ~ b u f f e r , A b ~ π β log π A b | S b denotes the entropy of the strategy π.
The network structures of the critic network (including ENN and TNN) and the actor network consist of an input layer, two hidden layers, and one output layer. After their training process, the agent can determine the sequence of the optimized modulation current slope [k*(t1), k*(t2), …, k*(tN)] from strategy π*, which corresponds to N control points within a single modulation period T. The SAC algorithm combines the mechanisms of maximizing the expectation of reward and random entropy to explore modulation possibilities, fully simulating the diversity and randomness of the nonlinearity correction process and hence improving the robustness of the modulation under strong uncertainty. Finally, based on the modulation current slope sequence, the generated modulation current is fed into the frequency-swept laser as the pre-corrected part for the EO-PLL.

3. Results

We built the measurement system according to Figure 3. A distributed feedback laser source with a central wavelength of 1550 nm was chosen. The frequency-swept signal had a sawtooth waveform with a modulation period of 1 ms and a frequency excursion of 55.8 GHz. Additionally, the main hyperparameters for the NN-SAC model training in this work are listed in Table 1. The determination of learning rate critically influences model performance. Excessively large learning rates may induce significant oscillations during convergence and even cause divergence, while overly small rates result in slow convergence efficiency and carry risks of falling into local optima.
Under this experimental setup, the frequency-swept characteristics and the laser ranging experiment are investigated separately.

3.1. Frequency-Swept Characteristic Analysis Experiment

To verify the effectiveness of the proposed method under different bandwidth settings of the DLF for the EO-PLL (denoted as ΔWDLF), we design the controlled experiments of four nonlinearity correction mechanisms, including “without control”, “only EO-PLL”, “iteration + EO-PLL”, and “NN-SAC + EO-PLL” (proposed in this manuscript). The so-called “without control” refers to the frequency-swept light generating the beat signal sMZI(t) directly through the MZI in the correction subsystem (Figure 3) without any correction processing. “Only EO-PLL” refers to introducing EO-PLL as the main correction without any pre-correction. “Iteration + EO-PLL” refers to performing pre-correction based on an iteration algorithm before the EO-PLL control, which is a typical principle-based, two-stage nonlinear correction [19]. And “NN-SAC + EO-PLL” is the method we proposed in this work. Specifically, the agent trained by the NN-SAC mechanism generates the modulation current to drive the frequency-swept laser to eliminate the laser’s nonlinearity by continuously adjusting the modulation current slope during each modulation period. After this pre-correction process, the online EO-PLL control begins. When the phase locking process is completed, the final beat frequency signal sMZI(t) undergoing the above two-stage correction is generated.
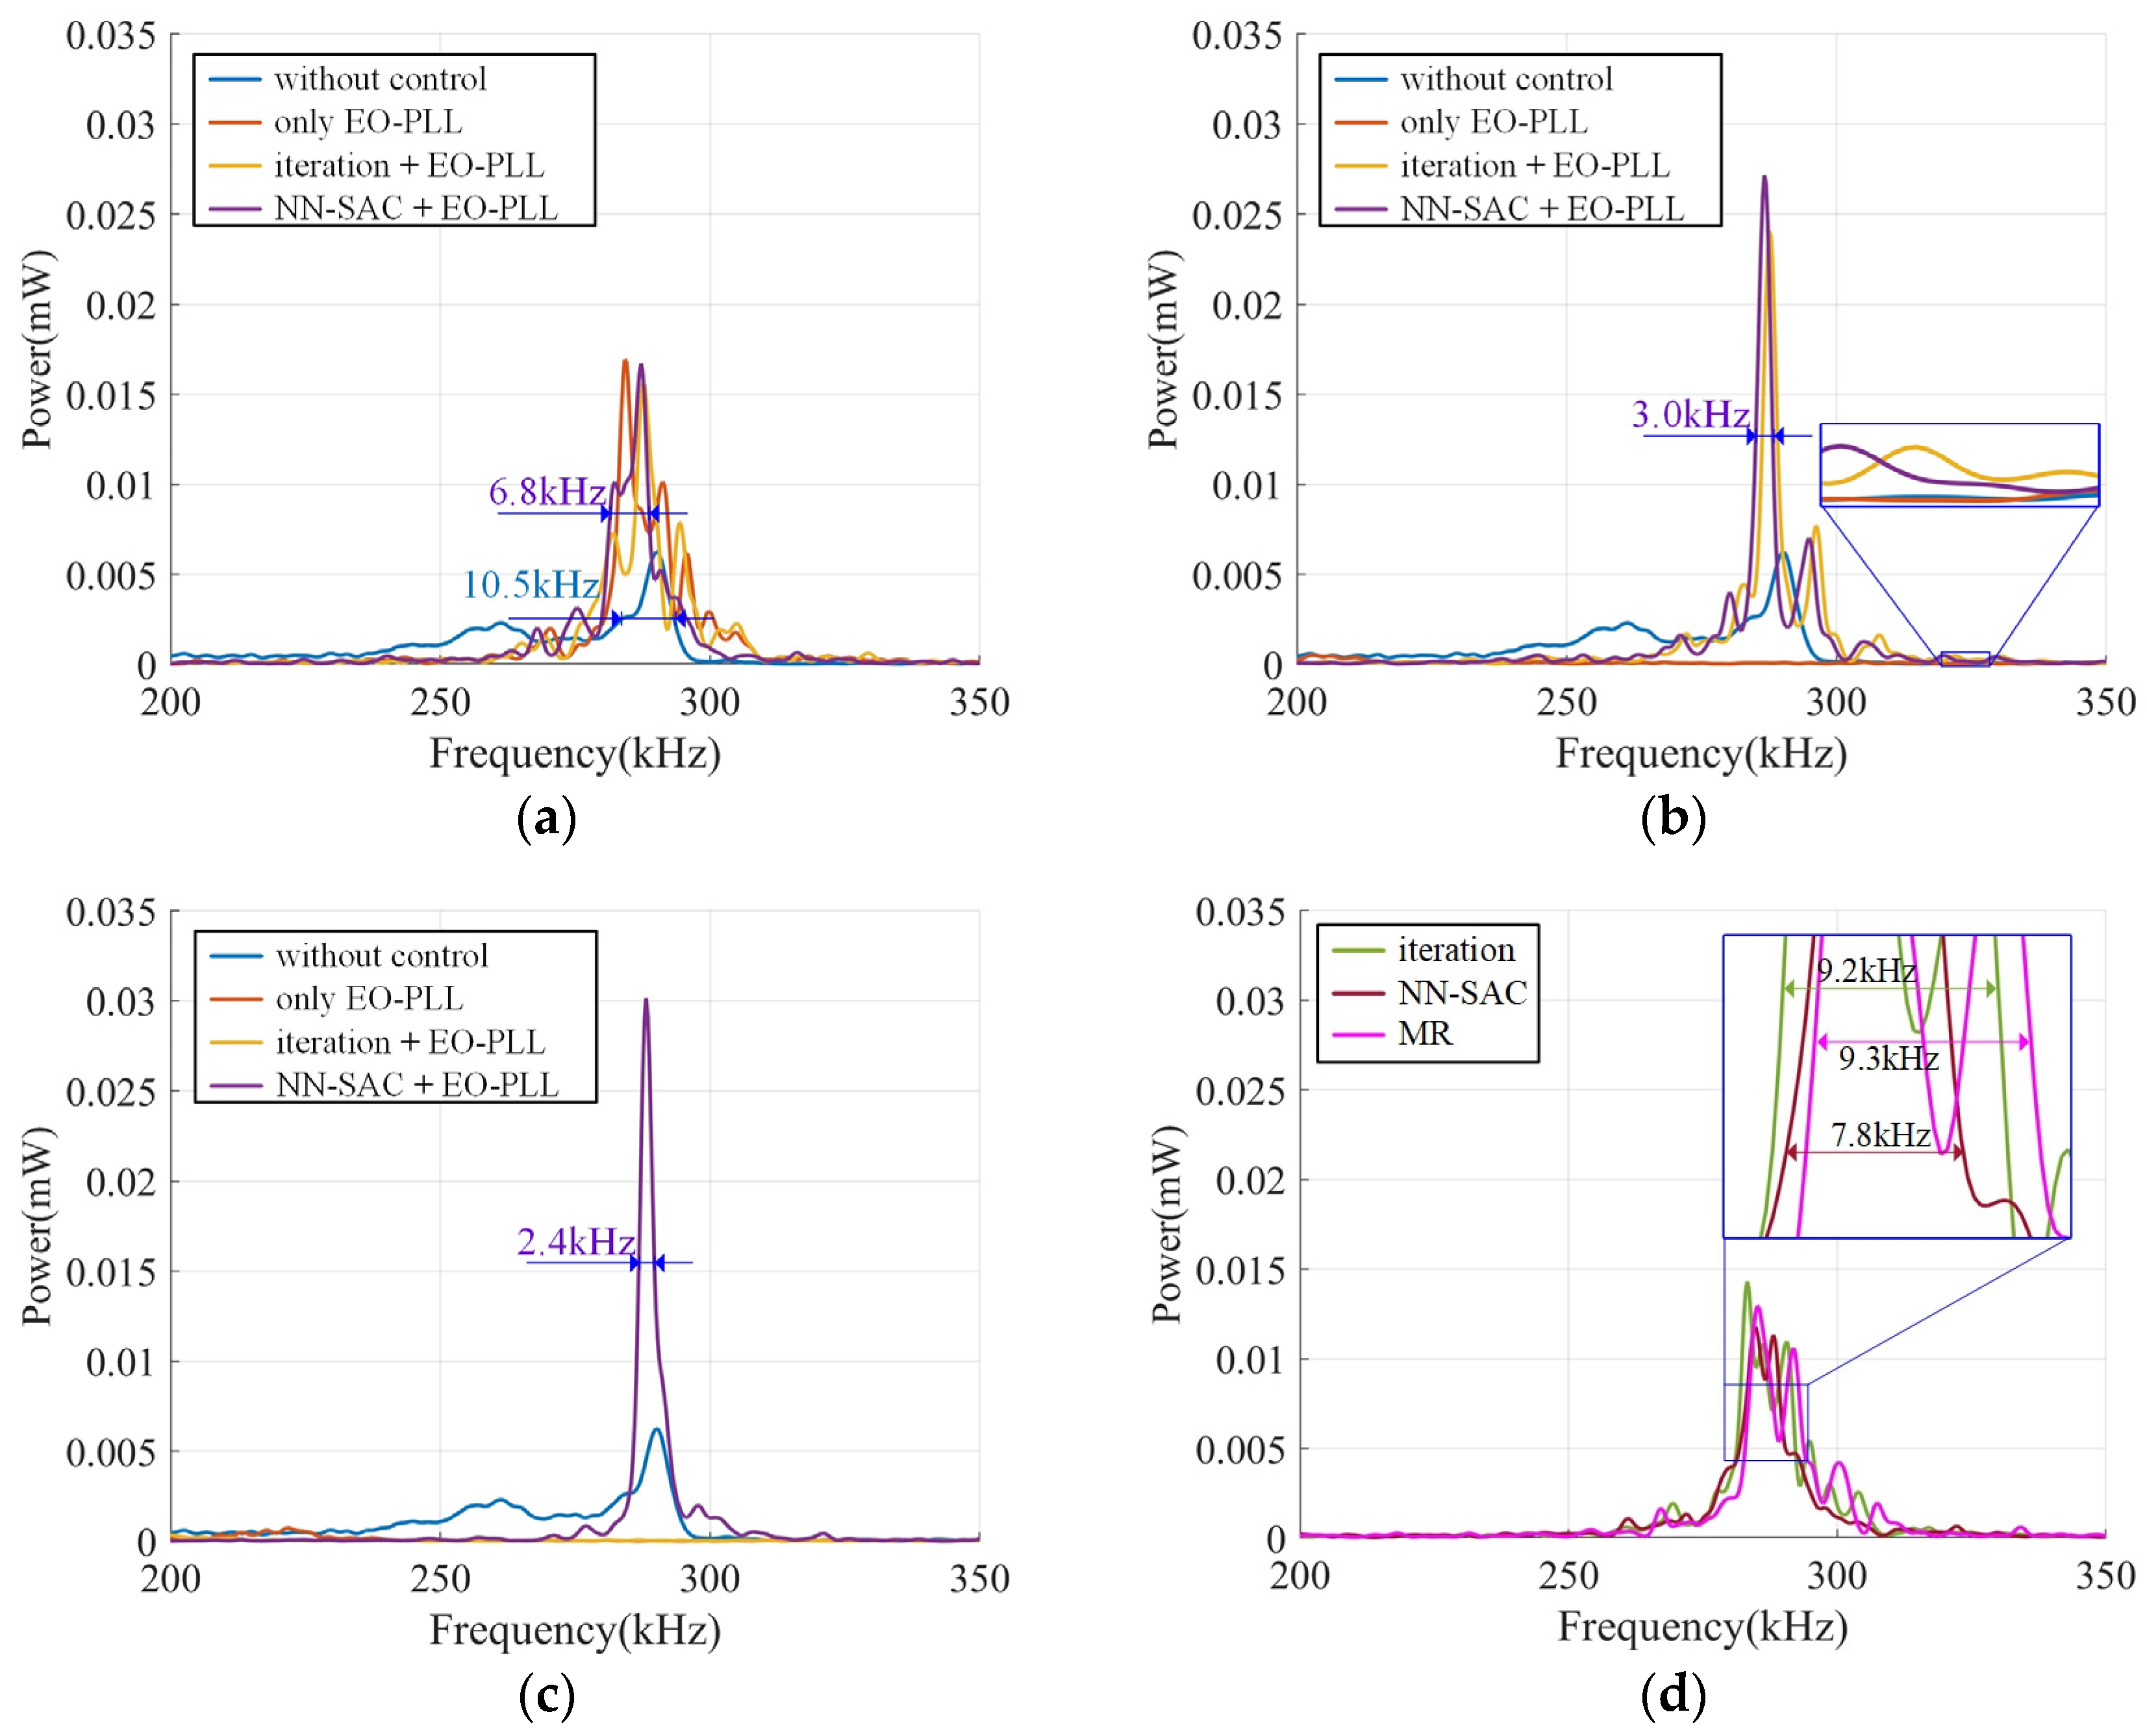
Figure 9 shows the power spectrum comparison of the beat signal sMZI(t) under different ΔWDLF settings. As shown in Figure 9a, when ΔWDLF is set to 30 kHz, the spectral peaks corresponding to “only EO-PLL”, “iteration + EO-PLL”, and “NN-SAC + EO-PLL” are roughly similar. It can be seen that the corresponding Full Width at Half Maxima (FWHM) in these three cases are approximately 6.8 kHz, which is significantly narrower than the “without control” mechanism (10.5 kHz). As shown in Figure 2, the sharpness of the spectral peak is directly related to the linearity of the frequency-swept light, and a smaller FWHM corresponds to a higher linearity, which can achieve a higher ranging precision. Furthermore, compared to the case of “without control”, the other three mechanisms have higher spectral peaks and lower sidelobes, which facilitate the extraction of ranging information. The spectrum comparison in Figure 9a indicates that the EO-PLL control has a significant effect on linearizing the frequency nonlinearity of the frequency-swept light. Due to the large ΔWDLF set, there is no need for pre-correction processing, and the phase-locked loop can achieve phase locking. As shown in Figure 9b, when ΔWDLF is set to 25 kHz, the FWHM corresponding to “iteration + EO-PLL” and “NN-SAC + EO-PLL” roughly overlap, while the “only EO-PLL” method has completely failed and there are no obvious spectral peaks (see the red curve in the zoom view of Figure 9b). Moreover, the FWHM (approx. 3.0 kHz) of “iteration + EO-PLL” and “NN-SAC + EO-PLL” is also significantly narrower than those in Figure 9a. Therefore, this spectrum comparison in Figure 9b indicates that in the narrower ΔWDLF of 25 kHz, the pre-correction (iterative control or NN-SAC) plays a key role in ensuring the effectiveness of the EO-PLL. More specifically, the pre-correction processing reduces the frequency nonlinearity of the frequency-swept light to some extent, thereby allowing the time-to-digital conversion signal sTDC in the initial cycle of EO-PLL to fall within the narrower bandwidth ΔWDLF of the DLF. The narrowing ΔWDLF improves the locking accuracy by shielding more noises. Figure 9c shows the spectrum comparison with further narrowing of the ΔWDLF setting (20 kHz). It can be seen that the spectral peak of “NN-SAC + EO-PLL” is quite sharp, which is narrower and taller than that in Figure 9b, and the FWHM is 2.4 kHz. While “iterative control + EO-PLL” and “only EO-PLL” have completely failed and there are no obvious spectral peaks. This indicates that only the proposed “NN-SAC + EO-PLL” mechanism is effective at the ΔWDLF setting of 20 kHz. Figure 9d shows a comparison of implementing only the iterative control, only the proposed NN-SAC pre-correction, and only the Mapping Relation (MR) pre-correction separately, without implementing the EO-PLL main correction. The MR method [24] is also based on reinforcement learning, but it does not incorporate the maximum entropy strategy like the SAC model proposed in this work. Their corresponding FWHM are 9.2 kHz, 7.8 kHz and 9.3 kHz, which indicates that the proposed NN-SAC method is superior in nonlinearity pre-correction. Therefore, the proposed NN-SAC pre-correction method obtains a narrower bandwidth ΔWDLF of DLF, resulting in higher locking accuracy for EO-PLL.
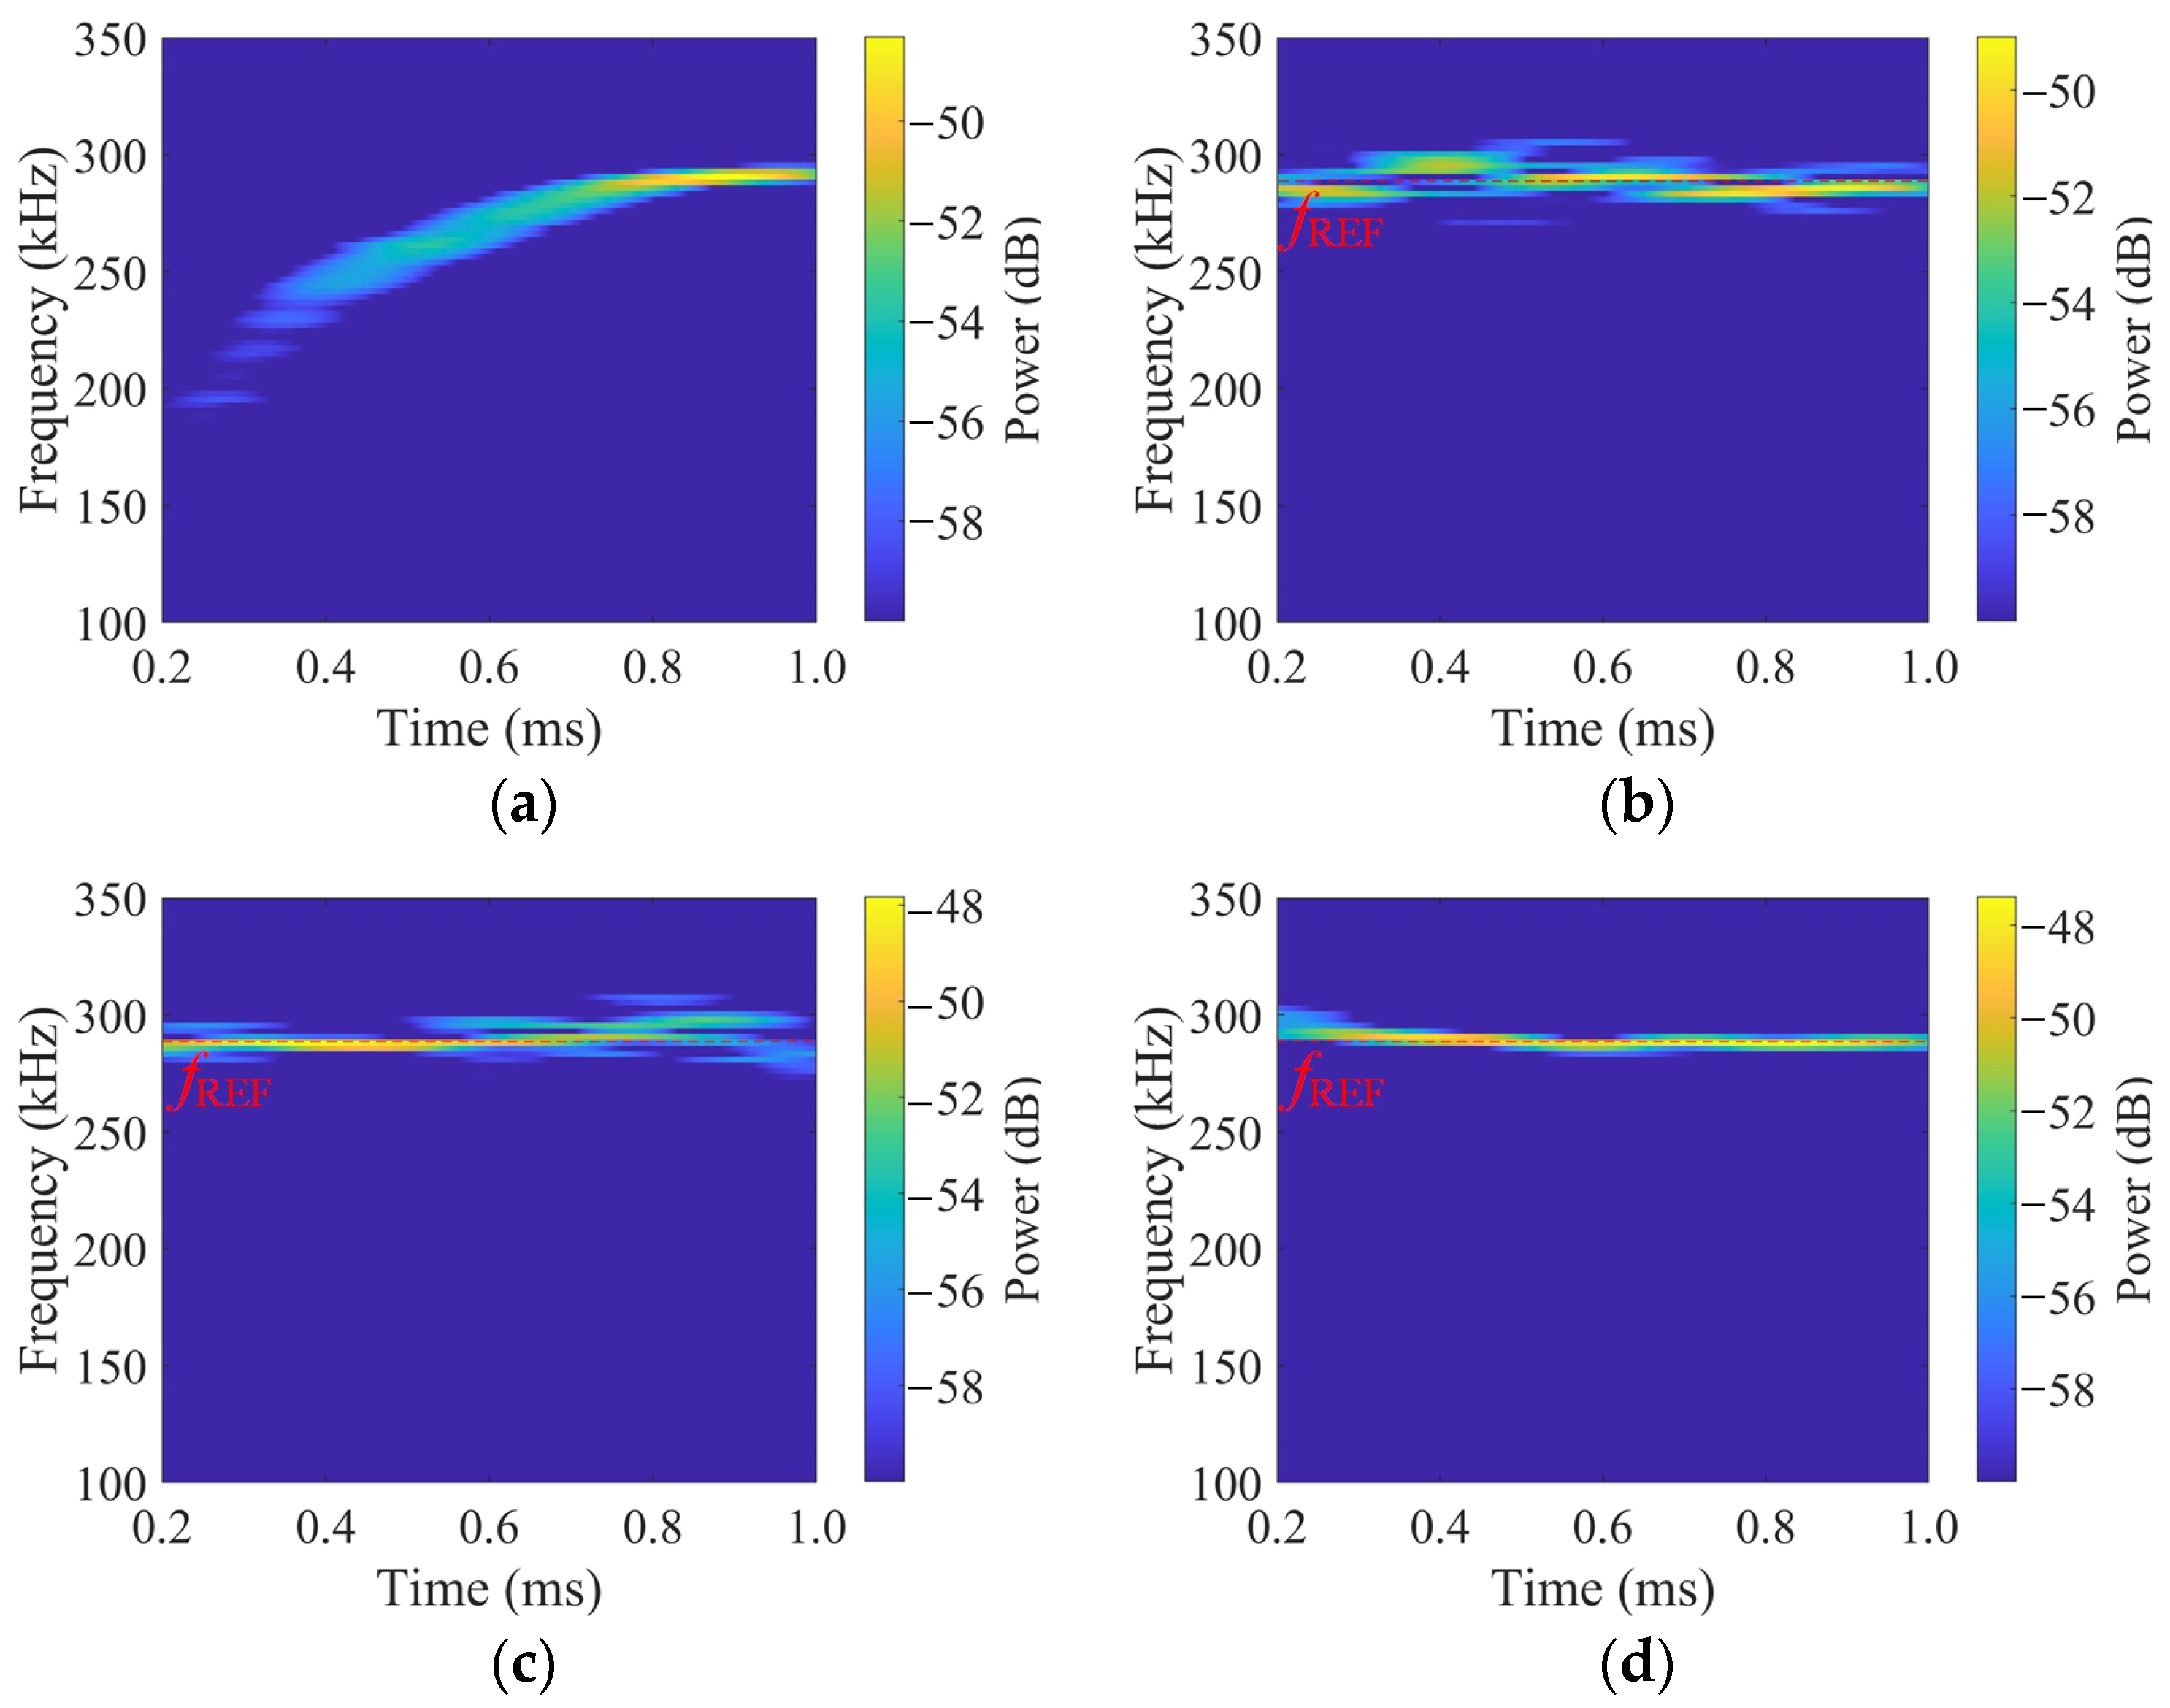
As shown in Figure 10, in terms of time stability, we sequentially perform Short-Time Fourier Transform (STFT) [25] on the beat signals sMZI(t) corresponding to “without control”, “only EO-PLL” (under ΔWDLF = 30 kHz), “iterative control + EO-PLL” (under ΔWDLF = 25 kHz), and “NN-SAC + EO-PLL” (under ΔWDLF = 20 kHz), obtaining the frequency vs. time curves of the beat signals within a single modulation period T. In this figure, the more energy is concentrated on the frequency fREF of the preset reference signal for EO-PLL, the higher the time stability and the linearity of the frequency-swept light. It can be intuitively seen from Figure 10, under the valid DLF bandwidth ΔWDLF settings (ensuring EO-PLL can achieve phase locking), the frequency-time stability is ranked from poor to excellent in the following order: “without control”, “only EO-PLL”, “iteration + EO-PLL”, and “NN-SAC + EO-PLL”. The following conclusions can be drawn: (1) Compared to “without control”, introducing EO-PLL improves the frequency-time and ranging stability of the beat signal, which means that the signal energy fluctuation decreases in each modulation period. (2) The proposed “NN-SAC + EO-PLL” two-stage correction mechanism demonstrates superior time-frequency stability compared to other correction methods. This advantage stems from its capability to achieve a stable frequency by locking under a significantly narrower DLF bandwidth. Specifically, the beat signal frequency fMZI(t) remains stable tightly around the reference frequency fREF throughout each modulation period T.
We also analyze the frequency linearity of the frequency-swept light quantitatively. By performing the Hilbert transform on sMZI(t) to obtain the phase, the frequency of the frequency-swept light can be determined. Figure 11 shows the linearity under four correction mechanisms, where the red curve represents the frequency variation of the frequency-swept light within a single modulation period T, and the blue curve represents the difference between the actual frequency and the absolute ideal linear frequency, i.e., the residual error. The root mean squared errors fRMSE and f1−r2 directly reflect the frequency linearity of the frequency-swept light. The smaller they are, the higher the linearity. The two terms are determined by the following:
f RMSE = 1 N j = 1 N f SWEEP t j f SWEEP IDEAL t j 2 f 1 r 2 = 12 f RMSE / B 2
where N refers to the number of sampling points within a single modulation period. The parameter fSWEEP(tj) refers to the actual frequency of the frequency-swept light corresponding to the j-th sampling point, while f SWEEP IDEAL t j refers to the frequency of the case of ideal linearity. The parameter B is the frequency excursion of the frequency-swept light. Figure 11 shows that the values of fRMSE are 1577.8 MHz, 174.2 MHz, 133.5 MHz, and 52.9 MHz, respectively. Meanwhile, the values of f1−r2 are 9.5944 × 10⁻³, 1.1695 × 10⁻⁴, 6.8687 × 10⁻⁵, and 1.0785 × 10⁻⁵, respectively. It can be seen that under the narrowest DLF bandwidth, the two-stage correction method based on NN-SAC + EO-PLL greatly suppresses the nonlinearity of frequency sweeping, leaving only 0.0948% of the nonlinearity ε which is calculated using the following equation:
ε = f RMSE / B
We also conducted a stability evaluation. Through over 20 repeated tests in combination with NN-SAC pre-correction, EO-PLL consistently achieved phase locking under the ΔWDLF setting of 20 kHz. During more than 5 h of observation, fRMSE remained within the range of 45.2 MHz to 79.8 MHz. These results demonstrate that the NN-SAC + EO-PLL can maintain stable linearity of the swept-frequency light during long-term operation.
To validate the hardware generalization capability of the proposed intelligent pre-correction strategy generation method (SAC model), we conduct comparative tests involving hardware replacements, as detailed in Table 2. From left to right, the table presents the fRMSE and f1−r2 (see Equation (16)) for frequency-swept light under the following four scenarios:
Scenario 1: NN-SAC pre-correction applied to the original system;
Scenario 2: FPGA and laser replaced (with identical models) in the original measurement system, with no correction applied;
Scenario 3: NN-SAC pre-correction strategy (derived from the original system) applied to the hardware-replaced system;
Scenario 4: NN-SAC models retrained on the hardware-replaced system, generating a new pre-correction modulation strategy.
The results demonstrate that Scenario 3 significantly improves linearity compared to Scenario 2, although it still falls short of Scenario 4. This indicates that while the NN-SAC method exhibits certain effectiveness and stability across different components of the same model, performance degradation occurs when applying the pre-correction strategy directly to the substitute laser. This occurs because the NN model is trained based on the specific properties of an individual laser, while inherent property variations exist among different lasers, even those sharing identical specifications.
Notably, when the SAC agent trained on the original system interacts with the NN model trained on the hardware-replaced system, the model achieves convergence in approximately 40% of the epochs typically required for complete retraining. This efficiency further underscores the hardware generalization capability of the proposed NN-SAC method.

3.2. Ranging Experiment

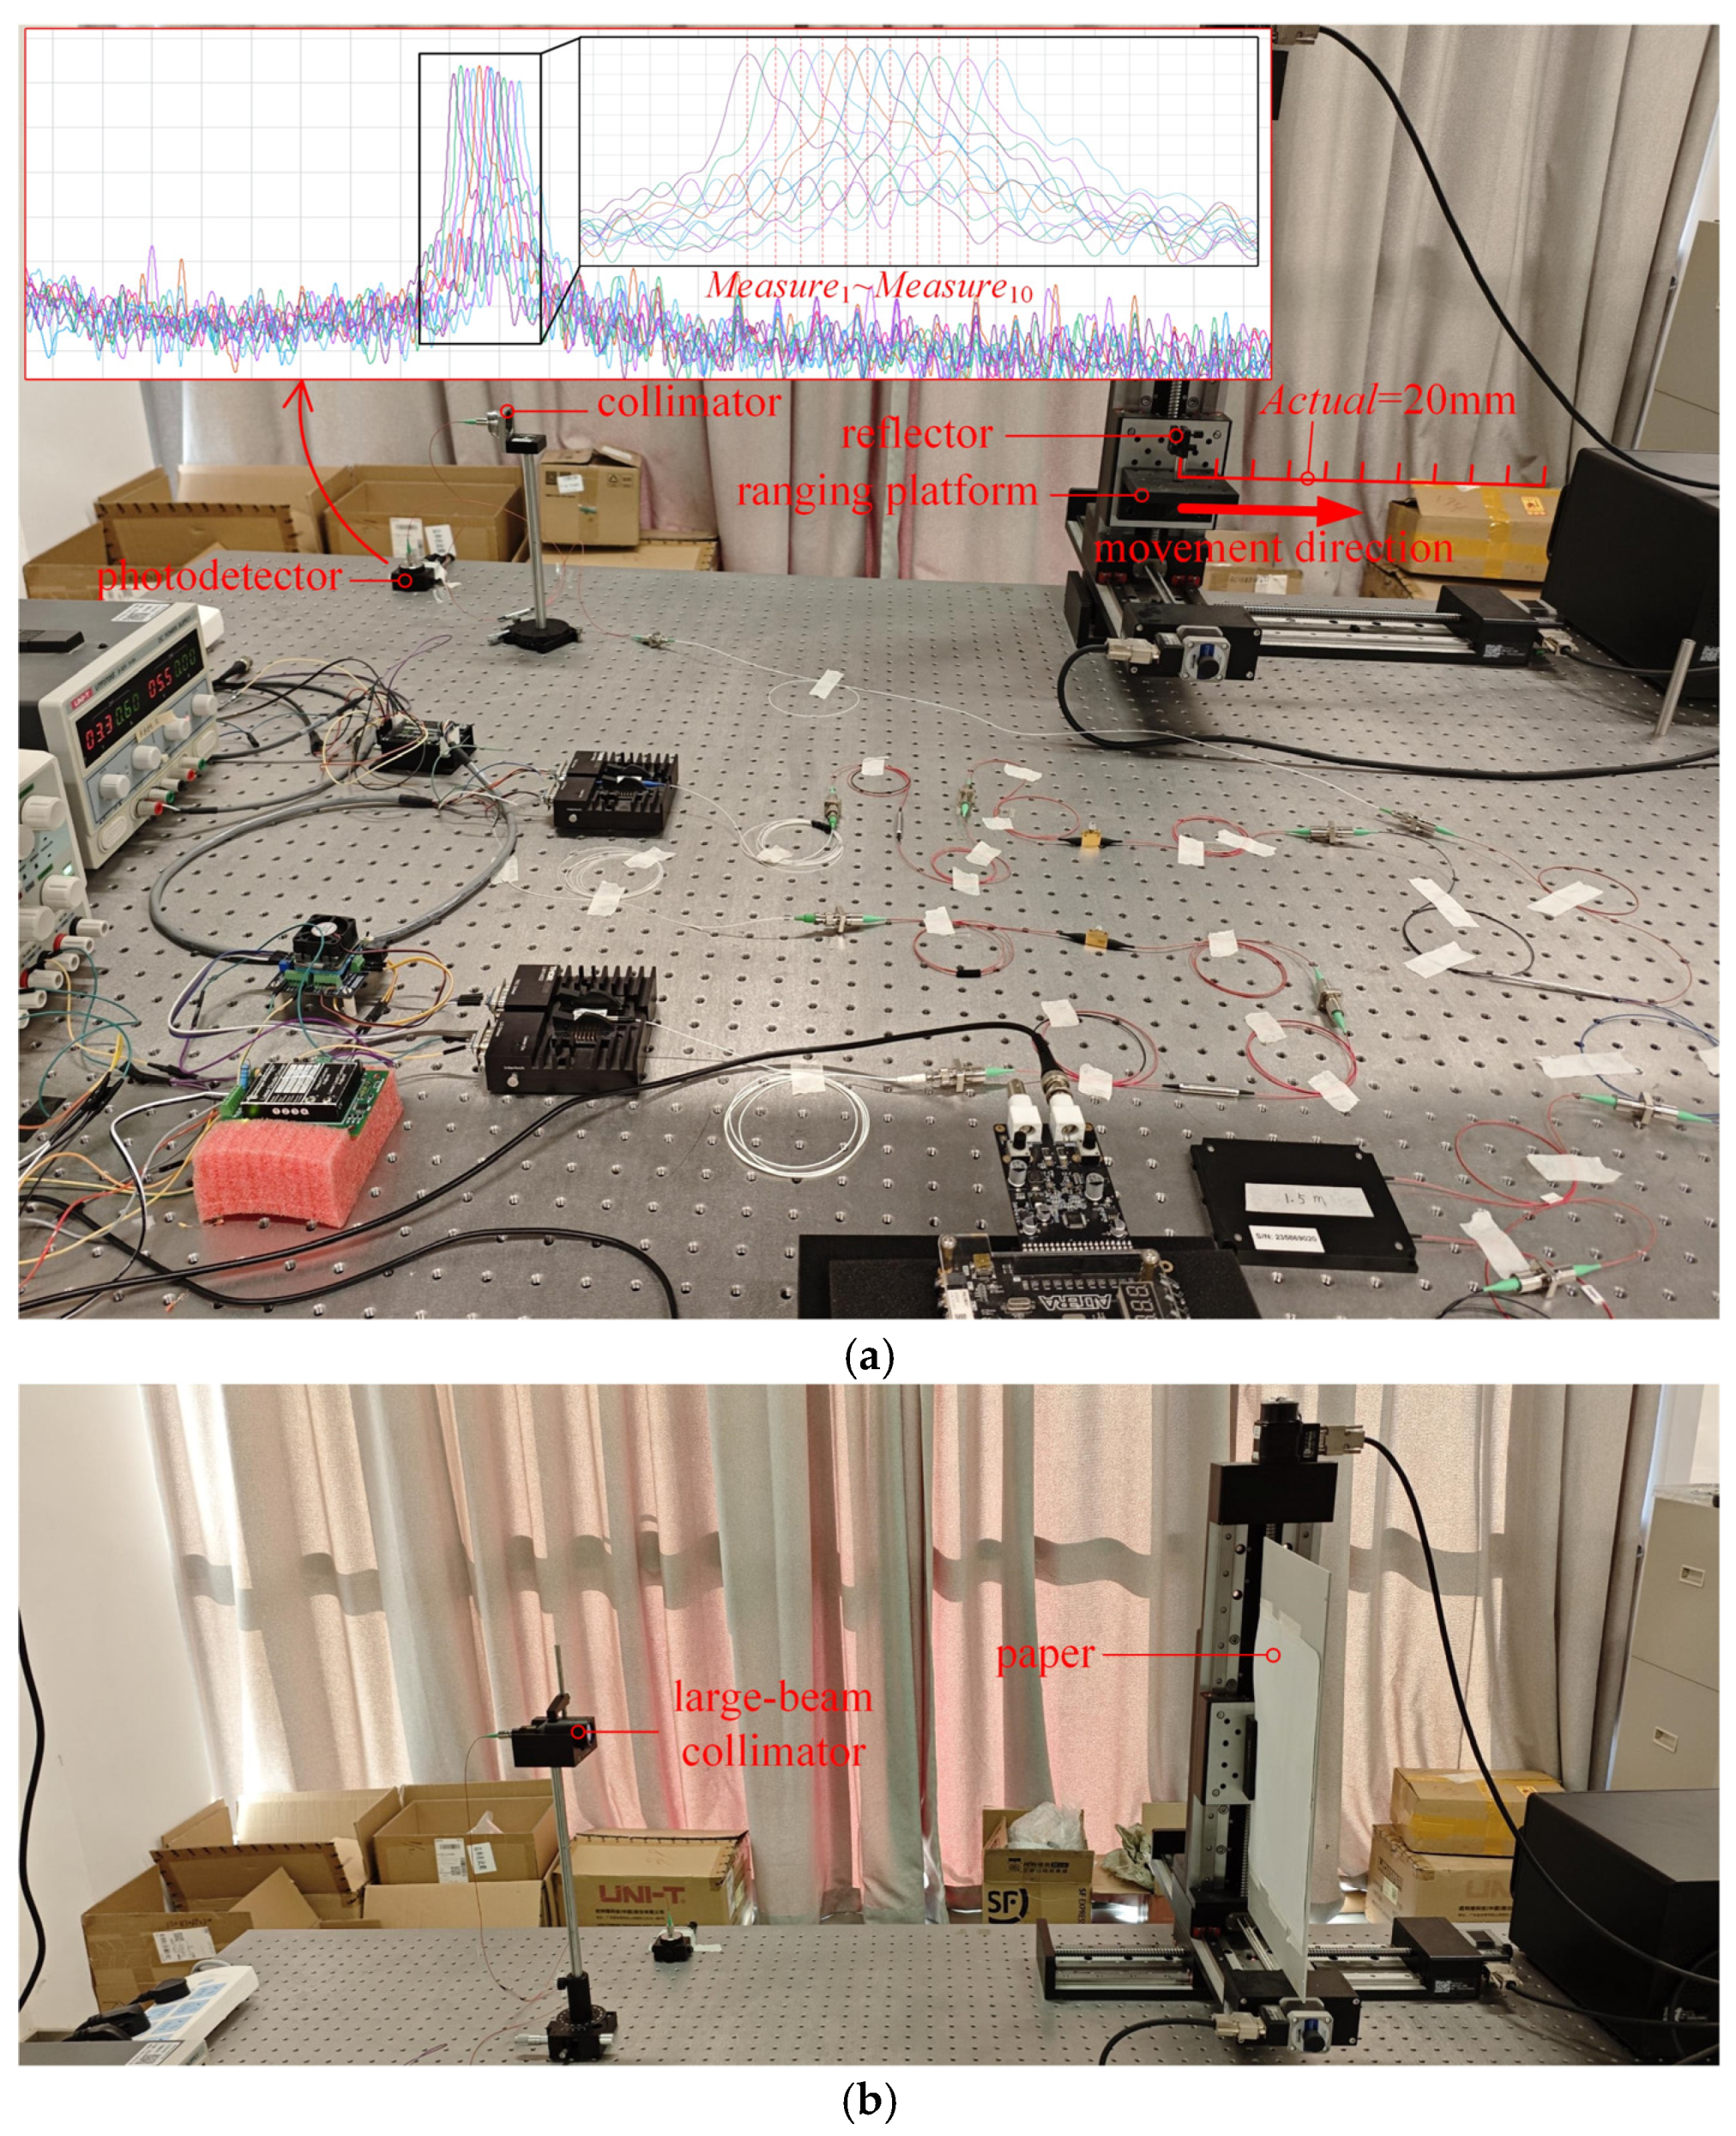
To verify the actual ranging effect, we built the laser ranging experimental setup. As shown in Figure 12a, the swept light (probe light) emits through a collimator, and a reflector is placed on the ranging platform as the measured target. The frequency corresponding to the spectral peak point is taken as the frequency f of the beat signal, and f is substituted into Equation (2) to determine the distance d. In this experiment, the ranging error is calculated based on the relative distance. The ranging platform executes 10 sequential 20 mm steps away from the collimator, starting from an initial reflector distance of 680 mm. Thanks to the platform’s high positioning accuracy (displacement error < 0.5 μm), the 20 mm step size serves as the ground-truth reference value (denoted as Actual). The distance change obtained by Equation (2) before and after each displacement is taken as the measured values of relative distance (denoted as Measuredi). Then, the ranging error Ei is as follows:
E i = M e a s u r e i A c t u a l
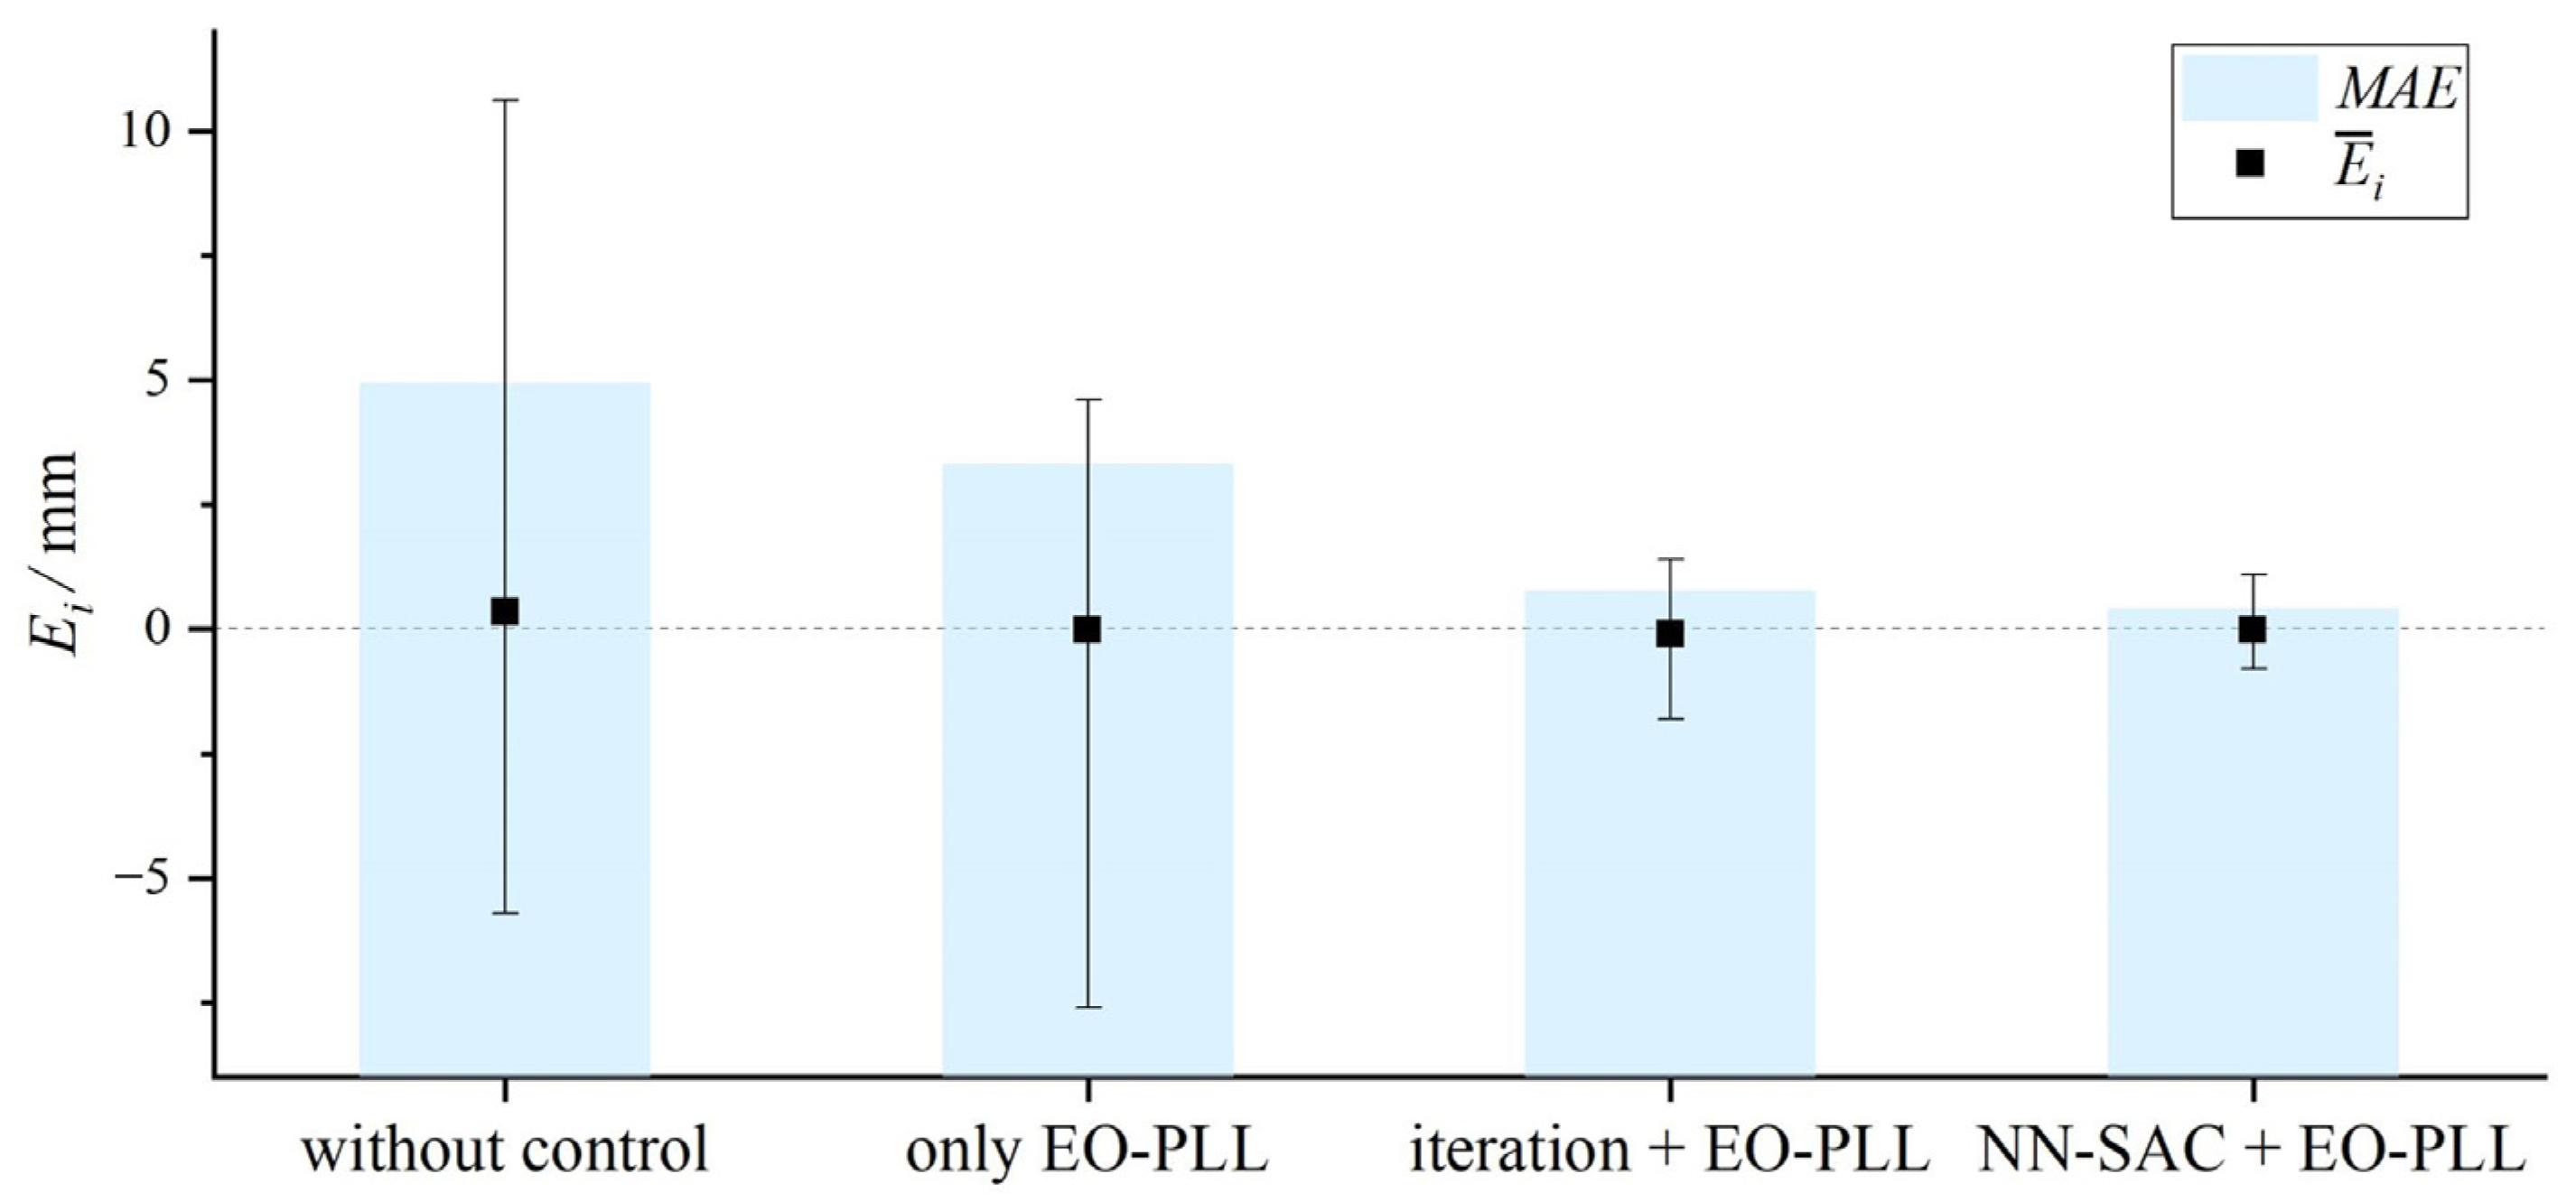
We strictly control the experimental variables by considering only the four mechanisms as our variables, while keeping all the other experimental conditions unchanged. The ranging results are shown in Figure 13. Our proposed NN-SAC + EO-PLL two-stage nonlinearity correction mechanism has the smallest Mean Absolute Error (MAE) and error range compared to the other three mechanisms. The measurement results are quantified further by using maximum error (Emax), MAE, and Root Mean Squared Error (RMSE), which are defined as follows:
E max = max i = 1 ~ n E i M A E = 1 n i = 1 n M e a s u r e i A c t u a l R M S E = 1 n i = 1 n ( M e a s u r e i A c t u a l ) 2
where n denotes the number of tests, corresponding to the 10 displacements in this experiment. As shown in Table 3, “NN-SAC + EO-PLL” has the smallest Emax, MAE, and RMSE values, indicating that our proposed method reaches the highest ranging precision, repeatability, and stability.
Furthermore, in addition to the specular reflection experiment shown in Figure 12a, we conducted a diffuse reflection experiment using white paper as the measured target (Figure 12b), which better aligns with real-world applications, with the measurement results presented in Table 4.
In the diffuse reflection experiment, the reflected light quality exhibits significant degradation compared to the specular reflection experiment due to reduced beam focusing capability and diminished reflection intensity. This deterioration prevents the direct identification of spectral peak points in the power spectrum, requiring weak signal extraction methods for detection. As shown in the table, while the diffuse reflection experiment results demonstrate marked performance degradation relative to the specular reflection experiment, the proposed NN-SAC + EO-PLL method achieves higher ranging precision than the traditional resampling method.

4. Discussion

We presented a two-stage nonlinearity correction mechanism for FMCW frequency-swept light, combining data-driven and principle-based methods. In this mechanism, EO-PLL (principle-based) was employed for the main correction process, while NN-SAC (data-driven) was developed for the pre-correction process, enabling effective EO-PLL control under a setting with a narrower bandwidth of the DLF. In the NN-SAC pre-correction process, the NN model was capable of effectively simulating the intricate mapping relationships between the inputs and outputs of the real physical system. In terms of the SAC model, we trained an agent to provide the modulation strategies by concurrently optimizing both the strategy and the accuracy of its corresponding evaluations. The experimental results demonstrated that the proposed NN-SAC + EO-PLL mechanism achieved frequency locking at a narrower DLF bandwidth, improving the linearity of the frequency-swept light and enhancing ranging precision. Compared to conventional methods, the pre-correction modulation strategy no longer requires a specialized design based on the hardware characteristics. Instead, it can be obtained through the proposed data-driven mechanism automatically. This enables a convenient and efficient solution to the complex laser modulation challenges because it eliminates the need for prior knowledge and extensive hardware tuning. Additionally, the primary objective of integrating the NN model with the SAC model is to fully leverage the potential of data-driven approaches, thereby enabling the exploration of broader possibilities to determine more effective modulation strategies. Specifically, the SAC model promotes extensive and radical exploration by maximizing the entropy of random strategies, while the constructed NN model protects the real system from the trial-and-error risks during the intelligent modulation strategy training process. This approach also prevents the training from becoming trapped in local optima and is suitable for the nonlinearity correction process, which inherently involves diversity and randomness. Our excellent experimental results show the effective opto-electronic control of our proposed method and demonstrates that this method is not only applicable to nonlinearity correction but also adaptable to similar optoelectronic control systems.
In practical ranging scenarios, the applicability of the proposed method may face significant challenges due to factors such as reduced beam focusing capability, diminished intensity of reflected light from the target, as well as attenuation and interference in the probe light. Therefore, in addition to the approach mentioned in this paper, which involves training the NN-SAC model using samples constructed from the MZI beat frequency signals of the correction subsystem (internal interaction), we also plan to introduce external interaction in subsequent research. Specifically, we will construct datasets using beat frequency signals obtained by detecting real targets, thereby enhancing the adaptability of the NN-SAC model in complex environments during practical ranging. Moreover, we will continue to refine and streamline both the networks and training regimen to enhance the operational viability of the proposed NN-SAC precorrection method.

Author Contributions

Conceptualization, G.Y. and Z.W.; methodology, S.X.; software, H.Z. and C.H.; validation, H.Z., C.H., Z.L., P.Z. and W.X.; formal analysis, S.X. and Z.W.; investigation, H.Z., C.H. and Z.L.; resources, Z.W.; data curation, H.Z., C.H. and W.X.; writing—original draft preparation, S.X.; writing—review and editing, S.X. and Z.W.; visualization, S.X. and C.H.; supervision, Z.W.; project administration, G.Y. and Z.W.; funding acquisition, S.X., G.Y. and Z.W. All authors have read and agreed to the published version of the manuscript.

Funding

This research was funded by the Joint Funds of the Zhejiang Provincial Natural Science Foundation of China under Grant No. LZY24F050002, Zhejiang Provincial Natural Science Foundation of China under Grant No. LY23F050001, the Baima Lake Laboratory Joint Fund of Zhejiang Provincial Natural Science Foundation of China under Grant No. LBMHY25F030002, the Municipal Government of Quzhou under Grant No. 2023D001, No. 2023D020, No. 2024D012 and No. 2024D051.

Institutional Review Board Statement

Not applicable.

Informed Consent Statement

Not applicable.

Data Availability Statement

The raw data supporting the conclusions of this article will be made available by the authors on request.

Conflicts of Interest

The authors declare no conflicts of interest.

Abbreviations

The following abbreviations are used in this manuscript:
FMCWFrequency-Modulated Continuous-Wave
EO-PLLElectro-Optic Phase-Locked Loop
DLFDigital Loop Filter
NNNeural Network
SACSoft Actor-Critic
LiDARLight Detection and Ranging
NN-SACNeural Network-Soft Actor-Critic
RLReinforcement Learning
SOASemiconductor Optical Amplifier
MZIMach-Zehnder Interferometer
PDPhotodetector
FPGAField Programmable Gate Array
ADCAnalog-to-Digital Converter
CZCross-Zero Circuit
DPDDigital Phase Detector
TDCTime-to-Digital Converter
RAMRandom Access Memory
DACDigital-to-Analog Converter
LDDLaser Diode Driver
CNNConvolutional Neural Network
ENNEvaluate Neural Network
TNNTarget Neural Network
FWHMFull Width at Half Maxima
MRMapping Relationship
STFTShort Time Fourier Transform

References

  1. Okano, M.; Chong, C.H. Swept source lidar simultaneous FMCW ranging and nonmechanical beam steering with a wideband swept source. Opt. Express 2020, 28, 23898–23915. [Google Scholar] [CrossRef]
  2. You, C.W.; Chen, S.T.; Wang, T.Y.; Liu, J.S.; Wang, K.J.; Yang, Z.G. Nonlinear error correction for Terahertz FMCW System by a new beat frequency estimation method. Opt. Express 2021, 29, 34510–34521. [Google Scholar] [CrossRef]
  3. Tseng, C.H.; Hung, Y.H.; Hwang, S.K. Frequency-modulated continuous-wave microwave generation using stabilized period-one nonlinear dynamics of semiconductor lasers. Opt. Lett. 2019, 44, 3334–3337. [Google Scholar] [CrossRef]
  4. Gerald, H.; Chen, Z.; Wei, T. Extended-bandwidth frequency sweeps of a distributed feedback laser using combined injection current and temperature modulation. Rev. Sci. Instrum. 2017, 88, 075104. [Google Scholar] [CrossRef]
  5. Nordin, D.; Hyyppä, K. Advantages of a new modulation scheme in an optical self-mixing frequency-modulated continuous-wave system. Opt. Eng. 2002, 41, 1128–1133. [Google Scholar] [CrossRef]
  6. Vasilyev, A.; Satyan, N.; Rakuljic, G.; Yariv, A. Terahertz chirp generation using frequency stitched VCSELs for increased LIDAR resolution. In Proceedings of the 2012 Conference on Lasers and Electro-Optics (CLEO), San Jose, CA, USA, 6–11 May 2012; IEEE: Piscataway, NJ, USA, 2012. [Google Scholar]
  7. Zhang, T.; Qu, X.H.; Zhang, F.M. Nonlinear error correction for FMCW ladar by the amplitude modulation method. Opt. Express 2018, 26, 11519–11528. [Google Scholar] [CrossRef]
  8. Cao, X.Y.; Wu, K.; Li, C.; Zhang, G.J.; Chen, J.P. Highly efficient iteration algorithm for a linear frequency-sweep distributed feedback laser in frequency-modulated continuous wave lidar applications. J. Opt. Soc. Am. B-Opt. Phys. 2021, 38, D8–D14. [Google Scholar] [CrossRef]
  9. Ula, R.K.; Noguchi, Y.; Iiyama, K. Three-dimensional object profiling using highly accurate FMCW optical ranging system. J. Light. Technol. 2019, 37, 3826–3833. [Google Scholar] [CrossRef]
  10. Tian, Y.Q.; Cui, J.W.; Wang, Z.Y.; Tan, J.B. Nonlinear correction of a laser scanning interference system based on a fiber ring resonator. Appl. Opt. 2022, 61, 1030–1034. [Google Scholar] [CrossRef]
  11. Galiev, R.R.; Kondratiev, N.M.; Lobanov, V.E.; Bilenko, I.A. Optimization of a frequency comb-based calibration of a tunable laser. In Proceedings of the Conference on Optical Metrology and Inspection for Industrial Applications VII, Online, 11–16 October 2020. [Google Scholar] [CrossRef]
  12. Baumann, E.; Giorgetta, F.R.; Coddington, I.; Sinclair, L.C.; Knabe, K.; Swann, W.C.; Newbury, N.R. Comb-calibrated frequency-modulated continuous-wave ladar for absolute distance measurements. Opt. Lett. 2013, 38, 2026–2028. [Google Scholar] [CrossRef]
  13. Tsuchida, H. Regression analysis of FMCW-LiDAR beat signals for non-linear chirp mitigation. Electron. Lett. 2019, 55, 914–915. [Google Scholar] [CrossRef]
  14. Binaie, A.; Ahasan, S.; Krishnaswamy, H. A Spurless and wideband continuous-time electro-optical phase locked loop (CT-EOPLL) for high performance LiDAR. IEEE Open J. Solid-State Circuits Soc. 2021, 1, 235–246. [Google Scholar] [CrossRef]
  15. Feng, Y.X.; Xie, W.L.; Meng, Y.X.; Zhang, L.; Liu, Z.W.Y.; Wei, W.; Dong, Y. High-performance optical frequency-domain reflectometry based on high-order optical phase-locking-assisted chirp optimization. J. Light. Technol. 2020, 38, 6227–6236. [Google Scholar] [CrossRef]
  16. Hauser, M.; Hofbauer, M. FPGA-based EO-PLL with repetitive control for highly linear laser frequency tuning in FMCW LIDAR applications. IEEE Photonics J. 2022, 14, 6808608. [Google Scholar] [CrossRef]
  17. Chen, Z.; Gerald, H.; Wei, T. Digitally controlled chirped pulse laser for sub-terahertz-range fiber structure interrogation. Opt. Lett. 2017, 42, 1007–1010. [Google Scholar] [CrossRef]
  18. Deng, W.; Chen, Z.P.; Jia, H.K.; Yan, A.X.; Sun, S.Y.; Chen, G.P.; Wang, Z.H.; Chi, B.Y. A self-adapted two-point modulation type-II digital PLL for fast chirp rate and wide chirp-bandwidth FMCW signal generation. IEEE J. Solid-State Circuits 2022, 57, 1162–1174. [Google Scholar] [CrossRef]
  19. Zhang, J.T.; Liu, C.; Su, L.W.; Fu, X.H.; Jin, W.; Bi, W.H.; Fu, G.W. Wide range linearization calibration method for DFB Laser in FMCW LiDAR. Opt. Lasers Eng. 2024, 174, 107961. [Google Scholar] [CrossRef]
  20. Rosenblatt, F. The perceptron a probabilistic model for information storage and organization in the brain. Psychol. Rev. 1958, 65, 386–408. [Google Scholar] [CrossRef]
  21. Hasselt, H.V.; Wiering, M.A. Reinforcement learning in continuous action spaces. In Proceedings of the International Symposium on Approximate Dynamic Programming and Reinforcement Learning, Honolulu, HI, USA, 1–5 April 2007; IEEE: Piscataway, NJ, USA, 2007. [Google Scholar] [CrossRef]
  22. Arulkumaran, K.; Deisenroth, M.P.; Brundage, M.; Bharath, A.A. Deep reinforcement learning a brief survey. IEEE Signal Process. Mag. 2017, 6, 26–38. [Google Scholar] [CrossRef]
  23. Wu, J.D.; Wei, Z.B.; Li, W.H.; Wang, Y.; Li, Y.W.; Sauer, D.U. Battery thermal- and health-constrained energy management for hybrid electric bus based on soft actor-critic DRL algorithm. IEEE Trans. Ind. Inform. 2021, 17, 3751–3761. [Google Scholar] [CrossRef]
  24. Zhao, H.H.; Yuan, G.H.; Xiao, J.; Li, J.F.; Zhang, H.; Fang, K.; Wang, Z.R. Linearization of nonlinear frequency modulated continuous wave generation using model-based reinforcement learning. Opt. Express 2022, 30, 20647–20658. [Google Scholar] [CrossRef]
  25. Durak, L.; Arikan, O. Short-time Fourier transform two fundamental properties and an optimal implementation. IEEE Trans. Signal Process. 2003, 51, 1231–1242. [Google Scholar] [CrossRef]
Figure 1. Ranging principle: The upper left subgraph shows the amplitude vs. time curves of the local light and reflected light, while the lower right subgraph shows the frequency vs. time curve of the beat signal.
Photonics 12 00356 g001
Figure 2. The significance of frequency-sweeping linearity, (a): frequency changes with perfect linearity, (b): frequency changes with distorted linearity. The right shows the frequency vs. time curves of local light, reflected light, and beat signal. The left shows the power spectrum of beat signal.
Photonics 12 00356 g002aPhotonics 12 00356 g002b
Figure 3. The measurement system.
Photonics 12 00356 g003
Figure 4. Schematic of the nonlinearity correction by EO-PLL.
Photonics 12 00356 g004
Figure 5. Timing diagram.
Photonics 12 00356 g005
Figure 6. An illustration of the modulation current slope. The top subgraph shows the modulation current vs. time curve, while the bottom subgraph shows the frequency vs. time curve of the output frequency-swept light.
Photonics 12 00356 g006
Figure 7. Construction of NN model.
Photonics 12 00356 g007
Figure 8. Schematic diagram of the SAC algorithm.
Photonics 12 00356 g008
Figure 9. Spectrum comparison of sMZI(t) under different ΔWDLF settings, (a): ΔWDLF = 30 kHz, (b): ΔWDLF = 25 kHz, (c): ΔWDLF = 20 kHz. (d) is the spectrum comparison of the iterative control and NN-SAC.
Photonics 12 00356 g009
Figure 10. Results of STFT, (a): without control, (b): only EO-PLL (ΔWDLF = 30 kHz) (c): iteration + EO-PLL (ΔWDLF = 25 kHz), (d): NN-SAC + EO-PLL (ΔWDLF = 20 kHz). The red dashed line corresponds to the preset reference signal frequency fREF.
Photonics 12 00356 g010
Figure 11. Analysis for frequency linearity of frequency-swept light, (a): without control, (b): only EO-PLL (ΔWDLF = 30 kHz), (c): iteration + EO-PLL (ΔWDLF = 25 kHz), (d): NN-SAC + EO-PLL (ΔWDLF = 20 kHz). The blue dotted line represents the residual error vs. time relationship, while the red curve represents the frequency vs. time relationship of the output frequency-swept light in a single modulation period.
Photonics 12 00356 g011
Figure 12. The laser ranging experimental setup, (a): specular reflection, (b): diffuse reflection.
Photonics 12 00356 g012
Figure 13. Ranging results.
Photonics 12 00356 g013
Table 1. Model training hyperparameters.
HyperparameterValue
Number of control points/N1700
Dataset size in NN training800
Test set ratio20%
Batch size in NN training/M4
Number of NN training iterations20,000
Learning rate of NN0.0025
Coefficient of Smooth L1 loss function/α4
Number of SAC training epochs2000
Size of replay buffer7 × 107
Standard deviation of Gaussian strategy module/σ5
Exploration coefficient/β0
Discount factor/γ0.4
Learning rate of actor network0.003
Learning rate of critic network0.003
Soft update step size of TNN/Γ10
Table 2. Analysis of hardware generalization capability.
Scenario1: NN-SAC
(Original)
2: Without Control
(Substitute)
3: NN-SAC (Substitute,
Not Retrained)
4. NN-SAC
(Substitute, Retrained)
fRMSE (MHz)108.11404.3194.5110.3
f1−r24.5036 × 10−57.6003 × 10−31.458 × 10−44.6888 × 10⁻⁵
Table 3. Analysis of ranging results.
Correction
Mechanism
Without
Control
Only EO-PLL
ΔWDLF = 30 kHz
Iteration + EO-PLL
ΔWDLF = 25 kHz
NN-SAC + EO-PLL
ΔWDLF = 20 kHz
Emax/mm10.67.61.81.1
MAE/mm5.03.30.80.4
RMSE/mm5.43.71.00.5
Table 4. Comparison of specular reflection and diffuse reflection experiments.
Ranging MethodNN-SAC +
EO-PLL
Resampling Method
Specular reflectionEmax/mm1.12.3
MAE/mm0.41.5
RMSE/mm0.51.8
Diffuse
reflection
Emax/mm1.82.7
MAE/mm0.81.8
RMSE/mm0.92.2
Disclaimer/Publisher’s Note: The statements, opinions and data contained in all publications are solely those of the individual author(s) and contributor(s) and not of MDPI and/or the editor(s). MDPI and/or the editor(s) disclaim responsibility for any injury to people or property resulting from any ideas, methods, instructions or products referred to in the content.