Abstract
We previously introduced the concepts of optical centroid efficiency (OCE) and enclosed energy within a rectangular pixel (EOD). We applied them to an ideal lens with and without a central obscuration for two different detector pixel sizes. Also, we analyzed the performance of OCE vs. EOD for the following three Seidel primary aberrations of an ideal lens: spherical, coma, and astigmatism, plus defocus. In this paper, we concentrate on three different optical remote sensing instrument configurations. We burden them with a set of aberrations to mimic realistic generalized error budgets that cover potential ground, lunch, and on-orbit environmental conditions. The shape of the OCE vs. EOD curve depends to a large degree on the dominant aberration. With the proper choice of detector pixel size, OCE increases with EOD when EOD is larger than 0.6. The increased detector pixel size is advantageous for structures that enhance diffraction effects, and for off-axis and asymmetrical configurations. Analytical and experimental tests are proposed for original critical cases. Furthermore, OCE and EOD, as functional figures of merit, may be effectively applied to instruments for monitoring tumors and their evolution to cancerous tissue, leading to timely diagnosis.
1. Introduction
In modern sensors, especially in space surveillance and remote sensing [1,2,3], contributions to deteriorations in the figures of merit include inherent residual design aberrations, manufacturing uncertainties, and misalignments introduced during assembly, as exemplified by the original Hubble telescope [4]. A prudent margin of error would also anticipate some unplanned environmental impacts, including jitter, and other unpredictable opto-mechatronic conditions [5]. Among the most critical radiometric parameters in performance estimation, optical centroid efficiency (OCE) vs. energy on detector (EOD), and each of them separately, refer to the information-carrying energy.
We have been studying OCE vs. EOD relationship considering critical exterior environmental parameters, combined with inherent instrument design limitations [6,7]. Our efforts started by considering the effects of geometrical factors on the potential correlation between OCE and EOD in a sensor, such as the detector size and the central obscuration, presented in Part 1 [6]. The contributions of three typical aberrations (spherical [a40], coma [a31], and astigmatism [a31]) plus defocus for two different pixel sizes were studied in Part 2 [7]. The quality of the image, created by a band of an electromagnetic spectrum (its expanded definition includes all imaging wavelengths, including energetic particles) is determined by the energy-related quantities.
In the current publication, our efforts culminate in laying out a comprehensive understanding of the performance of three typical sensor types with respect to the relationship between OCE and EOD. As in the previous publications, studies are performed for two different detector pixel sizes, 2d = 3λF/# and 2d = 7λF/#. Here, the linear detector pixel dimension is 2d; λ denotes the wavelength; and F/# is the f-number, equal to the focal length of the optical system divided by the aperture diameter. These detector sizes are also featured in earlier publications. This choice corresponds to a relatively small and relatively large pixel size in comparison to the diameter of the Airy disk. The former is somewhat larger than the Airy disk diameter while the latter is slightly smaller than three Airy disks.
This time, for simplicity and functionality, we set up optical layouts without defocus. We mimic the complete performance of the optical design, testing, manufacture, alignment, and environmental realities with the specific relationship between the aberrations as follows: the ratio of (the third-order) spherical aberration to coma to astigmatism is always given in the proportion 1:0.25:0.25. The aberration values start at 1λ:0.25λ:0.25λ, decreasing to zero. The wavefront error is introduced at the entrance pupil in Code V. The entrance pupil is the image of the optical stop in the object space.
Incidentally, this set of aberration ratios closely represents (actually, it is just slightly larger than) the uncorrected, flawed primary mirror of the Hubble [4] (laid out in a Richey Chretien telescope configuration). In the astronomical image processing community, the performance degradation of the Hubble sensor was considered excessive, requiring the in situ (that is, in space) installation of another optical element. This addition resulted in a significant decrease in the sensor performance deterioration, caused by approximately one-wavelength (1λ) spherical aberration. There exist other applications where the same performance degradation does not produce such imaging disfunction. With a priori knowledge, images may even be digitally postprocessed.
Thus, the proposed set and magnitude of aberrations is a reasonable representation of the tolerances encountered in a typical error budget, including the following: (i) manufacturing tolerance for the uncertainty in an element (surface) radius of curvature, thickness, and/or index of refraction; (ii) alignment tolerances for each optical element, including tilt, decenter, and displacement along the optical axis; (iii) thermally induced distance and position uncertainties inside and outside the sensor; and (iv) unpredictable and unknown environmental jitter, mechanical displacements, and misalignment-provoking environmental events.
An ideal lens and three complete and functional optical systems are analyzed for a mixture of aberrations. In Section 2, this paper presents a study of an ideal lens with and without central obscuration. The performance description of a reflective three-mirror (RTM) system is featured in Section 3. An analysis of a four-element refractive (FER) system is included in Section 4, because reflective systems have no chromatic aberration. A discussion of the results from Section 2 through Section 4 is provided in Section 5. Summaries of all three parts of this investigation are included in Section 6. Conclusions are summarized in Section 7.
2. An Ideal Lens with a Combination of Aberrations (a40:a31:a22 = 1:0.25:0.25), With and Without Central Obscuration
Previously, we investigated the effect of individual third-order Seidel aberrations on the OCE vs. EOD relationship (Part 2, [7]) with two different detector sizes. Here, we perform the same analysis with a combination of all three aberrations in an ideal lens. Two different detector sizes are analyzed for the case of a lens with a circular aperture of diameter D. This is augmented with the analysis of an optical element with a central obscuration. The size of the obscuration rectangle is 0.27 D × 0.46 D, where D is the diameter of the aperture stop (see Figure 5 in Ref. [6]).
Within this framework, we describe the presence of a unit wave of spherical aberration, accompanied by coma and astigmatism of 0.25 waves each in an optical sensor. The effects of spherical aberration are prominent in the next three subsections due to the dominance of the spherical aberration in this mixture.
2.1. Ideal Lens with a Combination of Aberrations (a40:a31:a22 = 1:0.25:0.25) Without the Central Obscuration
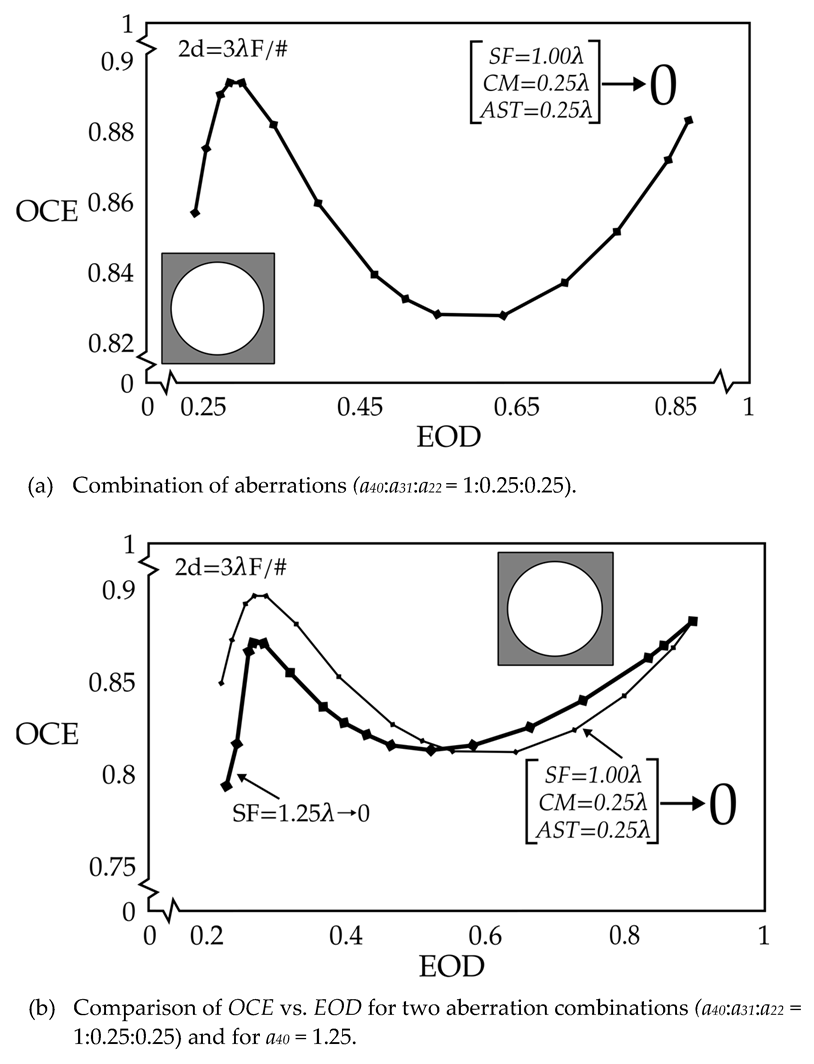
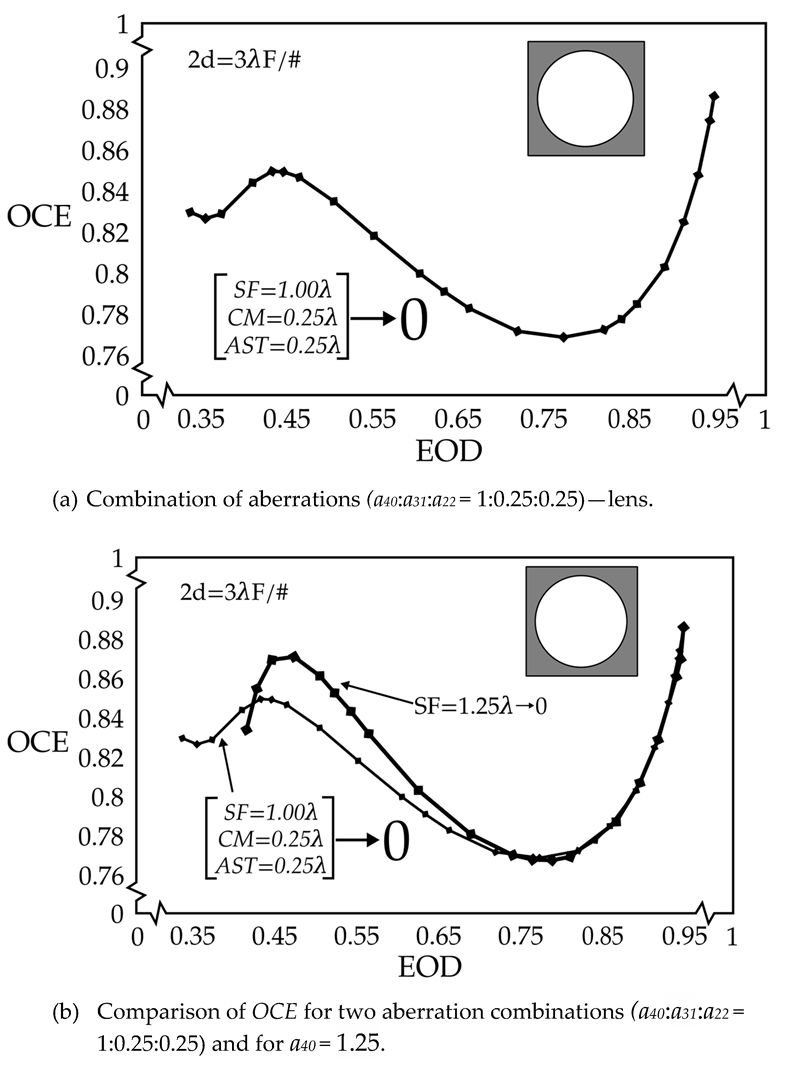
Figure 1 and Figure 2 display graphs of OCE vs. EOD for a small and large detector pixel size, 2d = 3λF/# and 2d = 7λF/#, respectively, for an ideal lens without a central obscuration. The clear circle in the inset, surrounded by a darker area, indicates a clear circular aperture. The amount of aberration in the lens is dominated by spherical aberration in the combination of aberrations (a40:a31:a22 = 1:0.25:0.25).
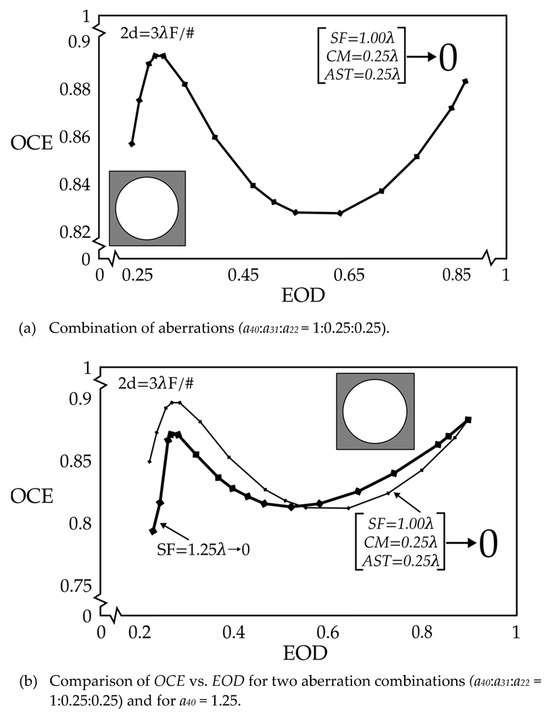
Figure 1.
(a) OCE vs. EOD graph for a lens without central obscuration and with a mixture of aberrations (a40:a31:a22 = 1:0.25:0.25) for detector pixel size of 2d = 3λF/#. The total amount of aberration decreases from the left side of the graph with the aberration value (a40:a31:a22 = 1λ:0.25λ:0.25λ along the curve to the upper right corner with all aberrations decreasing to 0. (b) The figure of part (a) is overlaid with the graph OCE vs. EOD for a40 = 1.25 λ, from Ref. [7], Figure 1. The heavy solid line is the imported one. The first zero of the Bessel function is located at 1.22 λF/#. In the absence of aberration, corresponding to the furthest right point on the graph, the pixel encloses somewhat more than the Airy disk.
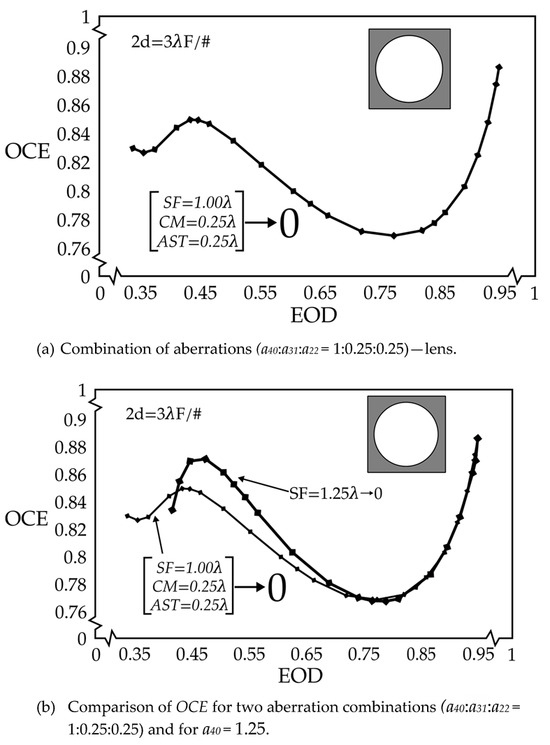
Figure 2.
(a) OCE vs. EOD graph for a lens with no central obscuration and with a mixture of aberrations (a40:a31:a22 = 1:0.25:0.25) for detector pixel size 2d = 7λF/#. The total amount of aberration decreases from the left side of the graph with the value of a40:a31:a22 = 1λ:0.25λ:0.25λ, along the curve to the upper right corner with all aberrations decreasing to 0. (b) The graph of part (a) is overlaid with the graph OCE vs. EOD for a40 = 1.25, from Figure 3, Ref. [7]. The heavy solid line is the imported one. The first zero of the Bessel function is located at 1.22 λF/#. In the absence of aberration, the pixel encloses 2.87 Airy disks (nearly 3), corresponding to the furthest right point on the graph.
The OCE vs. EOD curve for the small pixel, 2d = 3λF/#, without central obscuration is presented in Figure 1a. The dominant aberration is the spherical aberration; therefore, the shape of the OCE vs. EOD curve is similar to that in Figure 1 [7]. The two curves are shown in part (b) to facilitate the comparison. In Figure 1b, the heavy solid line is the imported one.
The OCE vs. EOD curve for the large pixel, 2d = 7λF/#, and without central obscuration is presented in Figure 2a. The shape of the graph presented in Figure 2a is quite similar to that of Figure 3 in Ref. [7] for the same detector size and only for the spherical aberration.
The graph of Figure 2a, overlaid with the graph OCE vs. EOD for spherical aberration equal to 1.25λ from Figure 3, Ref. [7], is displayed in part (b). The heavy solid line is the imported one. The downward trend of OCE for small EOD values seems to stabilize for the highest aberration values when mixed. The previously studied case of spherical aberration indicates a steep increase in OCE with a decrease in aberration for small EOD values. Stabilization arises consequent to the contribution of the small amount of coma and astigmatism for the maximum wavefront error.
2.2. Ideal Lens with a Combination of Aberrations (a40:a31:a22 = 1:0.25:0.25) with Central Obscuration
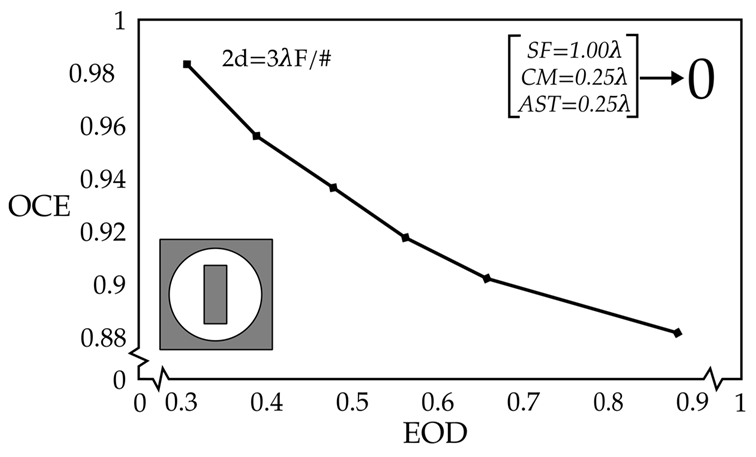
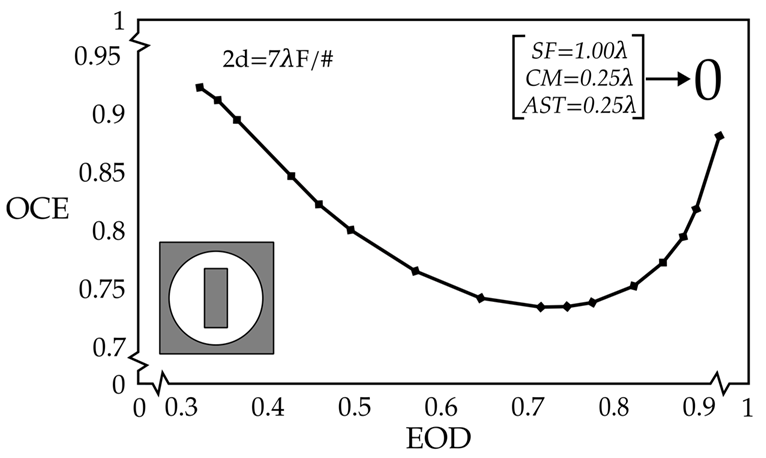
Next, we analyze the performance of a simple imaging optical element, a lens, with central obscuration. The circle in the inset, surrounded by a darker area, with an inserted rectangular shaded area, indicates the rectangular central obscuration inside the circular aperture. We examine in further detail the OCE vs. EOD relationship for a lens with a central obscuration, featuring a mixture of aberrations, aberrations (a40:a31:a22 = 1:0.25:0.25) for a small, 2d = 3λF/#, and large detector pixel size, 2d = 7λF/#, in Figure 3 and Figure 4, respectively.
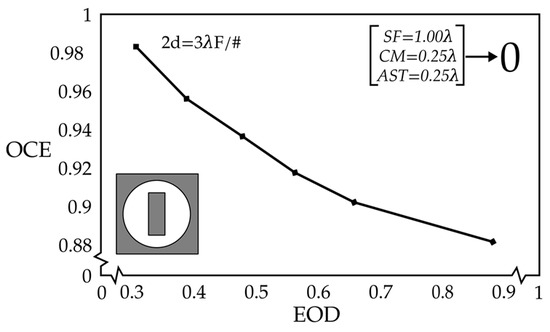
Figure 3.
OCE vs. EOD graph for a lens with central obscuration and with a mixture of aberrations (a40:a31:a22 = 1:0.25:0.25) for a detector pixel size of 2d = 3λF/#. The total amount of aberration decreases from the upper left corner of the graph with the value of aberrations (a40:a31:a22 = 1λ:0.25λ:0.25λ) along the curve to the lower right corner, with all aberrations decreasing to 0. The first zero of the Bessel function is located at 1.22 λF/# in the absence of aberration. The pixel encloses somewhat more than the Airy disk diameter, corresponding to the furthest right point on the graph.
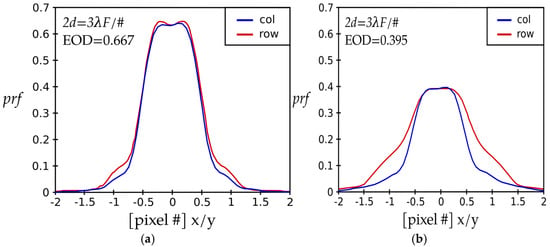
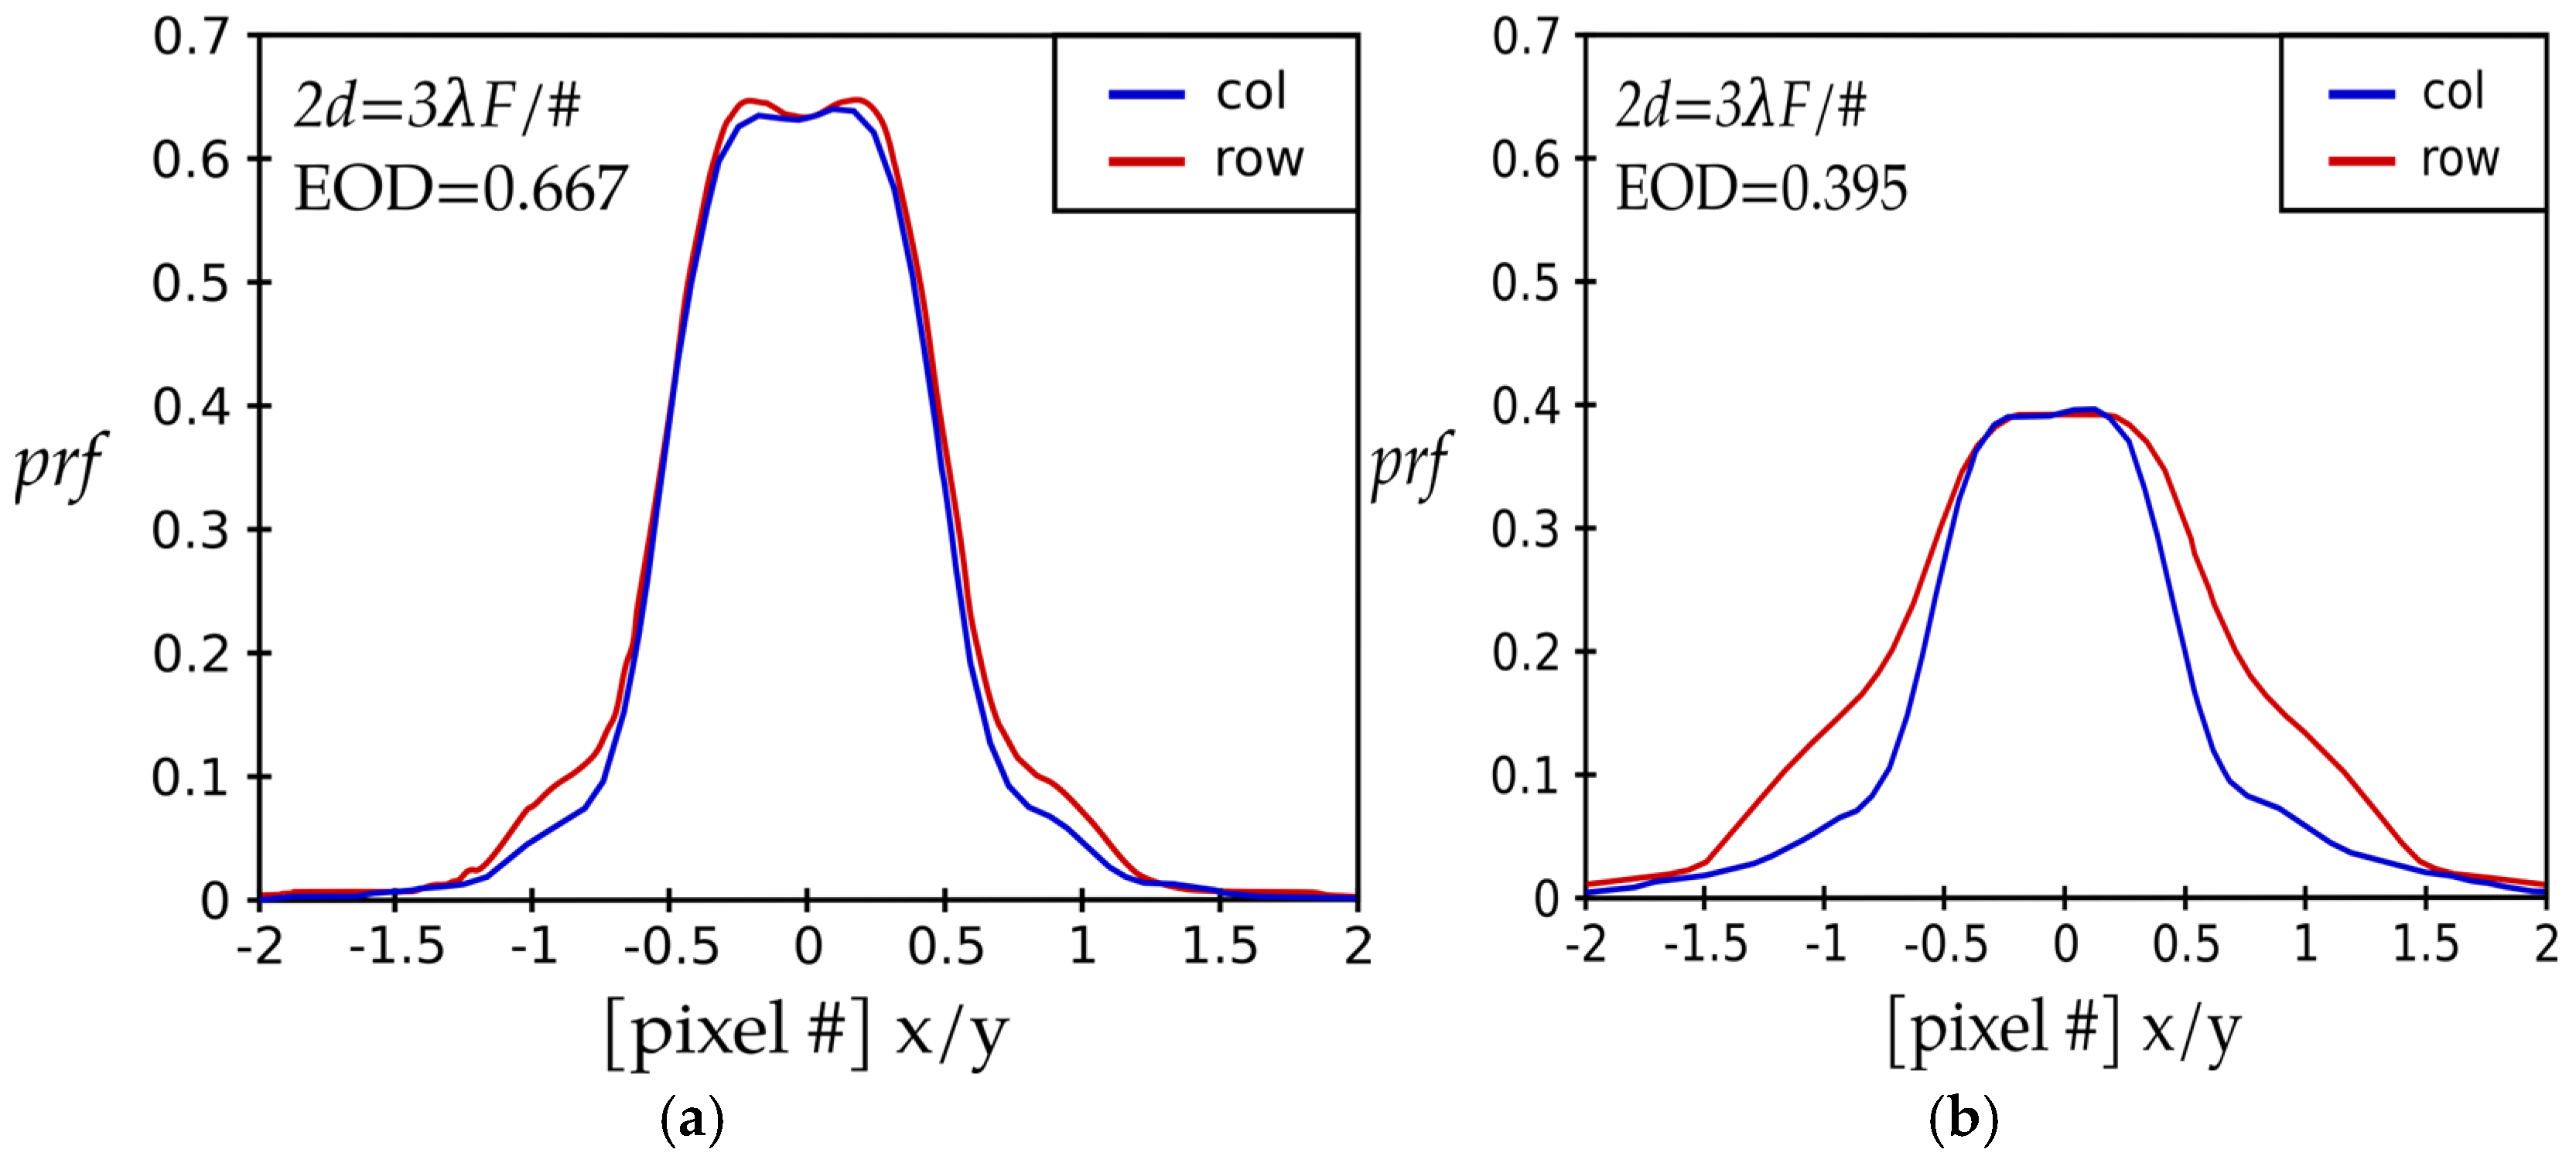
Figure 4.
Instrument point response function prf, corresponding to select points, I and F, in Figure 3, as a function of two orthogonal directions, x and y, or rows and columns, for the case of a lens with an asymmetrical central obscuration and with a mixture of aberrations (a40:a31:a22 = 1:0.25:0.25) for a detector pixel size of 2d = 3λF/#. EOD decreases with an increase in the amount of aberration. (a) Point I. (b) Point F.
OCE vs. EOD is graphed in Figure 3, for an ideal lens with central obscuration with a small detector size, 2d = 3λF/#. We note that OCE decreases with an increase in EOD; furthermore, the four middle points lie near each other on a straight line.
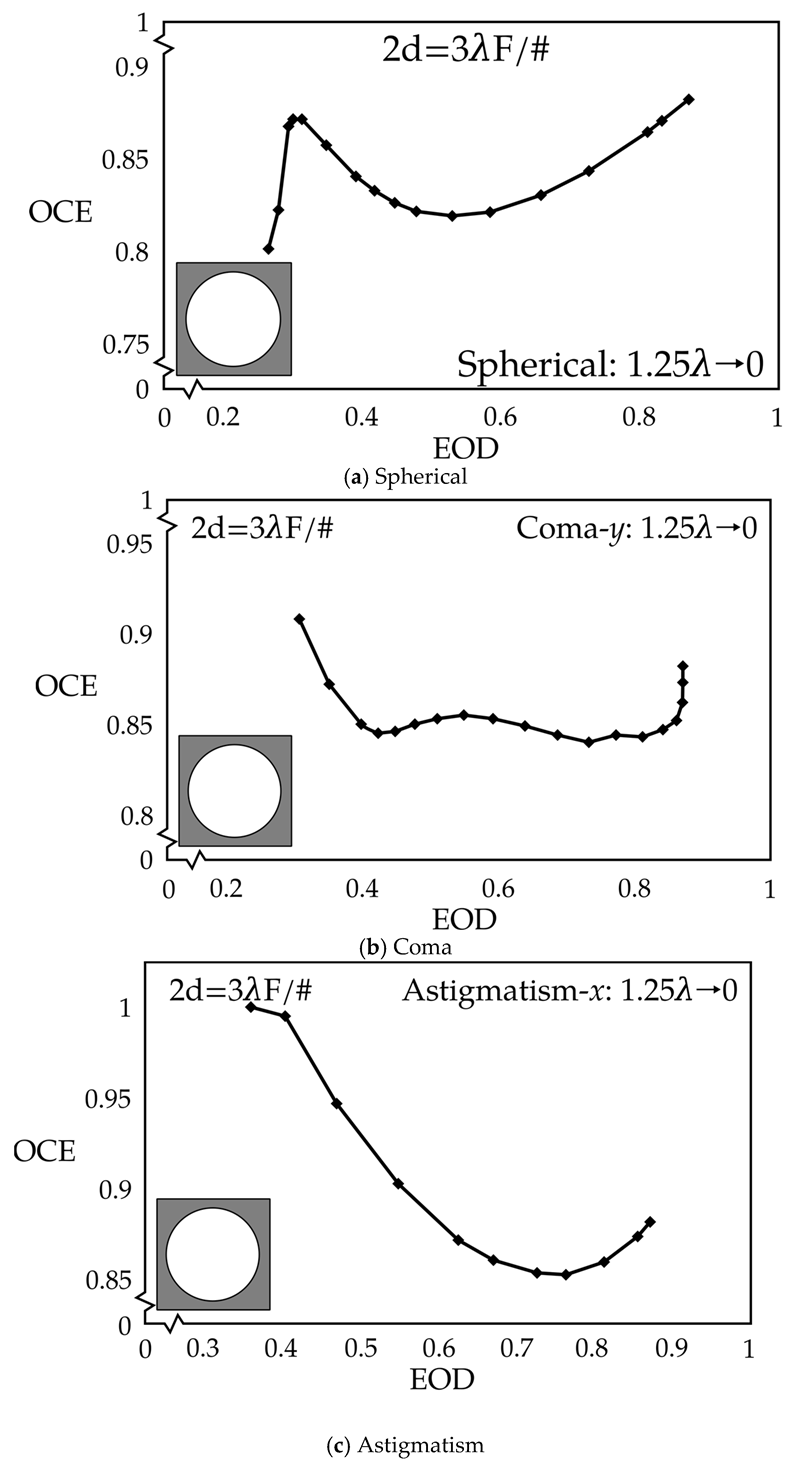
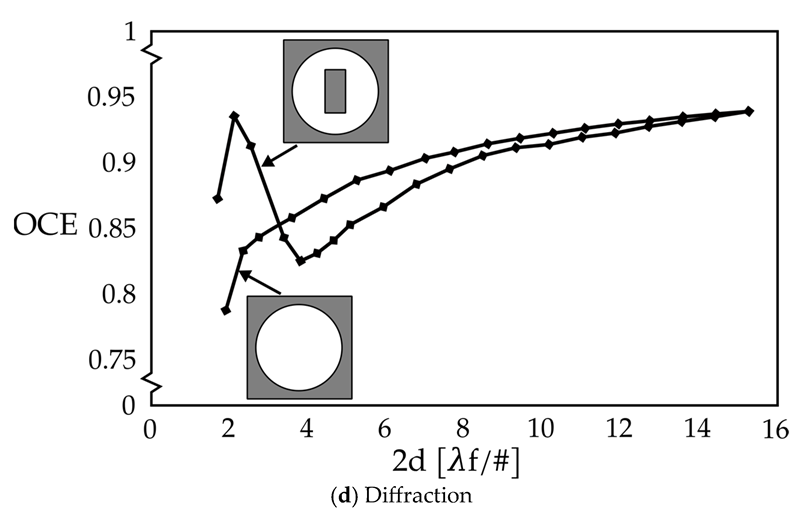
The psf of a simple lens, with a central rectangular obscuration suffers deterioration from several contributions as follows: (i) spherical aberration tends to rapidly move energy out of the central core to the side lobes with an increase in wavefront error, as illustrated in Figure A1a (see Figure 1 of Ref. [7]); (ii) coma features a centroid deviation from the chief ray that extends the psf in a specific manner, as it can be observed in Figure A1b (Figure 5 of Ref. [7]), resulting in a drastic drop in OCE with just a small decrease in EOD; (iii) astigmatism simply blurs the psf, as demonstrated in Figure A1c (see Figure 7 of Ref. [7]); and finally, (iv) the rectangular central obscuration diffracts an additional amount of energy to the side lobes, slightly reducing the size of the central core; this results in OCE featuring a dramatic peak in Figure A1d (see Figure 9 of Ref. [6]).
This set of observations is summarized from earlier investigations, each dealing with a single phenomenon, a single aberration and/or diffraction effect. For reference, figures illustrating each of these phenomena are reproduced from earlier publications in Appendix A.
We now further examine two sample prfs that may provide additional insight into the nearly linear relationship between OCE and EOD for a mixture of aberrations and with a small pixel. Two prfs, for the points marked on Figure 3, are featured in Figure 4a for Point I and Figure 4b for Point F, respectively. With an increase in the aberration, the energy spreads out. The figures are arranged in order of decreasing energy on the detector pixel, which corresponds to an increasing amount of aberration.
We may draw the following conclusions upon examining the two graphs in Figure 4: (i) the coma, astigmatism, and central obscuration create an asymmetrical prf cross-section along the x- and y-axes (we note that the corresponding graphs for spherical aberration in Figure 2 of Ref. [7] are all symmetrical, because their psfs are rotationally symmetric); (ii) with an increase in the wavefront error, especially the centroid displacement-driven coma, the cross-section of the asymmetrical prf is more pronounced, as it can be observed in Figure 4b; and (iii) the prf curves in Figure 4a are narrower than those in Figure 4b, while also having a larger EOD difference between the detector’s center point and its edge point. For this reason, Point F has a higher OCE than Point I.
Figure 5 presents the OCE vs. EOD relationship for a lens with a central obscuration, featuring a mixture of aberrations (a40:a31:a22 = 1:0.25:0.25) for a large detector size, 2d = 7λF/#.
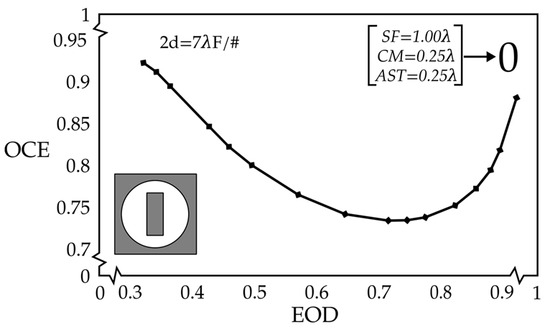
Figure 5.
OCE vs. EOD graph for a lens with central obscuration and with a mixture of aberrations (a40:a31:a22 = 1:0.25:0.25) for a detector pixel size of 2d = 7λF/#. The total amount of aberration decreases from the left side of the graph, starting with the value of a40:a31:a22 = 1λ:0.25λ:0.25λ along the curve to the upper right corner, with all aberrations decreasing to 0. The first zero of the Bessel function is located at 1.22 λF/#. In the absence of aberration, the pixel encloses 2.87 Airy disks (nearly 3), corresponding to the furthest right point on the graph.
After the analysis of an ideal lens with and without central obscuration, burdened with a wavefront error with a mix of third-order aberration ratios (a40:a31:a22 = 1:0.25:0:25), with two different detector sizes, it is now instructive to analyze OCE and EOD for several real, functioning sensors with the same added wavefront error.
We present an analysis of the often implemented reflective three-mirror (RTM) and four-element refractive (FER) sensor configurations. The former is an off-axis system, while the latter is a longer and heavier on-axis layout. Each of these optical systems is often chosen for implementation due to different space, weight, and performance constraints. We remind the reader that a small amount of inherited design residual aberration was preserved for convenience, because the designs themselves are not limited by diffraction.
3. Reflective Three-Mirror (RTM) System [8]
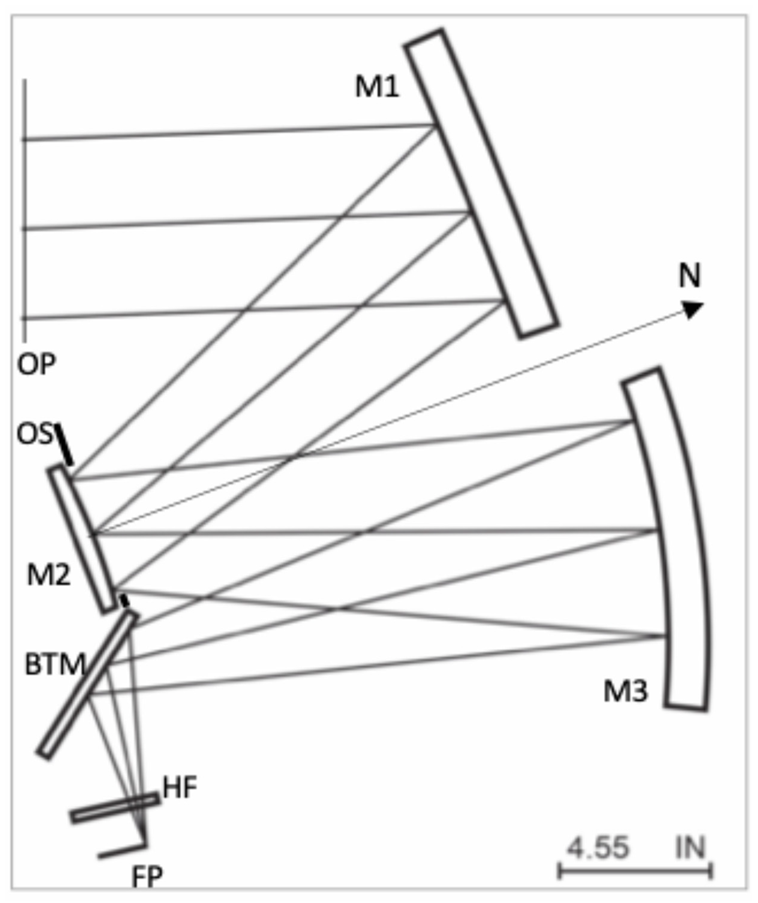
The optical layout of the reflective three-mirror (RTM) system is presented in Figure 6. This is a three-mirror all-reflective F/2 optical system, with a moderate full field of view of 4.5° x 4.5° [8]. The optical stop is located at the second mirror, while the optical axis is normal to the secondary mirror. After reflection at the third mirror, the incoming beam is reflected by the front surface of a dichroic beam splitter, while the transmission channel at a different wavelength is not presented here. Finally, the light beam passes through a filter and then reaches the focal plane array (FPA). In some way, this configuration is relatively rotationally symmetric with respect to the optical axis, N.
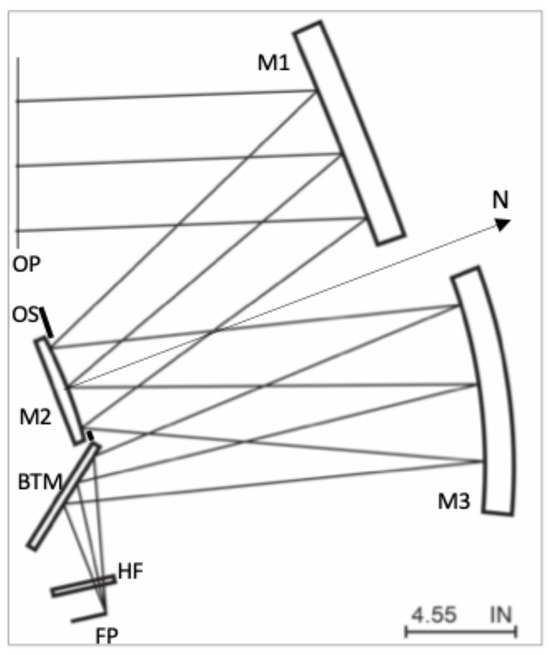
Figure 6.
Optical layout of the reflective three-mirror (RTM), with a beam for a single edge point being traced. The optical axis, normal to the secondary mirror, M2, is indicated by N. The optical stop, OS, is located at the second mirror, M2. The beam-turning mirror, BTM, shortens the overall length of the instrument. Other annotations: OP—object plane; M1—mirror 1; M3—mirror 3; HF—holographic filter; and FP—focal plane.
We focus our analysis on the edge of the full field of view, 2.25° x 2.25°, using raytracing. As commented earlier, the aberration in the optical system is dominated by spherical aberration. In the ray-trace analysis, the wavefront error is added at the entrance pupil of the RTM design in addition to the design residuals.
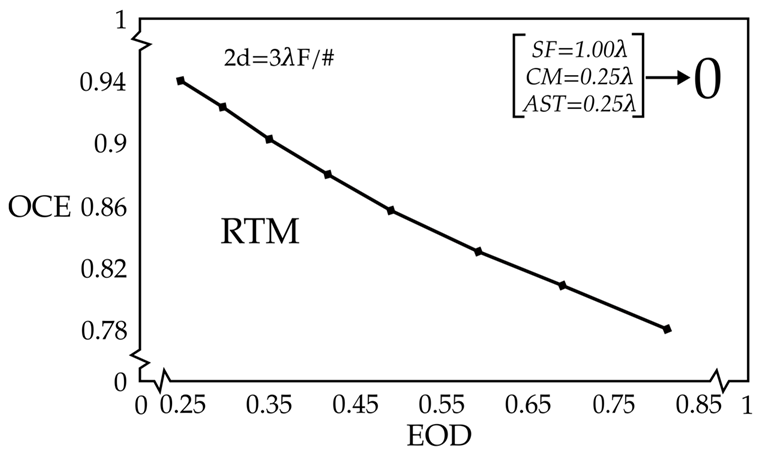
The OCE vs. EOD results for the RTM are presented in Figure 7 and Figure 8 for two detector pixel sizes, 2d = 3λF/# and 2d = 7λF/#, respectively. An interesting trend can be observed in Figure 7 for the smaller, 2d = 3λF/#, detector pixel size. It appears that a linear correlation exists between OCE and EOD with a slope of −0.29. The curve OCE vs. EOD in Figure 3 for a single lens with central obscuration and a small pixel size also features a negative slope; however, it deviates from linearity more than the one in Figure 7.
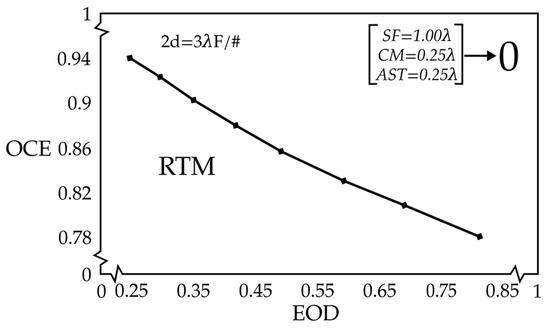
Figure 7.
OCE vs. EOD graph for an RTM with s mixture of aberrations (a40:a31:a22 = 1:0.25:0.25) for s detector pixel size of 2d = 3λF/#. The total amount of aberration decreases from the upper left side of the graph with the value of aberrations (a40:a31:a22 = 1λ:0.25λ:0.25λ) along the curve to the lower right corner, where all aberrations decrease to 0. The first zero of the Bessel function is located at 1.22 λF/#. In the absence of aberration, the pixel encloses somewhat more than the Airy disk diameter, corresponding to the furthest right point on the graph.
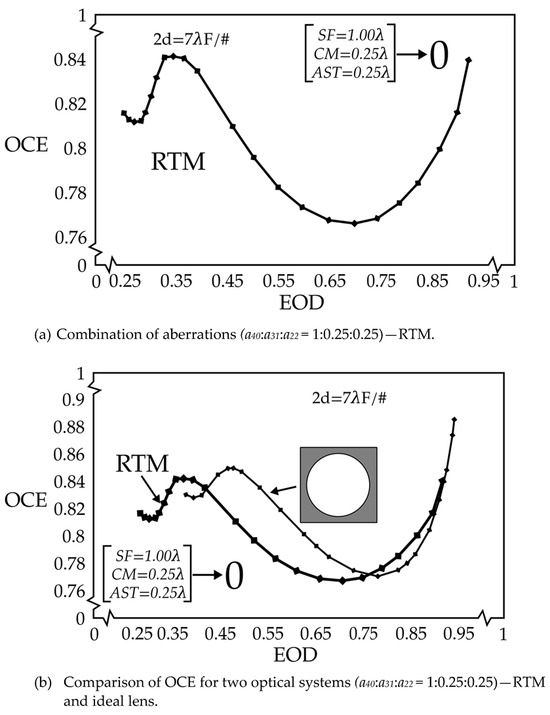
Figure 8.
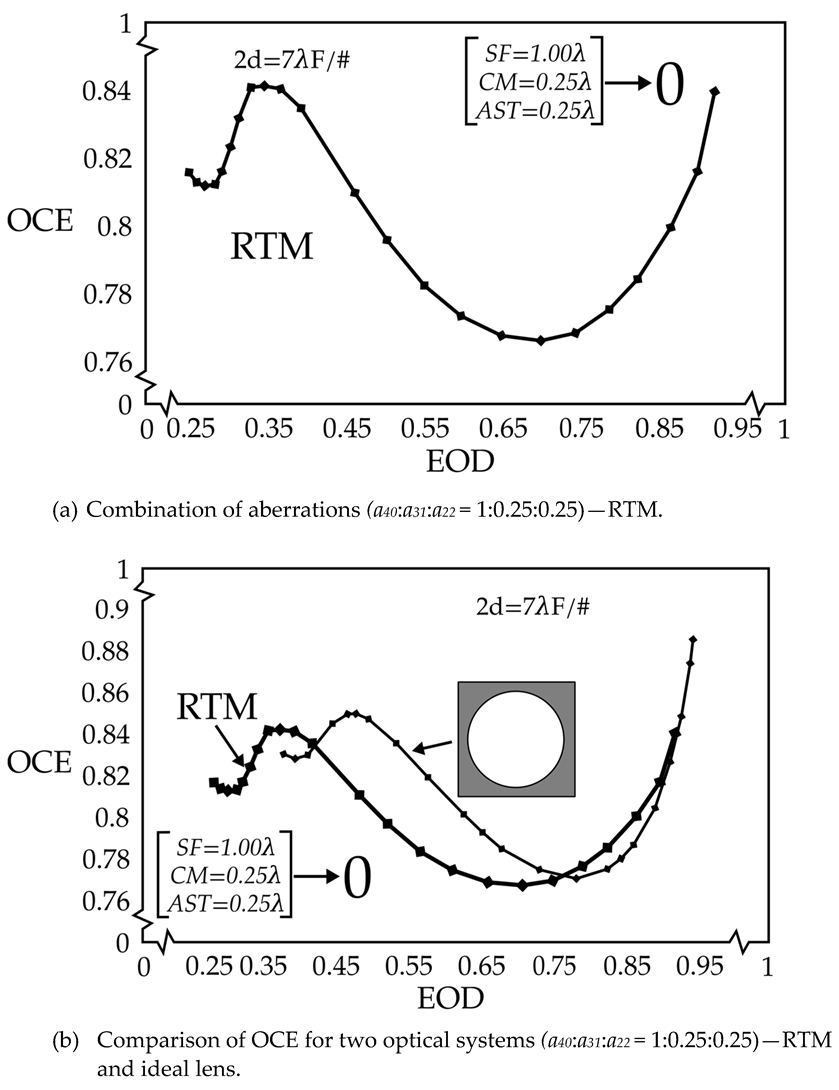
(a) OCE vs. EOD graph for an RTM with a mixture of aberrations (a40:a31:a22 = 1:0.25:0.25) for a detector pixel size of 2d = 7λF/#. The total amount of aberration decreases from the left side of the graph with the value of a40:a31:a22 = 1λ:0.25λ:0.25λ along the curve to the upper right corner, with all aberrations decreasing to 0. (b) The graph of figure (a) is overlaid with the graph OCE vs. EOD for a clear lens from Figure 2a, with the same mixture of aberrations and the same, large detector pixel size. The heavy solid line is the imported one. The first zero of the Bessel function is located at 1.22 λF/#. In the absence of aberration, the pixel encloses 2.87 Airy disks (nearly 3), corresponding to the furthest right point on the graph.
Figure 8a presents the OCE vs. EOD relationship for the RTM, featuring a mixture of aberrations (a40:a31:a22 = 1:0.25:0.25) for a large detector size, 2d = 7λF/#. The general trend observed in Figure 8a resembles that in Figure 2a for the same size detector pixel. The relationship between OCE and EOD for the RTM is very similar to that of an unobstructed lens for the same mix of aberrations for the large pixel. The unobstructed lens has higher OCE and higher EOD than the RTM system for a large part of the aberration range. The two curves are shown on Figure 8b to facilitate the comparison. In Figure 8b, the heavy solid line is the imported one.
Furthermore, the general shape of the graph presented in Figure 8a is also quite similar to that in Figure 3 in Ref. [7] (also reproduced in Figure 2b) for the same detector size and spherical aberration of EOD values larger than 0.4. Furthermore, the shape of the OCE vs. EOD curve is somewhat similar, even to that for the lens without obscuration for the smaller detector, presented in Figure 1a, except for a small hook present for small EOD values in Figure 8a.
4. Four-Element Refractive (FER) System
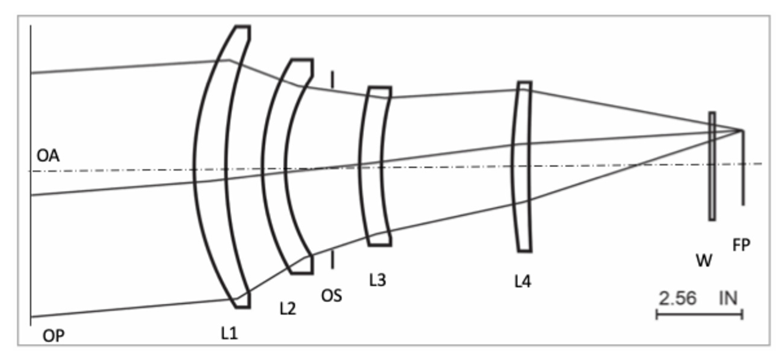
The last optical system included in this analysis is a 9° by 9°, F/2 four-element refractive (FER) design, displayed in Figure 9. The optical stop is located between elements L2 and L3, and a thin optical filter has been inserted in front of the FPA.
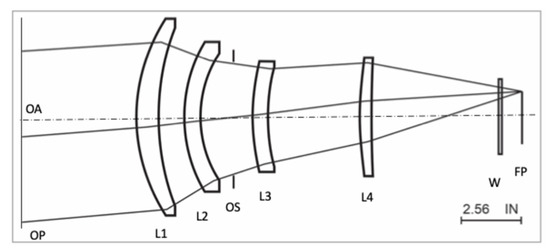
Figure 9.
Four-element refractive system, FER. The optical axis, OA, is perpendicular to all optical components. The optical stop, OS, is located between lens L2 and L3. Other annotations: OP—object plane; L1—lens 1; L4—lens 4; W—window; and FP—focal plane.
A mix of third-order aberrations with the aberration ratio a40:a31:a22 = 1:0.25:0:25 is added to the entrance pupil in Code V for the two detector sizes studied here. A small amount of inherited design residual aberration has been preserved. Again, the spherical aberration is expected to be dominant in determining image quality.
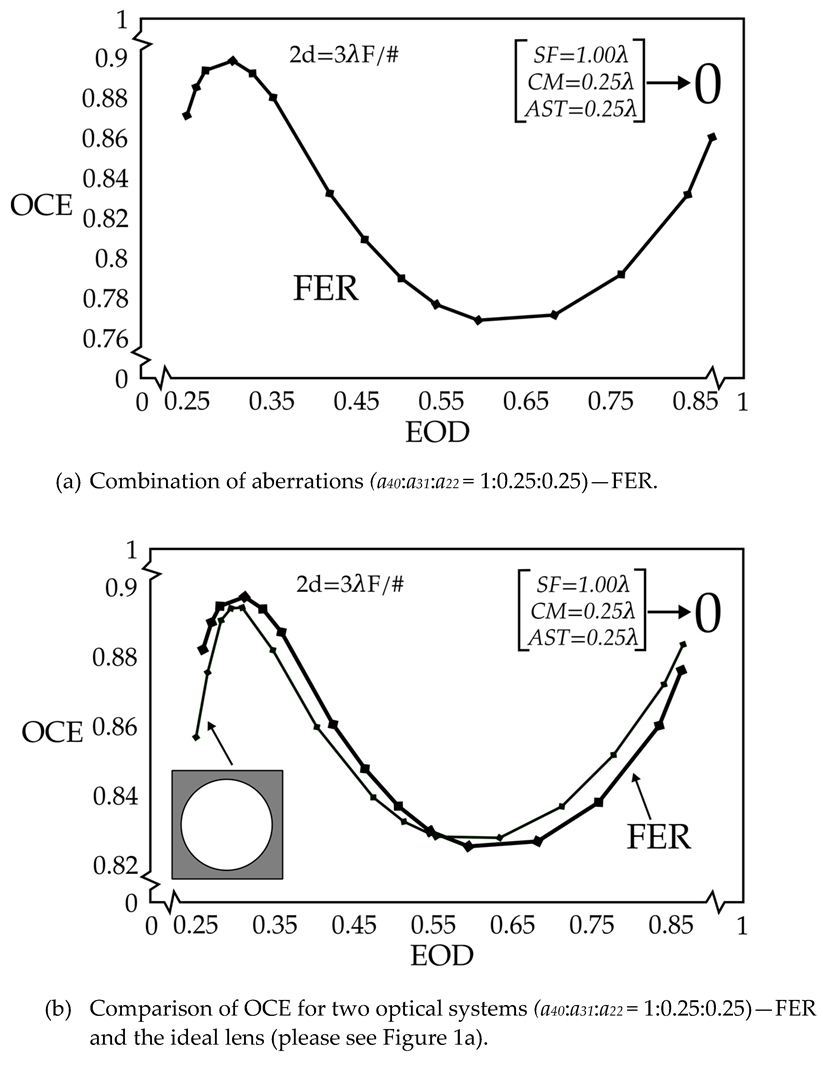
The OCE vs. EOD results for the FER configuration are presented in Figure 10 and Figure 11, for detector pixel sizes 2d = 3λF/# and 2d = 7λF/#, respectively. The general trend observed in Figure 10a resembles that in Figure 1 for unobstructed circular aperture and the same size detector pixel. The OCE vs. EOD curve for the FER and an unobstructed lens for the same mix of aberrations and for the same small pixel are shown in Figure 10b for comparison. In Figure 10b, the heavy solid line is the imported one.
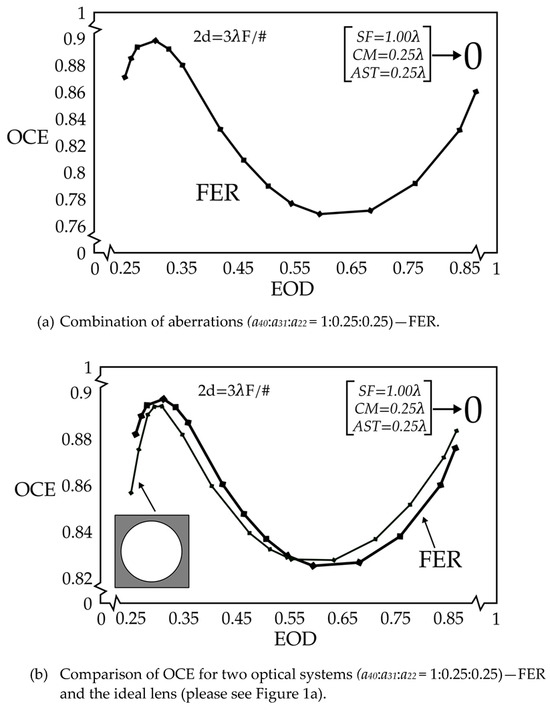
Figure 10.
(a) OCE vs. EOD graph for a FER sensor with a mixture of aberrations (a40:a31:a22 = 1:0.25:0.25) for a detector pixel size 2d = 3λF/#. The total amount of aberration decreases from the left side of the graph with the aberration value a40:a31:a22 = 1λ:0.25λ:0.25λ along the curve to the upper right corner, with all aberrations decreasing to 0. (b) The graph in (a) is overlaid with the graph OCE vs. EOD for a clear lens with the same mixture of aberrations from Figure 1a. The heavy solid line is the imported one. The first zero of the Bessel function is located at 1.22 λF/#. In the absence of aberration, the pixel encloses somewhat more than the Airy disk diameter, corresponding to the furthest right point on the graph.
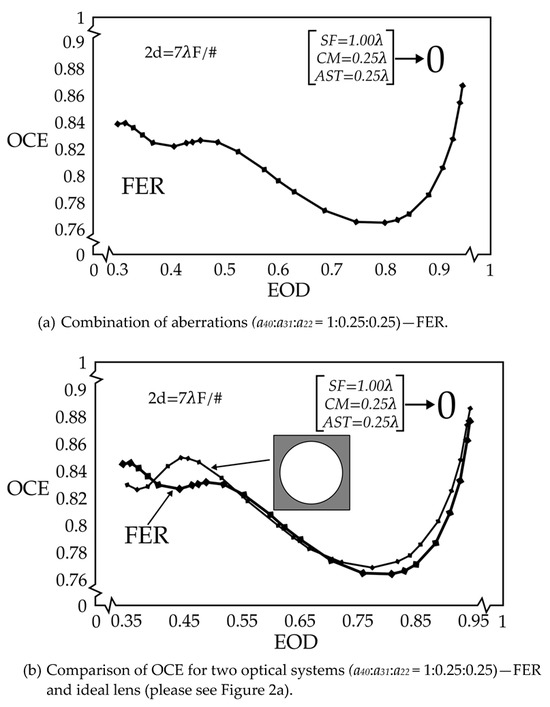
Figure 11.
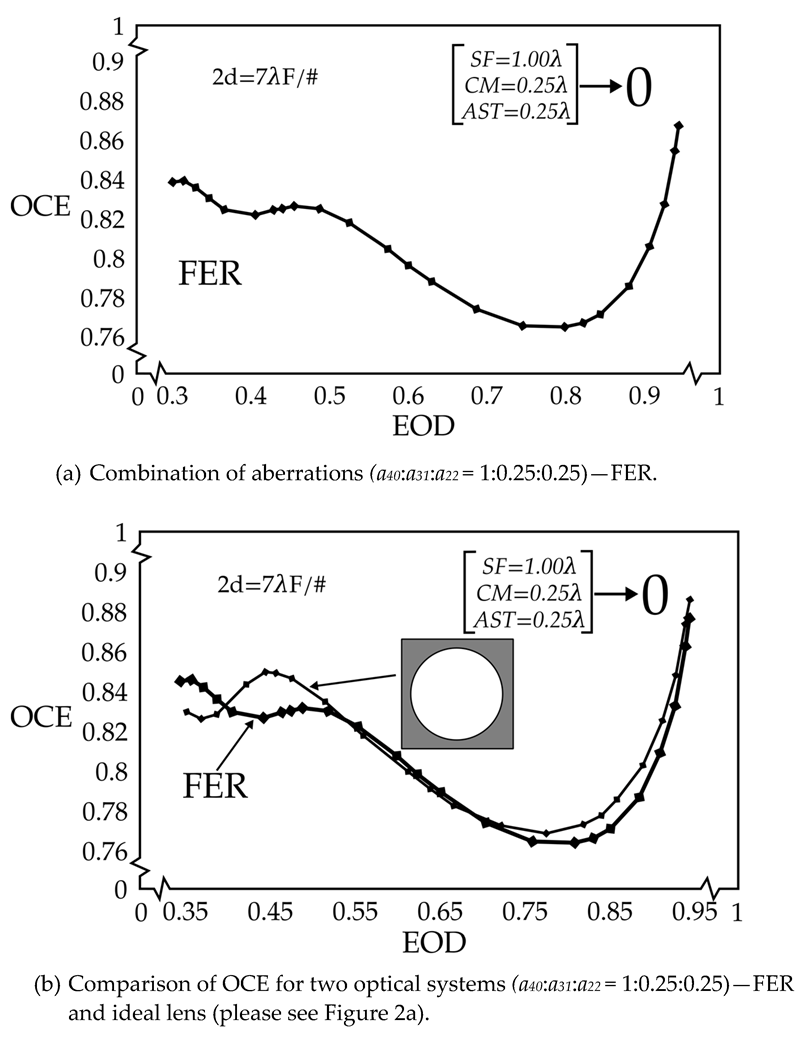
(a) OCE vs. EOD graph for the FER with a mixture of aberrations (a40:a31:a22 = 1:0.25:0.25) for a detector pixel size 2d = 7λF/#. The total amount of aberration decreases from the left side of the graph with the aberration value a40:a31:a22 = 1λ:0.25λ:0.25λ along the curve to the upper right corner, with all aberrations decreasing to 0. (b) The graph in (a) is overlaid with the graph OCE vs. EOD for a clear lens with the same mixture of aberrations and the same large pixel size from Figure 2a. The heavy solid line is the imported one. The first zero of the Bessel function is located at 1.22 λF/#. In the absence of aberration, the pixel encloses 2.87 Airy disks (nearly 3), corresponding to the furthest right point on the graph.
We may also note that the OCE vs. EOD graph for a FER sensor with a mixture of aberrations (a40:a31:a22 = 1:0.25:0.25) for a detector pixel size 2d = 3λF/# is very similar to the case of only spherical aberration, a40 = 1.25 λ, included in Figure 1b (Figure 1, Ref. [7]).
Figure 11 presents the OCE vs. EOD relationship for the FER system, featuring a mixture of aberrations (a40:a31:a22 = 1:0.25:0.25) for a large detector size, 2d = 7λF/#. The graph in Figure 11a is similar to that in Figure 2a, except that the first hump in Figure 2 near EOD = 0.45 is more pronounced in Figure 11a than in Figure 2a. The OCE vs. EOD curve for the FER and an unobstructed lens, presented in Figure 2a, for the same mix of aberrations and for the same large pixel are shown in Figure 11b for comparison. In the figure, the heavy solid line is the imported one.
5. Applicability to Actual, Functioning Imaging Sensors
We outline the salient features identified during the studies of the OCE vs. EOD relationship. First, we conclude that, for a rotationally symmetric imaging sensor with a moderate field of view, the results for an ideal lens depicted in Figure 1 and Figure 2 represent a good design reference.
Next, we examine the applicability of the performance measures derived for the reflective three-mirror (RTM) system and the four-element refractive (FER) system to four optical systems, frequently utilized in remote sensing in the following: modified Cooke triplet, Offner relay system, three-mirror anastigmat (TMA), and wide angle, large reflective unobscured system (WALRUS) [9]. We assess the possibility of whether their layouts and symmetry considerations allow them to be described similarly to the systems analyzed in Section 3 and Section 4. This would facilitate their first-order characterization using the results developed there.
5.1. Modified Cooke Triplet [10]
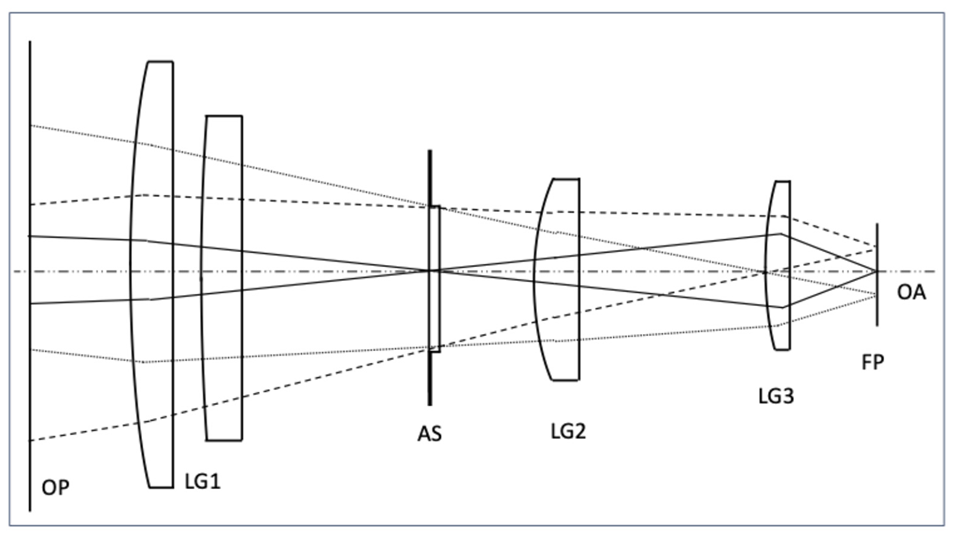
For the application of the FER study in Section 4, a modified Cooke triplet [10], presented in Figure 12, may be highly representative. It incorporates two quasi-symmetrical Schmidt designs with a shared corrector (phase) plate at the optical stop.
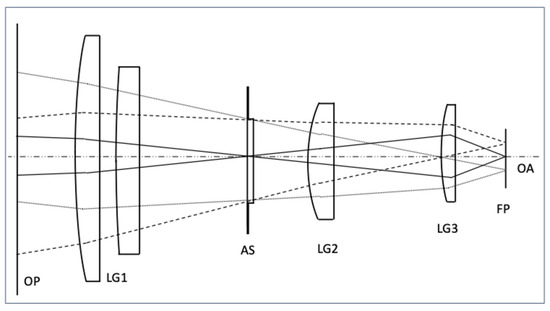
Figure 12.
Modified Cooke triplet, after US Patent 10,007,098 [10]. Other annotations: OP—object plane; LG1—lens group 1; LG2—lens group 2; LG3—lens group 3; AS—aperture stop; FP—focal plane; and OA—optical axis. The original figure from the patent, illustrating the full details, is reproduced in Appendix B.
The design is in some sense similar to the FER in Figure 9; it is rotationally symmetric while it additionally features a moderate field of view. In fact, the FER layout may be seen as a simplified rendition of the design presented in Figure 12, but without the phase plate. Thus, we may reasonably expect that the results exhibited in Figure 10a and Figure 11a are also applicable to the characterization of the modified Cooke triplet.
5.2. Offner Relay System [11]
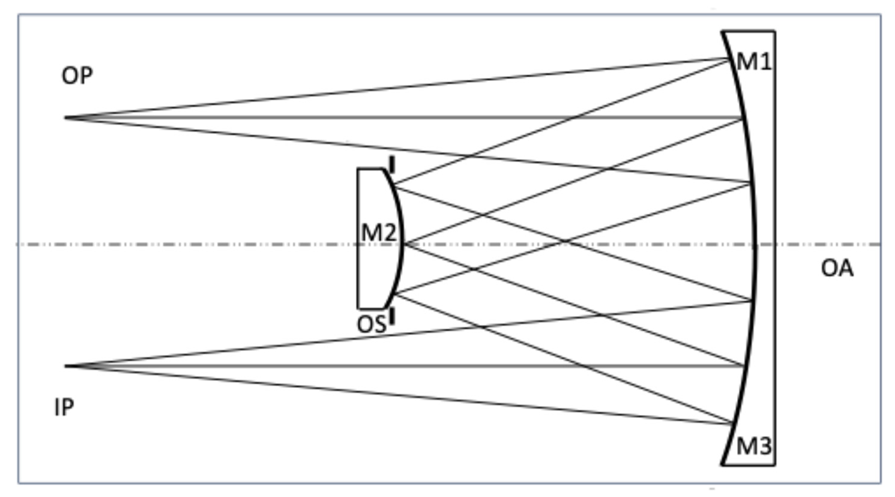
The same conclusion may be drawn about the Offner relay system [11], displayed in Figure 13. This is a one-to-one, finite conjugate, symmetric layout with respect to the optical stop at the secondary mirror. The system is concentric as follows: mirror M1 is integrated with mirror M3, and mirror M2 features literal top–bottom symmetry with respect to the optical axis.
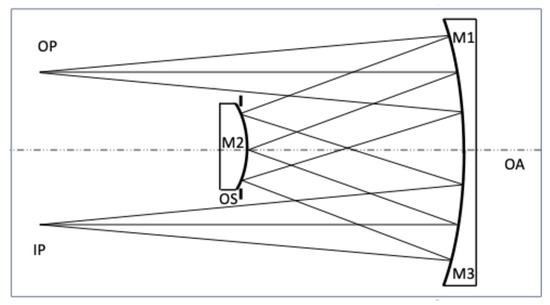
Figure 13.
Offner relay system where the optical axis, OA, is normal to the second mirror, M2. The optical stop, OS, is located at the second mirror M2. The same physical object may serve as the first and third mirrors, M1 and M3. Other annotations: OP—object point; and IP—image point.
5.3. Three-Mirror Anastigmat (TMA) [12,13,14,15]
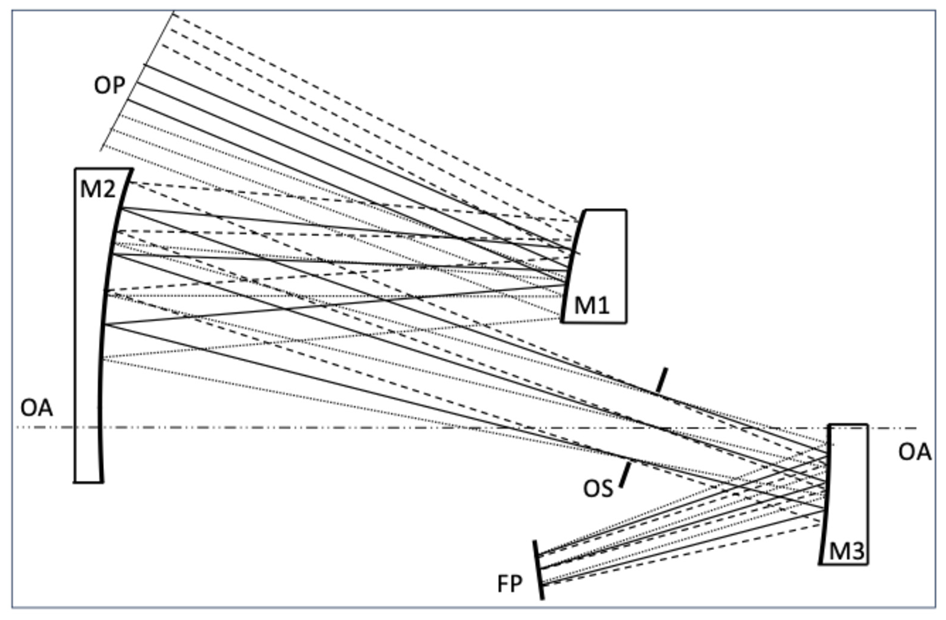
Lastly, as a possible application of the RTM study in Section 3, we turn our attention to the case study of three-mirror anastigmat (TMA) [12,13,14,15], exhibited in Figure 14. At first sight, its configuration appears quite similar to the RTM, displayed in Figure 6. However, the TMA places the optical stop at the primary mirror. We note, furthermore, that the RTM has the optical stop at the secondary mirror, and it presents relatively more rotational symmetry with respect to the optical axis than the TMA.
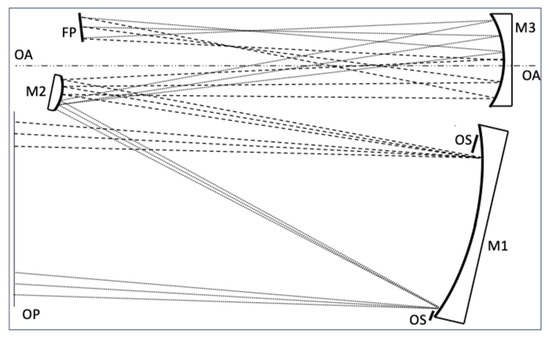
Figure 14.
TMA optical layout indicating the salient features, after Ref. [14], EP Patent 019447. The optical stop, OS, is located at the first mirror, M1. The optical axis, OA, is perpendicular to mirror M3. Other annotations: OP—object plane; M2—mirror 2; and FP—focal plane. The original image from the patent, illustrating the full details, is reproduced in Appendix B.
The TMA configuration is highly suitable for the stray light control in IR systems. The TMA forms an intermediate focus near the secondary mirror. Consequently, the mirror M1 becomes very fast, meaning, it assumes a low F/#. This makes it very sensitive to both decenter and tilt. The entire optical system is prone to astigmatism, caused by any small environmental disturbance. Therefore, the results in either Figure 7 or Figure 8a are obviously not applicable to the TMA.
5.4. Wide (WALRUS) [16]
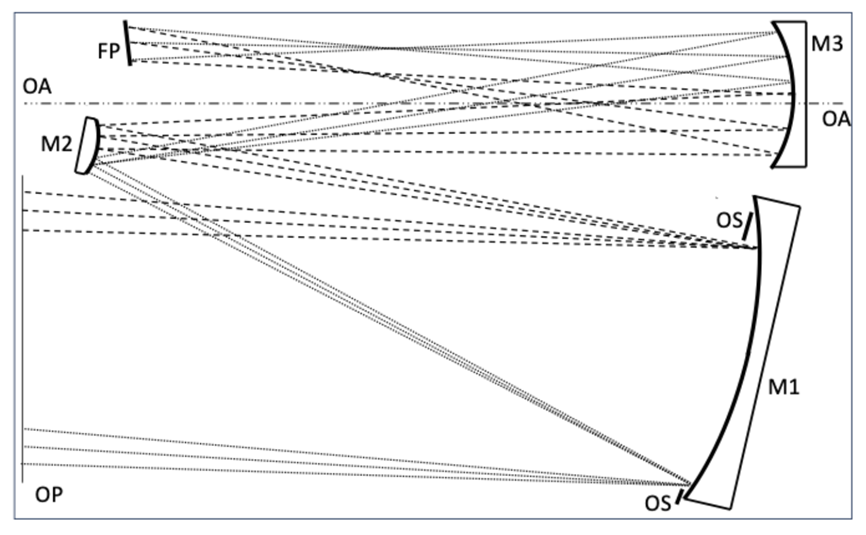
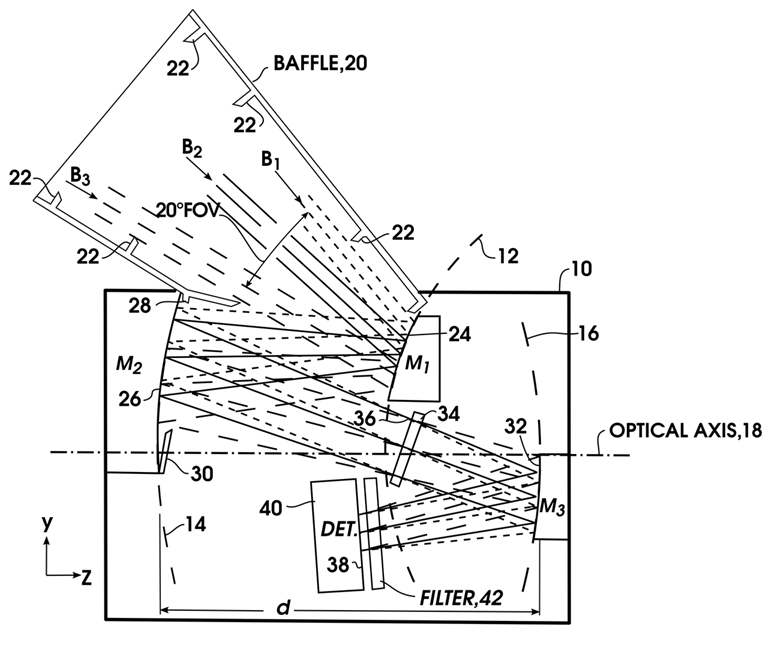
Hopes might also arise that the RTM analysis may be applicable to the case of the wide angle, large reflective unobscured system (WALRUS) [16], laid out in Figure 15. This features an offset angle of about 45°, with a large field of view of 20° x 30°. Clearly, the complete system is not rotationally symmetric with respect to the optical axis, OA. Therefore, the performance figures of merit of the RTM (Figure 7 and Figure 8a) unfortunately cannot be applied to WALRUS.
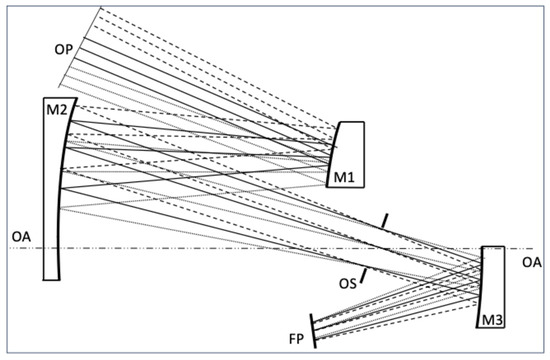
Figure 15.
Optical layout of the WALRUS design, after U.S. Patent 4,598,981 [16]. The optical stop, OS, is located between the second and the third mirrors, M2 and M3. The central unbroken line at the object plane, OP, and the optical axis, OA, forms an offset angle of about 45°. M1 denotes the first mirror, and FP denotes focal plane. The original image from the patent, illustrating the full details, is reproduced in Appendix B.
6. Discussion
We introduced two new figures of merit, OCE and EOD, that are applicable to sensors that incorporate focal plane arrays with individual detector pixels. Next, we assessed the current designs of image-forming sensors, presented some guidelines to incorporate focal plane array pixels of a sufficiently large size, and discussed potential future applications.
6.1. Assessment of Current Designs for Image-Forming Sensors
Herein, a summary of treatises in all three parts is given as follows. First, in Part 1, we developed the theory and analyzed the OCE vs. EOD trend of an ideal lens with and without central obscuration. We carried out this analysis for two different detector sizes. Some important factors that contribute to the correlation between OCE and EOD are as follows:
- (a)
- The convolution of the psf and detectors with different pixel sizes, i.e., the relationship between the radius of the Airy disk (the first zero of psf) and the detector size;
- (b)
- The extra diffraction created by a non-rotationally symmetric central obscuration perturbs the psf shape as follows: it redistributes the energy within the psf; hence, after convolving with a rectangular detector for different sizes, the trend disintegrates into a characteristic shape with an extra peak for low values of EOD; and
- (c)
- The prf profiles provide a great deal of insight for understanding OCE vs. EOD trends.
Second, in Part 2, a parametric study of the OCE vs. EOD trend based on classical third-order Seidel aberrations was performed. It included spherical, coma, and astigmatism aberrations and defocus, for two different detector sizes. Special attention was paid to spherical aberration, an on-axis aberration that impacts most optical systems, including the original Hubble telescope. In the case of spherical aberration, with the knowledge base that we have accumulated up to now, it is interesting to observe diverse behaviors around the lower EOD region for different detector sizes. Again, a prf plot combined with the knowledge of the wavefront error for the spherical aberration proves to be a powerful and convincing tool for understanding the variations in the trend as a function of wavefront error and detector size. Along with that, the trends of coma, astigmatism, and defocus for the two different detector sizes were also presented.
These trends may be explained by the combination of the individual wavefront error functional forms and their related psfs, diffraction distributions arising from different apertures, detector pixel sizes, and the associated convolutions. Due to their inter-connectivity, mathematical descriptions are not repeated. They are somewhat tedious and, for the most part, unnecessary. To an experienced optical instrument designer, the ray-trace results sometimes provide intuitive insights, which are needed to predict image quality. The reader is invited to run Code VTM and MatlabTM to obtain details related to their design results.
Interestingly, we not observe a correlation between OCE and EOD for any Seidel aberration or pixel size across the entire EOD range.
Third, in this paper, we analyzed several cases with a mix of third-order Seidel aberrations, with a combination of aberrations (a40:a31:a22 = 1:0.25:0:25). This combination of aberrations is added to the entrance pupil in CodeV for two different detector sizes.
We started with the case of a lens with and without a central obscuration. For the case without central obscuration, the relationship between OCE and EOD is dominated the spherical aberration; therefore, the results of the individual spherical aberration study may be safely applied, without giving rise to concerns that significant errors might be committed.
As the detector pixel size decreases, and especially in the presence of central obscuration, the OCE vs. EOD relationship might introduce an anomaly into its shape, as follows: OCE decreases while EOD increases. We did not observe any correlation between OCE and EOD for the chosen representative mix of Seidel aberrations.
In the second part of the current publication, the same mix of aberrations was applied to several representative optical systems, often employed in diverse imaging and remote sensing applications. An all-reflective three-mirror and a four-element refractive system were analyzed for two different detector sizes.
Close similarities could be observed between the individual Seidel spherical aberration trends in both systems (RTM and FER), except in the case of the small detector in the RTM configuration. There we noted a correlation between OCE and EOD for a significant range of EOD values (corresponding to the wavefront errors). Interestingly though, the slope is negative.
6.2. Design Guidelines for Incorporating Focal Plane Array Pixels of a Sufficiently Large Size
A well-designed imaging sensor incorporates a detector pixel that collects more than 60% of energy emitted by the conjugate object point, not counting the surface reflections or scattering. With this practical guideline, we observe that the studies presented here exhibit the intuitively expected relationship that OCE increases with the increase in EOD for EOD values larger than 0.6. Otherwise, the signal-to-noise ratio between the signal-carrying pixel and its neighbors is not sufficiently high to detect the signal.
As an example of this practical guideline, we consider a checker-board object where each bright pixel is surrounded by four dark pixels. When EOD for the bright signal pixel is 0.5, 0.125 OED spills on the nearest right, left, top, and bottom pixels. Each of those is surrounded by four bright immediate neighbors, each of which spills 0.125 OED energy on it, resulting in a dark pixel likewise receiving 0.5 OED. Thus, the pixel that is a conjugate point to the dark object point receives the same amount of energy (on the detector pixel), as the bright object-signal pixel. An EOD of 0.5 for a signal pixel and for the dark pixel results in a complete image washout. An EOD slightly larger than 0.5, let us say of 0.6, might be sufficient for the detection of a signal pixel, depending on the applications and the willingness to perform additional image processing.
The two exceptions to the relationship that OCE increases with the increase in EOD both refer to the small pixel. The negative slope in Figure 3, for the relationship between OCE and EOD for a lens with a large asymmetrical central obscuration, gives rise, in Figure 5, to a positive correlation between OCE and EOD for the large pixel, for EOD values larger than 0.6. Similarly, the negative slope in Figure 7 for the OCE vs. EOD relationship for the RTM incorporating a small pixel is replaced in Figure 8, with a relationship showing that OCE increases with the increase in EOD for EOD values larger than 0.6.
These examples illustrate that the relationship between OCE and EOD may be used to select the detector pixel size for optimal sensor performance.
6.3. Potential Future Applications
In summary, the relationship between OCE and EOD is complicated and sensitive to the aberration, type of aberration, shape and size of obscuration, diffraction, the product λF/#, and detector size.
Most importantly, we did not find a rule or even a law of invariance for the OCE vs. EOD relationship, for any optical system, for either of the two pixel-sizes, except for a large pixel size in the higher EOD region, that is, featuring small amounts of aberrations. Therefore, one cannot simply use a peak EOD value as a valid sensor performance predictor to have a meaningful estimate of the performance for a huge detector array under statistically variable conditions.
Rather, for a given optical sensor expected to function in demanding environments, a thorough computation of the OCE and EOD, according to the procedure outlined in Section 4 of Part 1 [6], is recommended. This step is especially critical when analyzing tilted and decentered (TMA) systems.
EOD and OCE provide significant insight into the performance of the sensor during the evaluations of the image quality. After optical system optimization that satisfies the imaging and space-envelope constraints, a trend of OCE vs. EOD over a certain interval of EOD values might be beneficially included in the final tolerance analysis when a decision is rendered about detector pixel size. Some iterations with different detector pixel sizes are highly recommended, because they are needed for the optimal instrument performance when designed for unknown operating conditions.
However, when the knowledge related to OCE and EOD becomes critical, such as in a space surveillance sensor for a point source detection, then, a credible vacuum cold test under all the required environmental conditions would preferably be implemented. Testing EOD, prf, OCE, and a thermal optical model at the operational temperature (for example, a thermal Nastran) may have to be performed. An unexpected environmental disturbance could take place, such as, for example, excessive lunch vibrations or unwanted solar illumination and heating. Then, the baseline Nastran model may be modified with the new parameters using a desired number of nodes. Consequently, new information provoked by the unwanted impact on each optical surface may be acquired and modeled for each optical component and its parameter as follows: (i) decentering and translation, x, (ii) rotation, α, β, and γ; and (iii) generation of a new set of Zernike polynomials best-fitted to each optical surface.
After importing these new data sets into Code V and MatlabTM, the updated, correct knowledge of the relationship between OCE and EOD may be re-established. With the revised input, a genuine sensor performance prediction may then be had.
The application of this new image assessment and enhancement technique with the employment of optimized hardware is unlimited. Both the analytical approaches themselves and the specific results, when appropriately applied, have been conceived for space surveillance and/or remote sensing. These sensors are expected to function under conditions of uncertainty, where instrument settings and operational conditions may not be measured, known, or updated. The image assessment techniques, described here, may be even more beneficially applied in the realm of medical anomaly detection and medical diagnosis. The field of radiological imaging [17] is of special interest due to the proliferation of diagnostic instruments to extend life when the environmental contamination appears to be fueling the growth of cancer detection and diagnoses, even in young people.
Upon incorporating the new approaches and strategies introduced here into the early cancer-detection devices featuring high-performance megapixel FPA and advanced artificial intelligence (AI)-assisted algorithms, routine exams may be updated in digital mammography [18] or 3D mammography [19], using breast cancer as an example. Cancerous tissue, which evolves from a benign tumor, initially manifests itself as a point source. The changing environment in this case is the human body that may be updated during routine exams for optimized diagnostic instrument functioning.
An accurate data of early cancer tissue size, geometry, and thickness may be easily enhanced robotically, by improving hardware in situ, by updating the environment. We acknowledge that radiological imaging and optical/IR imaging may not be identical in all aspects, but the principles of their image science and data processing are the same [17,20].
Thus, the application of the technique of optimized sensor performance is particularly adaptable to medical imaging, where in situ fine tuning is possible. Imaging the same site is performed after set time intervals, so the instrument settings may be adjusted for individual series of observations. Instrument use in the medical field is therefore more flexible than in space systems where equipment is packaged early on for the anticipated rugged environment, without the possibility of further monitoring or fine tuning. It is designed for the worst-case scenario.
7. Conclusions
First, the results for an ideal lens depicted in Figure 1 and Figure 2 represent a good design reference for rotationally symmetric imaging sensors with a moderate field of view. If any of the conditions, including symmetry considerations or the moderate size of the field of view are not met, the example of a simple lens may not represent such an imaging system.
Second, the largest aberration in a mix of aberrations of an optical sensor dominates the OCE vs. EOD relationship, as demonstrated here for the spherical aberration.
Third, the size of the detector pixel may be adequate for the proper functioning of the sensor. It may not be necessarily sufficient or optimal for all sensing applications when OCE increases together with an increase in EOD, for an EOD larger than 0.6.
Author Contributions
Both authors contributed equally to this manuscript. Conceptualization, Y.W.; Methodology, M.S.; Investigation, Y.W.; Visualization, M.S.; Writing—original draft, Y.W. and M.S.; Writing—review and editing, M.S.; Writing—final, M.S. and Y.W. All authors have read and agreed to the published version of the manuscript.
Funding
This research received no external funding.
Data Availability Statement
The data presented in this study are included in this study.
Conflicts of Interest
The authors declare no conflicts of interest.
Appendix A
Figures from Refs. [6,7], illustrating the partial conclusions presented in Section 2.2, are included for the sake of completeness.
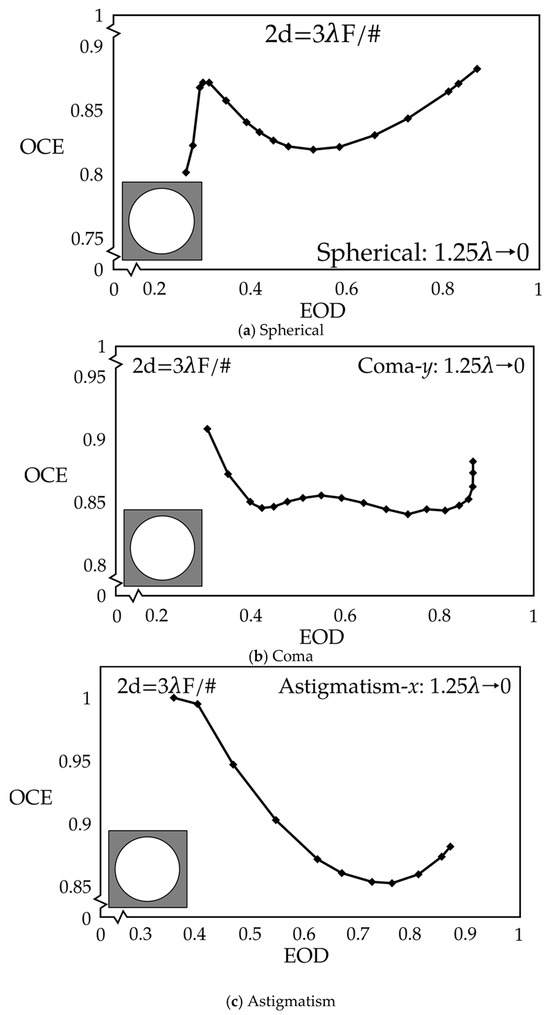
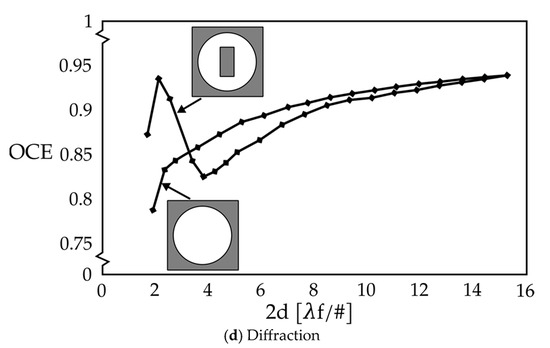
Figure A1.
OCE vs. EOD for (a) spherical, (b) coma, and (c) astigmatism for a small pixel size, and (d) the diffraction effects on the pixel size. (From Refs. [6,7]).
Figure A1.
OCE vs. EOD for (a) spherical, (b) coma, and (c) astigmatism for a small pixel size, and (d) the diffraction effects on the pixel size. (From Refs. [6,7]).
Appendix B
Copies of Figures from the reference patents are included for the sake of completeness. Their simplified versions are included in the main text.
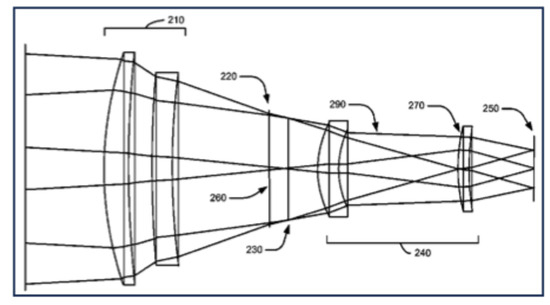
Figure A2.
Modified Cooke triplet, from U.S. Patent 10,007,098 [10], presented in a simplified form in Figure 11.
Figure A2.
Modified Cooke triplet, from U.S. Patent 10,007,098 [10], presented in a simplified form in Figure 11.
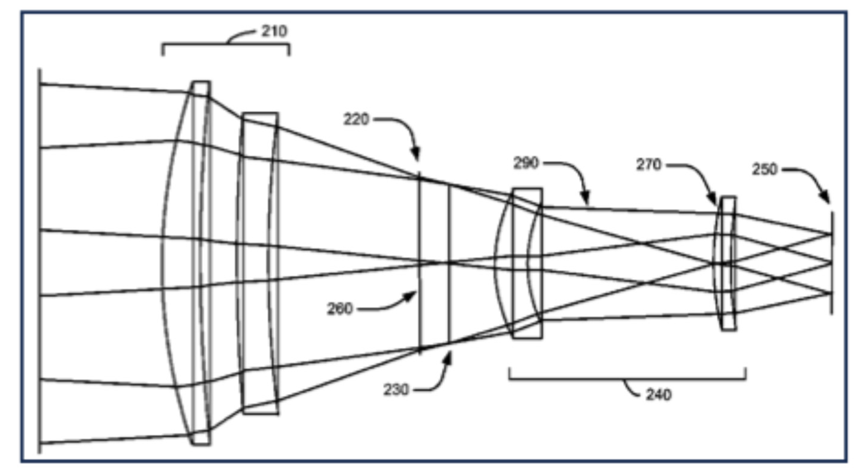
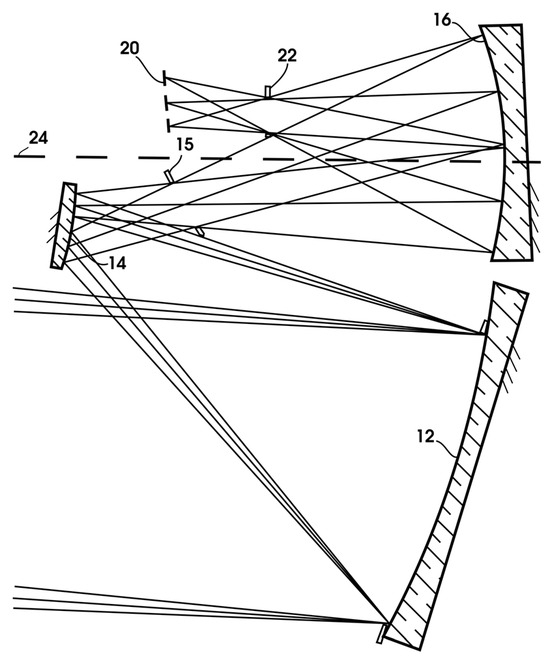
Figure A3.
Original TMA optical layout from Ref. [14], EP Patent 019447, presented in a simplified in Figure 14. The optical stop is located at Element 1, Item 12. A field stop is located at the intermediate focal point (Item 18). The Lyot stop is indicated as Item 22.
Figure A3.
Original TMA optical layout from Ref. [14], EP Patent 019447, presented in a simplified in Figure 14. The optical stop is located at Element 1, Item 12. A field stop is located at the intermediate focal point (Item 18). The Lyot stop is indicated as Item 22.
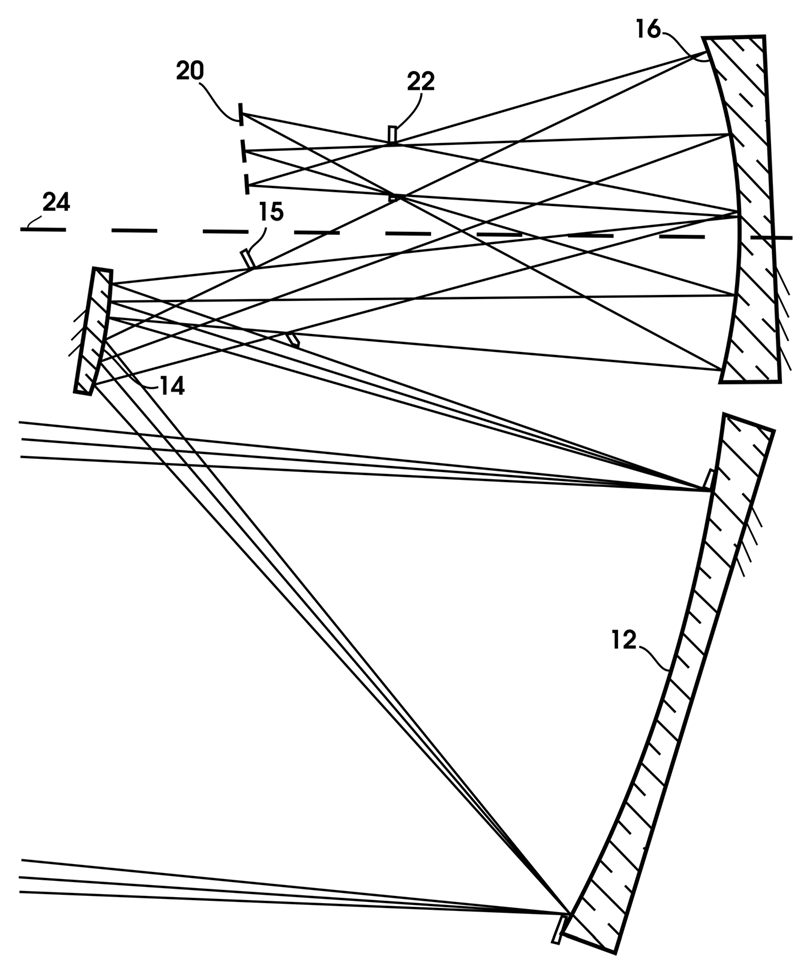
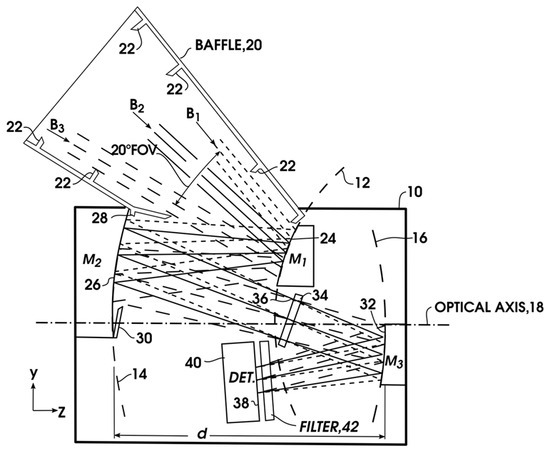
Figure A4.
Optical layout of the WALRUS design, from U.S. Patent 4,598,981 [16], presented in a simplified in Figure 15. The optical stop, Item 34, is located between the second and the third mirror; line B2 and the optical axis (Item 18) form an offset angle, which is about 45°.
Figure A4.
Optical layout of the WALRUS design, from U.S. Patent 4,598,981 [16], presented in a simplified in Figure 15. The optical stop, Item 34, is located between the second and the third mirror; line B2 and the optical axis (Item 18) form an offset angle, which is about 45°.
References
- Rauscher, B.J.; Fox, O.; Ferruit, P.; Hill, R.J.; Waczynski, A.; Wen, Y.; Xia-Serafino, W.; Mott, B.; Alexander, D.; Brambora, C.K.; et al. Detectors for the James Webb Space Telescope Near-Infrared Spectrograph I: Readout Mode, Noise Model, and Calibration Considerations. Publ. Astron. Soc. Pac. 2007, 119, 768–786. [Google Scholar] [CrossRef]
- Sutherland, W.; Emerson, J.; Dalton, G.; Atad-Ettedgui, E.; Beard, S.; Bennett, R.; Bezawada, N.; Born, A.; Caldwell, M.; Clark, P.; et al. The Visible and Infrared Survey Telescope for Astronomy (VISTA): Design, technical overview, and performance. Astron. Astrophys. 2015, 575, A25. [Google Scholar] [CrossRef]
- Asrar, G. Theory and Applications of Optical Remote Sensing; John Wiley & Sons: New York, NY, USA, 1989; pp. 491, 527. [Google Scholar]
- Schwartzschild, B. Hubble’s primary mirror has the wrong shape. Phys. Today 1990, 43, 17–19. [Google Scholar]
- Daniels, A. Field Guide to Infrared, Systems, Detectors, and FPAs, 2nd ed.; SPIE Press: Bellingham, WA, USA, 2010; p. 143. [Google Scholar]
- Strojnik, M.; Bravo-Medina, B.; Martin, R.; Wang, Y. Ensquared energy and optical centroid efficiency in optical sensors: Part 1, Theory. Photonics 2023, 10, 254. [Google Scholar] [CrossRef]
- Strojnik, M.; Martin, R.; Wang, Y. Ensquared energy and optical centroid efficiency in optical sensors: Part 2, Primary Aberrations. Photonics 2024, 11, 855. [Google Scholar] [CrossRef]
- Wetherell, W.B.; Womble, D.A. All-Reflective Three Element Objective. U.S. Patent 4,240,707, 23 December 1980. [Google Scholar]
- Strojnik, M.; Bravo-Medina, B.; Beltran-Gonzalez, A.; Wang, Y. Off-Axis Three-Mirror Optical System Designs: From Cooke’s Triplet to Remote Sensing and Surveying Instruments. Appl. Sci. 2023, 13, 8866. [Google Scholar] [CrossRef]
- Wang, Y. Optical System and Methods. US Patent 10,007,098, 26 June 2018. [Google Scholar]
- Offner, A. New concepts in projection mask aligners. Opt. Eng. 1975, 14, 130. [Google Scholar] [CrossRef]
- Williams, S.G.L. On-axis three-mirror anastigmat with an offset field of view. SPIE 1979, 183, 212. [Google Scholar]
- Cook, L.G. Three-mirror anastigmat used off-axis in aperture and field. SPIE 1979, 183, 207. [Google Scholar]
- Cook, L.G. Three-Mirror Anastigmat Used Off-Axis in Aperture and Field. EP Patent 019447, 15 May 1980. [Google Scholar]
- Korsch, D. Anastigmatic three-mirror telescope. Appl. Opt. 1977, 16, 2074. [Google Scholar] [CrossRef] [PubMed]
- Hallam, K.L.; Howell, B.J.; Wilson, M.E. Wide-Angle Flat Field Telescope. U.S. Patent 4,598,981, 8 July 1986. [Google Scholar]
- Barrett, H.; Myers, K. Foundations of Image Science; Wiley—Interscience: Hoboken, NJ, USA, 2004; p. 1085. [Google Scholar]
- Yaffe, M.J.; Mainprize, J.G. Digital mammography: The revolution in breast cancer screening. Radiol. Clin. N. Am. 2011, 49, 935–952. [Google Scholar]
- Rafferty, E.A.; Park, J.M.; Philpotts, L.E.; Poplack, S.P.; Sumkin, J.H.; Halpern, E.F.; Niklason, L.T. Assessing radiologist performance using mammography with digital breast tomosynthesis for breast cancer screening. Radiology 2013, 266, 104–113. [Google Scholar] [CrossRef] [PubMed]
- Barrett, H.; Swindell, W. Radiological Imaging; Academic Press: New York, NY, USA, 1981; pp. 3, 27, and 189. [Google Scholar]
Disclaimer/Publisher’s Note: The statements, opinions and data contained in all publications are solely those of the individual author(s) and contributor(s) and not of MDPI and/or the editor(s). MDPI and/or the editor(s) disclaim responsibility for any injury to people or property resulting from any ideas, methods, instructions or products referred to in the content. |
© 2025 by the authors. Licensee MDPI, Basel, Switzerland. This article is an open access article distributed under the terms and conditions of the Creative Commons Attribution (CC BY) license (https://creativecommons.org/licenses/by/4.0/).

