Experimental Study on Fiber Optic Strain Characterization of Overlying Rock Layer Movement Forms and States Using DFOS

 ,
, 
 ,
,
Abstract
1. Introduction
2. Distributed Fiber Optic Sensing Technology Based on BOFDA
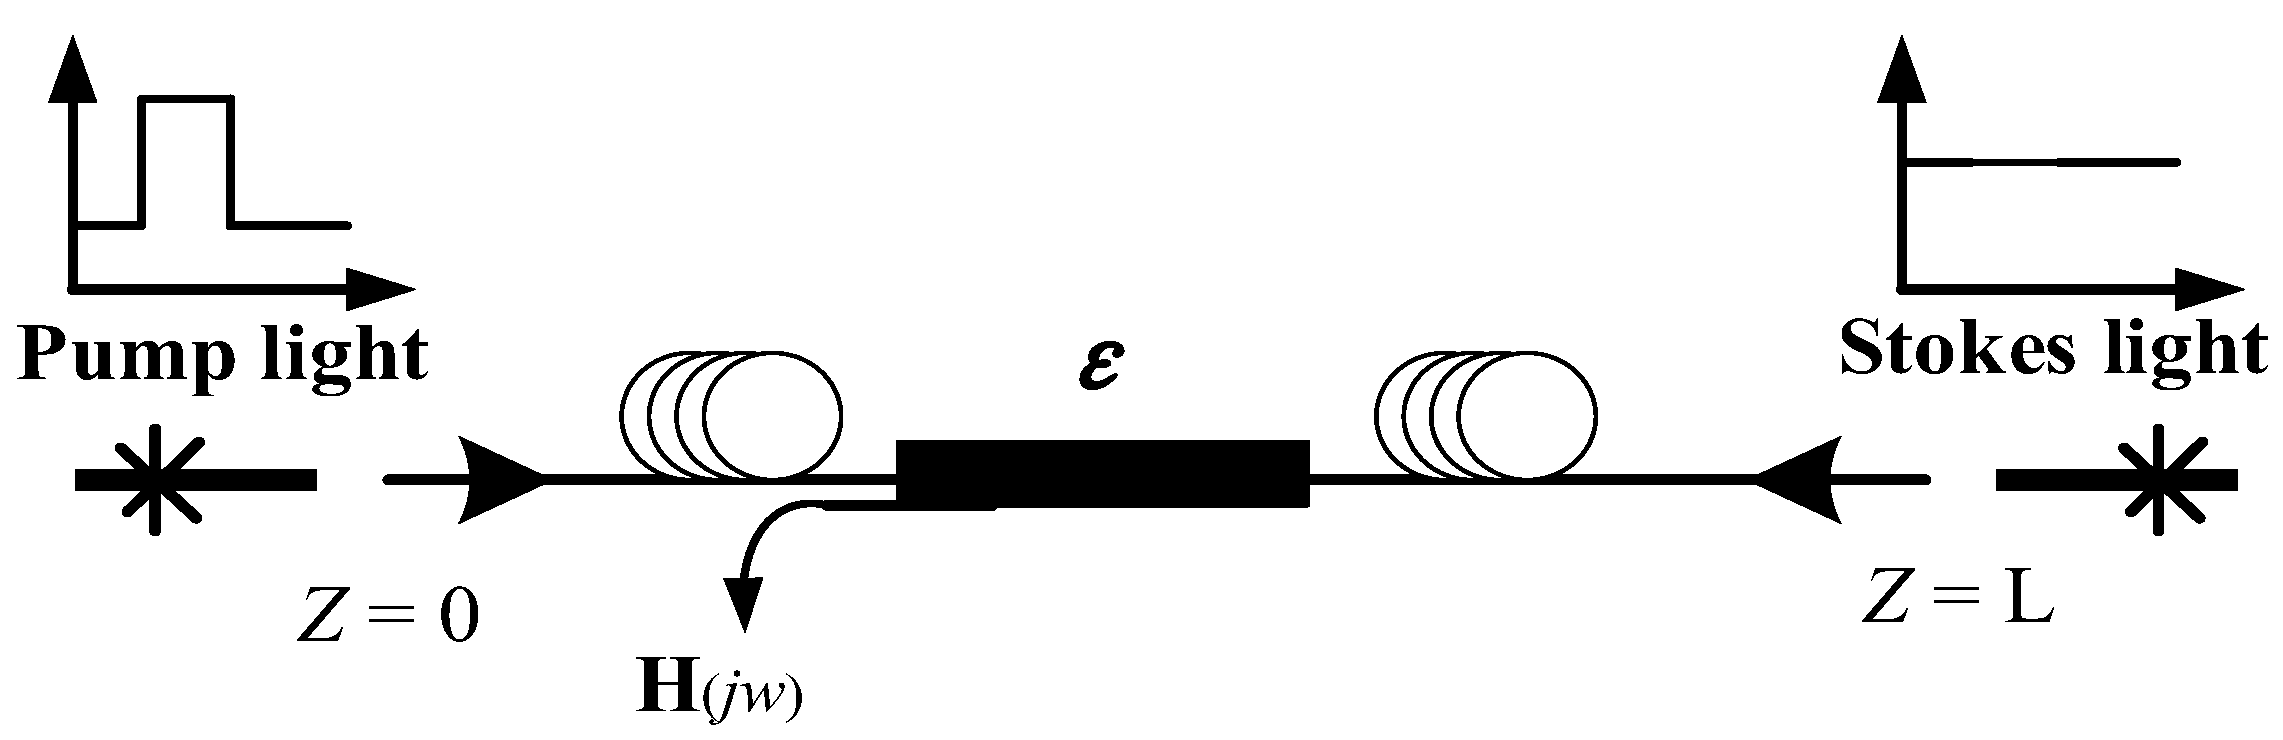
2.1. The Sensing Principle of BOFDA
- (1)
- When the rock strata are subjected to shear stress or tensile stress, the buried optical fiber will be stretched, resulting in an increase in the Brillouin frequency value.
- (2)
- The separation of fractured rock blocks, such as when these blocks detach from the original rock layer and collapse or rotate around it, will also exert tensile effects on the buried optical fibers. Consequently, the Brillouin frequency value will increase.
- (3)
- Conversely, if the loosely stacked fractured rock blocks are subjected to compaction, the gaps between the rock blocks will gradually decrease. The optical fibers embedded in the original rock layer will be correspondingly compressed axially. The tension previously induced in the fibers by the collapse and rotation of the rock blocks will gradually diminish, inevitably leading to a gradual decrease in the Brillouin frequency value.
2.2. Key Parameters of BOFDA
2.2.1. The Maximum Sensing Distance of BOFDA
2.2.2. Spatial Resolution Accuracy
2.3. Measuring Instrument fTB2505 of BOFDA in the Study
2.4. Theoretical Analysis of BOFDA Characterization
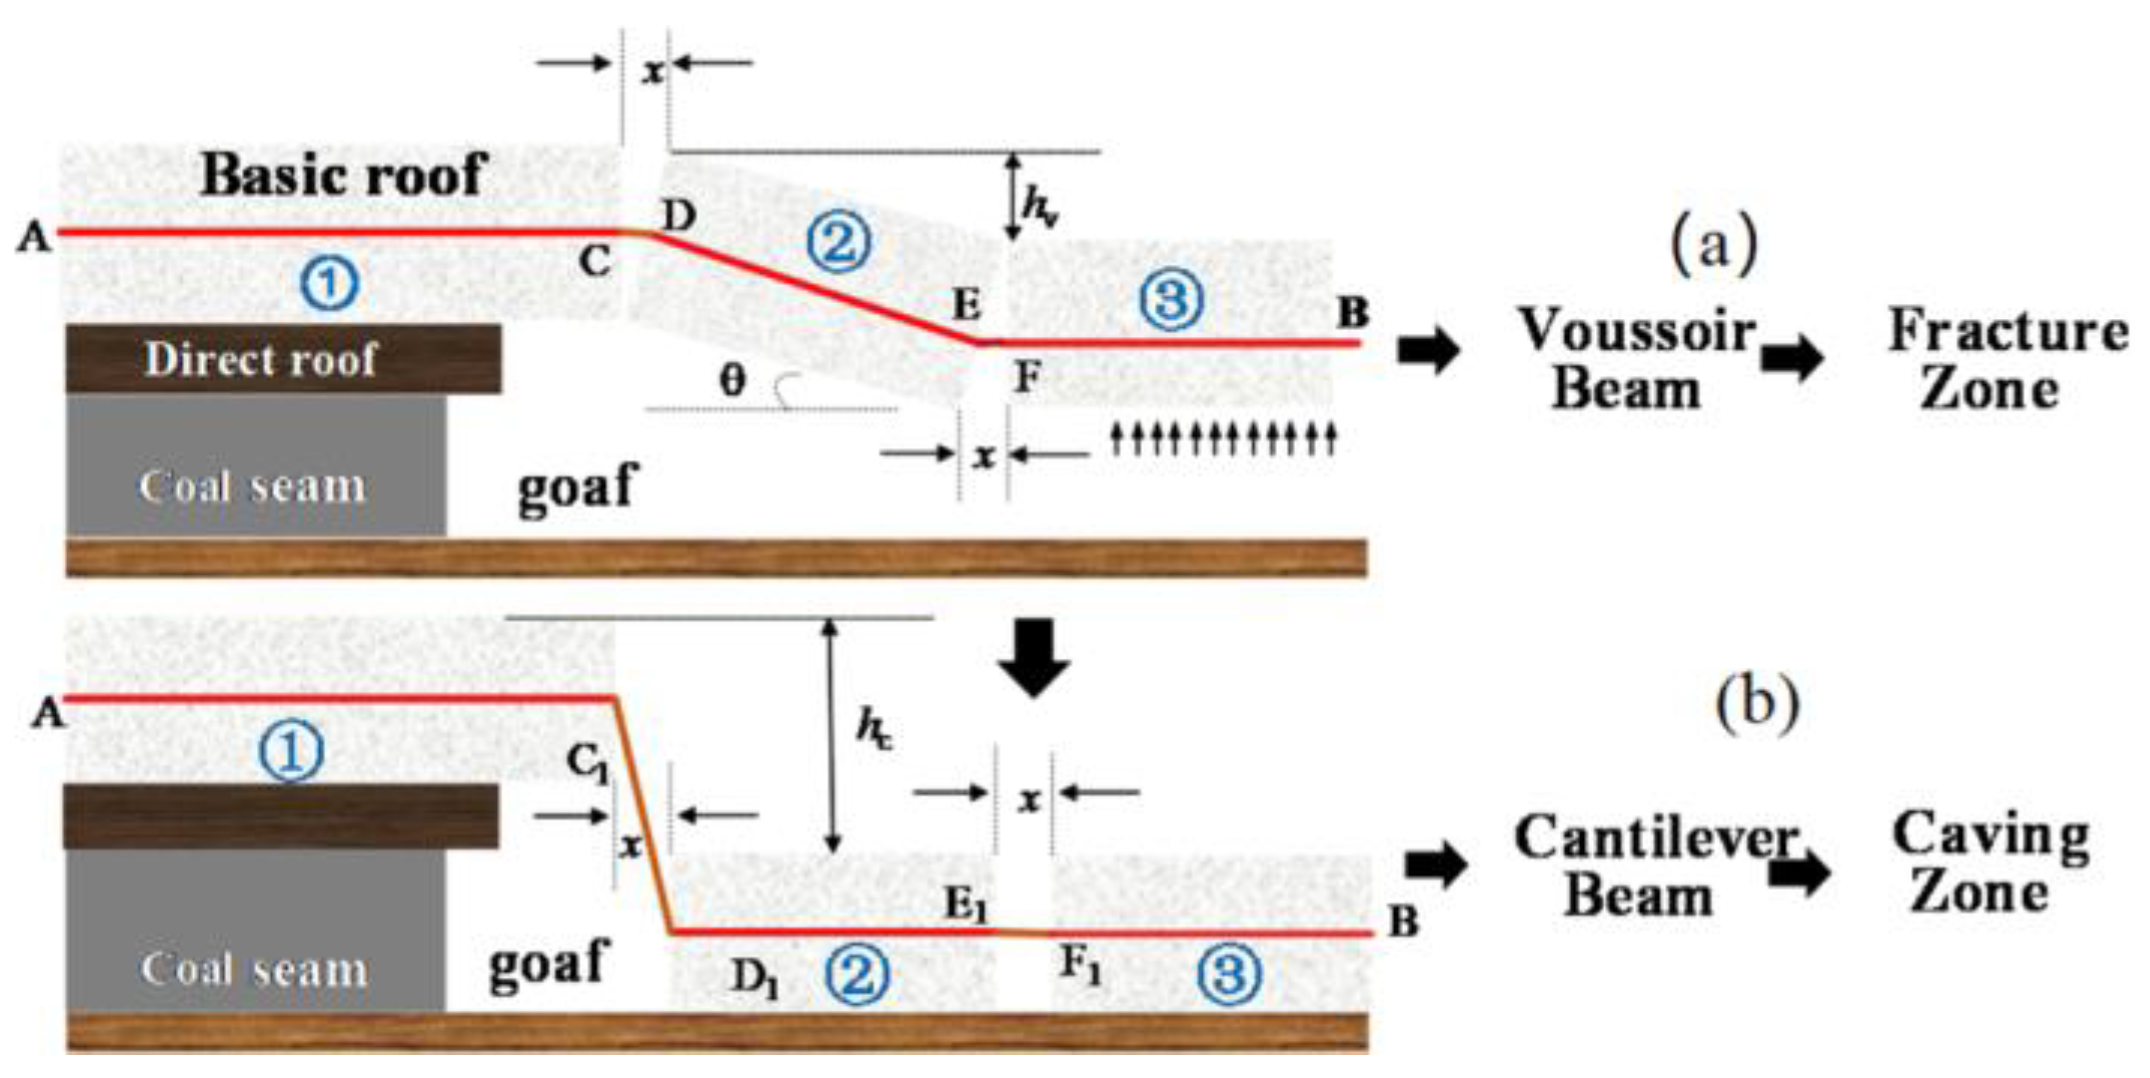
2.4.1. Horizontal Optical Fibers to Characterize Rock Blocks Movement
- Assuming the thicknesses of the basic roof is H, the initial crack width with the overburden is ignored.
- The initial stretch of the optical fiber in the basic roof deflection zone CE is , which is not less than the spatial resolution of BOFDA (i.e., CE = .
- The fiber optic strain of the deformed fiber CE section is .
- The rotation angle between blocks ①~② and ②~③ is ; its maximum value is .
- The width of the fissure between the fractured blocks is x, and its maximum value is .
- In the voussoir beam, the settlement displacement of blocks ② and ③ is .
- In the cantilever beam, the settlement displacement of blocks ② and ③ is .
- (1)
- Fiber optic strain (FOS) characterizing voussoir beam movement.
- (2)
- Characterization of the cantilever beam structure movement
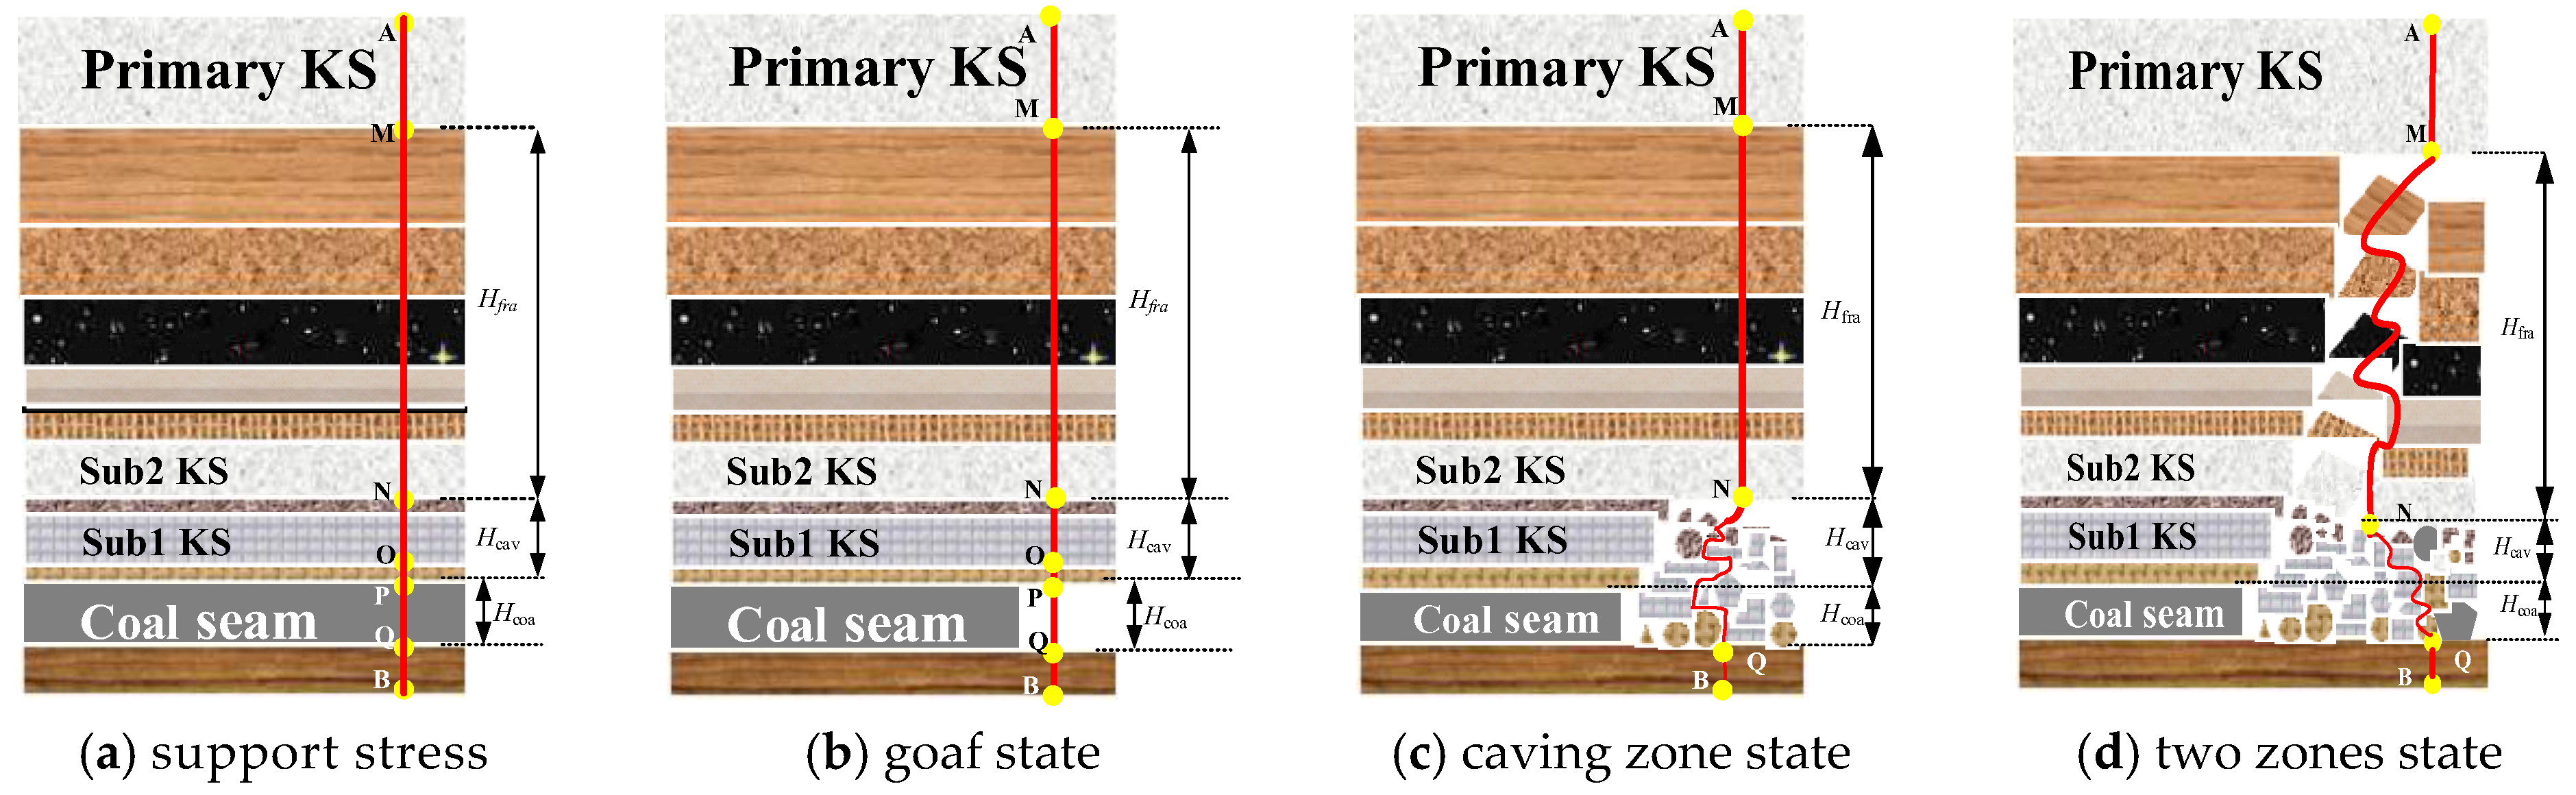
2.4.2. Vertical Optical Fibers to Characterize Rock Block Movement
- (a)
- The lower segments of the fiber are situated within bracing stress regions ahead.
- (b)
- The lower portions of the fiber are in the goaf scope.
- (c)
- The lower part of the fiber optic cable is in a state affected by rock masses caving, while the upper part is in a state of original rock stress.
- (d)
- The lower segment of the optical fiber is seated within caving zones affected by the fragmentation and expansion of gangue, while the upper portion is in the range of the fracture zone with the voussoir beam’s movement state, as illustrated in Figure 6.
- (1)
- Fiber optic strain (FOS) characterization of the cantilever beam movement forms
- (2)
- Fiber optic strain (FOS) characterizes the voussoir beam movement
3. Similar Simulation Experiment Based on BOFDA DFOS
- (1)
- Research on fiber optic selection. This process mainly included calibrating the strain coefficient, temperature coefficient, and strain transmission efficiency coefficient.
- (2)
- Construction of SSE models and layout of the optical fibers.
- (3)
- Calibration of the fiber optic position. This involved locating the fiber optic position along its length in the spatial position of the experimental model through fiber optic experiments.
- (4)
- Fiber optic strain testing by BOFDA.
- (5)
- Other experimental tasks. This mainly included monitoring data acquisition, processing and analysis of the data, and finally, the interpretation of experimental phenomena.
3.1. Experimental Study on Fiber Optic Selection
3.1.1. Calibration of Fiber Optic Strain Sensing Coefficient
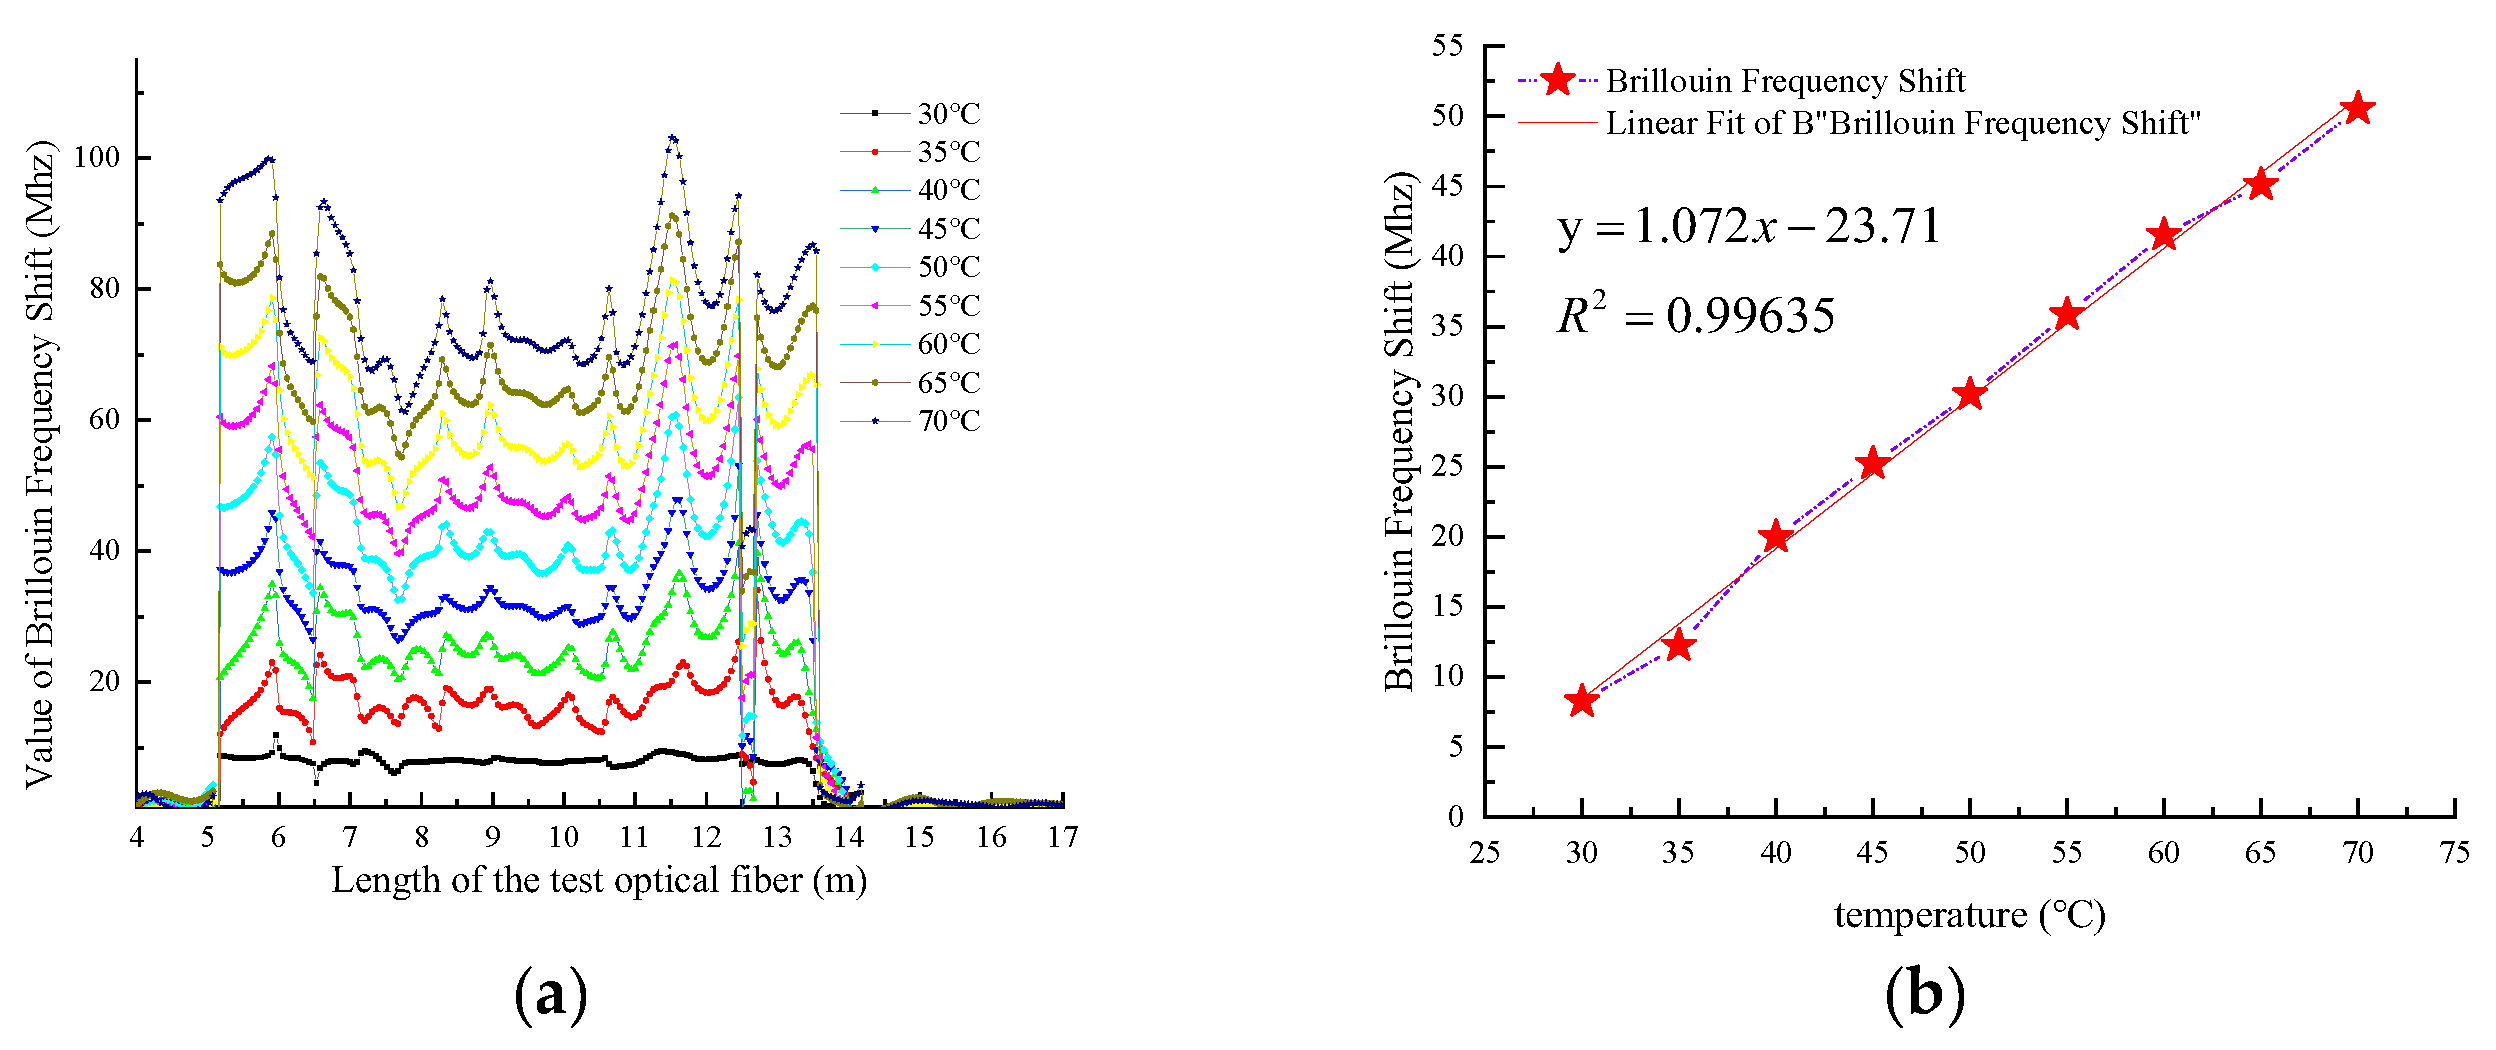
3.1.2. Calibration of Fiber Optic Temperature Sensing Coefficient
3.1.3. Calibration of Fiber Optic Strain Transfer Efficiency
3.1.4. The Influence of Temperature on Strain Testing in BOFDA Measurement
- (1)
- When the temperature changes little and remains basically constant.
- (2)
- When temperature changes exceed 5 °C, temperature compensation is necessary for fiber optic strain testing to eliminate errors in strain monitoring caused by temperature fluctuations. Several methods can achieve this:
- Parallel loose tube fiber: Place a loose tube fiber of the same length parallel to the strain fiber. Since the loose tube fiber is minimally affected by strain, it can compensate for temperature effects on the strain data.
- Relaxed fiber section: Reserve a relaxed fiber section of the same type between the strain-testing fiber and the DFOS analyzer under identical temperature conditions. This section, unaffected by strain, allows one to subtract the strain-testing fiber’s Brillouin frequency shift from the relaxed fiber’s average shift for temperature compensation.
- FBG temperature sensors: Connect fiber Bragg grating (FBG) temperature sensors in series with strain-sensing fibers at regular intervals for temperature compensation.
- Machine learning: Apply machine learning and other AI techniques to analyze the monitoring data and eliminate temperature-related influences.
3.2. Construction of Similar Simulation Experiment Model for BOFDA Characterization
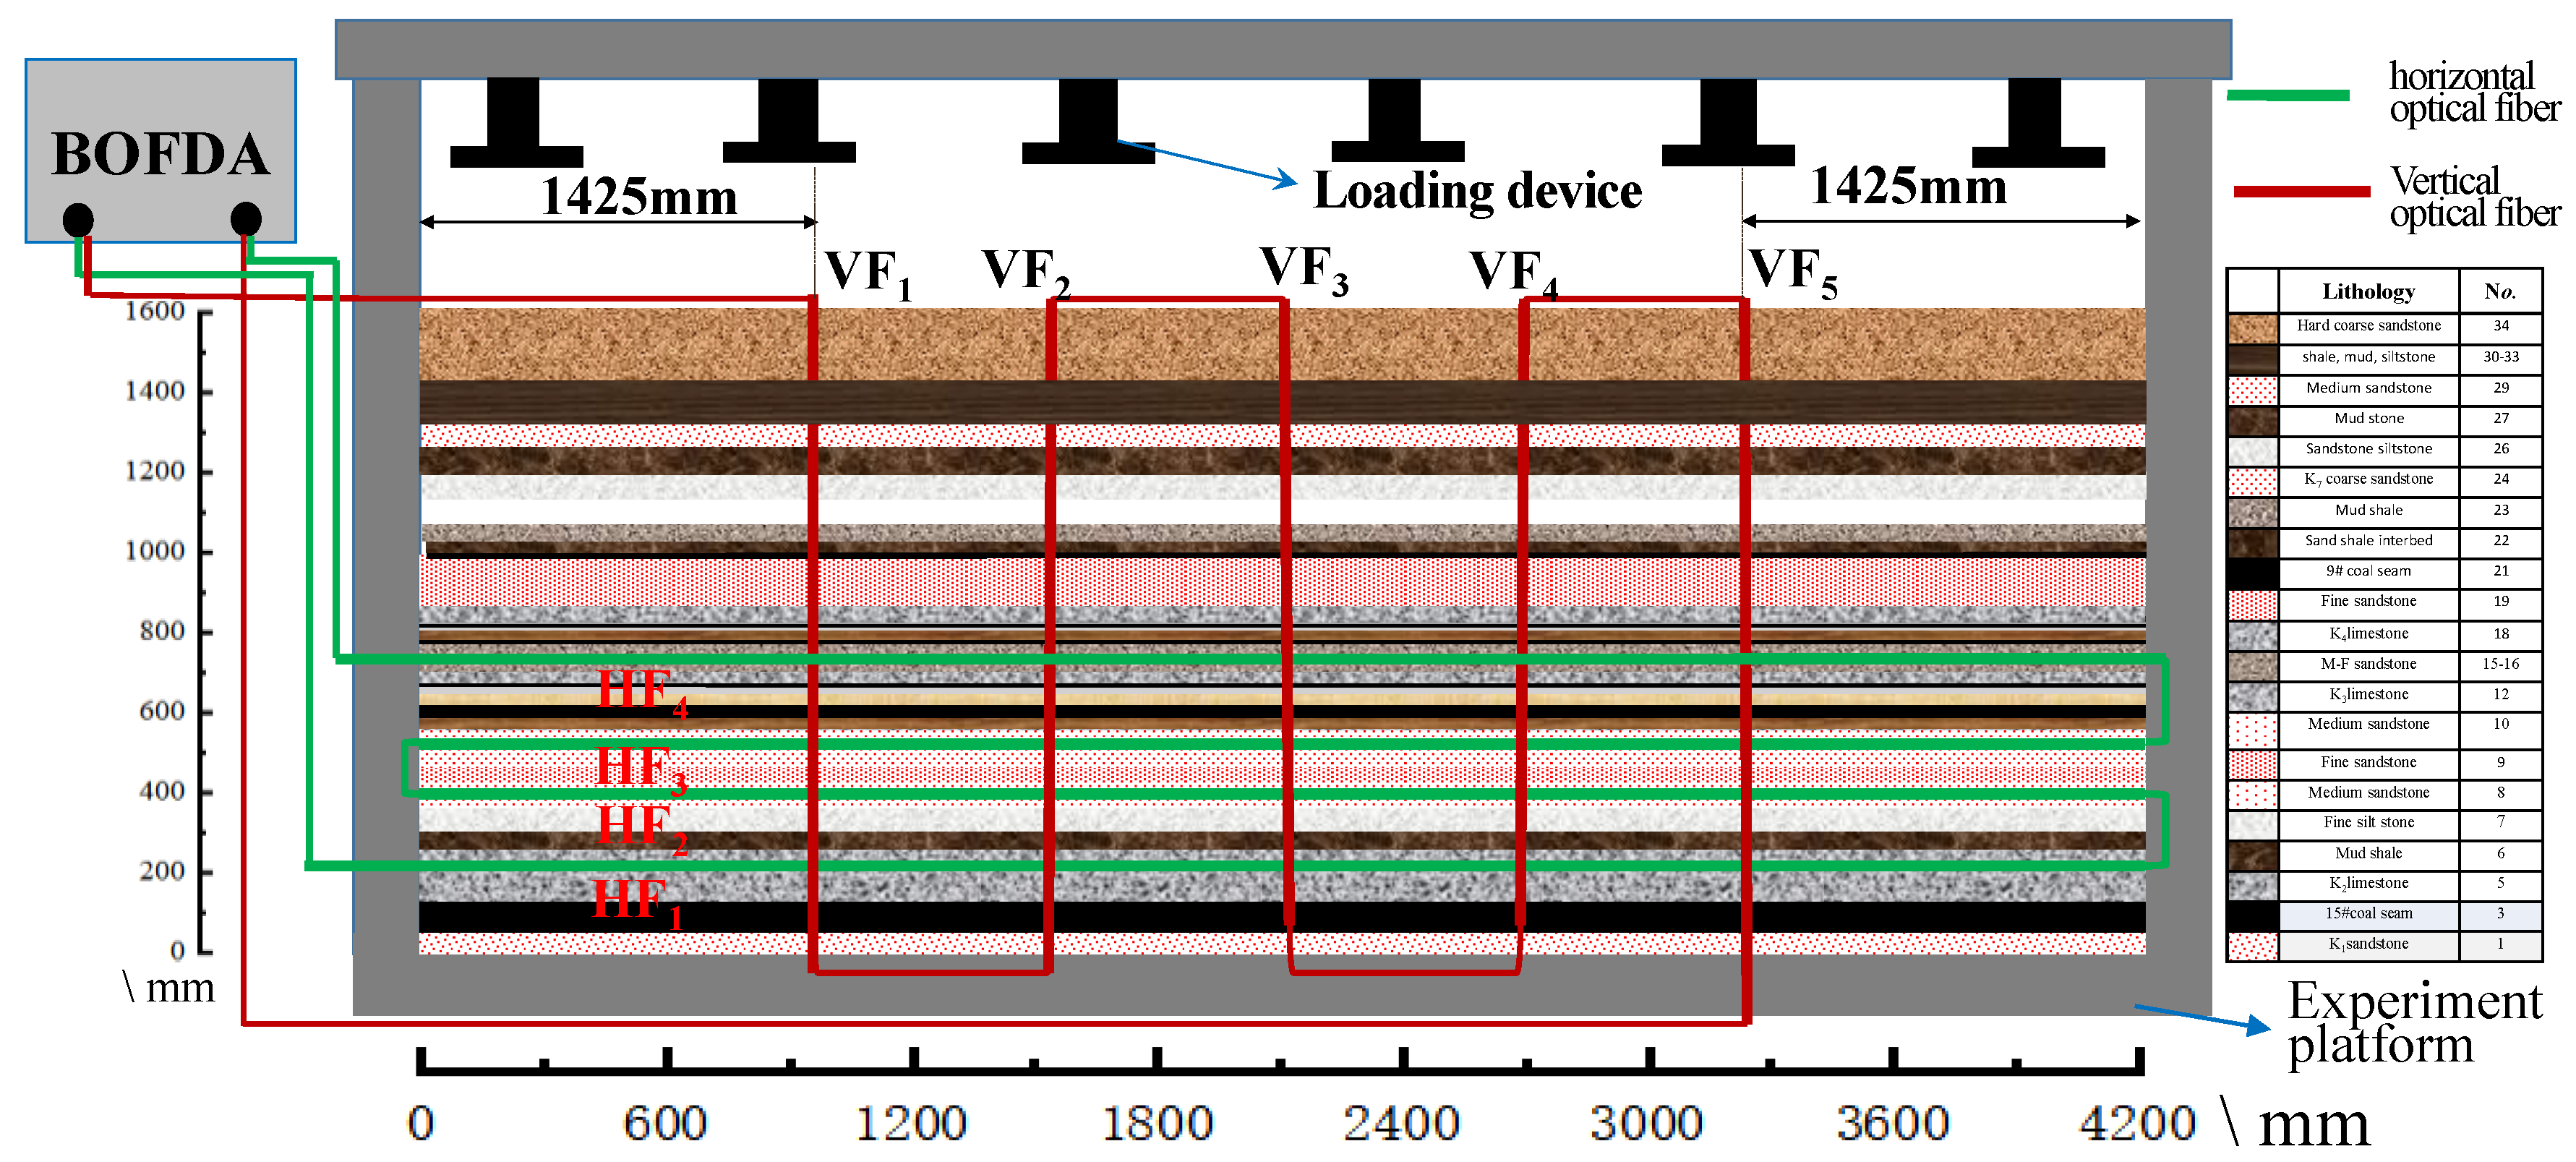
3.2.1. Fiber Optic Layout for the Similar Simulation Experiment
3.2.2. Position Calibration of the Optical Fibers
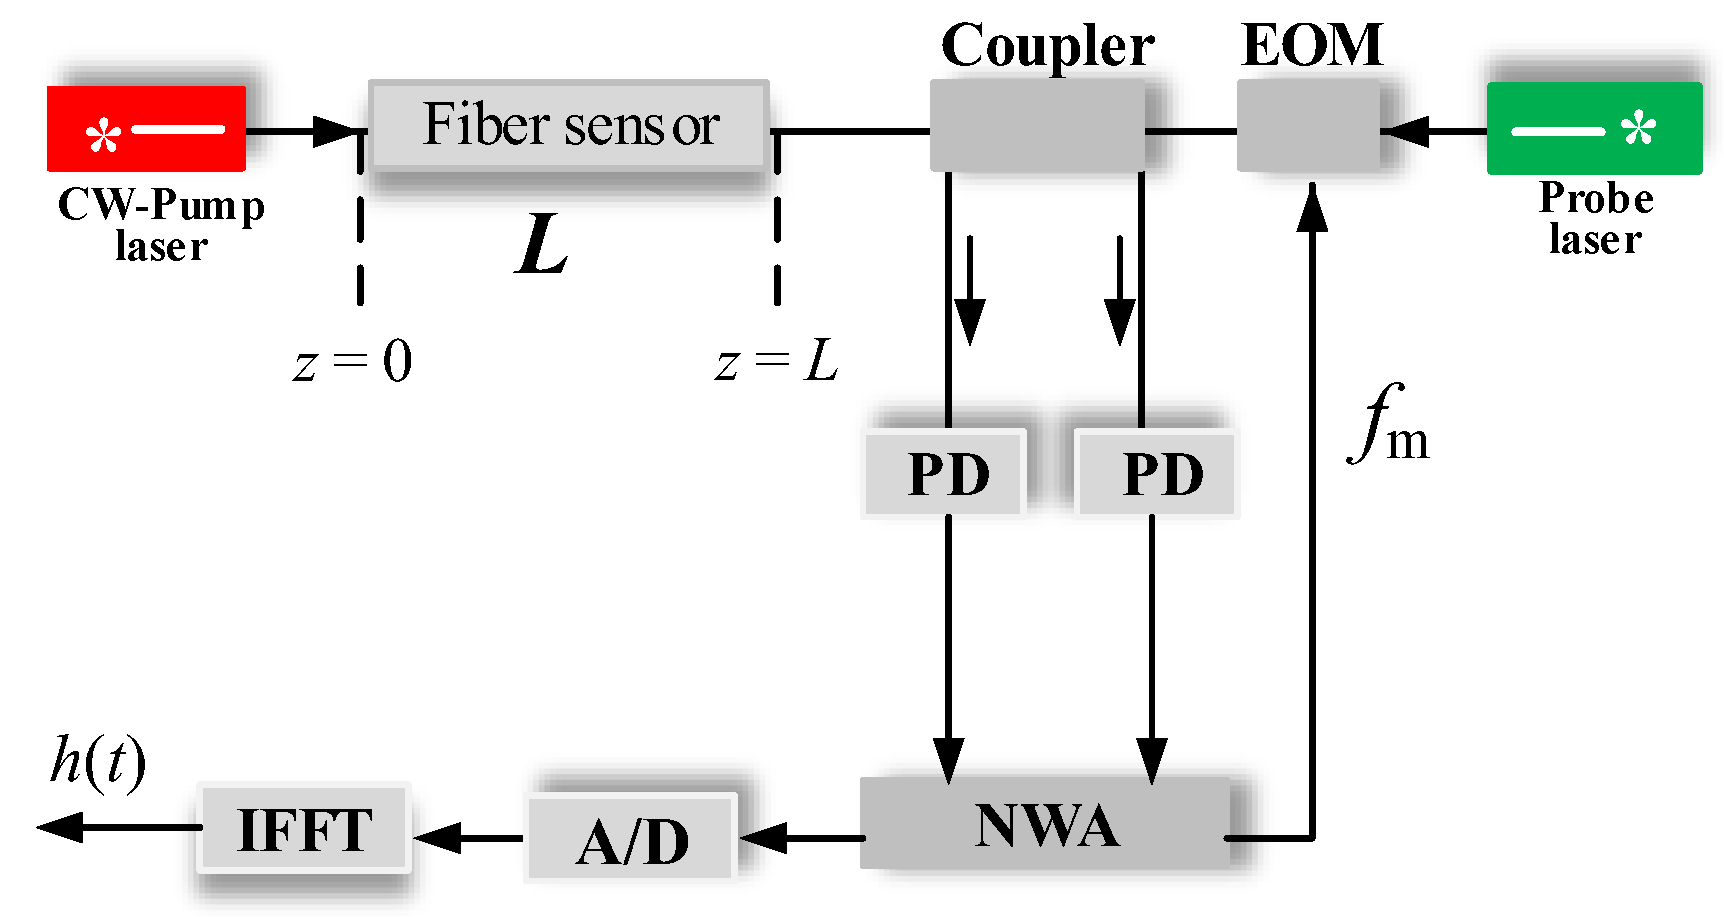
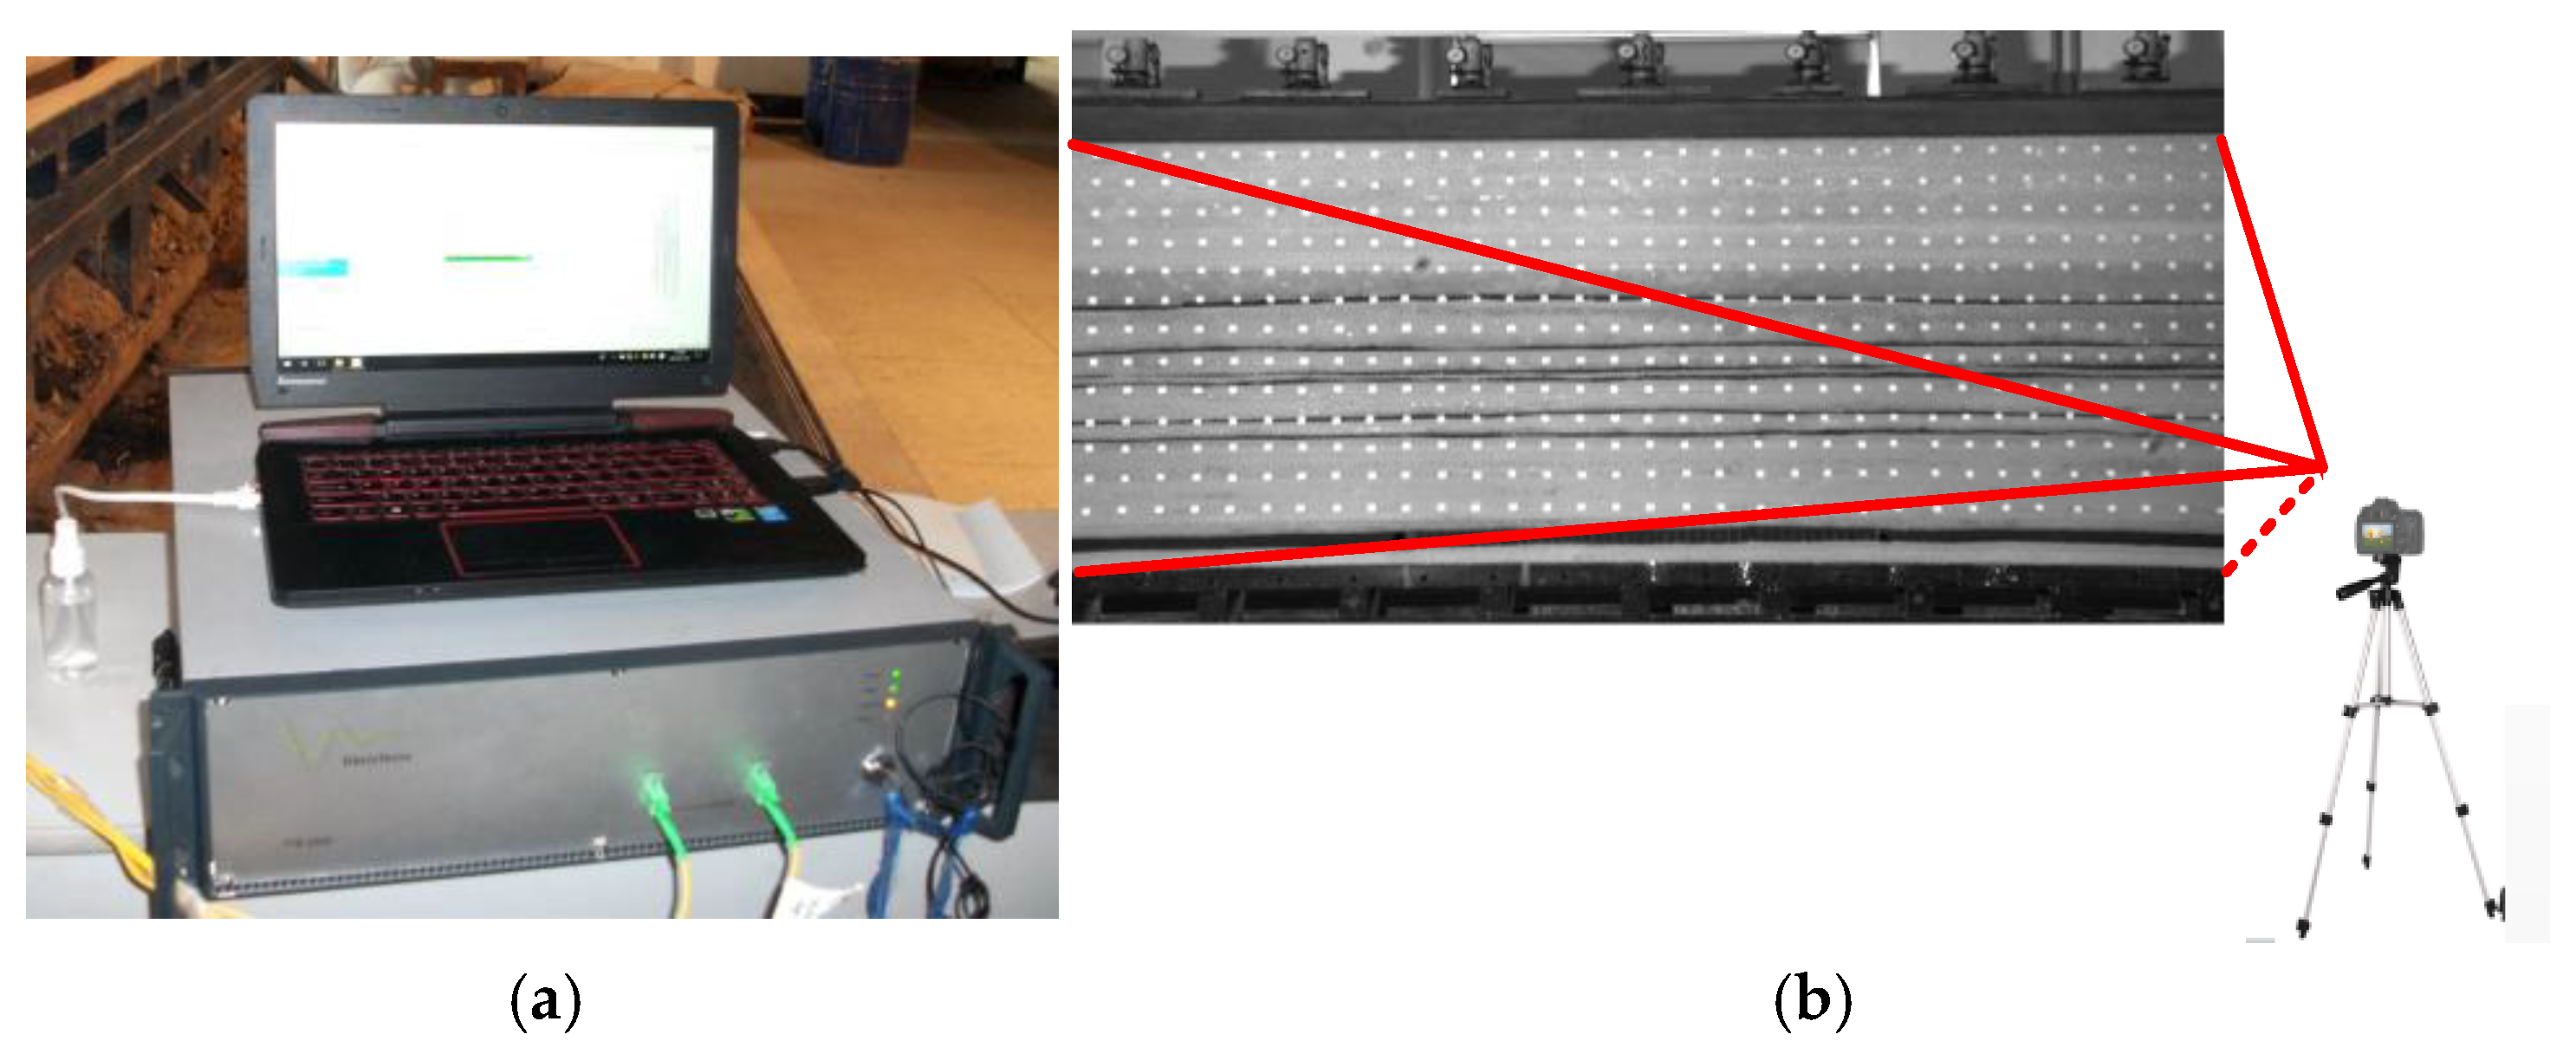
3.2.3. Measuring System for the Similar Simulation Experiment
3.3. Distribution of Fiber Optic Strain Variations During Excavation Processes in the SSE
3.3.1. The Overall Horizontal Fiber Optic Strain Distribution
- (1)
- A trapezoidal boss embodied the FOS distribution features, where the boss height and width decreased progressively from the bottom to the top (that is, from HF1 to HF4).
- (2)
- The width of the trapezoidal boss platform, which is the range of FOS variation segments gradually increased with the excavation.
- (3)
- The different shapes of trapezoidal convex platforms reflected the different forms and states of movement of the overlying rocks.
- (4)
- Simultaneously, it can be seen that the variation of HF1 FOS was the most complex, and the scope of FOS variation was the largest. Most excavation processes have an impact on this.
3.3.2. The Total Vertical Fiber Optic Strain Distribution Curve
- (1)
- VF1 and VF5 were located at the open-off cut and stopping line positions, respectively, and were minimally affected by mining, resulting in little change in FOS.
- (2)
- VF2~VF4 FOS curves exhibited a trapezoidal boss, which can be divided into a single trapezoidal boss and a two-level stepped trapezoidal boss.
- (3)
- The overall width of the boss gradually increased with excavation; the boss heights of VF2, VF3, and VF4 were relatively large.
- (4)
- In the later stage, heights of the overall boss, that is, the magnitude of the strain value, gradually decreased with excavation due to the influence of the fragmentation and swelling of the fallen gangue.
- (5)
- The strain curves of VF2, VF3, and VF4 mostly exhibited a stepped trapezoidal convex shape of 1 to 2 levels, representing various rock mass movements. It is obvious that VF2–VF4 are more fully affected by mining and can fully reflect the entire process of overlying rock deformation.
4. Fiber Optic Strain Characterization of Overlying Rock Movement Features
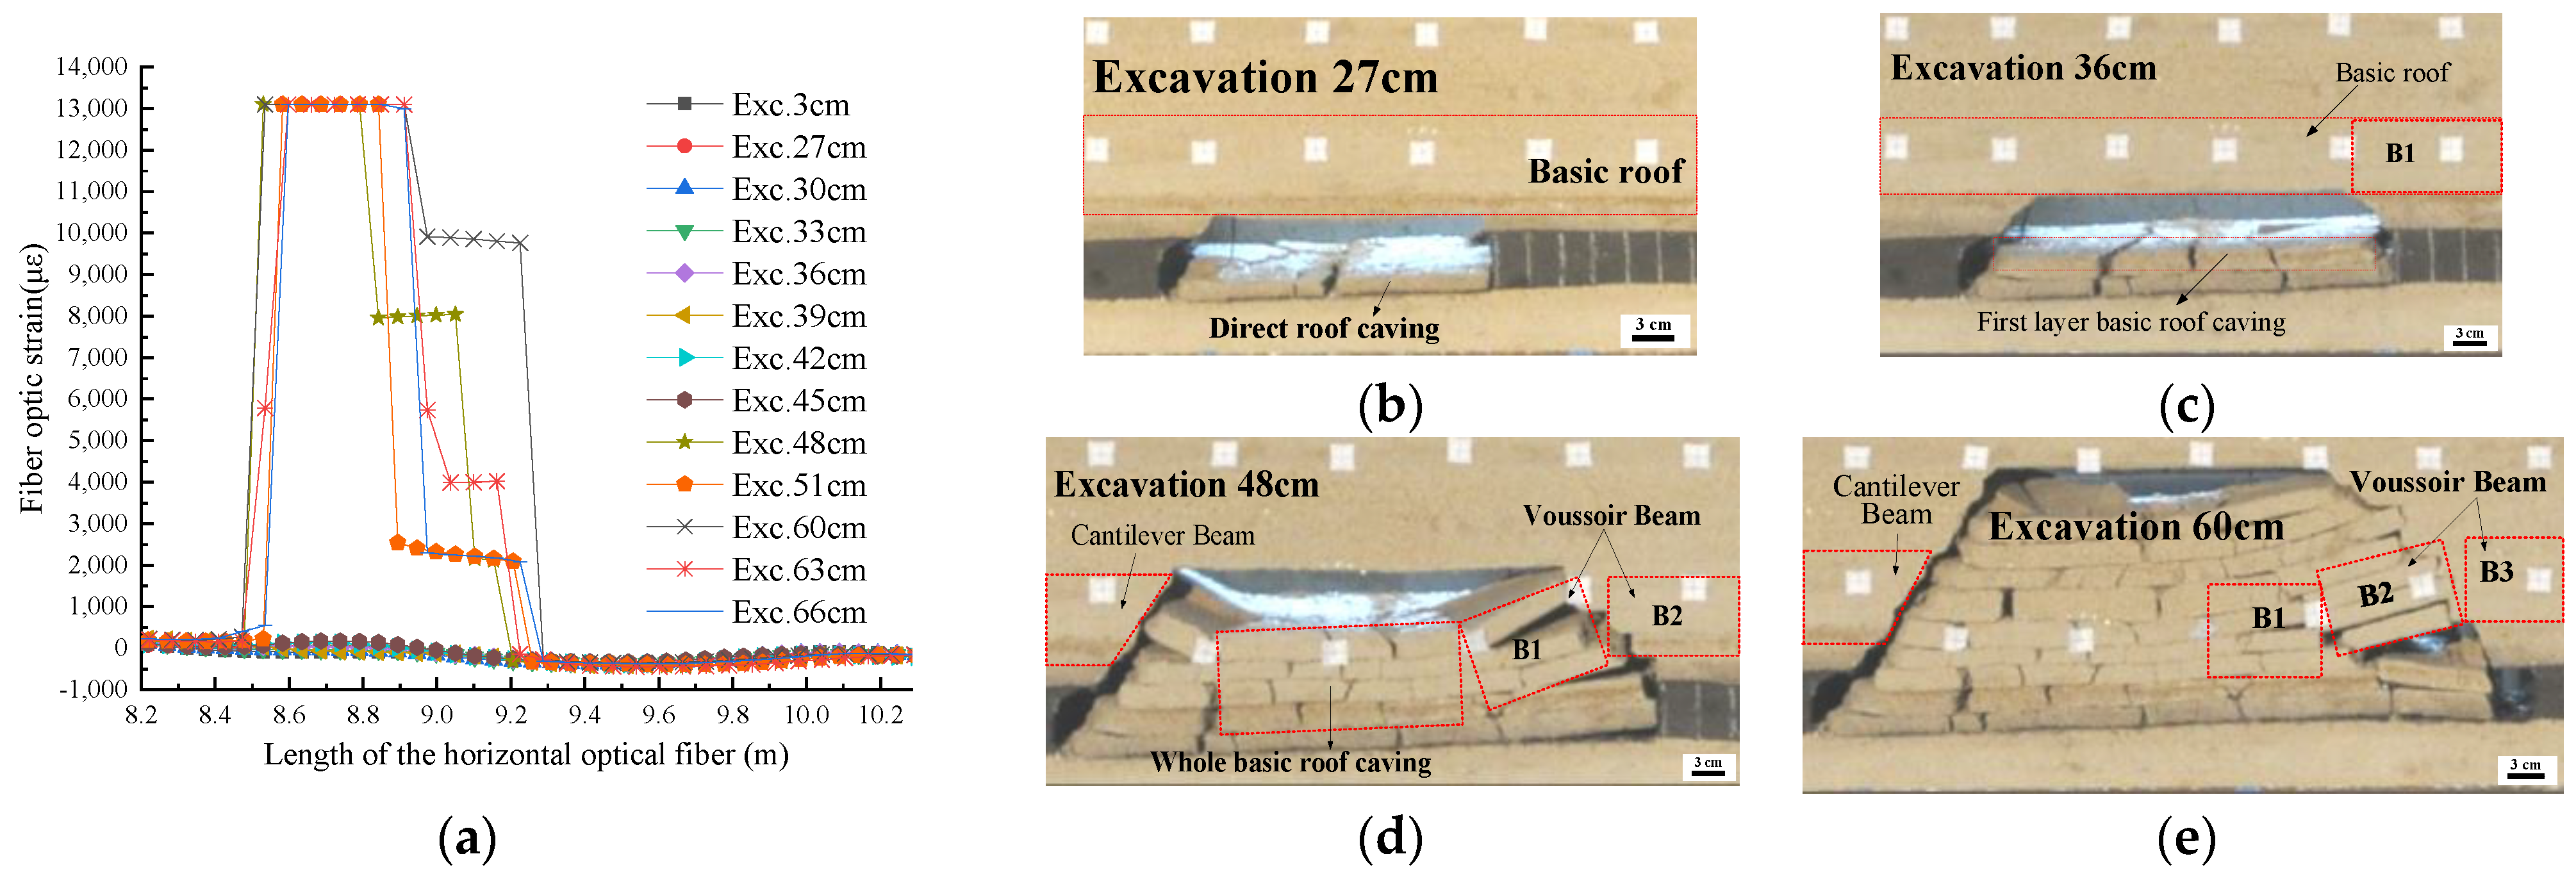
4.1. Characterization by Horizontally Laid Optical Fibers
- Excavation of 0–66 cm, the movement form of voussoir beams.
- Excavation of 69–102 cm, a cantilever beam movement form.
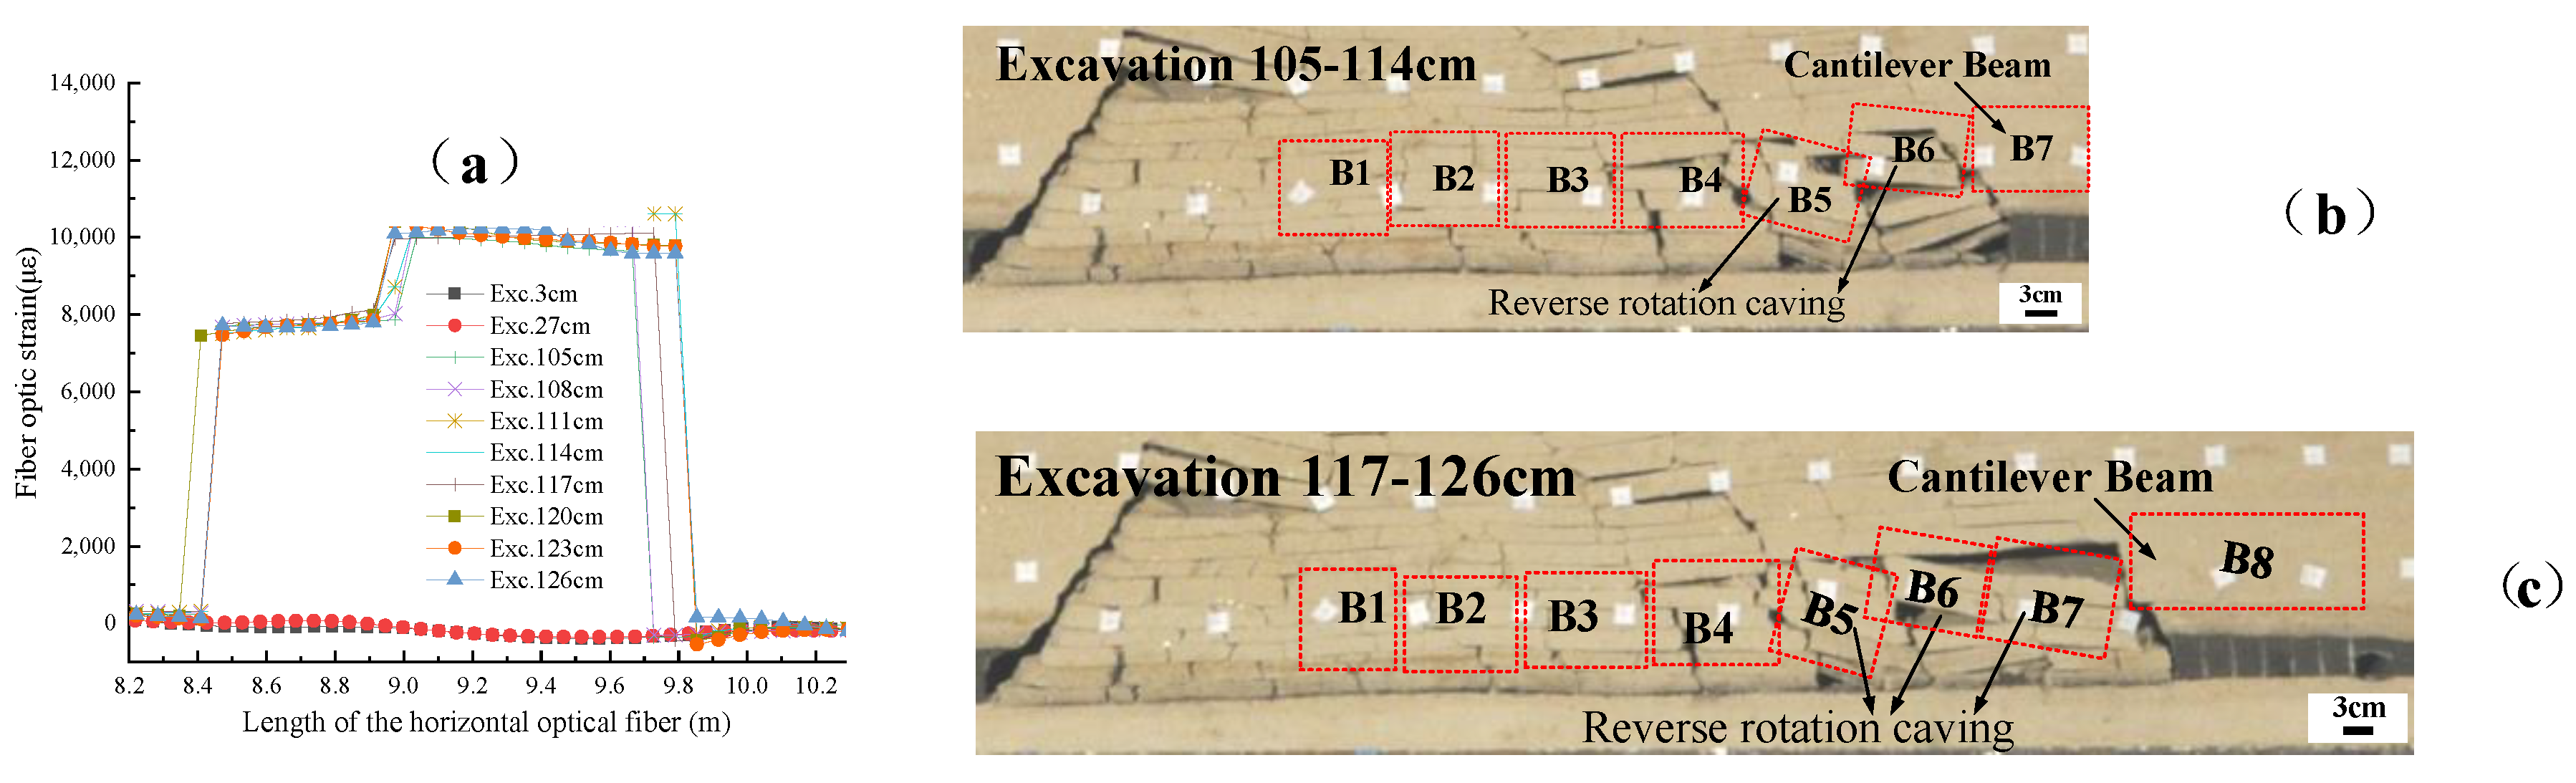
- Excavation of 105–126 cm, a reverse cantilever beam rotating movement form.
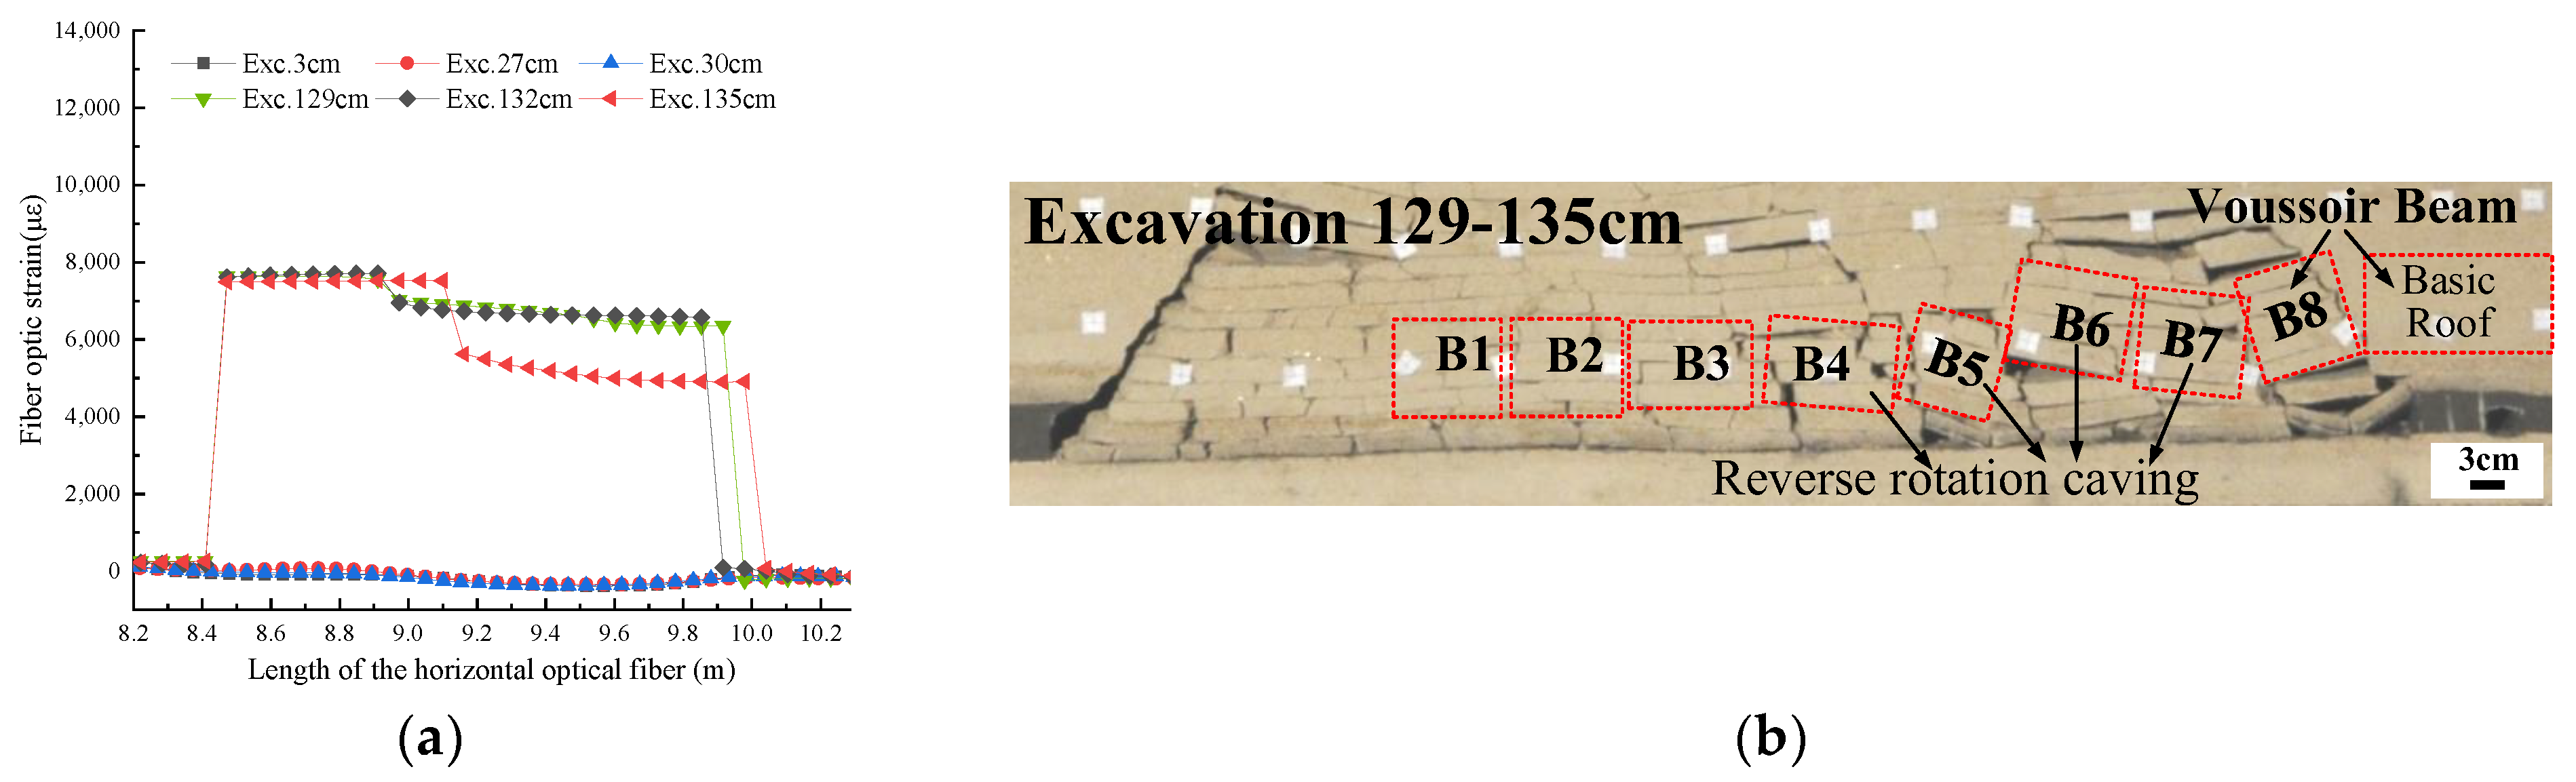
- Excavation of 129–135 cm, the overburden movement form of the voussoir beam.
4.2. Characterization of Overburden Deformation Movement by Vertically Laid Optical Fibers
- (1)
- Initial compressive strain curve.
- (2)
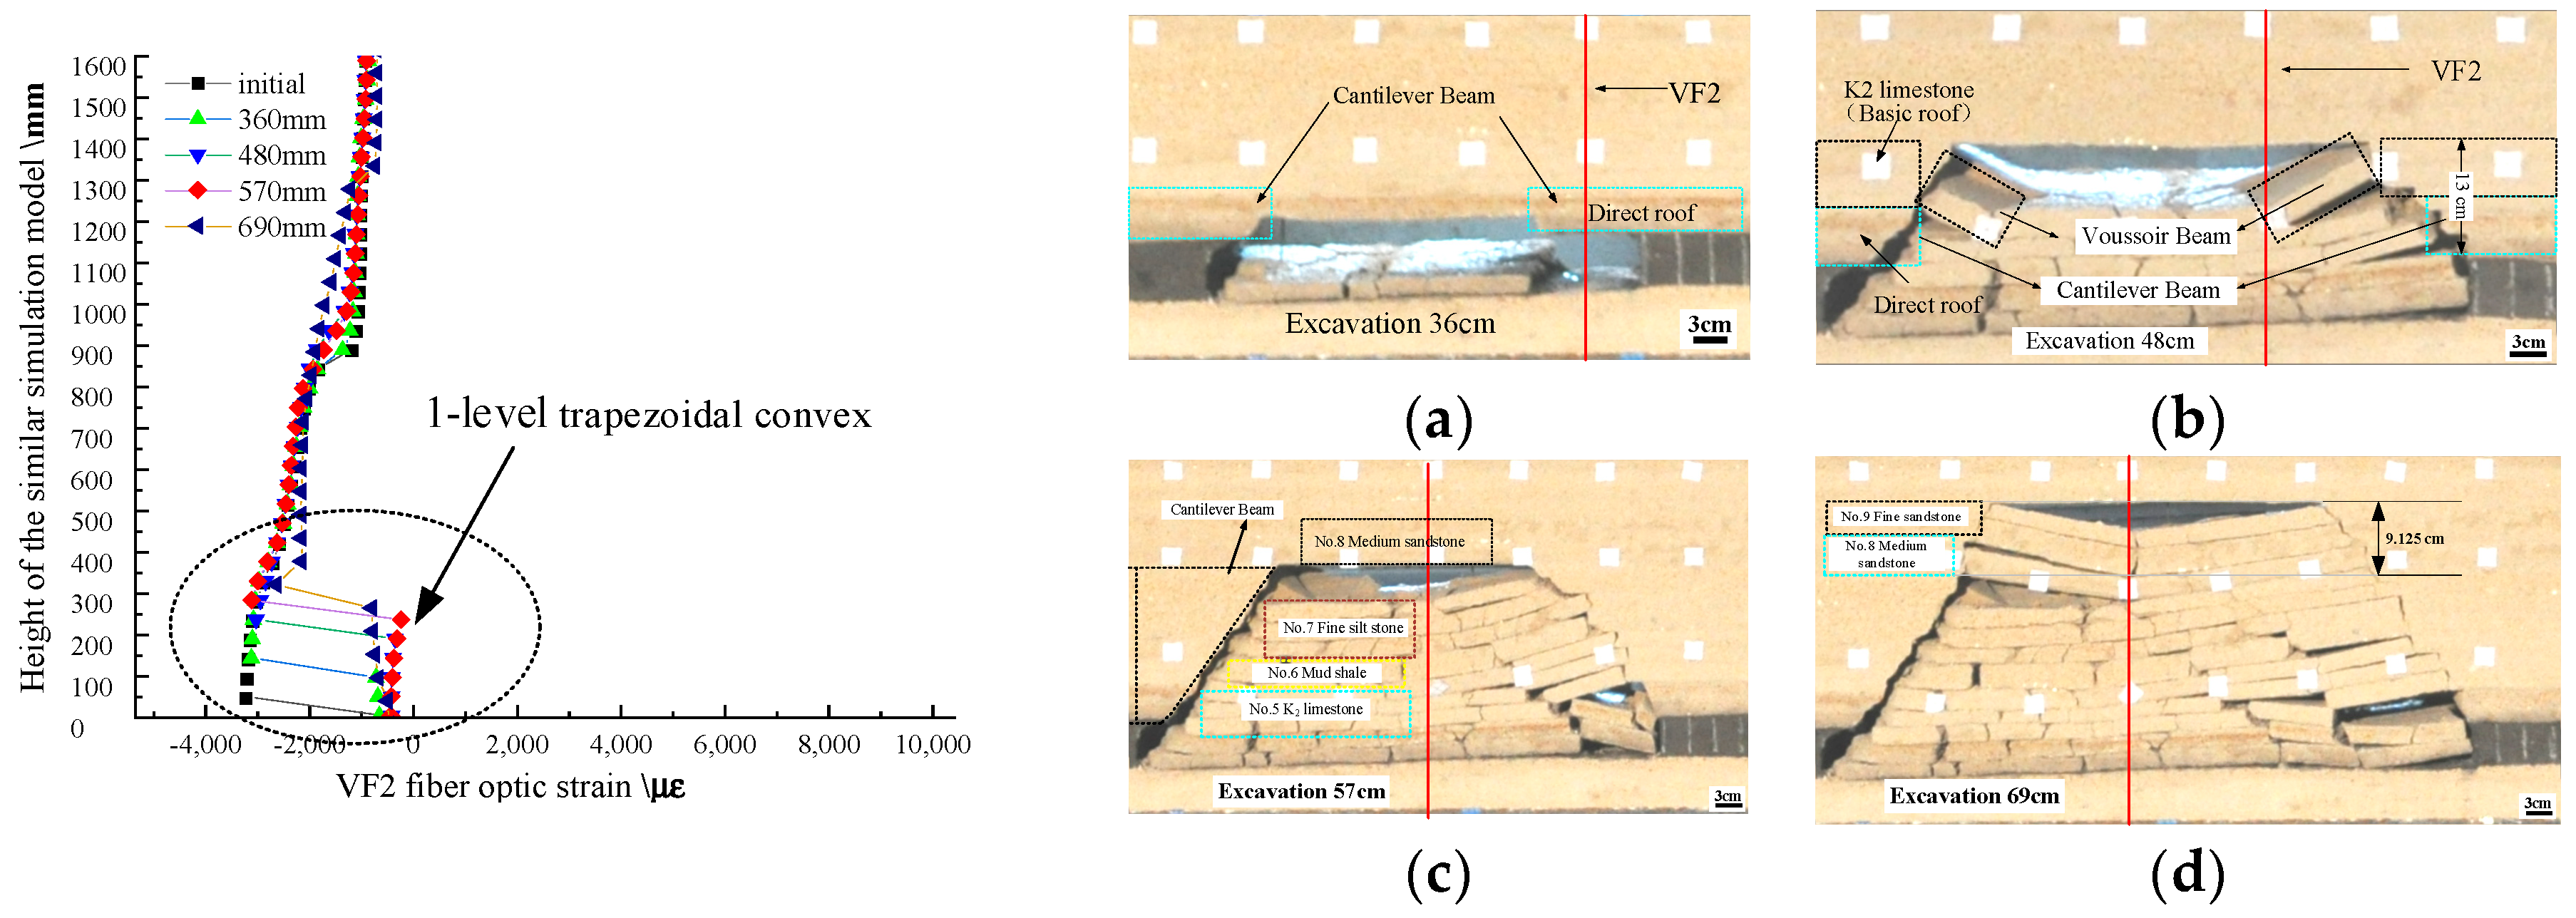
- The 1-level rightward trapezoidal convex shape curve.
- (3)
- The 2-level rightward trapezoidal boss fiber optic strain curve
4.3. Characterization of Overburden Movement Law by Fiber Optic Strain Curve Distribution
- Transverse movement forms and states of rock blocks
- (1)
- Both the left inflection points and the right inflection points of the boss represent broken points of overlying strata, and the width of the boss is also the lateral scope of the overburden failure deformation.
- (2)
- The FOS curves of all horizontal optical fibers represent the deformation movement mode of the uneven trapezoidal boss of overlying rocks. The development of the width of the boss indicates that the transverse range of the overlying rock movement gradually increases with excavation.
- (3)
- The various shapes with the trapezoidal boss represent different movement forms of the rock blocks. As the excavation advanced, these are: voussoir beams → cantilever beams → reverse cantilever beam → voussoir beams, respectively.
- Vertical movement forms and states of the overlying rock strata
- (1)
- When the excavation did not pass through the VF2 optical fiber, the fiber optic strain was the initial stress–strain curve.
- (2)
- After excavating through VF2, the overlying rock near the stope showed cantilever beam movement, causing the VF2 FOS to exhibit a 1-level rightward trapezoidal boss shape, and the height of the abrupt change-point of the boss gradually increased with excavation, which represents the caving zone height.
- (3)
- As the excavations advanced, the overlying hard and thick rock strata fractured and exhibited a state of rotation and sinking of the voussoir beams. When the thickness of the voussoir beam was less than the spatial resolution of BOFDA, the VF2 FOS curve reflects the height of the overall overburden failure deformation, presenting a 1-level rightward trapezoidal boss curve. At this time, the height of the inflection point is that of the overburden deformation, which gradually rises with the excavation.
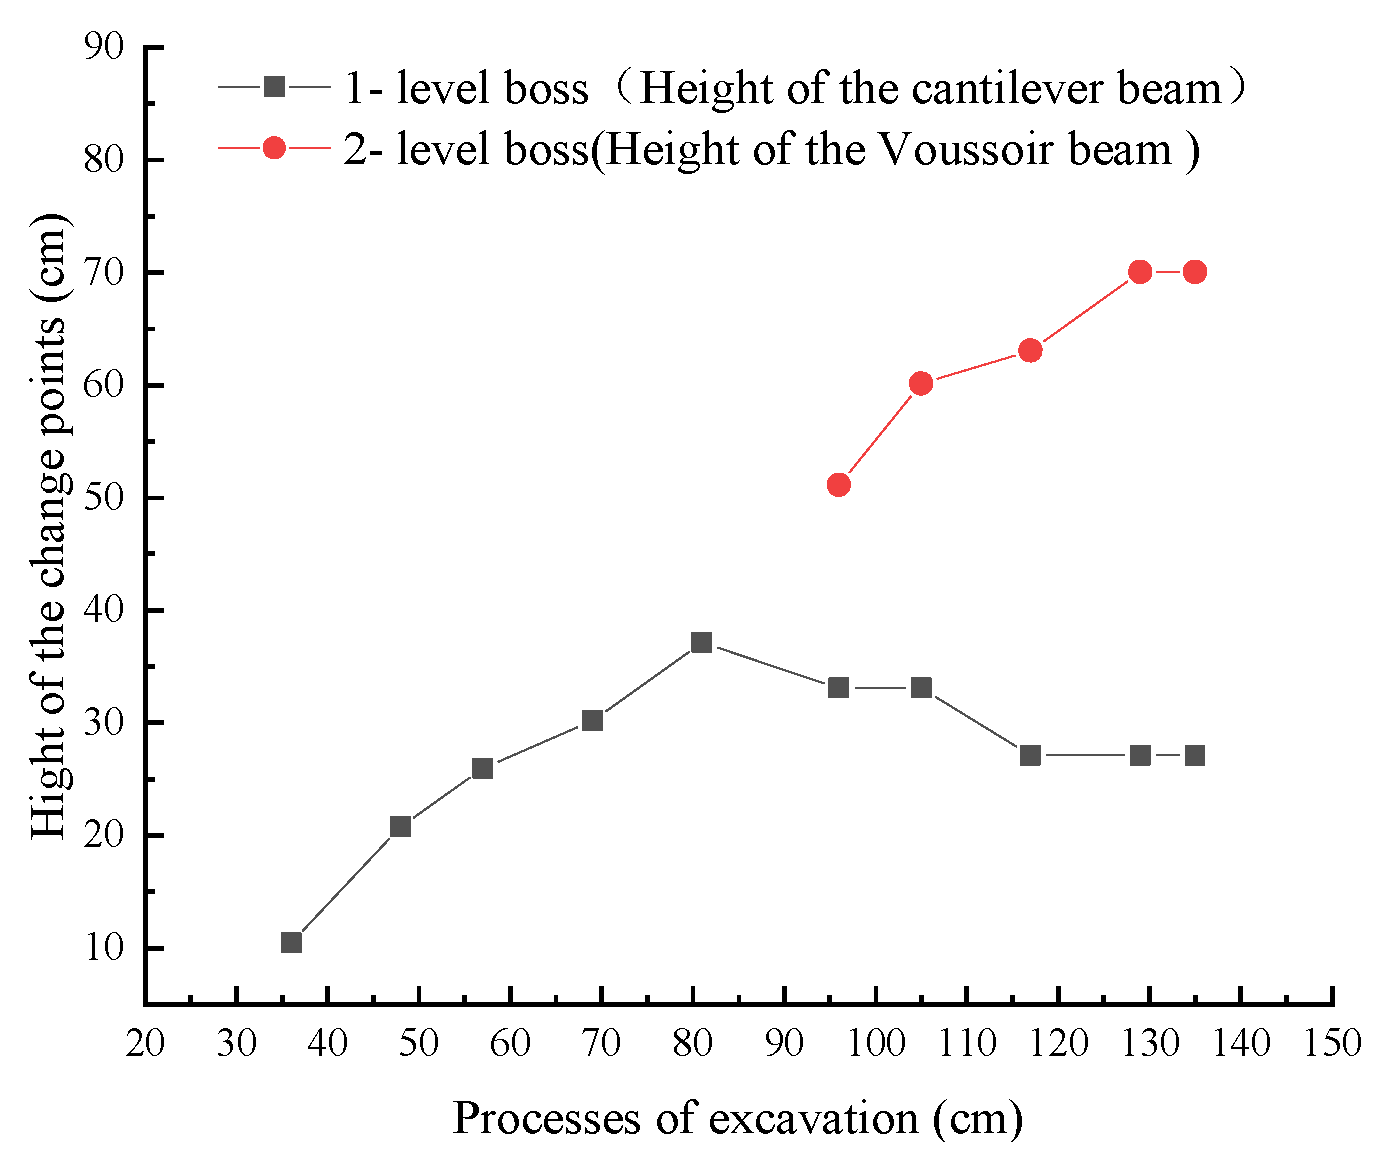
- (4)
- When the thickness of the voussoir beam was bigger than the spatial resolution of BOFDA, the VF2 FOS curve exhibited two distinct shapes of the upper and lower rightward trapezoidal bosses, with the upper part being a larger rightward tensile strain 2-level trapezoidal boss curve, whose vertical height is equal to that of the voussoir beam. Elevation of the lower boss is that of the cantilever beam. The variation curves of the position height of the upper inflection point of the 1-level trapezoidal boss and the 2-level boss in the time dimension are shown in Figure 19.
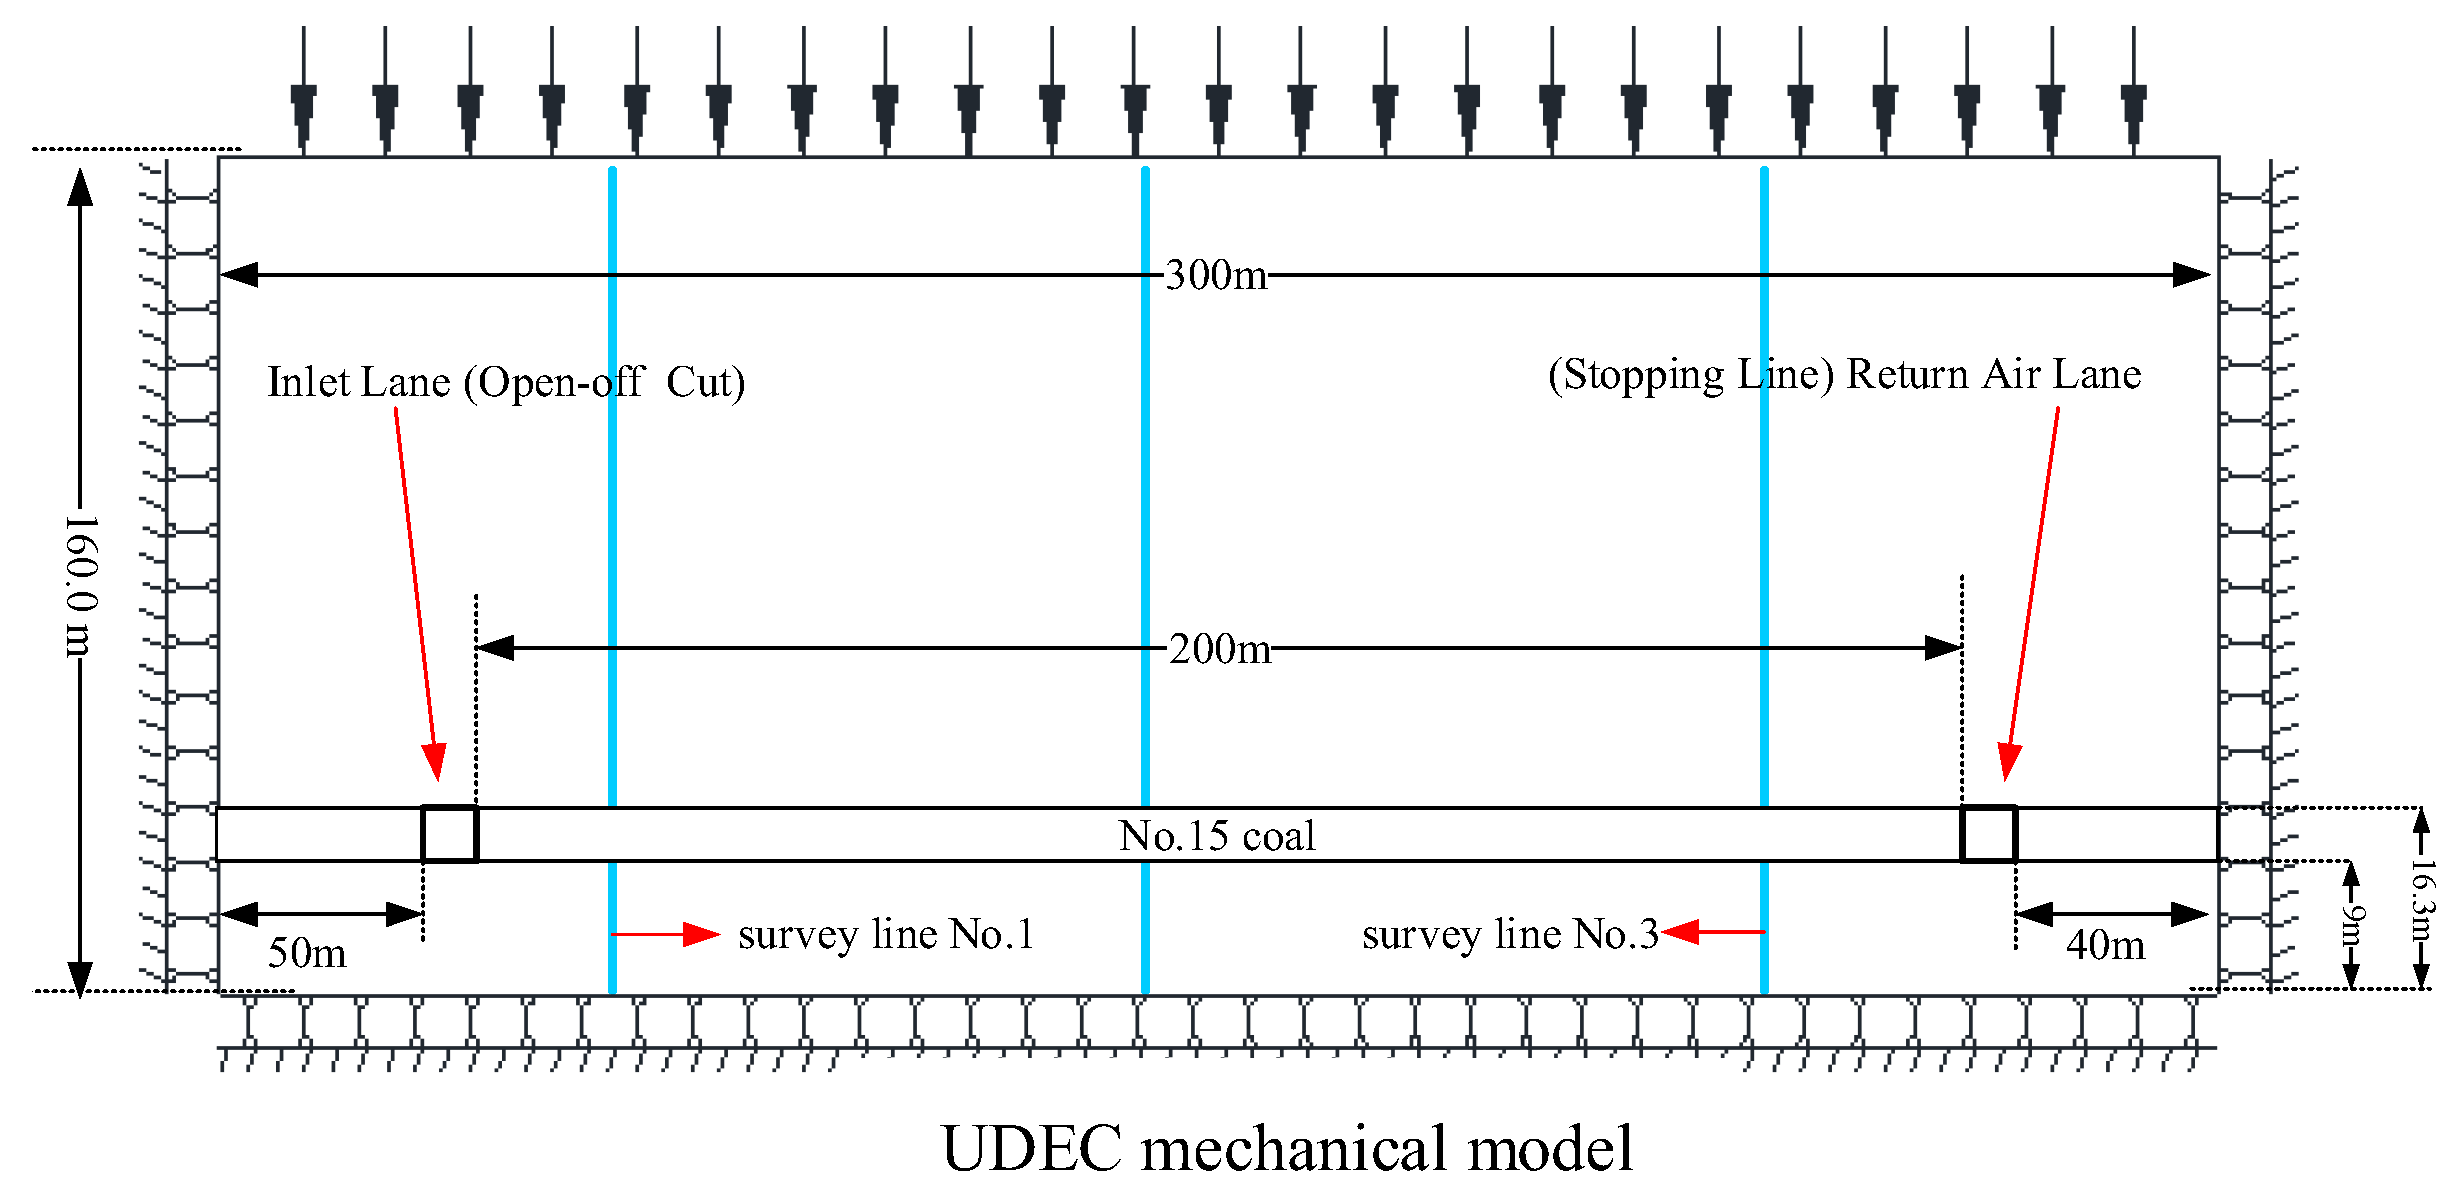
5. UDEC Numerical Simulation Verification of BOFDA Characterization
5.1. Construction of Numerical Model
5.2. Analysis of Numerical Simulation Results
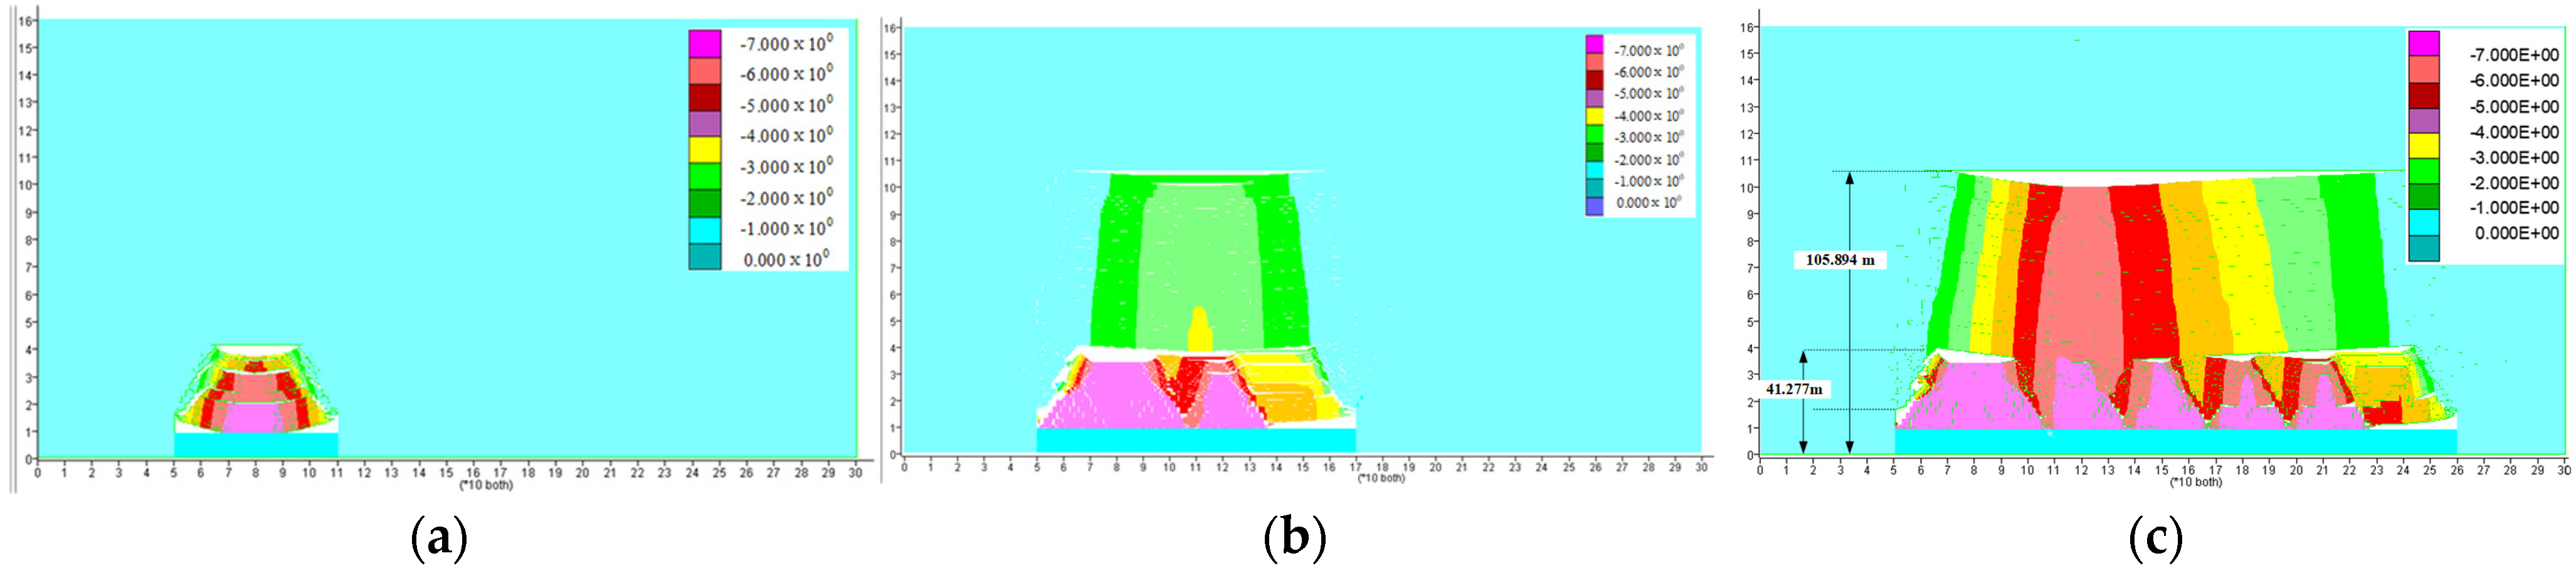
5.2.1. Overburden Mining-Induced Deformation Movement Contour Map
- (1)
- The range of the horizontal rock layers’ collapse expanded with excavation. When the excavation advanced to 60 m, the overburden collapsed on a large scale, and the rock layers showed a movement state of voussoir beams (Figure 22a), followed by a collapse state of cantilever beams in the later stage. As the excavation progressed, the cantilever beam presented the normal caving and reversal caving (Figure 22b,c), and at the end of the excavations, the basic roof presented a voussoir beam movement state.
- (2)
- The vertical overburden collapse showed obvious stage features. At the beginning of excavation, only a cantilever beam movement was presented, and its height gradually rose. By the time of excavation at 60 m, the height reached the model height of about 41.277 m, and obviously, large horizontal cracks appeared above the collapse areas. Afterward, the rock strata within the collapse band showed a complete caving and a cantilever beam movement state; later, a voussoir beam structure appeared in the overlying rock blocks of collapse zones, as depicted in Figure 22b,c. A distinct fracture zone developed above the voussoir beam structure, with its height increasing progressively as excavation advanced. By the time 120 m of excavation had been completed, the fracture zone had reached the full model height of 105.894 m, as illustrated in Figure 22 and Figure 23.
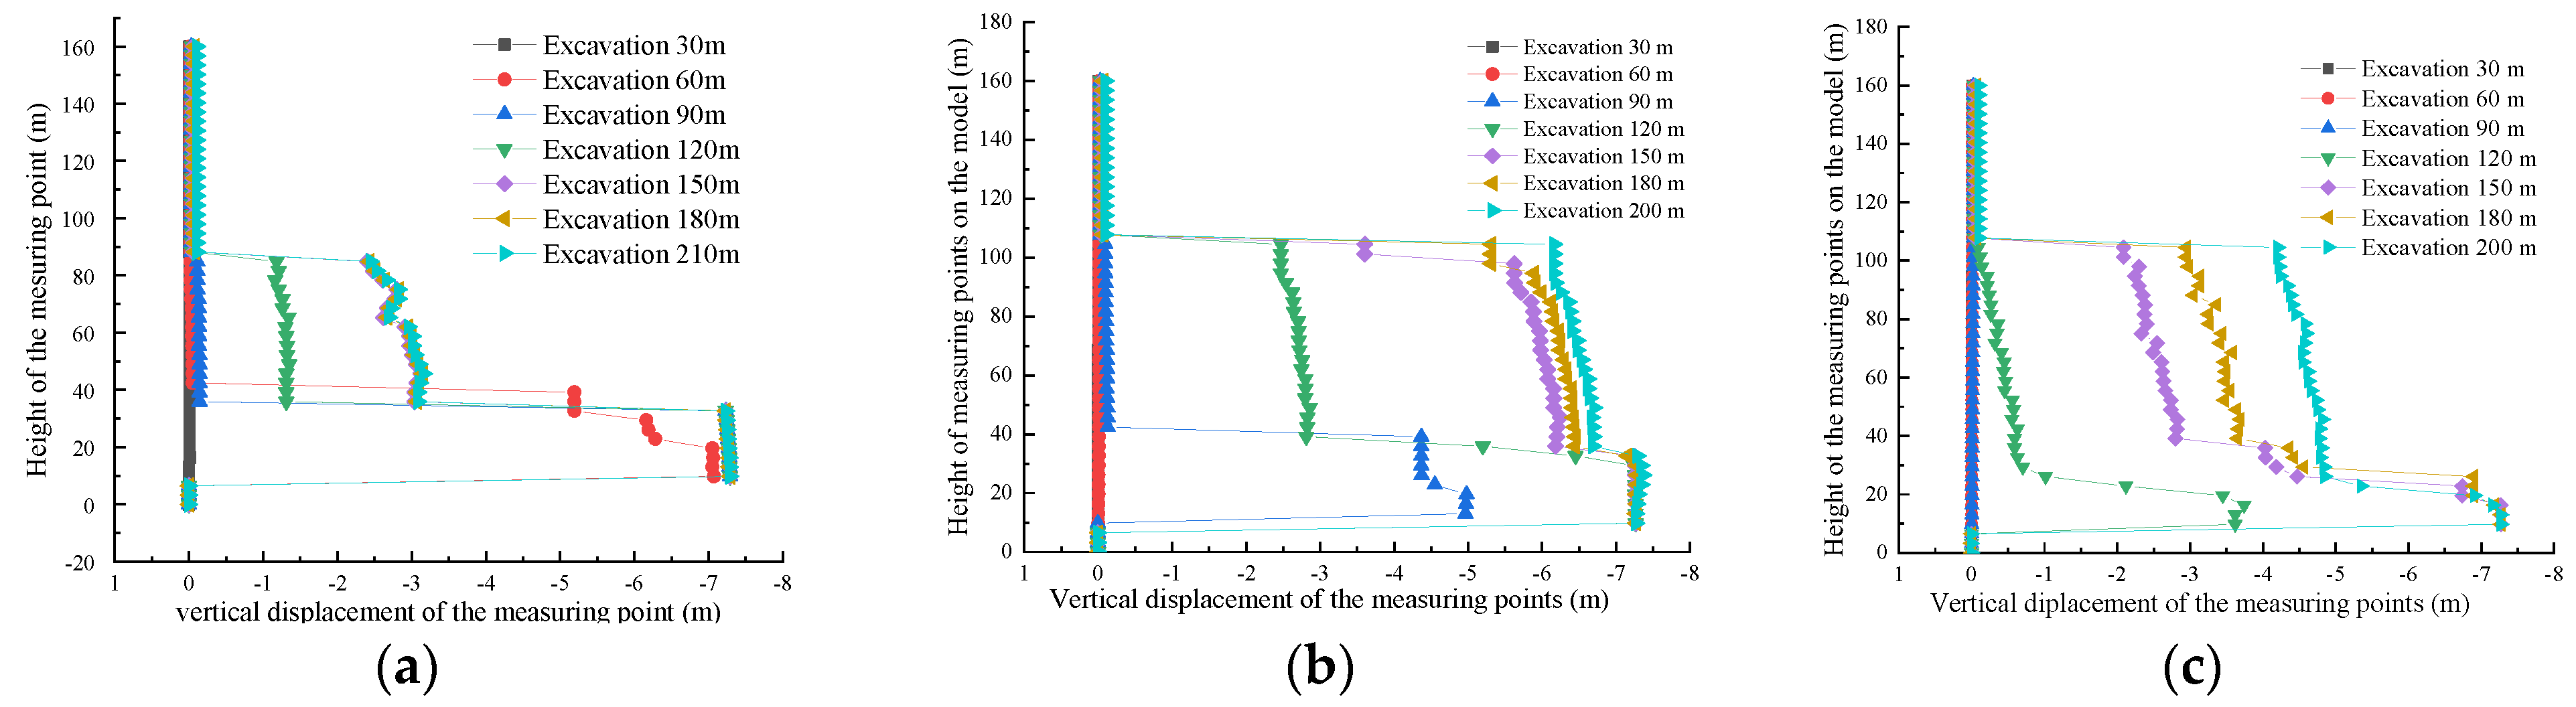
5.2.2. Vertical Survey Lines Displacement in the UDEC Simulation
5.3. UDEC Numerical Simulation Conclusions
- (1)
- Horizontally. The overlying rocks’ movement scope gradually expanded. The basic roof overburden failure deformation initially presented as the rotating-sinking movement of the voussoir beam, later changed to the sliding-rotating movement of the cantilever beam, then developed into the sliding-caving of the reversal cantilever beam, and finally evolved into the rotating-sinking movement of the voussoir beam.
- (2)
- Vertically. The failure height of the overburden gradually increased as excavation progressed. The deformation caused by the mining-induced overburden movement exhibited distinct upper and lower bimodal stepwise stages as the lower overburden formed a collapse zone with the cantilever beam movement state, and overlying rock formations formed a fracture zone with the rotating and sinking movement state of voussoir beam structures. Based on the altitude of the coal seam roof, the fracture zone height was 89.69 m, and the caving zone height was 24.99 m.
6. Exploration on Characterization of Fiber Optic Strain Curves Distribution
7. Conclusions
- (1)
- The BOFDA fiber optic strain exhibited a trapezoidal boss curve due to the specifications and sensing parameters of BOFDA as the work advanced.
- (2)
- The multi-level trapezoidal boss of the horizontally embedded fiber optic strain curves continuously developed upward and rightward with excavation. The stepped shape of the trapezoidal boss represented the sequential movement forms of the basic roof strata: voussoir beam → cantilever beam → reverse cantilever beam → voussoir beam.
- (3)
- The vertically embedded FOS curves exhibited a two-level rightward trapezoidal boss shape, representing the bi-mode structure of the overburden deformation: the upper part boss represented the movement state of the voussouir beam, with its height indicating the fracture zone height; and the bottom fiber strain boss represented the movement state of the cantilever beam, with its height indicating the caving zone height.
- (4)
- The final development altitude of the caving zone with cantilever beam movement states was ascertained to be 25.77 m using BOFDA DFOS characterization, and the final altitude of the fracture zone developing was 90.27 m.
Author Contributions
Funding
Institutional Review Board Statement
Informed Consent Statement
Data Availability Statement
Acknowledgments
Conflicts of Interest
References
- Wang, J.; Xu, J.; Yang, S.; Wang, Z. Development of strata movement and its control in underground mining: In memory of 40 years of Voussoir Beam Theory proposed by Academician Minggao Qian. Coal Sci. Technol. 2023, 51, 80–94. (In Chinese) [Google Scholar]
- Qian, M.; Xu, J. Behaviors of strata movement in coal mining. J. China Coal Soc. 2019, 44, 973–984. (In Chinese) [Google Scholar]
- Liu, J.; Li, C.; Shi, Y.; Zhang, Y. Stability analysis and fracture patterns of hard main roof in longwall top coal caving with large mining height. Shock. Vib. 2021, 2021, 9930221. [Google Scholar] [CrossRef]
- Zhang, P.-D.; Sun, C.-S.; Fan, X.; Li, S.-T.; Wang, L.-J.; Cao, Z.-Z. Temporal and Spatial Evolution Mechanisms of the Water-Conducting Fractured Zone of Overlying Strata in the Kongzhuang Coal Mine. Geofluids 2023, 2023, 3790998. [Google Scholar]
- Yang, D.; Guo, W.; Tan, Y. Study on the Evolution Characteristics of Two-Zone Failure Mode of the Overburden Strata under Shallow Buried Thick Seam Mining. Adv. Civ. Eng. 2019, 2019, 9874769. [Google Scholar] [CrossRef]
- Di, S. Predicting Overburden-Induced Failure Height of Large Mining Face in Shallow Coal Seam Based on Half-Plane Theory. Shock. Vib. 2022, 2022, 5757871. [Google Scholar] [CrossRef]
- Wang, Y.; Yang, B.; Zhang, J. Study on the Safety Thickness of Three Zones against Fault Water Inrush: Case Study and Model Development. J. Eng. 2024, 2024, 8232145. [Google Scholar] [CrossRef]
- Zhang, F.; Wan, H.; Liu, Y.; Li, S.; Li, Z. Mechanism and Numerical Simulation of Vertical Fracture Propagation in Composite Coal Rock. Shock. Vib. 2022, 2022, 3044121. [Google Scholar] [CrossRef]
- Xu, B.; Xu, W.; Zhang, Y. Experimental Study on the Characteristics of Overlying Rock Movement in Mining Area. Geotech. Geol. Eng. 2024, 42, 1779–1791. [Google Scholar] [CrossRef]
- Wu, Z.; Chen, Y.; Luo, D. Comparative study of five machine learning algorithms on prediction of the height of the water-conducting fractured zone in undersea mining. Sci. Rep. 2024, 14, 21047. [Google Scholar] [CrossRef]
- Karapanagiotis, C.; Hicke, K.; Wosniok, A.; Krebber, K. Distributed humidity fiber-optic sensor based on BOFDA using a simple machine learning approach. Opt. Express 2022, 30, 12484–12494. [Google Scholar] [CrossRef] [PubMed]
- Karapanagiotis, C. Time-Efficient Convolutional Neural Network-Assisted Brillouin Optical Frequency Domain Analysis. Sensors 2021, 21, 2724. [Google Scholar] [CrossRef]
- Reyes-Vera, E.; Valencia-Arias, A.; García-Pineda, V.; Aurora-Vigo, E.F.; Vásquez, H.A.; Sánchez, G. Machine learning applications in optical fiber sensing: A research agenda. Sensors 2024, 24, 2200. [Google Scholar] [CrossRef] [PubMed]
- Liu, Y.; Huang, Y.; Bao, Y. Machine learning-empowered automatic analysis of distributed fiber optic sensor data for monitoring coincident corrosion and cracks in pipelines. Measurement 2025, 247, 116805. [Google Scholar] [CrossRef]
- Zhou, Y.; Zhang, Y.-N.; Yu, Q.; Ren, L.; Liu, Q.; Zhao, Y. Application of machine learning in optical fiber sensors. Measurement 2024, 228, 114391. [Google Scholar] [CrossRef]
- Piao, C.; Lei, S.; Yang, J.; Sang, L. Experimental study on the movement and evolution of overburden strata under reamer-pillar coal mining based on distributed optical fiber monitoring. Energies 2018, 12, 77. [Google Scholar] [CrossRef]
- Cheng, G.; Xu, W.; Shi, B.; Wu, J.; Sun, B.; Zhu, H. Experimental study on the deformation and failure mechanism of overburden rock during coal mining using a comprehensive intelligent sensing method. J. Rock Mech. Geotech. Eng. 2022, 14, 1626–1641. [Google Scholar] [CrossRef]
- Yuan, Q.; Chai, J.; Zhang, D.; Liu, J.; Li, Y.; Yin, G. Monitoring and characterization of mining-induced overburden deformation in physical modeling with distributed optical fiber sensing technology. J. Light. Technol. 2019, 38, 881–888. [Google Scholar] [CrossRef]
- Chai, J.; Qiu, F.; Zhu, L.; Zhang, D. Evolution Characteristics of Void in the Caving Zone Using Fiber Optic Sensing. Sensors 2024, 24, 478. [Google Scholar] [CrossRef]
- Zhang, D.; Duan, Y.; Du, W.; Chai, J. Experimental study on physical similar model of fault activation law based on distributed optical fiber monitoring. Shock. Vib. 2021, 2021, 4846977. [Google Scholar] [CrossRef]
- Du, W.; Chai, J.; Zhang, D.; Lei, W. Application of optical fiber sensing technology in similar model test of Shallow-buried and thick coal seam mining. Measurement 2021, 181, 109559. [Google Scholar] [CrossRef]
- Liang, C.; Bai, Q.; Yan, M.; Wang, Y.; Zhang, H.; Jin, B. A Comprehensive Study of Optical Frequency Domain Reflectometry. IEEE Access 2021, 9, 41647–41668. [Google Scholar]
- Qu, S.; Xu, Y.; Huang, S.; Sun, M.; Wang, C.; Shang, Y. Recent Advancements in Optical Frequency-Domain Reflectometry: A Review. IEEE Sens. J. 2023, 23, 1707–1723. [Google Scholar]
- Lobach, I.A.; Fotiadi, A.A.; Yatseev, V.A.; Konstantinov, Y.A.; Barkov, F.L.; Claude, D.; Kambur, D.A.; Belokrylov, M.E.; Turov, A.T.; Korobko, D.A. Newest Methods and Approaches to Enhance the Performance of Optical Frequency-Domain Reflectometers. Sensors 2024, 24, 5432. [Google Scholar] [CrossRef]
- Hartog, A.H. An Introduction to Distributed Optical Fiber Sensors; CRC Press: Boca Raton, FL, USA, 2017. [Google Scholar]
- Bai, Q.; Wang, Q.; Wang, D.; Wang, Y.; Gao, Y.; Zhang, H.; Zhang, M.; Jin, B. Recent advances in Brillouin optical time domain reflectometry. Sensors 2019, 19, 1862. [Google Scholar] [CrossRef]
- Bado, M.F.; Casas, J.R. A review of recent distributed optical fiber sensors applications for civil engineering structural health monitoring. Sensors 2021, 21, 1818. [Google Scholar] [CrossRef]
- Wang, X.; Shi, B.; Wei, G.; Cheng, G.; Zhang, C. Performance and characteristics of BOFDA, a new monitoring technology for civil and geotechnical engineering. J. Disaster Prev. Mitig. Eng. 2015, 35, 763–768. [Google Scholar]
- Bernini, R.; Minardo, A.; Zeni, L. Distributed sensing at centimeter-scale spatial resolution by BOFDA: Measurements and signal processing. IEEE Photonics J. 2011, 4, 48–56. [Google Scholar] [CrossRef]
- Kapa, T.; Schreier, A.; Krebber, K. A 100-km bofda assisted by first-order bi-directional Raman amplification. Sensors 2019, 19, 1527. [Google Scholar] [CrossRef]
- Karapanagiotis, C.; Krebber, K. Machine Learning Approaches in Brillouin Distributed Fiber Optic Sensors. Sensors 2023, 23, 6187. [Google Scholar] [CrossRef]
- Ren, B.; Shen, Y.; Zhao, T.; Li, X. Deformation monitoring and remote analysis of ultra-deep underground space excavation. Undergr. Space 2023, 8, 30–44. [Google Scholar]
- Galindez-Jamioy, C.A.; Lopez-Higuera, J.M. Brillouin distributed fiber sensors: An overview and applications. J. Sens. 2012, 2012, 204121. [Google Scholar]
- Gao, L.; Ji, B.; Kong, G.; Huang, X.; Li, M.; Mahfouz, A.H. Distributed measurement of temperature for PCC energy pile using BOFDA. J. Sens. 2015, 2015, 610473. [Google Scholar]
- Saetchnikov, V.A.; Chernyavskaya, E.A.; Yanukovich, T.P. Measurement of temperature and strain using Brillouin optical frequency-domain analysis method. In Proceedings of the Second International Conference on Lasers for Measurement and Information Transfer, St. Petersburg, Russia, 6–8 June 2001; International Society for Optics and Photonics: Bellingham, WA, USA, 2002; Volume 4680, pp. 157–166. [Google Scholar]
- Garus, D.; Gogolla, T.; Krebber, K.; Schliep, F. Distributed sensing technique based on Brillouin optical-fiber frequency-domain analysis. Opt. Lett. 1996, 21, 1402–1404. [Google Scholar] [PubMed]
- Li, D.; Ma, D.; Su, D.; Rao, S.; Wang, W.; Hong, C. Monitoring Axial Force Development in a Super-Long Pile during Construction Using BOFDA and Data Interpretation Approaches: A Case Study. Buildings 2022, 12, 1462. [Google Scholar] [CrossRef]
- Wosniok, A. Distributed Brillouin Sensing: Frequency-Domain Techniques. In Handbook of Optical Fibers; Springer Nature: Singapore, 2018; pp. 1–25. [Google Scholar]
- Cao, D.; Shi, B.; Yan, J. BOFDA Technology Review and Feasibility Study for Geotechnical Engineering Monitoring. J. Disaster Prev. Reduct. Eng. 2013, 33, 132–137. (In Chinese) [Google Scholar]
- Minardo, A.; Bernini, R.; Zeni, L. Distributed temperature sensing in polymer optical fiber by BOFDA. IEEE Photonics Technol. Lett. 2013, 26, 387–390. [Google Scholar]
- State Administration of Safety Production, State Administration of Coal Mine Safety Supervision, State Energy Administration, State Railway Administration. Regulations for Retaining Coal Pillars and Coal Mining in Buildings, Water Bodies, Railways, and Main Mines. 17 May 2017. Available online: https://www.mem.gov.cn/gk/gwgg/201707/W020190911694189457062.pdf (accessed on 5 August 2024). (In Chinese)


| Methods | Spatial Resolution | Application Scenarios | Research Contents | Number of Papers | Advantage | Limitation |
|---|---|---|---|---|---|---|
| BOTDR | 1 m | Field test | Height of WCFZ | 12 | Single-end testing, no need for loops, good robustness, easy locate breakpoints, long distance (80 km), wide range, excellent adaptability. | Low spatial resolution and strain testing accuracy; difficult to achieve precise measurement. |
| Laws of overburden deformation movement | 9 | |||||
| Strata separation | 1 | |||||
| Stress evolution | 1 | |||||
| BOTDA | 0.5 m | Indoor test | State of overlying strata | 2 | Measurement accuracy and spatial resolution are significantly higher than BOTDR. | Need testing circuit, with poor environmental adaptability; unable to measure breakpoints. |
| Field test | Strata separation | 1 | ||||
| BOFDA | 0.2 m | Field test | Settlement displacement | 1 | Higher spatial resolution and strain testing accuracy than BOTDA. | Double-ended testing, unable to measure breakpoints; the on-site layout is quite complex. |
| Indoor test | Height of WCFZ | 2 | ||||
| Evolution of voids | 1 | |||||
| Settlement displacement | 1 | |||||
| PPP- BOTDA | 0.05/0.1 m | Indoor test | Overburden deformation | 16 | Higher spatial resolution and strain testing accuracy than BOTDA. | Dual-end testing, poor environmental adaptability; the on-site wiring is relatively complex; the failure rate of on-site application instruments is relatively high. |
| Height of WCFZ | 3 | |||||
| Coal mine pressure | 3 | |||||
| Evolution of voids and separation | 3 | |||||
| fault activation | 2 | |||||
| Rock- fiber coupling | 1 | |||||
| OFDR | 0.001 m | Indoor test | Overburden deformation | 1 | High spatial resolution and strain testing accuracy, high signal-to-noise ratio, low probe light power. | Poor environmental adaptability; complex on-site layout; height failure rate on-site application; smaller range as high-precision measurement. |
| Key strata stability | 1 | |||||
| Hinge structure and rotating angle | 1 | |||||
| Void evolution | 1 |
| Parameter | Values |
|---|---|
| Types of optical fiber | Single mode optical fiber |
| dynamic range | >10 dB |
| Spatial resolution | 0.2 m |
| Highest sampling resolution | 0.05 m |
| Measuring accuracy | ±1 με |
| Measurement repeatability | ≤±2 με |
| Scope of testing | −15,000 με~15,000 με |
| Test range | 25 km |
| Data output format | Binary, ASCII |
| Frequency scanning range | 9.9~12.0 GHz |
| Dynamic testing range/dB | 10 |
| Interface | Ethernet |
| Optical output interface | E-2000/APC |
| Environmental requirements | Working temperature: 0~−40 °C; Relative humidity: 5–90%; No condensation |
| No. | Lithology | Thickness (m) | Bulk Modulus (GPa) | Shear Modulus (GPa) | Density (kg/cm3) | Friction Angle (o) | Cohesion (MPa) | Tensile Strength (MPa) |
|---|---|---|---|---|---|---|---|---|
| 24 | K7 coarse sandstone | 110.60 | 3.58 | 5.7 | 2470 | 43 | 6 | 2.00 |
| 23 | Medium sandstone | 104.57 | 5.2 | 6.94 | 2590 | 40 | 5.5 | 2.67 |
| 22 | No. 9 coal shale | 100.07 | 2.52 | 4.89 | 1540 | 28 | 1.8 | 1.00 |
| 21 | Fine sandstone | 95.00 | 4.08 | 6.8 | 2810 | 35 | 4 | 2.17 |
| 20 | Shale | 93.55 | 13.46 | 24.78 | 2660 | 29 | 2.2 | 2.13 |
| 19 | K4 limestone | 80.57 | 7.19 | 8.18 | 2660 | 33 | 3.3 | 1.70 |
| 18 | Mud stone | 78.02 | 2.61 | 4.58 | 2450 | 28 | 1.9 | 0.67 |
| 17 | Medium sandstone | 77.01 | 5.04 | 6.45 | 2600 | 41 | 5 | 1.26 |
| 16 | Sand shale | 75.12 | 5.67 | 5.38 | 2660 | 39 | 4.2 | 1.67 |
| 15 | No. 12 coal | 72.62 | 2.3 | 4.98 | 1390 | 30 | 2.1 | 1.00 |
| 14 | Medium sandstone | 71.12 | 11.26 | 20.7 | 2750 | 44 | 5.3 | 1.69 |
| 13 | K3 limestone | 66.06 | 6.45 | 7.9 | 2800 | 33 | 3.3 | 1.97 |
| 12 | No. 13 coal | 63.11 | 2.52 | 5.47 | 1380 | 29 | 2.0 | 1.00 |
| 11 | Medium sandstone | 61.60 | 5 | 6.67 | 2580 | 40 | 5 | 2.5 |
| 10 | Fine sandstone | 54.11 | 5.24 | 7.96 | 2870 | 37 | 4.4 | 1.67 |
| 9 | Medium sandstone | 49.11 | 5.21 | 6.94 | 2590 | 42 | 5 | 2.67 |
| 8 | Fine silt stone | 41.12 | 5.62 | 7.82 | 2640 | 36 | 4.1 | 2.00 |
| 7 | Shale | 35.12 | 13.46 | 24.78 | 2660 | 31 | 2.2 | 2.13 |
| 6 | K2 limestone | 28.73 | 29.43 | 32.23 | 2720 | 37 | 3.5 | 2.08 |
| 5 | Mud stone | 16.23 | 12.79 | 23.55 | 2540 | 27 | 1.3 | 1.00 |
| 4 | No. 15 coal | 14.81 | 3.33 | 7.66 | 1360 | 25 | 1.8 | 2.41 |
| 3 | Sand silt stone | 7.42 | 8.76 | 9.57 | 2530 | 29 | 2.0 | 1.00 |
| 2 | Medium sandstone | 7.00 | 5 | 6.67 | 2580 | 38 | 4.3 | 2.5 |
| 1 | K1 coarse sandstone | 6.00 | 18.09 | 27.45 | 2640 | 44 | 5 | 2.00 |
| Research Method | Caving Zone Height (m) | Errors (%) | Fracture Zone Height (m) | Errors (%) |
|---|---|---|---|---|
| Fiber optic strain | 25.77 | - | 90.27 | - |
| UDEC simulation | 24.99 | 3.026 | 89.69 | 0.643 |
| Empirical formula | 25.82 | 0.194 | 91.11 | 0.931 |
Disclaimer/Publisher’s Note: The statements, opinions and data contained in all publications are solely those of the individual author(s) and contributor(s) and not of MDPI and/or the editor(s). MDPI and/or the editor(s) disclaim responsibility for any injury to people or property resulting from any ideas, methods, instructions or products referred to in the content. |
© 2025 by the authors. Licensee MDPI, Basel, Switzerland. This article is an open access article distributed under the terms and conditions of the Creative Commons Attribution (CC BY) license (https://creativecommons.org/licenses/by/4.0/).
Share and Cite
Hu, T.; Wei, F.; Wang, J.; Wang, Y.; Song, C.; Han, K.; Han, K. Experimental Study on Fiber Optic Strain Characterization of Overlying Rock Layer Movement Forms and States Using DFOS. Photonics 2025, 12, 321. https://doi.org/10.3390/photonics12040321
Hu T, Wei F, Wang J, Wang Y, Song C, Han K, Han K. Experimental Study on Fiber Optic Strain Characterization of Overlying Rock Layer Movement Forms and States Using DFOS. Photonics. 2025; 12(4):321. https://doi.org/10.3390/photonics12040321
Chicago/Turabian StyleHu, Tao, Fengjun Wei, Jintao Wang, Yan Wang, Chunhua Song, Kuiliang Han, and Kaiqiang Han. 2025. "Experimental Study on Fiber Optic Strain Characterization of Overlying Rock Layer Movement Forms and States Using DFOS" Photonics 12, no. 4: 321. https://doi.org/10.3390/photonics12040321
APA StyleHu, T., Wei, F., Wang, J., Wang, Y., Song, C., Han, K., & Han, K. (2025). Experimental Study on Fiber Optic Strain Characterization of Overlying Rock Layer Movement Forms and States Using DFOS. Photonics, 12(4), 321. https://doi.org/10.3390/photonics12040321