Article

Highly Sensitive Temperature Sensor Based on a UV Glue-Filled Fabry–Perot Interferometer Utilizing the Vernier Effect

1
Key Laboratory of Photonic Materials and Devices Physics for Oceanic Applications, Ministry of Industry and Information Technology of China, College of Physics and Optoelectronic Engineering, Harbin Engineering University, Harbin 150001, China
2
Key Laboratory of In-Fiber Integrated Optics of Ministry of Education, College of Physics and Optoelectronic Engineering, Harbin Engineering University, Harbin 150001, China
3
Faculty of Computing, Engineering & Science, University of South Wales, Wales CF37 1DL, UK
4
Henan Academy of Special Optics Ltd., Xinxiang 453000, China
*
Authors to whom correspondence should be addressed.
Photonics 2025, 12(3), 256; https://doi.org/10.3390/photonics12030256
Submission received: 21 February 2025 / Revised: 7 March 2025 / Accepted: 11 March 2025 / Published: 13 March 2025
(This article belongs to the Special Issue Optical Fiber Sensors: Design and Application)

Abstract

:
A parallel Fabry–Perot interferometer (FPI) optical fiber sensor, enhanced with UV glue, was proposed for environmental temperature detection. The UV glue is applied to the fiber’s sensing region using a coating method, forming an FP cavity through misalignment welding, allowing the FP to function as a temperature sensor. In parallel, a reference FPI with a similar free spectral range (FSR) is connected, generating a Vernier effect that amplifies small changes in the refractive index (RI) of the sensing region. The study demonstrates that UV glue enhances the temperature-sensing capabilities of the FP, and when combined with the Vernier effect, it significantly improves the sensitivity of a single interferometric sensor. The temperature sensitivity of the parallel-connected FPI is −2.80219 nm/°C, which is 7.768 times greater than that of a single FPI (−0.36075 nm/°C). The sensor shows high sensitivity, stability, and reversibility, making it promising for temperature-monitoring applications in various fields, including everyday use, industrial production, and the advancement of optical fiber temperature-sensing technologies.

1. Introduction

Temperature sensors play a crucial role in numerous fields, including industrial manufacturing, healthcare, environmental monitoring, energy management, automotive industries, home automation, and food safety [1,2]. The development of sensors that are easy to manufacture, cost-effective, and convenient is essential for expanding the applicability of temperature measurement technologies across various scenarios. Optical fibers, known for their lightweight and compact design, offer advantages such as corrosion resistance, immunity to electromagnetic interference, and radiation resistance [3,4]. These properties make optical fiber sensors ideal for measuring not only temperature [5], but also pressure [6]; strain [7]; humidity [8]; and even specialized parameters like ethanol [9], vitamin B1 [10], and heavy metal ions [11].
Optical fiber sensors come in various forms, including Fabry–Perot interferometers (FPIs) [12,13], Mach–Zehnder interferometers (MZIs) [14], Sagnac interferometers [15], Michelson interferometers [16], surface plasmon resonance (SPR) sensors [17], fiber Bragg gratings (FBG) [18,19], long-period fiber gratings [20] and self-mixing interferometer [21,22]. Among these, Fabry–Perot (F-P) interferometric sensors stand out due to their ease of fabrication and relatively high sensitivity. However, traditional bare-fiber FPI sensors exhibit limited temperature sensitivity. To improve this, it is essential to integrate temperature-sensitive materials into the sensor’s structure [23,24]. Researchers have enhanced temperature sensitivity by incorporating materials like alcohol [25,26] and polymers [27,28,29,30] into optical fiber structures, creating high-performance sensors. However, certain sensors proposed in these studies exhibit intricate structural designs and labor-intensive fabrication processes, while others utilize costly sensing materials. Consequently, a critical challenge lies in identifying low-cost sensing materials and devising straightforward yet easily manufacturable sensor architectures capable of achieving high sensitivity.
The Vernier effect, increasingly used in optical fiber interferometers, is gaining attention for its ability to significantly boost sensitivity [31]. This effect is achieved by cascading or connecting two optical fiber interferometers in parallel with slightly mismatched free spectral ranges (FSRs). One interferometer serves as a reference, while the other acts as the sensing element [32]. The sensor’s output, a superimposed interference spectrum with a periodic envelope (the “beating phenomenon”) [33], responds strongly to environmental changes like temperature, greatly enhancing sensitivity compared to single interferometers [34].
In this study, a core-offset FPI was fabricated by misaligning single-mode optical fibers using a splicing machine, followed by modification with ultraviolet (UV) glue. Two FPIs with similar FSRs were then connected in parallel to create a Vernier effect. Within the temperature range of 30–50 °C, the UV glue-modified FPI demonstrated significantly higher temperature sensitivity (−0.36075 nm/°C), while the parallel FPI sensor’s sensitivity reached −2.80219 nm/°C. This represents a 7.768-fold increase in sensitivity. The sensor, characterized by its high sensitivity, stability, reversibility, and ease of fabrication, is suitable for diverse applications in daily life and industrial production. Although our experimental validation was conducted within a limited temperature range, the demonstrated high sensitivity holds great potential for emerging applications, such as optical actuation [35], in vivo biosensing [36], fiber-optic therapy [37,38], and various scientific and practical applications. It also offers valuable insights for the future development of optical fiber temperature sensing technologies.

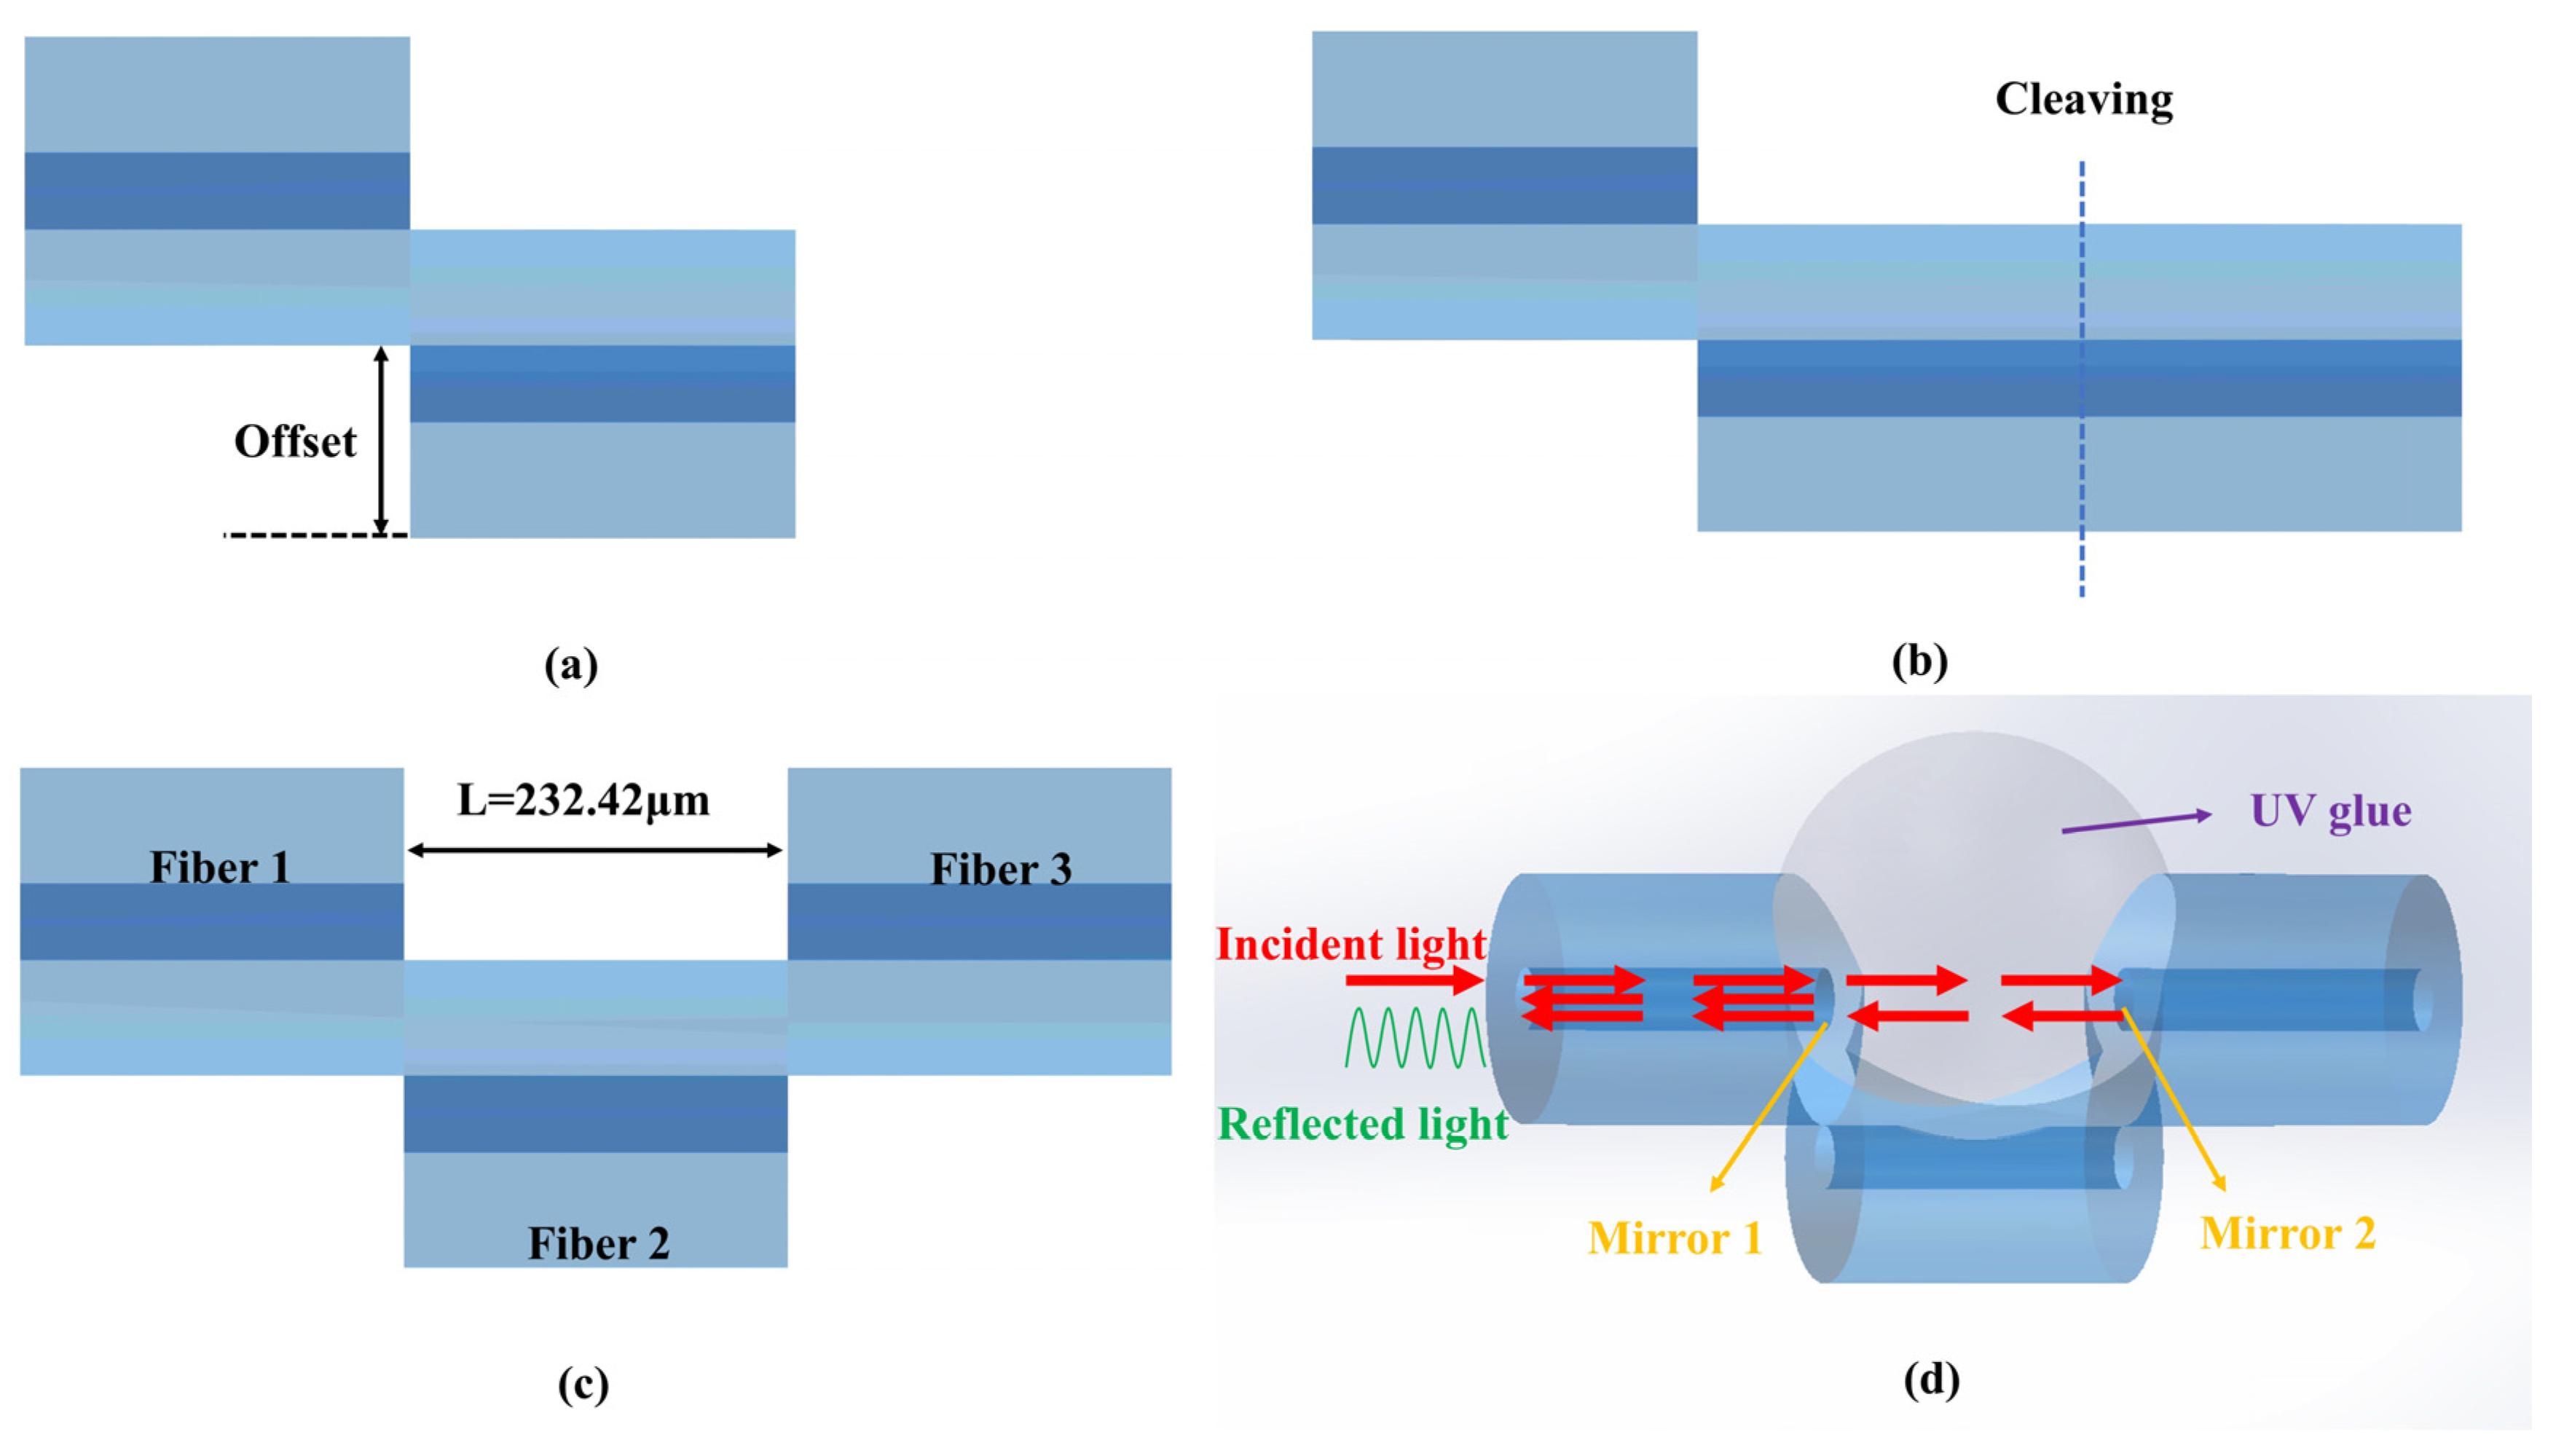
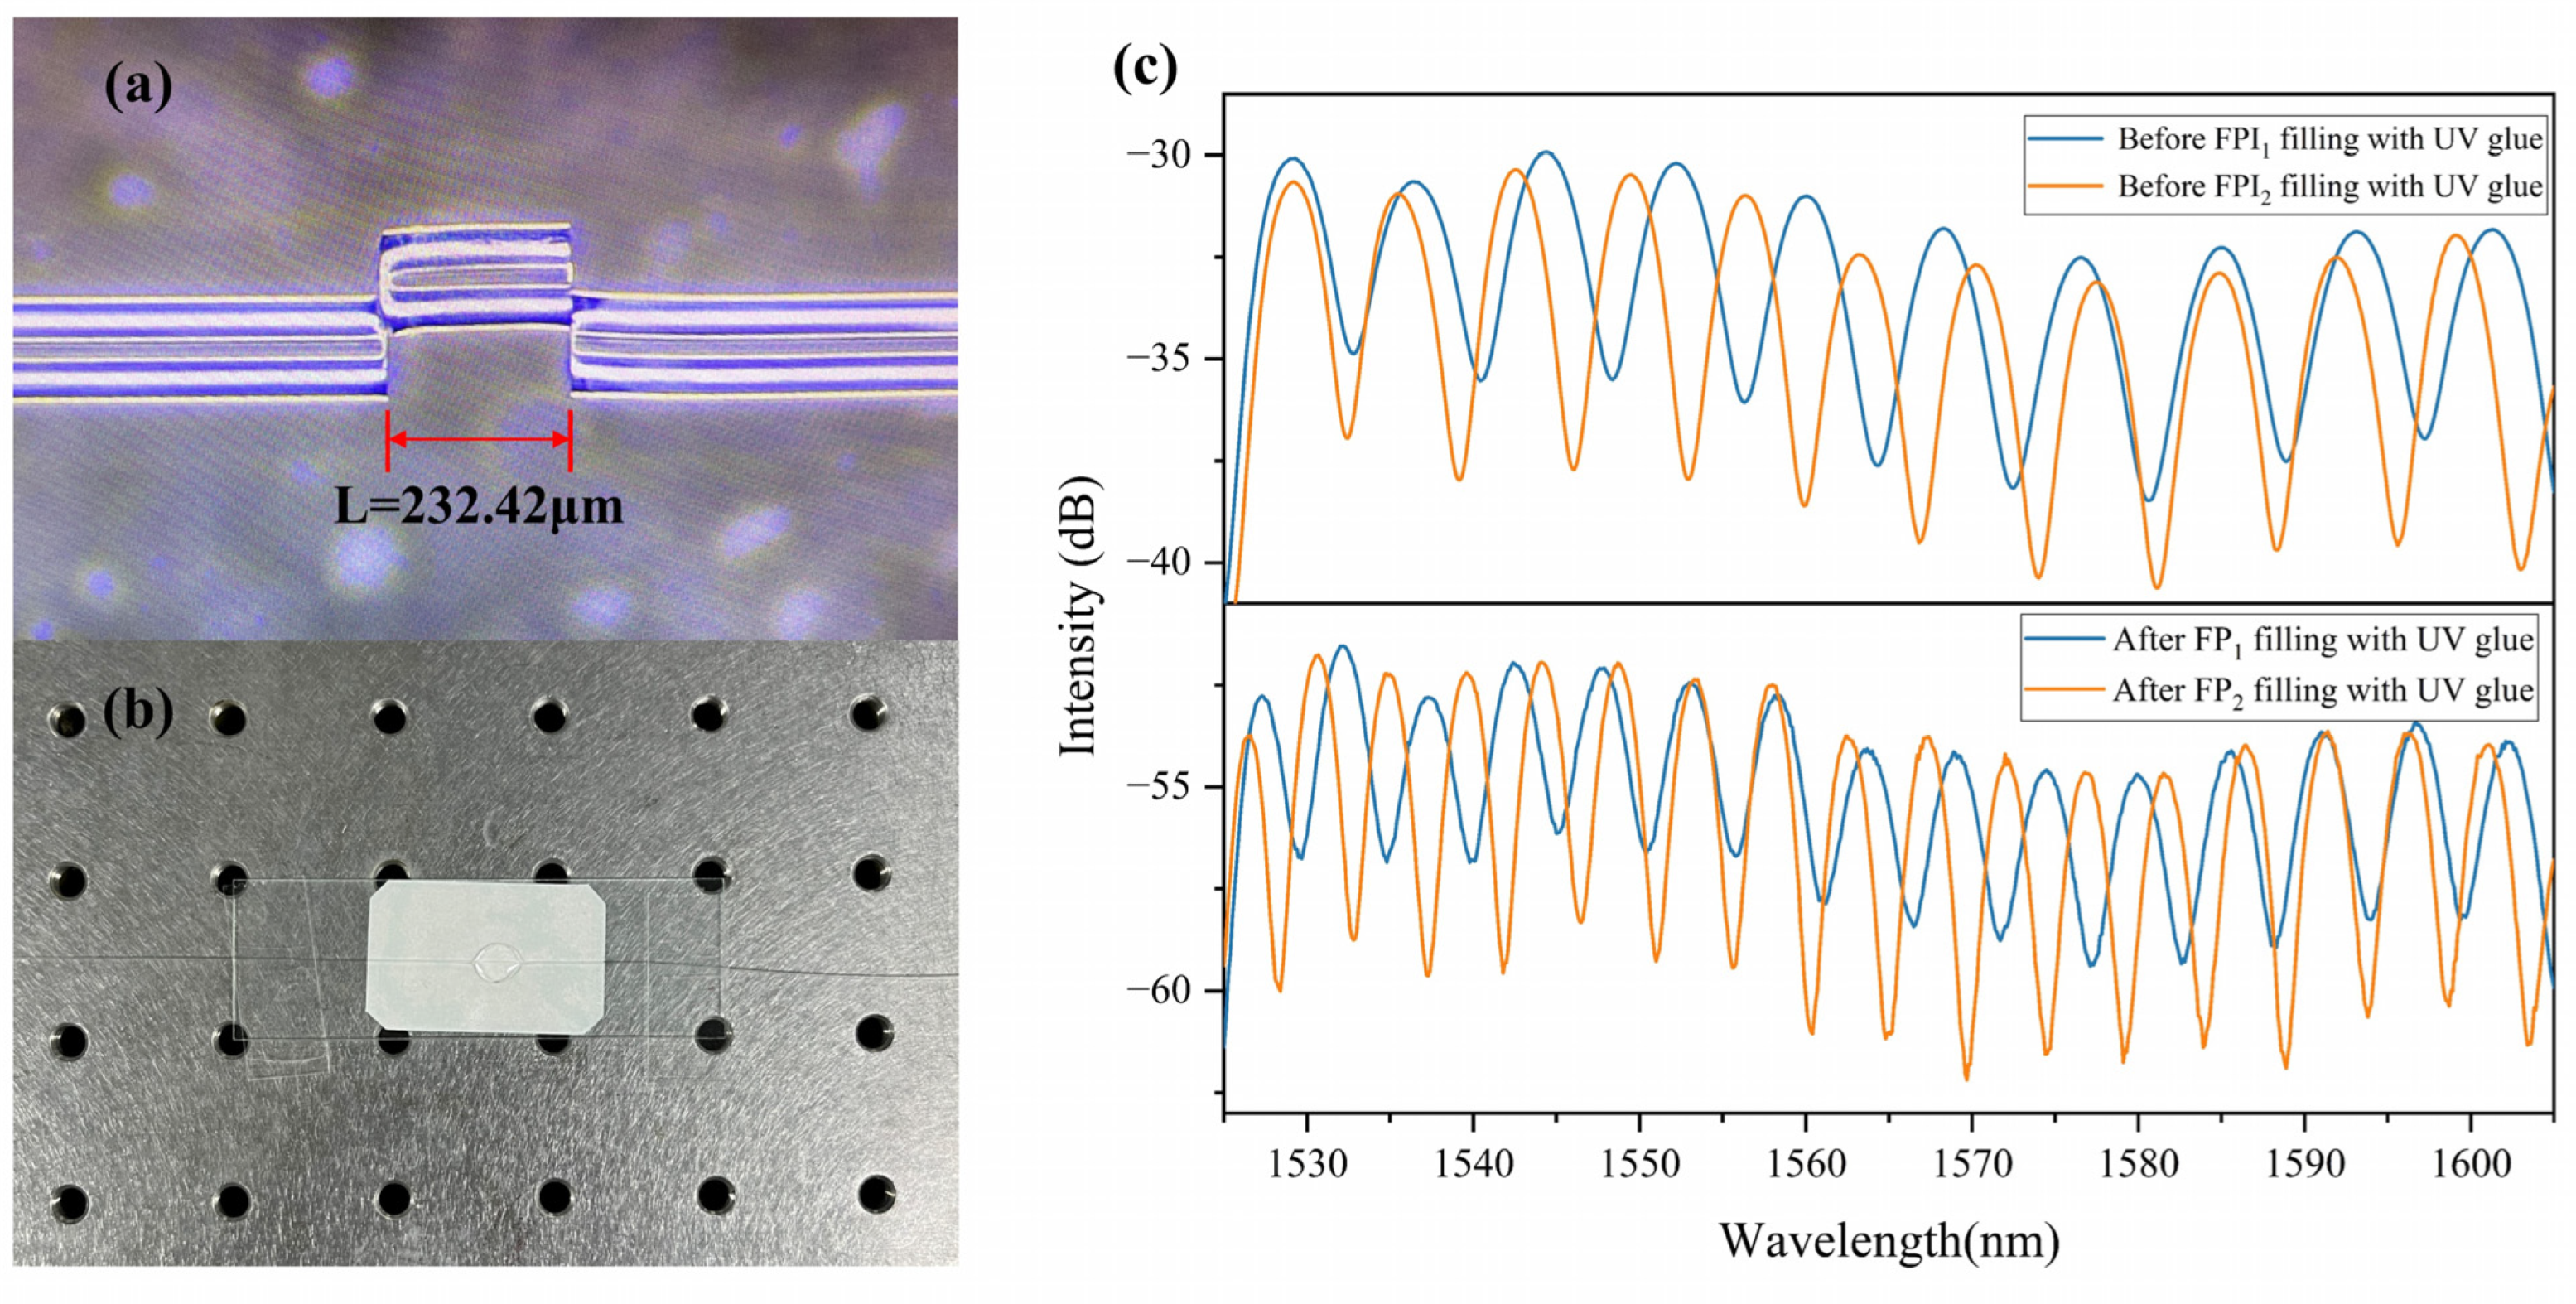
2. Preparation of FPI and Coating of UV Glue

The fabrication process of the Fabry–Perot interferometer (FPI) is illustrated in Figure 1. First, the ends of a 1 × 2 3 dB coupler are connected to a broadband light source (BBS, SC-5, YSL Photonics, Wuhan, China) and an optical spectrum analyzer (OSA, Yokogawa AQ-6317B, Tokyo, Japan), respectively. A segment of single-mode fiber is spliced with the 3 dB coupler, and the other end of the fiber is manually misaligned and spliced using a fusion splicer (JiLong, KL 260B, Nanjing, China). After splicing the first offset point, the fiber is removed, cut with a cutting knife (FC-6S+, Sumitomo Electric Company, Osaka, Japan), and then placed back into the fusion splicer for further splicing.
At this stage, the fiber alignment requires manual adjustment to ensure the first and third sections of the fiber are horizontally aligned. Once the alignment is complete, the broadband light source and optical spectrum analyzer are activated, with the OSA set to repeat scanning mode for real-time monitoring of the interference spectrum. This allows the fiber’s position to be fine-tuned to optimize the interference pattern.
After splicing, the FPI is removed from the fusion splicer, and the right end of the third section of the fiber is roughened to suppress unwanted light reflection. Finally, the interference spectrum is examined to confirm the successful fabrication of the FPI. The soldered FPI is then fixed onto a slide for future use, and a microscope image of the welded FPI is displayed in Figure 2a. The cavity length, L, can be measured using a microscope (WST-2KCH, Shenzhen Jufei Optoelectronics Co., Ltd., Shenzhen, China).
To ensure the consistency of the sensor, Fiber 2 can be precisely cut under a microscope to maintain a uniform length, L, as much as possible. Additionally, the operating parameters of the fusion splicer should be recorded to ensure that each splicing process is conducted under identical conditions.
After the FPI is fabricated, we proceed with the UV glue (GEOPHO, Shanghai Qiangli Trading Co., Ltd., Shanghai, China) coating process. The OSA is turned on, and the repeat scanning function is used to monitor the interference spectrum in real-time. A small amount of UV glue is applied at the misaligned splicing point, and the area is then exposed to UV light to cure the adhesive. Once the interference spectrum stabilizes, it indicates that the UV glue has fully cured, resulting in an FPI coated with UV glue, as shown in Figure 2b. Figure 2c presents the interference spectra of the two FPIs with similar free spectral ranges (FSRs) before and after the UV glue coating. From this, we can observe that the interference peaks of the two FPIs periodically coincide. Only when these two FPIs are connected in parallel can the Vernier effect be realized.

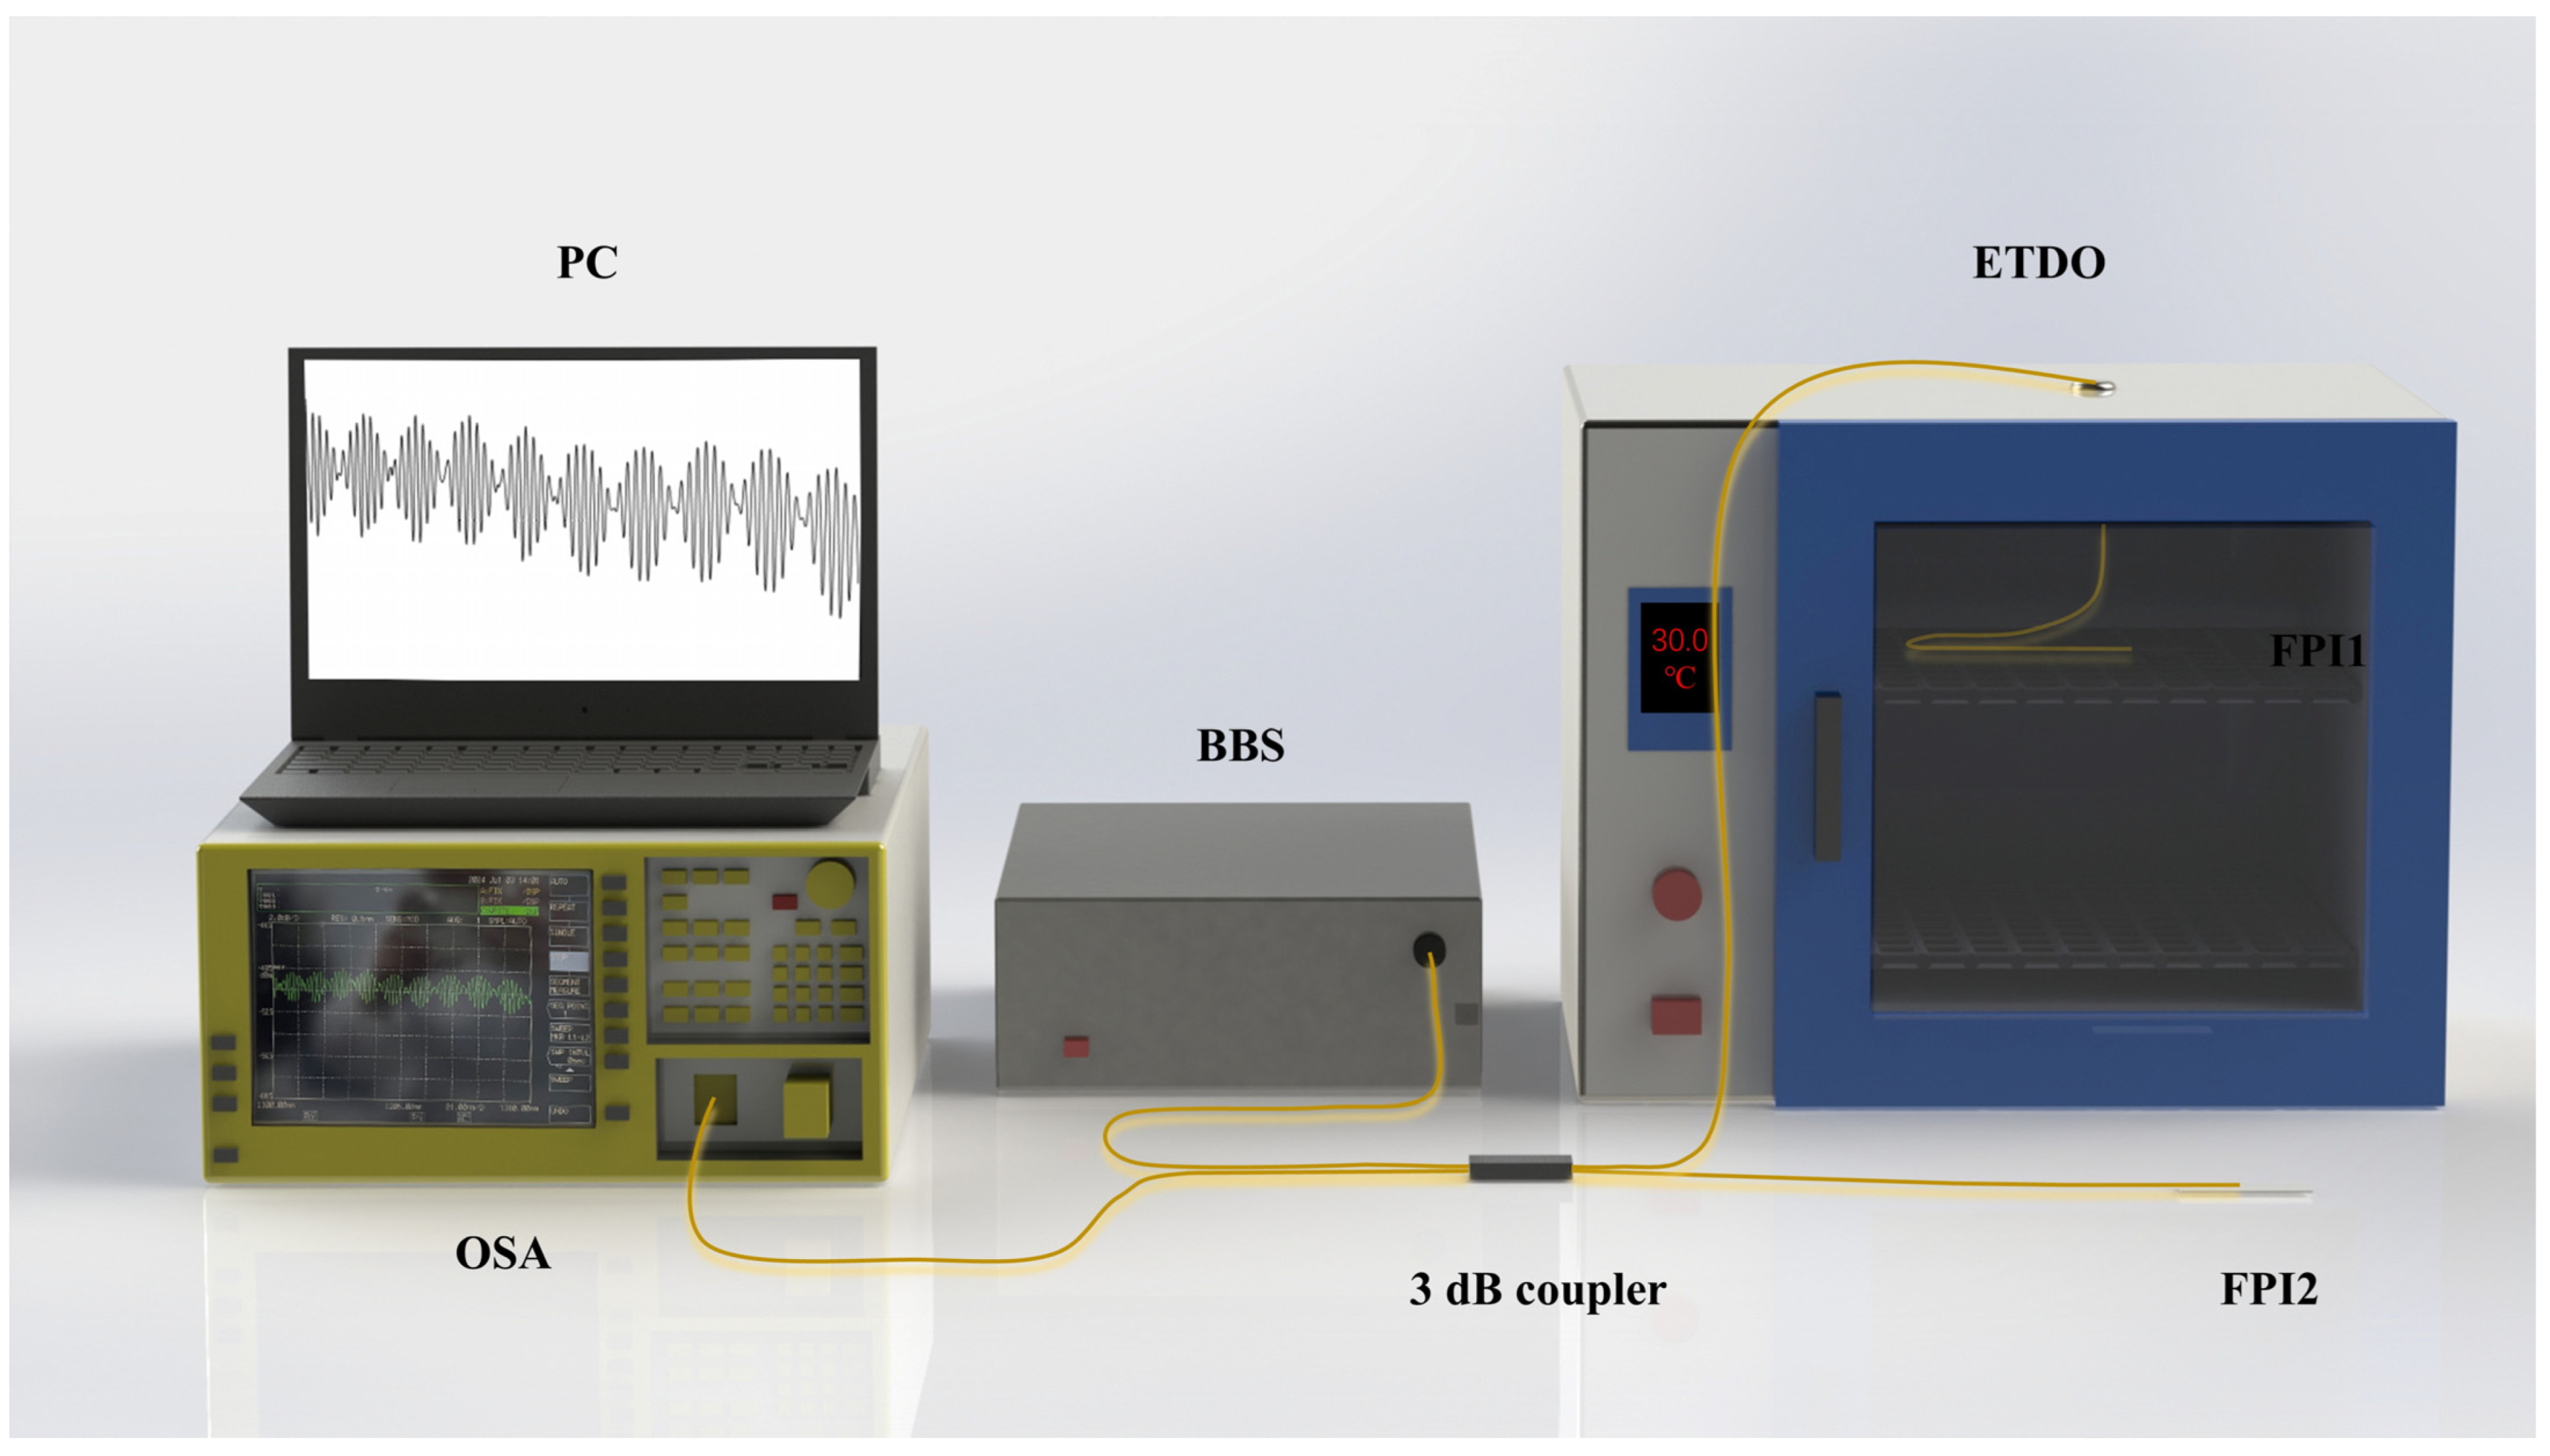
3. Experimental Setup and Working Principle

The sensor structure proposed in this paper is illustrated in Figure 3. A 2 × 2 3 dB coupler is connected to the BBS, the OSA, and two FPIs. When the light emitted by the BBS enters the 3 dB coupler, it is split into two beams, which then propagate to the FP cavities, where interference occurs. The reflected light from the FP cavities is transmitted back to the 3 dB coupler, coupled, and then directed toward the OSA. Once the BBS and OSA are activated, the interference signals combine to produce the Vernier-effect spectrum, which can then be observed on the OSA.
During the FPI fabrication process, the OSA can be used to monitor the real-time reflection spectrum of the FPI structure. When determining the cavity length of the FPI, the FSR of the FPI can be accurately determined. The relationship between the cavity length and the FSR of the FPI is as follows [39]:
F S R = λ 2 2 n a i r L
where λ is the wavelength of the incident light; n a i r is the refractive index of air; and L is the length of the misaligned fiber, i.e., the cavity length. Since it is inconvenient to measure the cavity length of the sensor using a microscope, we can theoretically determine the cavity length using Formula (1).
The wavelength of the interference spectrum peak of the sensor is as follows [39]:
λ m = 4 n a i r L 2 m + 1 , m = 1,2 , 3
The UV glue used in the sensor has a high thermal expansion coefficient. As the temperature increases, the UV glue expands, changing the cavity length, and the refractive index of the UV glue also changes. Therefore, this will cause a shift in the interference spectrum of the sensor. The temperature sensitivity of the FPI can be expressed as follows:
S F P I = d λ m d T = λ m 1 L d L d T + 1 n a i r d n a i r d T
To better track the drift of the Vernier envelope and improve the measurement sensitivity of the sensor, the envelope curve can be obtained using a known curve. The FSR of the envelope curve is expressed as follows [40]:
F S R e n v e l o p e = F S R 1 · F S R 2 F S R 1 F S R 2
where F S R 1 and F S R 2 are the FSRs of the two FPIs that form the Vernier effect.
As the temperature changes, the shift in the reflection spectrum of the parallel-connected FPI is greater than that of a single FPI. The shift in the reflection spectrum is amplified by the Vernier effect, with the amplification factor given by the following [40]:
M = F S R 2 F S R 1 F S R 2
The temperature sensitivity of the Vernier effect in the parallel-connected FPI can be expressed as follows:
S v e r n i e r   e f f e c t = M · S F P I

4. Results and Discussion

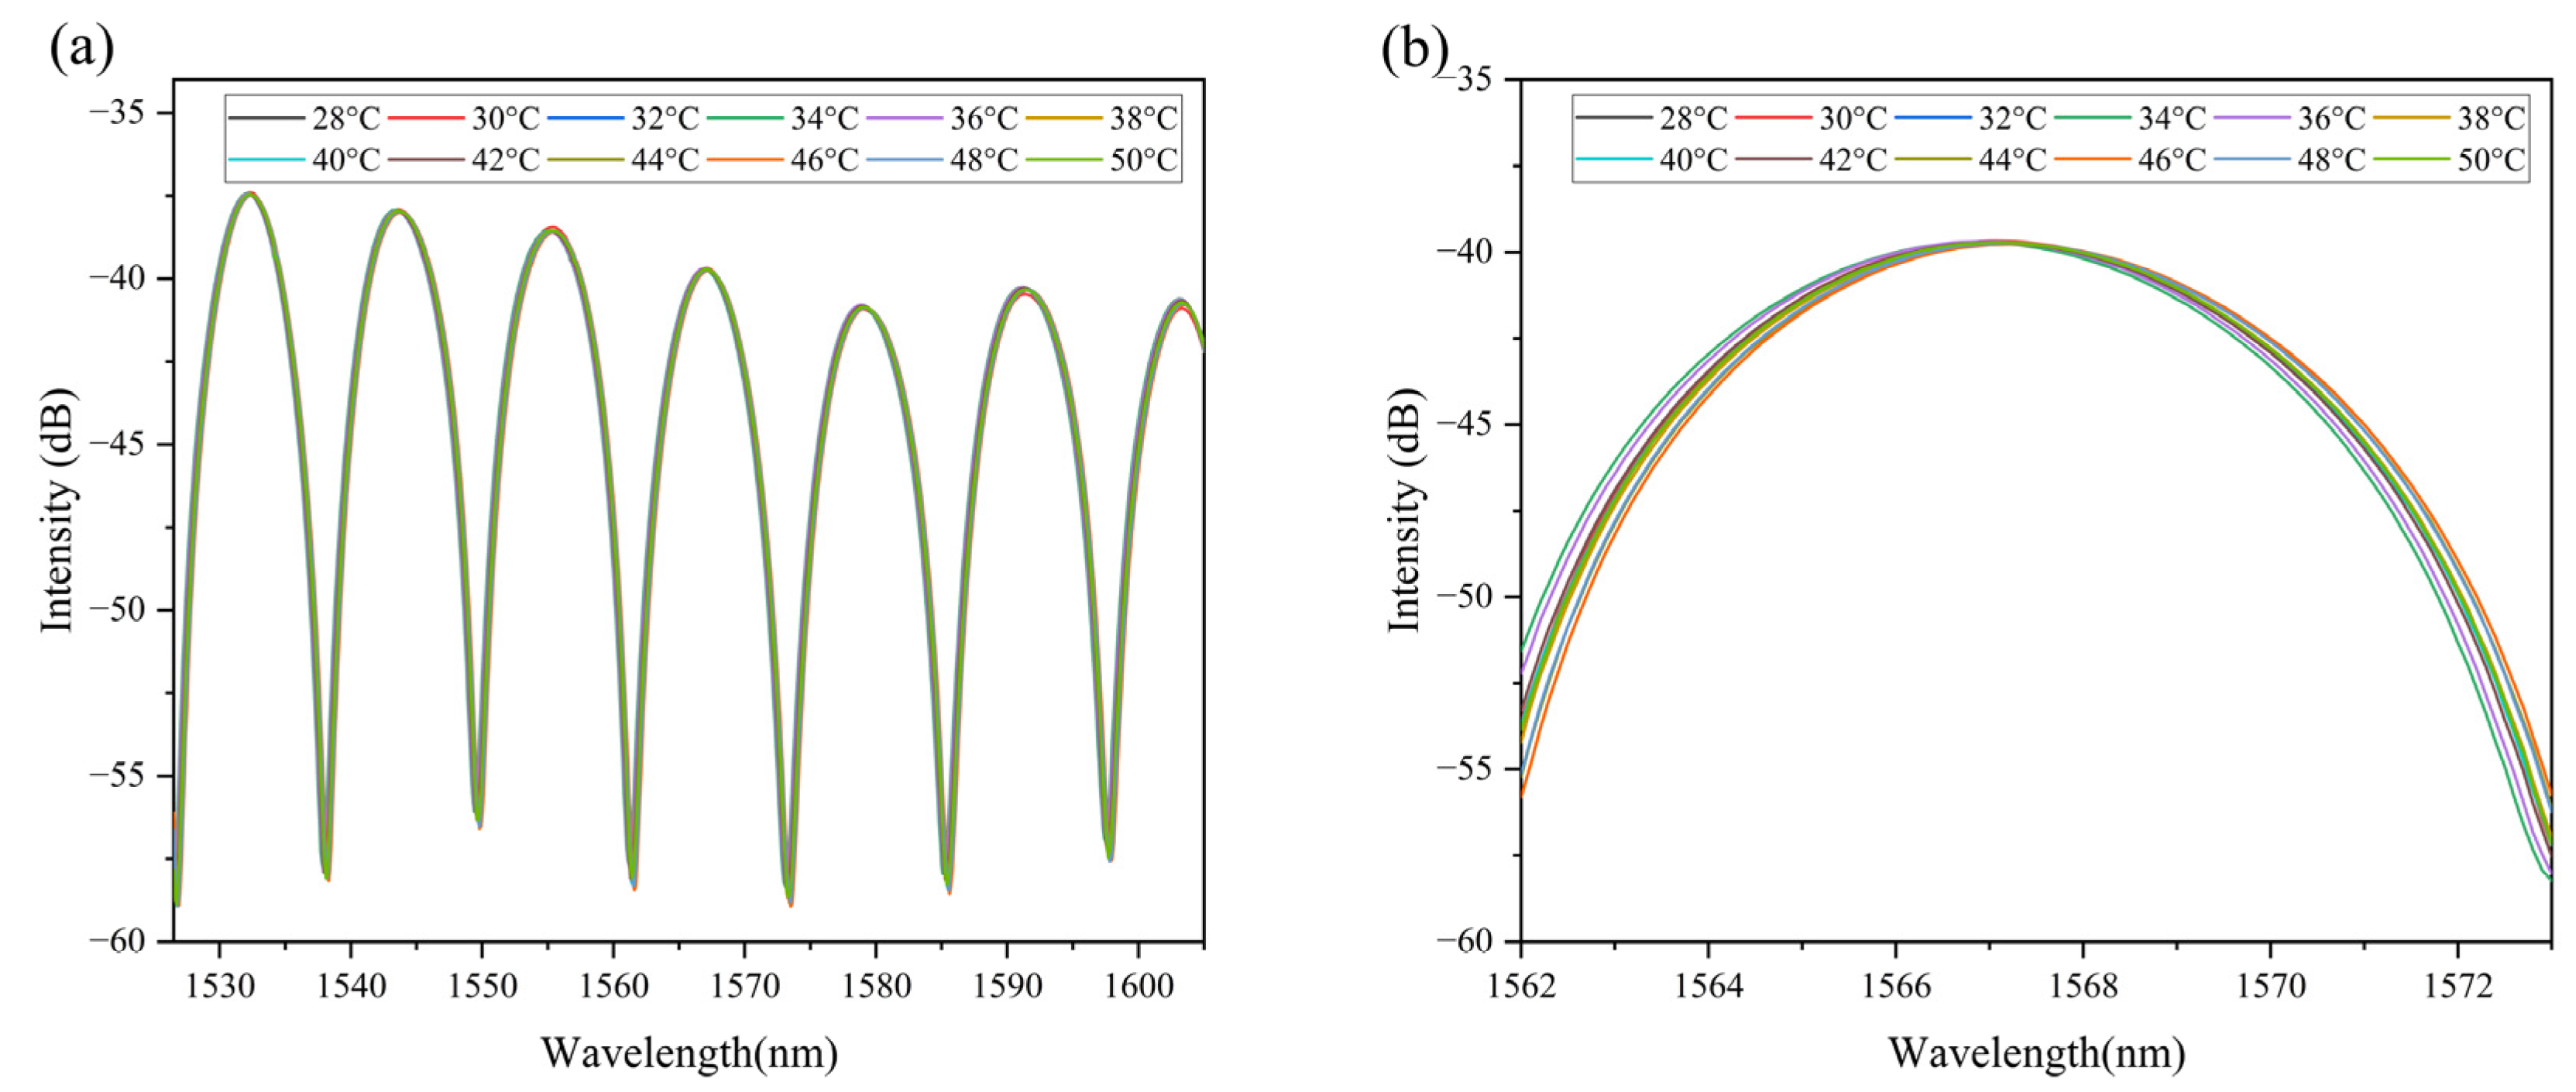
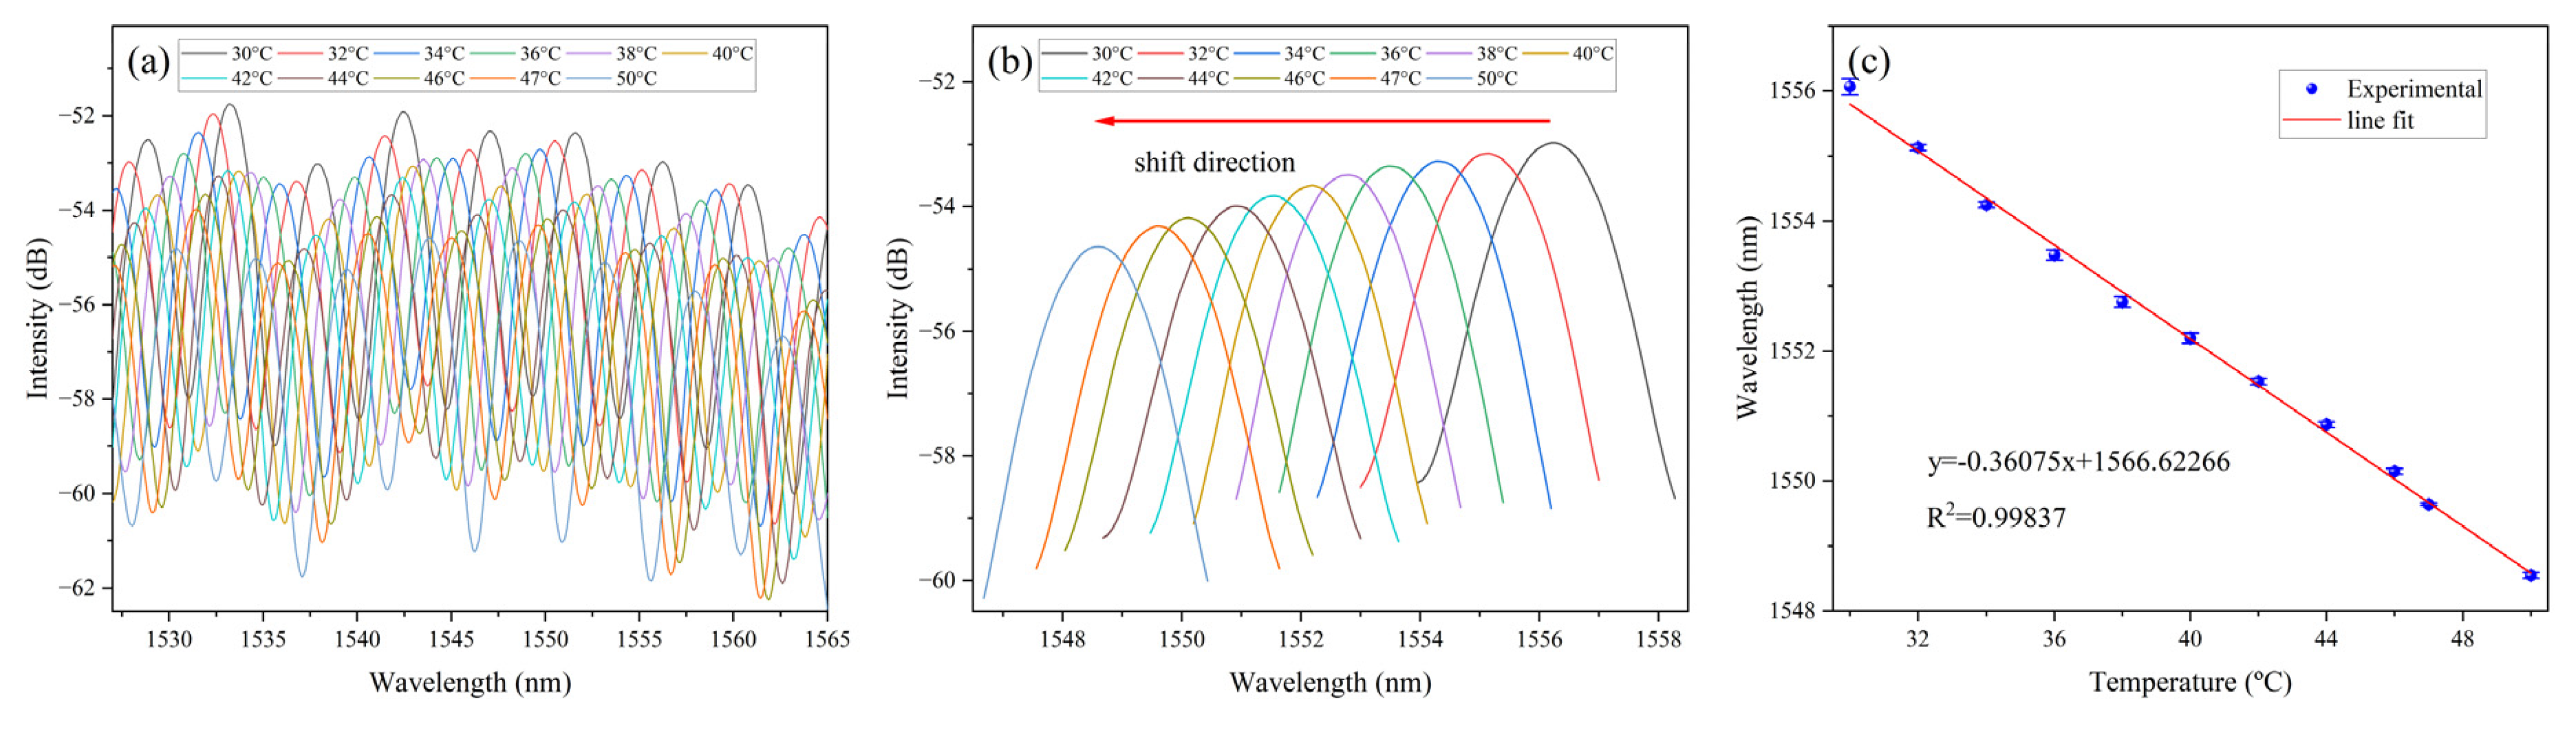
4.1. Temperature Response of the FPI Before Coating with UV Glue

To demonstrate the effectiveness of UV glue as a material for temperature sensors, we conducted a set of comparative experiments. We re-spliced an uncoated FPI and measured its interference spectrum across a temperature range from 28 °C to 50 °C, as shown in Figure 4. The results indicate that the interference spectrum remains largely unaffected by temperature changes, confirming that the uncoated FPI is not sensitive to temperature and exhibits excellent temperature stability. Therefore, a bare FPI alone cannot provide temperature-sensing capabilities, highlighting the necessity of modifying the FPI to enable temperature sensitivity.

4.2. Temperature Response of a Single FPI Coated with UV Glue

To investigate the amplification effect of the optical Vernier principle on sensor sensitivity, we first characterized the temperature sensitivity of a single FPI. A 1 × 2 3 dB coupler connected the BBS, OSA, and the FPI, which was placed inside an electric thermostatic drying oven (ETDO, 101, Beijing Ever Bright Medical Treatment Instrument Co., Ltd., Beijing, China). The temperature was gradually increased from 30 °C to 50 °C, with the interference spectrum recorded at 2 °C intervals. The reflection spectra at various temperatures and the peak shifts are shown in Figure 5a–c. The linear fitting curve of wavelength versus temperature demonstrates a strong linear relationship, with R2 = 0.99837. The sensor’s temperature sensitivity was determined to be −0.36075 nm/°C, with the linear equation y = −0.36075x + 1566.62266, where y is the wavelength and x is the temperature. This result, compared to the uncoated FPI, clearly shows that UV glue significantly enhances temperature sensitivity, making it an ideal material for temperature-sensor fabrication.

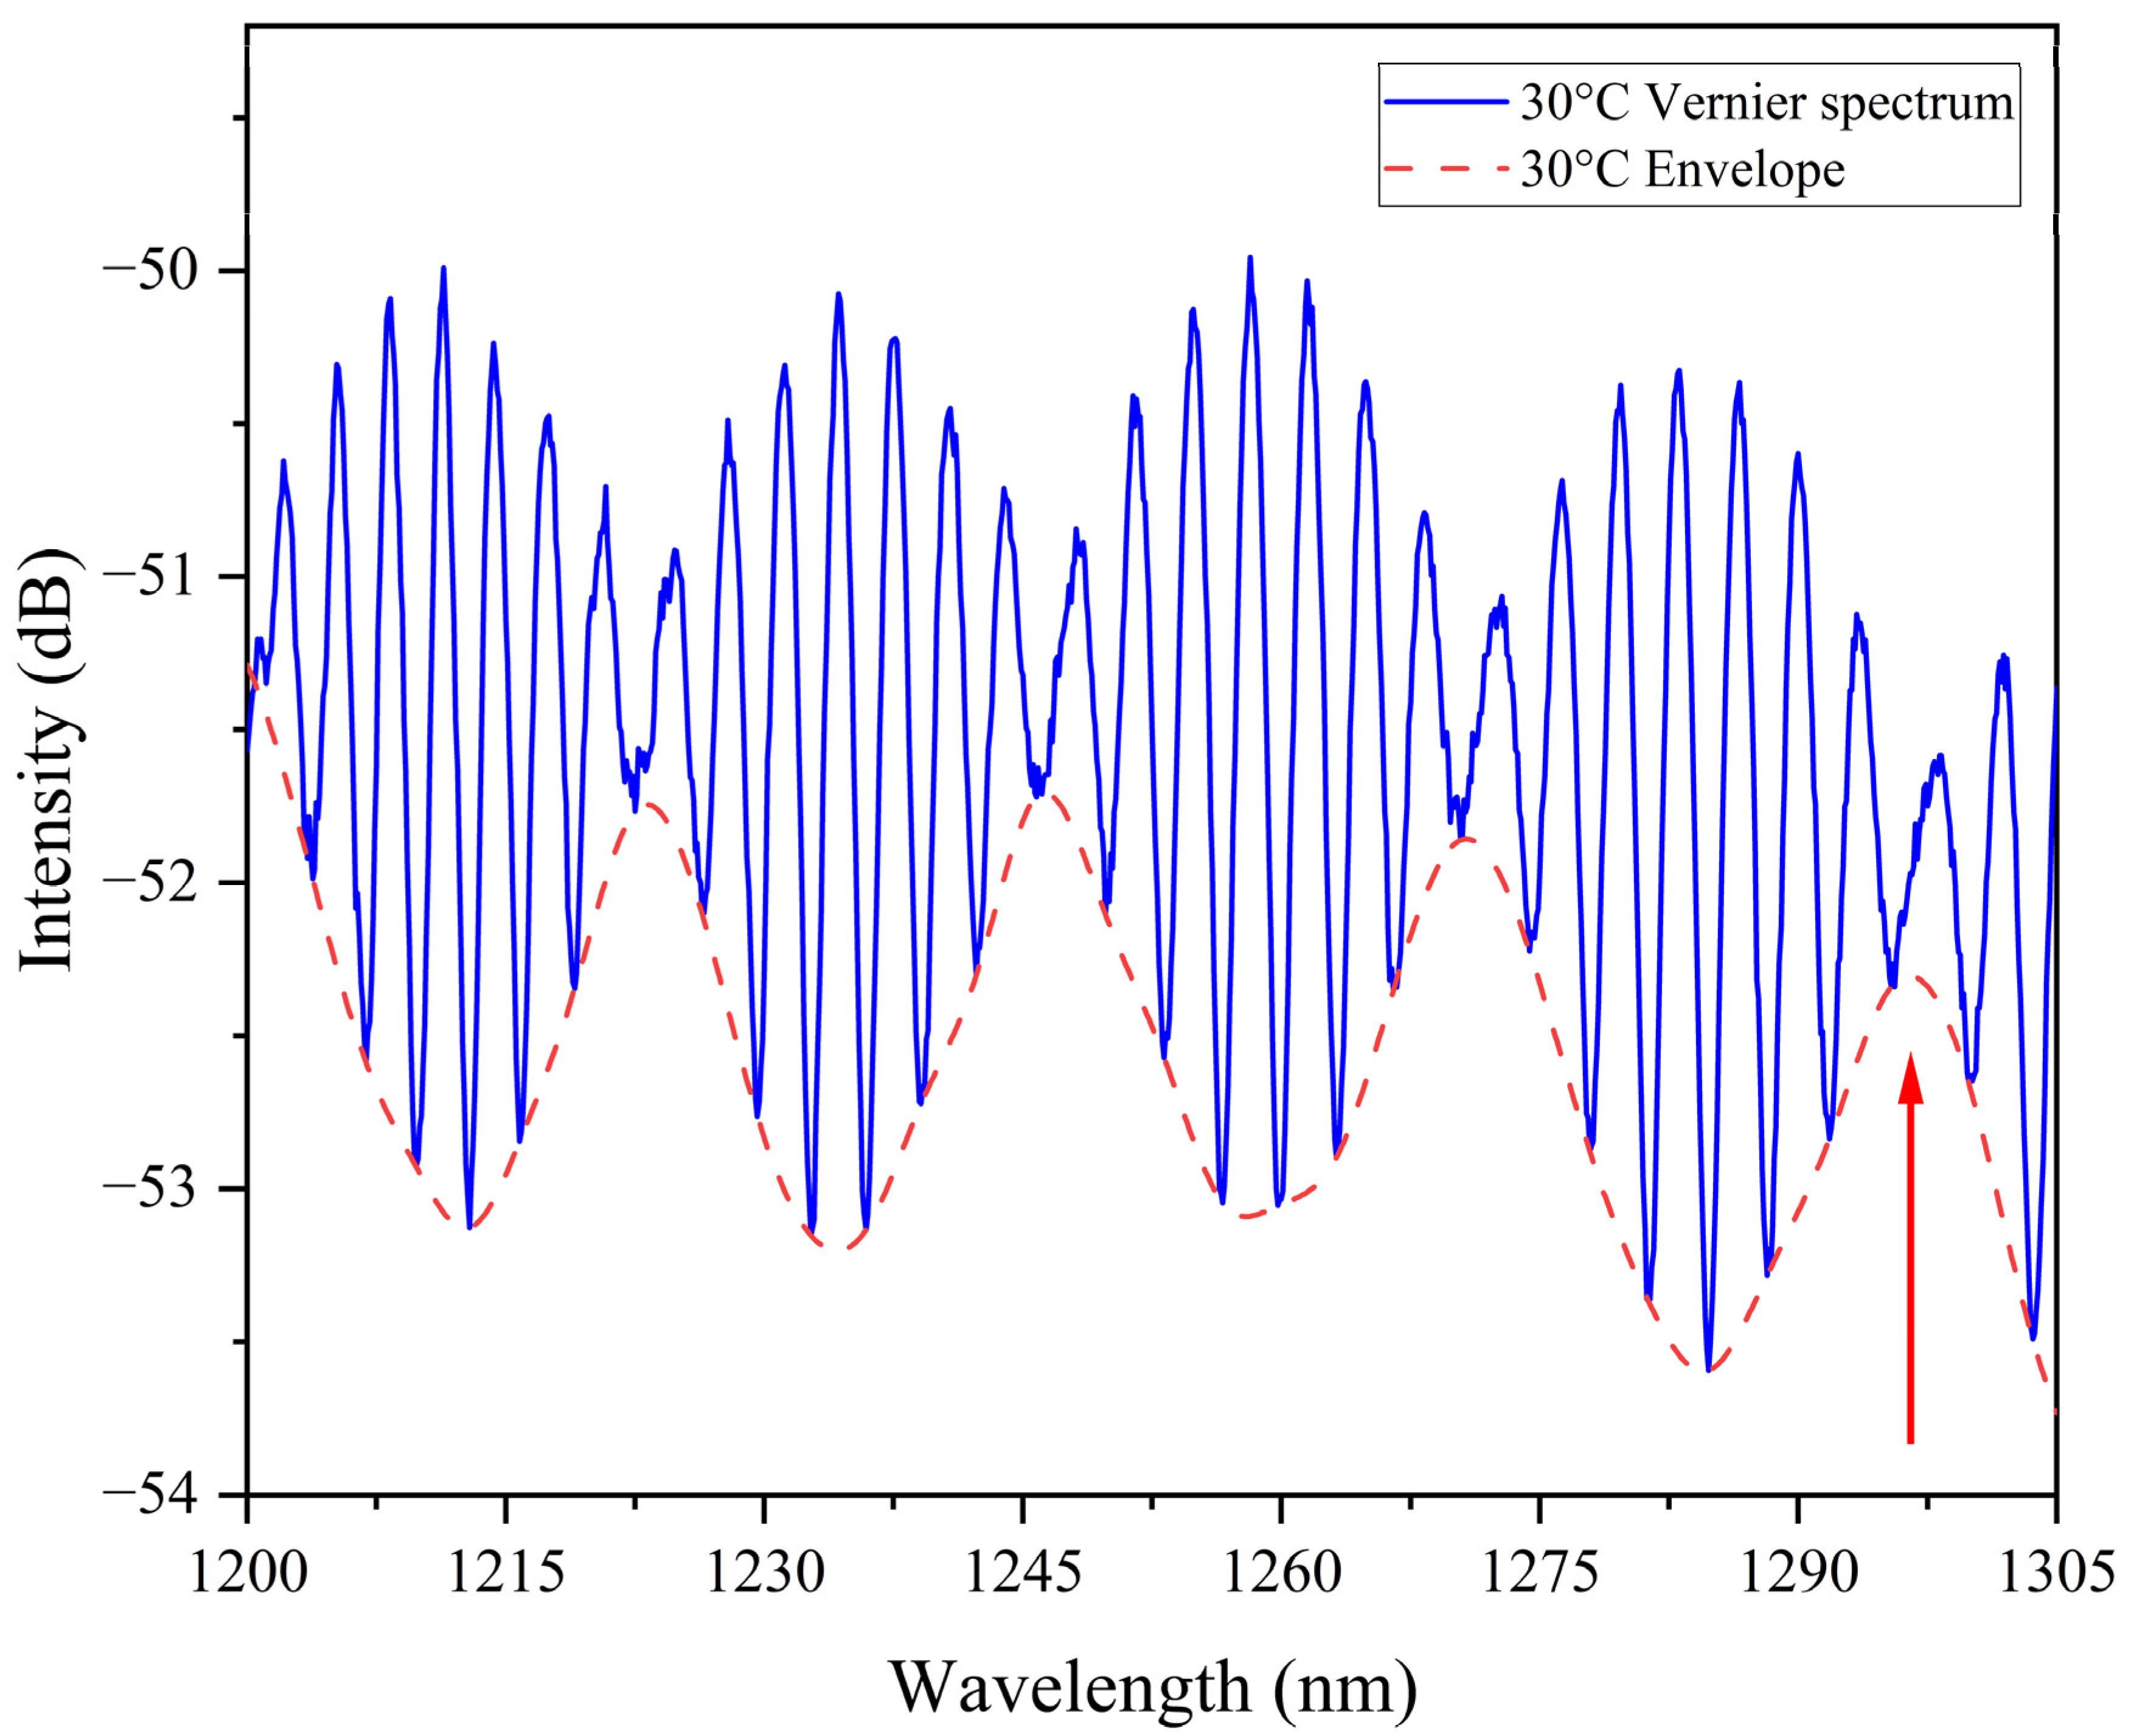
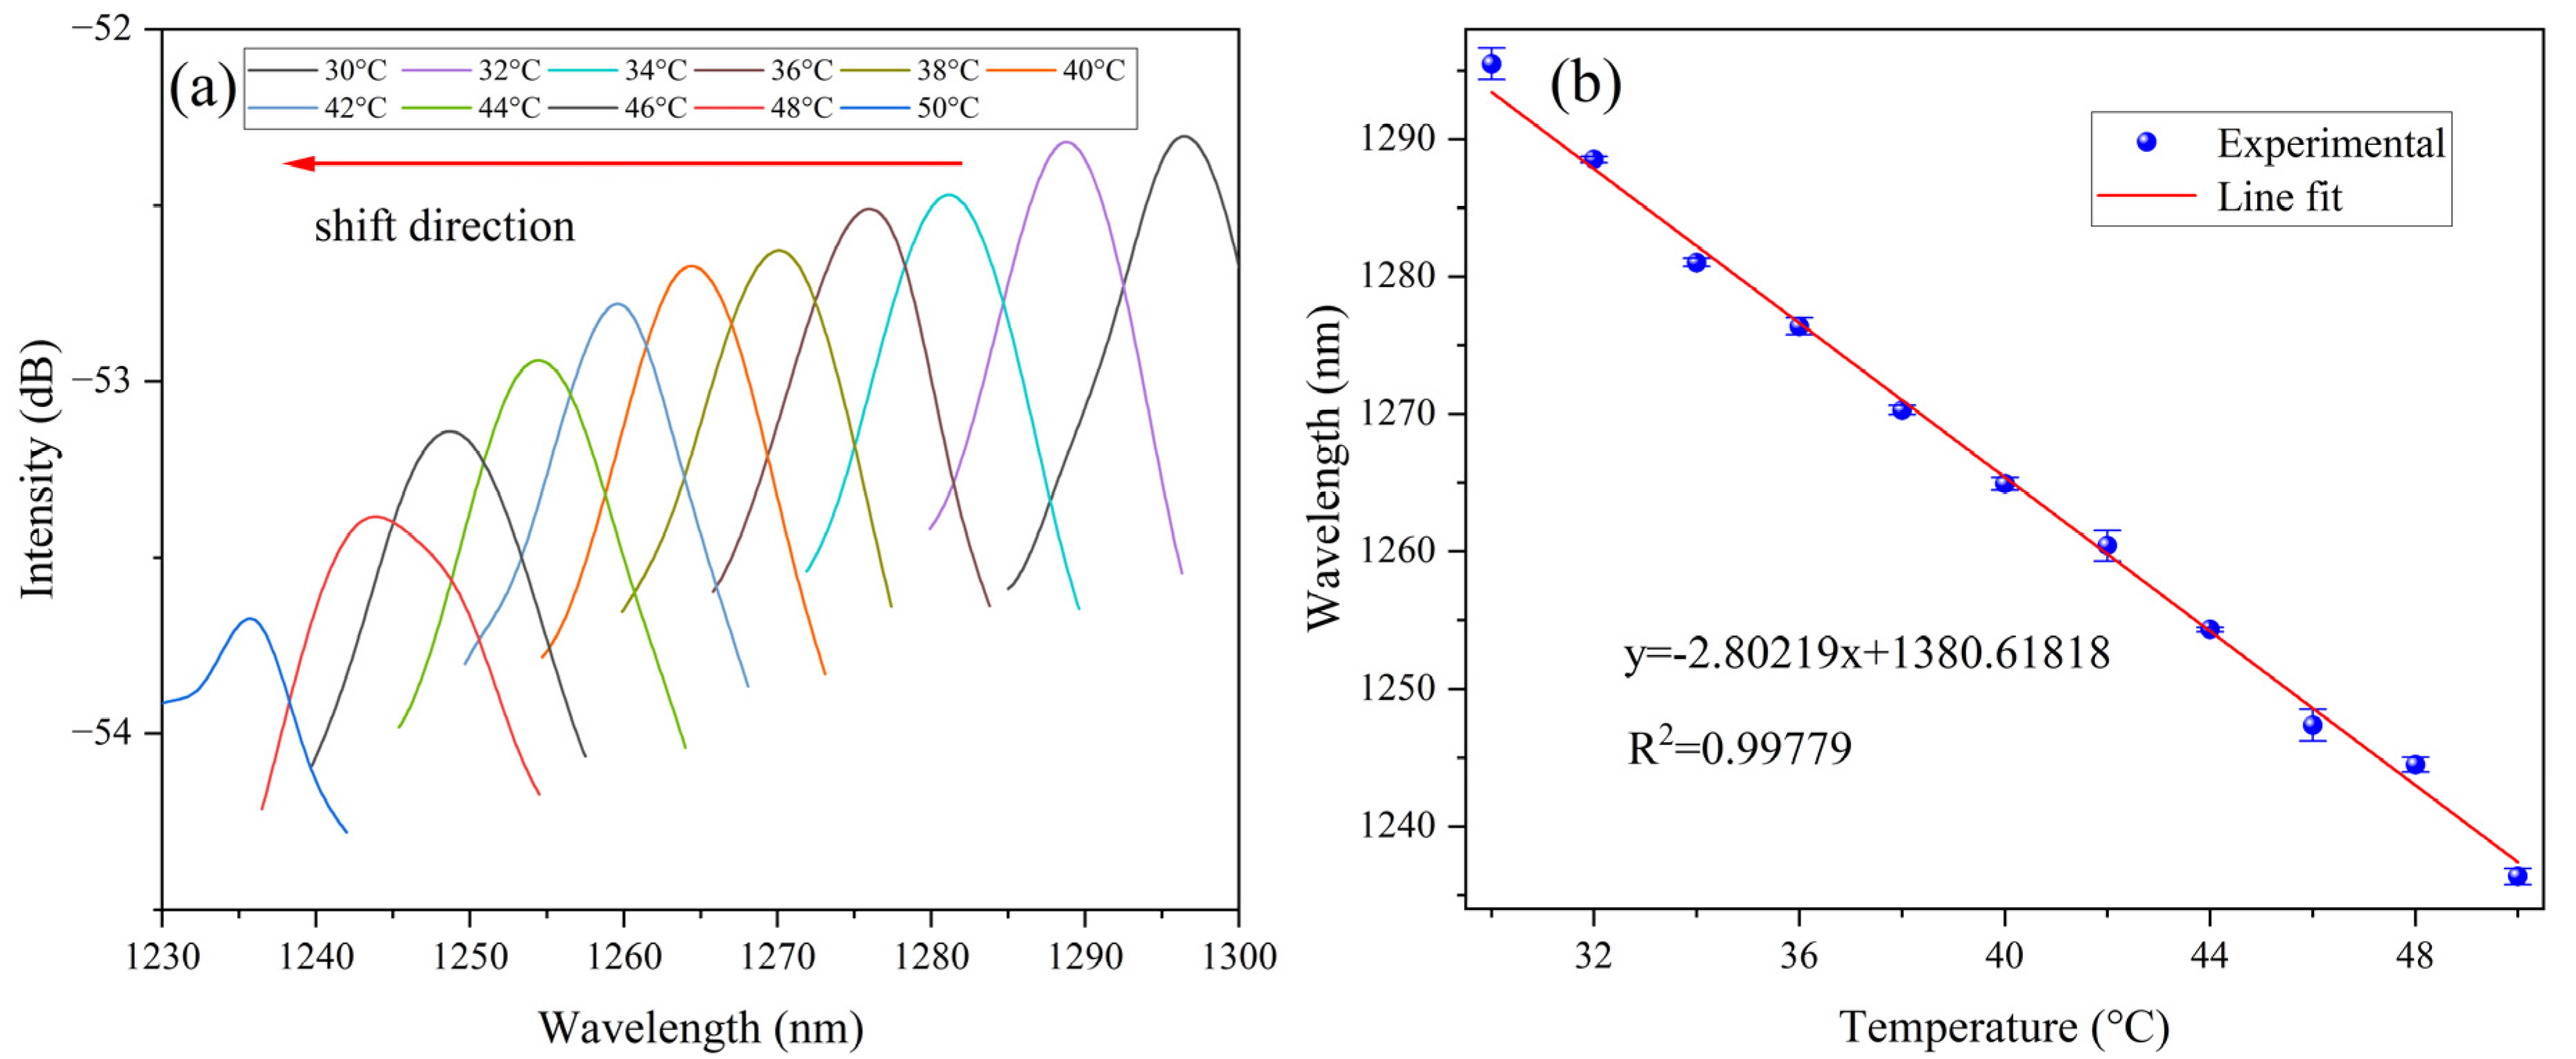
4.3. Temperature Response of the Vernier Effect in Parallel-Connected FPIs Coated with UV Glue

We investigated the amplification effect of the optical Vernier principle on sensor sensitivity using a 2 × 2 3 dB coupler to connect the BBS, OSA, and two FPIs. One FPI, placed in an ETDO, served as the sensing interferometer, while the other, kept nearby, acted as the reference interferometer. To minimize the influence of external environmental factors on the reference interferometer during the experiment, it should be housed in a temperature-controlled sealed container to ensure stability and accuracy.
To track the movement of the Vernier envelope and enhance measurement sensitivity, we derived the envelope curve, as shown in Figure 6. Figure 7a illustrates the reflection spectrum envelope as the ambient temperature rises from 30 °C to 50 °C. In Figure 7b, the wavelength displacement demonstrates a strong linear response with temperature changes, achieving R2 = 0.99779. The linear fitting results reveal a temperature sensitivity of −2.80219 nm/°C, with the fitting equation y = −2.80219x + 1380.61818, where y represents the wavelength, and x the temperature. Compared to the single UV glue-coated FPI, the sensitivity of the Vernier-effect sensor is amplified by a factor of 7.768, confirming the Vernier effect’s significant role in enhancing sensitivity for more precise temperature detection.
As shown in Figure 7a, with increasing temperature, the interference spectra gradually blue-shift, and the intensity of the spectra decreases. Additionally, the contrast of the spectra also diminishes, making it difficult to clearly observe the interference spectra. Furthermore, when the temperature reaches 50 °C, the spectral shift is no longer linear. In some cases, the spectra no longer shift, or the interference pattern disappears entirely, leading to sensor damage that prevents the sensor from returning to its original state, rendering it unusable. These factors collectively prevented us from testing temperatures beyond 50 °C. In future work, we aim to explore strategies to extend the sensor’s operational temperature range while maintaining its stability and reliability. This could involve optimizing the material properties of the UV glue to enhance its thermal stability and improving the structural design of the sensor to mitigate spectral degradation at higher temperatures, thus extending its temperature measurement range.
The comparison between the proposed sensor and previously reported sensors is summarized in Table 1. The sensitivity of our sensor is higher than that of some previously reported sensors. For example, Zhang T et al. proposed a cascaded FPI sensor with a sensitivity of only −0.4825 nm/°C [41], while Hu J H et al. developed a PDMS-modified FPI sensor, achieving a sensitivity of merely 0.698 nm/°C [42]. Yu Zeng et al. reported a sensor with a sensitivity of 14.33 nm/°C, but its measurement range is limited to 34.9–38.5 °C, restricting its applicability. Jinde Yin et al. reported a sensor with a high sensitivity of 142.02 nm/°C and a wide measurement range from −20 °C to 70 °C, making it suitable for various applications. However, this sensor relies on MEMS fabrication technology, which requires complex micro/nanofabrication processes and features a sealed cavity structure, potentially limiting its adaptability to different application scenarios. Compared to previous sensors, our approach offers a more efficient and straightforward fabrication process, requiring only standard single-mode fiber and readily available UV glue with a short curing time while achieving relatively high sensitivity.

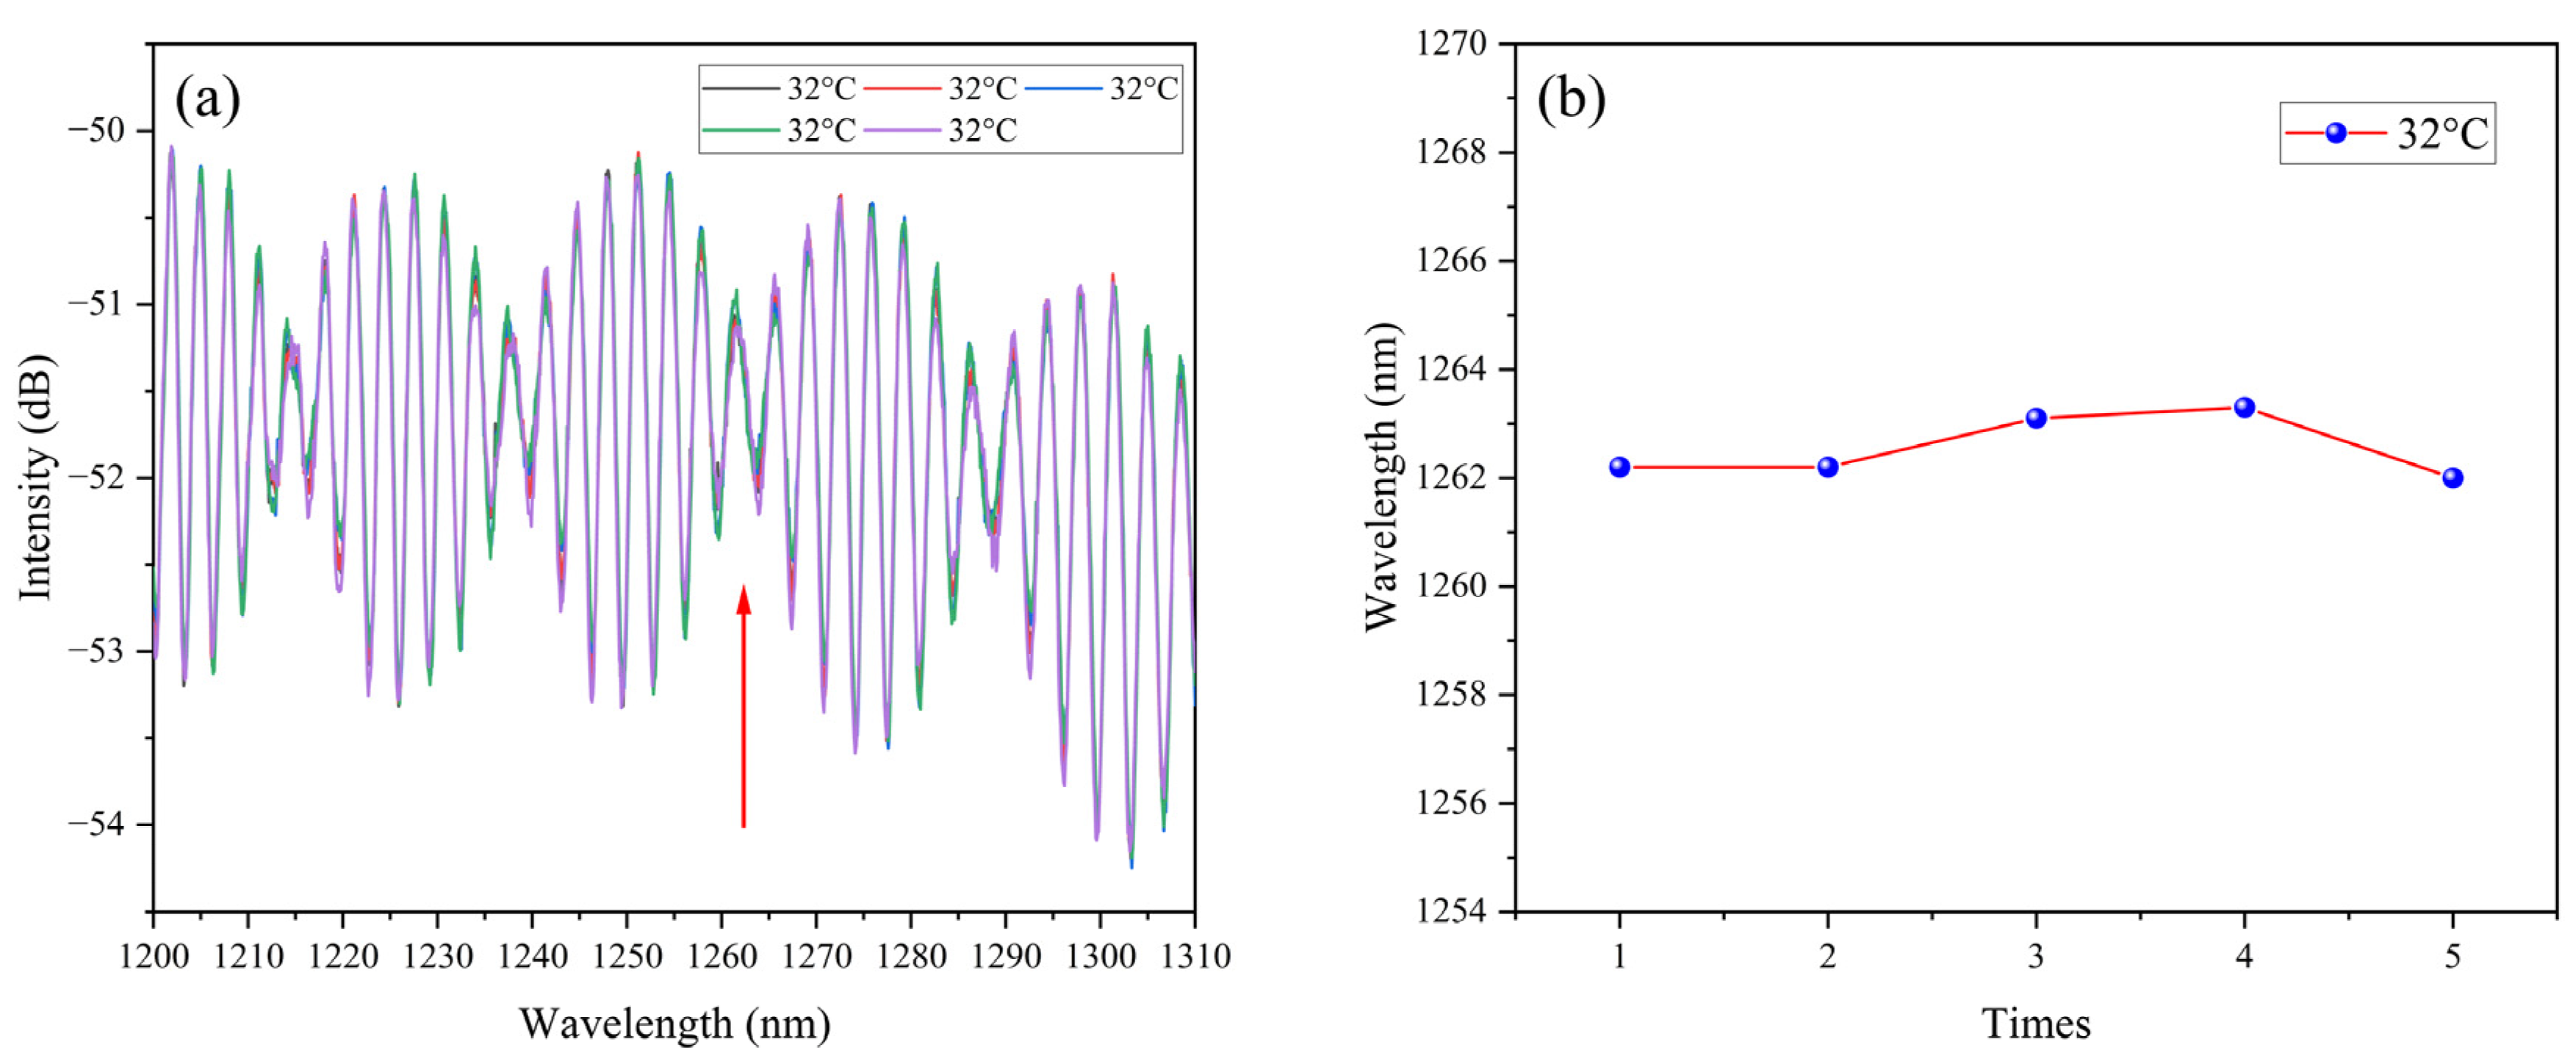
4.4. Characterization of Reproducibility

Reproducibility is a crucial parameter in assessing sensor performance. To evaluate this, we conducted five independent experiments on the sensor, recording its spectrum at 32 °C every hour. The results, illustrated in Figure 8, demonstrate that the sensor exhibits good reproducibility, confirming its reliability across multiple tests. This remarkable robustness not only ensures sustained performance over prolonged periods but also positions the sensor as a highly reliable candidate for demanding real-world applications that require precise and continuous long-term monitoring.

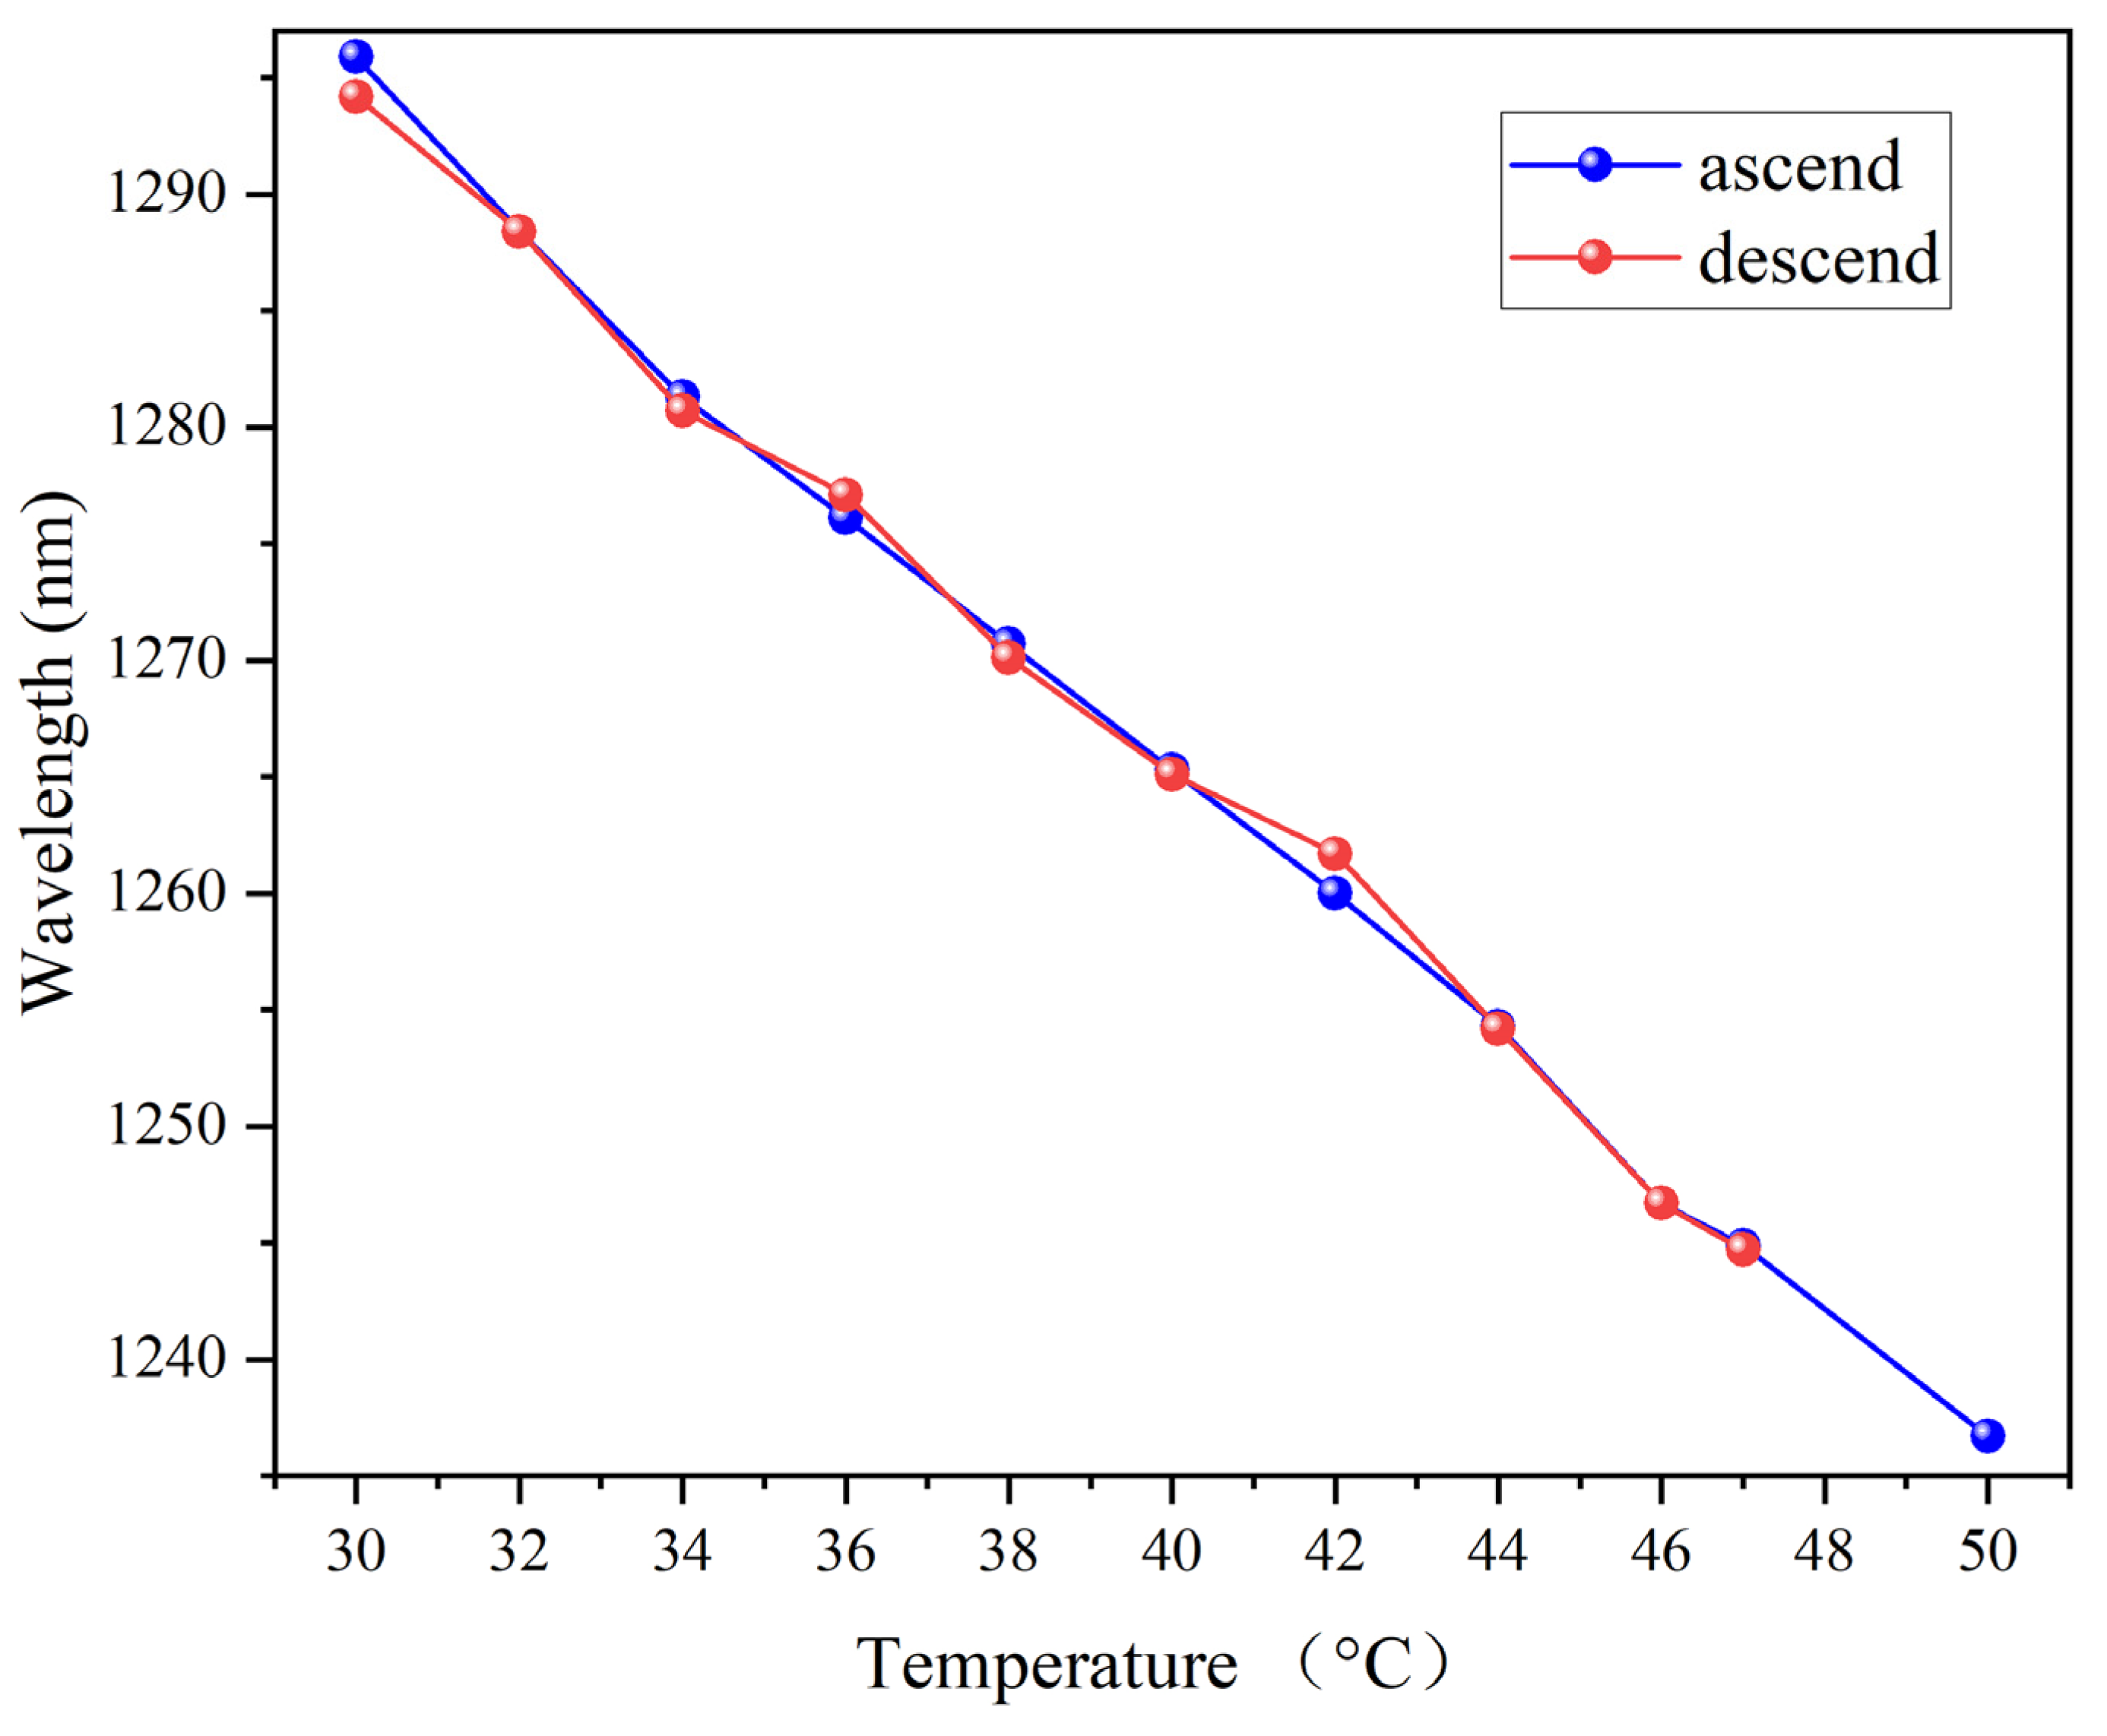
4.5. Characterization of Reversibility

Reversibility is a key factor in assessing sensor performance. To evaluate the reversibility of the proposed sensor, we conducted an experiment by turning on the BBS, OSA, and ETDO. The temperature was gradually increased from 30 °C to 50 °C, with the reflection spectrum recorded at every 2 °C increment. After reaching 50 °C, the heating was stopped, and the temperature was allowed to cool naturally back to 30 °C, again recording the reflection spectrum at 2 °C intervals.
The peak positions of the reflection spectrum during both the heating and cooling cycles are presented in Figure 9, demonstrating that the sensor maintains consistent behavior in both processes, confirming its excellent reversibility. These results underscore the sensor’s potential for long-term and repeatable temperature-monitoring applications.

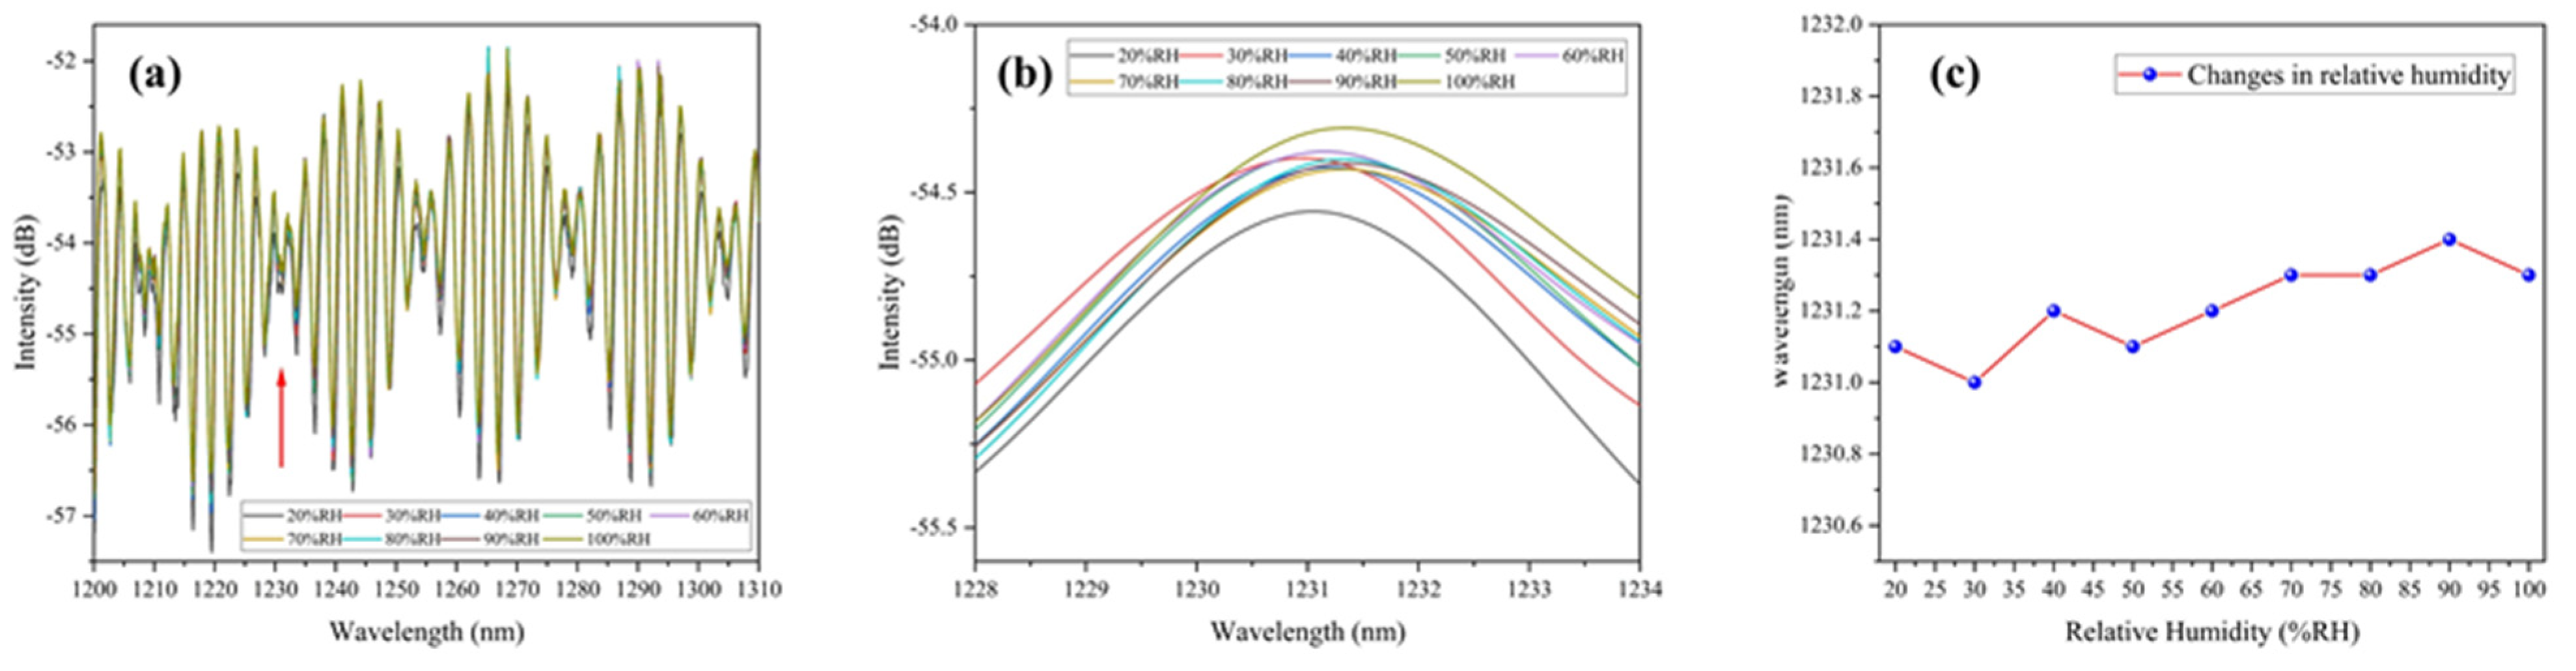
4.6. Humidity Response of the Vernier Effect in Parallel-Connected FPIs Coated with UV Glue

We observed that UV glue is sensitive to humidity [41]. Therefore, we designed experiments to characterize the humidity sensitivity of the sensor. During the experiment, the sensor interferometer was placed inside a sealed container, and the humidity was gradually changed using a humidifier. An electronic hygrometer (Anymetre JR900) was placed inside to measure the humidity in real time. The relative humidity was controlled and increased gradually from 20% RH to 100% RH, with interference spectra recorded at 10% RH intervals. The reference interferometer was placed in another sealed container to maintain unchanged environmental parameters. As shown in the Figure 10a–c, within the range from 20% RH to 100% RH, the position of the envelope’s peak fluctuated between 1231.0 nm and 1231.4 nm as the relative humidity increased, with a fluctuation range of only 0.4 nm. This indicates that the sensor shows no significant response to changes in humidity, demonstrating good humidity stability.

5. Conclusions

In summary, we have developed a high-sensitivity temperature sensor based on an F-P cavity and the Vernier effect, achieving a sensitivity of −2.80219 nm/°C. Our experiments reveal that the UV glue employed in the sensor exhibits a high thermal expansion coefficient. As the temperature increases, the UV glue expands, leading to changes in the cavity length and the refractive index, which in turn shifts the sensor’s interference spectrum. This research demonstrates that integrating temperature-sensitive materials with optical fiber sensors significantly enhances their sensitivity, while the optical Vernier effect further amplifies the sensitivity of a single optical fiber sensor. Through repeated tests, we found that the sensor has good repeatability and reversibility. Our sensor exhibits minimal response to ambient humidity. Our approach offers a more convenient and straightforward fabrication process compared to previous sensors, utilizing only standard single-mode fiber and readily available UV glue with a short curing time. The sensor also boasts advantages such as a compact design, simple structure, and low cost. Moreover, due to the properties of UV glue, the fragile FP structure immediately after welding becomes more robust, making it highly suitable for a wide range of temperature-measurement applications in daily life.

Author Contributions

C.Q., conceptualization, investigation, methodology, and writing—original draft; C.C., supervision, validation, and writing—review and editing; Y.W., supervision, validation, and writing—review and editing; X.Y. (Xinghua Yang), writing—review and editing, validation, supervision, resources, and data curation; X.Y. (Xinyu Yang), writing—review and editing, and supervision; Y.H., writing—review and editing, and supervision; X.W., writing—review and editing, and supervision; P.T., writing—review and editing, and supervision; B.Z., writing—review and editing, and supervision; S.S., writing—review and editing, and supervision; A.J., writing—review and editing, and supervision; K.L., writing—review and editing, and supervision. All authors have read and agreed to the published version of the manuscript.

Funding

This work is supported by the National Natural Science Foundation of China (NSFC, 11574061), the Fundamental Research Funds for the Central Universities, and the Henan Province Outstanding Foreign Scientist Workshop (GZS2022003).

Institutional Review Board Statement

Not applicable.

Informed Consent Statement

Not applicable.

Data Availability Statement

The data underlying the results of this study can be obtained from the corresponding author upon request.

Conflicts of Interest

The author Bo Zhang was employed by the company Henan Academy of Special Optics Ltd. Other authors declare no conflicts of interest.

References

  1. Li, J.; Yang, J.; Ma, J. Highly sensitive temperature sensing performance of a microfiber Fabry-Perot interferometer with sealed micro-spherical reflector. Micromachines 2019, 10, 773. [Google Scholar] [CrossRef]
  2. Wei, R.; Bao, X. A low power energy-efficient precision CMOS temperature sensor. Micromachines 2018, 9, 257. [Google Scholar] [CrossRef] [PubMed]
  3. Ferreira, R.; Paixao, T.; Lopes, G.; Domingues, M.F.; Oliveira, R.; Antunes, P. Vernier effect-based optical fiber sensor for humidity and temperature monitoring. IEEE Photonic Tech. L. 2021, 33, 1061–1064. [Google Scholar] [CrossRef]
  4. Maldonado-Hurtado, D.G.; Llera, M.; Flahaut, F.; Benoit, J.; Barrera, D. Weight measurement and vibration detection sensor based on a thermoplastic polyurethane optical fiber. J. Light. Technol. 2023, 42, 1740–1747. [Google Scholar] [CrossRef]
  5. Yuan, Y.; Tong, R.; Xing, B.; Wu, S.; Zheng, H.; Zhao, Y. Cascaded vernier effect optic fiber temperature sensor with DSHF-Based MZI and FPI. Measurement 2024, 231, 114625. [Google Scholar] [CrossRef]
  6. Ghaffar, A.; Ru, F.; Liu, J.; Chen, G.Y.; Ni, J.; Liu, J.; Hussian, S.; Yu, J.; Das, B.; Mehdi, M. High pressure sensor based on intensity-variation using polymer optical fiber. Sci. Rep. 2024, 14, 18604. [Google Scholar] [CrossRef]
  7. Wang, X.; Xiao, Y.; Rans, C.; Benedictus, R.; Groves, R.M. Enhanced strain measurement sensitivity with gold nanoparticle-doped distributed optical fiber sensing. Struct. Control. Health Monit. 2024, 2024, 2716156. [Google Scholar] [CrossRef]
  8. Rao, X.; Zhao, L.; Xu, L.; Wang, Y.; Liu, K.; Wang, Y.; Chen, G.Y.; Liu, T.; Wang, Y. Review of optical humidity sensors. Sensors 2021, 21, 8049. [Google Scholar] [CrossRef]
  9. Sampath, U.; Kim, D.; Song, M. Hydrous ethanol detection using a graphene oxide-coated Fresnel reflection sensor. IEEE Sens. J. 2019, 19, 4069–4073. [Google Scholar] [CrossRef]
  10. Li, A.; Wen, X.; Ma, H.; Yang, X.; Jiang, H.; Teng, P.; Zhang, B.; Li, K.; Sivanathan, S.; Roula, M.A. Smartphone-based selective and sensitive detection of vitamin B1 in synthetic urine using U-bend SPR optical fiber probe. Opt. Fiber Technol. 2024, 84, 103769. [Google Scholar] [CrossRef]
  11. Fu, R.; Chen, X.; Yan, X.; Li, H.; Hu, T.; Wei, L.; Qu, Y.; Cheng, T. Optical fiber sensors for heavy metal ion sensing. J. Mater. Sci. Technol. 2024, 189, 110–131. [Google Scholar] [CrossRef]
  12. Xu, F.; Ma, J.; Hu, K.; Zhang, Z.; Ma, C.; Guan, B.; Chen, K. Ultrahigh sensitivity of hydrogen detection with a perforated Pd film on a miniature fiber tip. Sens. Actuat. B Chem. 2024, 400, 134875. [Google Scholar] [CrossRef]
  13. Fan, Z.; Zhong, S.; Zhao, K.; Wang, Q.; Li, Y.; Zhang, G.; Ma, G.; Zhao, J.; Yan, H.; Huang, Z.; et al. A Hermetic Package Technique for Multi-Functional Fiber Sensors through Pressure Boundary of Energy Systems Based on Glass Sealants. Photonics 2024, 11, 792. [Google Scholar] [CrossRef]
  14. Ding, Y.; Chen, Y.; Luo, S.; Ling, Q.; Zhang, Y.; Yu, Z.; Guan, Z.; Chen, D. All-fiber MZI hydrostatic pressure sensor. Opt. Laser Technol. 2024, 171, 110414. [Google Scholar] [CrossRef]
  15. Yang, Y.; Zhang, Y.; Mu, X.; Sun, L.; Wang, J.; Li, Y. Fiber optic temperature sensor based on the harmonic Vernier effect generated by two Sagnac interferometers. IEEE Sens. J. 2024, 24, 12419–12425. [Google Scholar] [CrossRef]
  16. Shao, M.; Yuan, Y.; Liu, Y.; Fu, H.; Qiao, X. All-fiber Michelson interferometer for heart rate and breath monitoring. IEEE Sens. J. 2024, 24, 23909–23917. [Google Scholar] [CrossRef]
  17. Wang, Q.; Zhang, D.; Qian, Y.; Yin, X.; Wang, L.; Zhang, S.; Wang, Y. Research on fiber optic surface plasmon resonance biosensors: A review. Photonic Sens. 2024, 14, 240201. [Google Scholar] [CrossRef]
  18. Hu, X.; Xu, Y.; Zhang, H.; Xie, J.; Niu, D.; Zhao, Z. The fiber bragg grating (FBG) sensing glove: A review. IEEE Sens. J. 2023, 23, 11374–11382. [Google Scholar] [CrossRef]
  19. Li, Y.; Zhao, K.; Zhao, J.; Wang, Q.; Zhong, S.; Lalam, N.; Wright, R.; Zhou, P.; Chen, K.P. FiberFlex: Real-time FPGA-based Intelligent and Distributed Fiber Sensor System for Pedestrian Recognition. ACM Trans. Reconfigurable Technol. Syst. 2024, 17, 1–30. [Google Scholar] [CrossRef]
  20. Zhao, S.; Du, C.; Wang, Q.; Jia, B.; Zhang, L.; Cui, L.; Deng, X.; Chen, S. A long period fiber grating seawater salinity sensor based on bend insensitive single mode fiber. Opt. Fiber Technol. 2023, 77, 103269. [Google Scholar] [CrossRef]
  21. Liu, B.; Ruan, Y.; Yu, Y. All-fiber laser-self-mixing sensor for acoustic emission measurement. J. Light. Technol. 2021, 39, 4062–4068. [Google Scholar] [CrossRef]
  22. Li, R.; Hu, Z.; Li, H.; Zhao, Y.; Liu, K.; Tu, Y. All-fiber laser-self-mixing interferometer with adjustable injection intensity for remote sensing of 40 km. J. Light. Technol. 2022, 40, 4863–4870. [Google Scholar] [CrossRef]
  23. Ma, C.; Peng, D.; Bai, X.; Liu, S.; Luo, L. A review of optical fiber sensing technology based on thin film and Fabry–Perot cavity. Coatings 2023, 13, 1277. [Google Scholar] [CrossRef]
  24. Li, C.; Yang, W.; Wang, M.; Yu, X.; Fan, J.; Xiong, Y.; Yang, Y.; Li, L. A review of coating materials used to improve the performance of optical fiber sensors. Sensors 2020, 20, 4215. [Google Scholar] [CrossRef]
  25. Liao, Y.; Liu, Y.; Li, Y.; Lang, C.; Cao, K.; Qu, S. Large-range, highly-sensitive, and fast-responsive optical fiber temperature sensor based on the sealed ethanol in liquid state up to its supercritical temperature. IEEE Photonics J. 2019, 11, 1–12. [Google Scholar] [CrossRef]
  26. Cao, K.; Liu, Y.; Qu, S. Compact fiber biocompatible temperature sensor based on a hermetically-sealed liquid-filling structure. Opt. Express 2017, 25, 29597–29604. [Google Scholar] [CrossRef]
  27. Liao, Y.; Liu, Y.; Lang, C.; Li, Y.; Qu, S. Highly sensitive optical fiber temperature sensor based on the thermal shift of the liquid–air interface. Opt. Eng. 2019, 58, 117105. [Google Scholar] [CrossRef]
  28. Liu, Q.; Wang, D.; Wang, C.; Gao, H.; Cheng, F. Ultrasensitive temperature sensor based on optic fiber Fabry–Pérot interferometer with Vernier effect. Opt. Commun. 2023, 541, 129567. [Google Scholar] [CrossRef]
  29. Ahmed, I.; Ali, M.; Elsherif, M.; Butt, H. UV polymerization fabrication method for polymer composite based optical fiber sensors. Sci. Rep. 2023, 13, 10823. [Google Scholar] [CrossRef]
  30. Ramírez-Hernández, M.Á.; Alonso-Murias, M.; Monzón-Hernández, D. Highly sensitive temperature sensor based on vernier effect using a sturdy double-cavity fiber Fabry-Perot interferometer. Polymers 2023, 15, 4567. [Google Scholar] [CrossRef]
  31. Chen, Y.; Zhao, L.; Hao, S.; Tang, J. Advanced fiber sensors based on the Vernier effect. Sensors 2022, 22, 2694. [Google Scholar] [CrossRef] [PubMed]
  32. Gomes, A.D.; Bartelt, H.; Frazão, O. Optical Vernier effect: Recent advances and developments. Laser Photonics Rev. 2021, 15, 2000588. [Google Scholar] [CrossRef]
  33. Naku, W.; Huang, J.; Zhu, C. Optical fiber sensors based on advanced Vernier Effect-A Review. IEEE Sens. J. 2024. [Google Scholar] [CrossRef]
  34. Chen, S.; Pan, P.; Xie, T.; Fu, H. Sensitivity enhanced fiber optic temperature sensor based on optical carrier microwave photonic interferometry with harmonic Vernier effect. Opt. Laser Technol. 2023, 160, 109029. [Google Scholar] [CrossRef]
  35. Xiao, J.; Zhou, T.; Yao, N.; Ma, S.; Pan, C.; Wang, P.; Fu, H.; Liu, H.; Pan, J.; Yu, L.; et al. Optical fibre taper-enabled waveguide photoactuators. Nat. Commun. 2022, 13, 363. [Google Scholar] [CrossRef]
  36. Zhang, Y.; Hu, Y.; Liu, Q.; Lou, K.; Wang, S.; Zhang, N.; Jiang, N.; Yetisen, A.K. Multiplexed optical fiber sensors for dynamic brain monitoring. Matter 2022, 5, 3947–3976. [Google Scholar] [CrossRef]
  37. Ran, Y.; Xu, Z.; Chen, M.; Wang, W.; Wu, Y.; Cai, J.; Long, J.; Chen, Z.; Zhang, D.; Guan, B. Fiber-optic theranostics (FOT): Interstitial fiber-optic needles for cancer sensing and therapy. Adv. Sci. 2022, 9, 2200456. [Google Scholar] [CrossRef]
  38. Zhang, Y.; Zheng, J.; Jin, F.; Xiao, J.; Lan, N.; Xu, Z.; Yue, X.; Li, Z.; Li, C.; Cao, D.; et al. Fiber-optic drug delivery strategy for synergistic cancer photothermal-chemotherapy. Light Sci. Appl. 2024, 13, 228. [Google Scholar] [CrossRef]
  39. Oliveira, R.; Bilro, L.; Nogueira, R. Fabry-Pérot cavities based on photopolymerizable resins for sensing applications. Opt. Mater. Express 2018, 8, 2208–2221. [Google Scholar] [CrossRef]
  40. Li, Y.; Zhao, C.; Xu, B.; Wang, D.; Yang, M. Optical cascaded Fabry–Perot interferometer hydrogen sensor based on vernier effect. Opt. Commun. 2018, 414, 166–171. [Google Scholar] [CrossRef]
  41. Zhang, T.; Han, Q.; Liang, Z.; Jiang, J.; Cheng, Z. A Fabry–Pérot sensor with cascaded polymer films based on Vernier effect for simultaneous measurement of relative humidity and temperature. Sensors 2023, 23, 2800. [Google Scholar] [CrossRef] [PubMed]
  42. Hu, J.H.; Li, D.; Liu, Z.G.; Wang, Q.; Tang, J.R. Polymer-coated fiber-optic Fabry-Perot interferometer-based temperature sensor with high sensitivity. Opt. Fiber Technol. 2023, 81, 103471. [Google Scholar] [CrossRef]
  43. Yin, J.; Liu, T.; Jiang, J.; Liu, K.; Wang, S.; Qin, Z. Batch-producible fiber-optic Fabry–Pérot sensor for simultaneous pressure and temperature sensing. IEEE Photonics Technol. Lett. 2014, 26, 2070–2073. [Google Scholar]
  44. Zeng, Y.; Zhang, P.; Li, Z.; Shen, J.; Li, C. Fabry-Perot interferometers with resin scaffolders for high sensitivity temperature sensing. Front. Phys. 2024, 12, 1366488. [Google Scholar] [CrossRef]
Figure 1. The fabrication process of the FPI modified with UV glue. (a) Misaligned Fiber Splicing. (b) Fiber Cleaving Process. (c) Re-splicing with Alignment to Fiber 1. (d) Interference Mechanism Post UV Adhesive Coating.
Photonics 12 00256 g001
Figure 2. (a) Microscope image of the misaligned welded FP. (b) Actual image of the FP after coating with UV glue. (c) The interference spectra of FPI1 and FPI2 before and after coating with UV glue.
Photonics 12 00256 g002
Figure 3. Schematic diagram of the temperature-measurement device.
Photonics 12 00256 g003
Figure 4. Interference spectra of the bare FPI at different temperatures: (a) in the range from 1525 nm to 1605 nm and (b) in the range from 1562 nm to 1573 nm.
Photonics 12 00256 g004
Figure 5. (a). Interference spectra of a single FPI coated with UV glue at different temperatures. (b) Spectral changes in a single FPI coated with UV glue. (c) Fitting curve of the temperature-dependent spectra of a single FPI coated with UV glue.
Photonics 12 00256 g005
Figure 6. The Vernier-effect spectrum and its envelope at 30 °C. The position indicated by the arrow is the location selected in the experiment to observe the movement of the envelope.
Photonics 12 00256 g006
Figure 7. (a) Changes in the envelope of the Vernier effect spectrum for parallel-connected FPIs. (b) Fitting curve of the temperature-dependent spectrum of the parallel-connected Vernier effect.
Photonics 12 00256 g007
Figure 8. (a) Vernier-effect spectra at 32 °C from five independent repeated measurements. (b) Positions of the envelope peaks of the Vernier-effect spectra at 32 °C from five independent repeated measurements. The position indicated by the arrow is the location selected in the experiment to observe the movement of the envelope.
Photonics 12 00256 g008
Figure 9. Positions of the envelope peaks in the Vernier-effect spectra during temperature rise and fall.
Photonics 12 00256 g009
Figure 10. (a) Vernier-effect spectra at different humidity levels. (b) Envelope of the Vernier-effect spectra at different humidity levels. (c) Variation in the envelope peak position with relative humidity changes.
Photonics 12 00256 g010
Table 1. Comparison with other similar schemes.
ReferenceConfigurationTemperature RangeTemperature Sensitivity
[41]Two cascaded FPIs15 °C to 40 °C−0.4825 nm/°C
[42]PDMS-coated FPI−30 °C to 85 °C0.698 nm/°C
[43]Silicon–glass–silicon-sandwich bonding structure−20 °C to 70 °C142.02 nm/°C
[44]Optical fibers within a 3D-printed resin scaffold34.9 °C to 38.5 °C14.330 nm/°C
This workTwo parallel FPIs30 °C to 50 °C−2.80219 nm/°C
Disclaimer/Publisher’s Note: The statements, opinions and data contained in all publications are solely those of the individual author(s) and contributor(s) and not of MDPI and/or the editor(s). MDPI and/or the editor(s) disclaim responsibility for any injury to people or property resulting from any ideas, methods, instructions or products referred to in the content.

