Article

0.4 THz Broadband Terahertz Noise Source Based on Photoconductive Antennas

1
Institute of Advanced Photonics Technology, School of Information Engineering, Guangdong University of Technology, Guangzhou 510006, China
2
Key Laboratory of Photonic Technology for Integrated Sensing and Communication, Ministry of Education of China, Guangdong University of Technology, Guangzhou 510006, China
3
Guangdong Provincial Key Laboratory of Information Photonics Technology, Guangdong University of Technology, Guangzhou 510006, China
*
Author to whom correspondence should be addressed.
Photonics 2025, 12(3), 252; https://doi.org/10.3390/photonics12030252
Submission received: 29 January 2025 / Revised: 6 March 2025 / Accepted: 7 March 2025 / Published: 11 March 2025
(This article belongs to the Section Optoelectronics and Optical Materials)

Abstract

:
Terahertz noise sources have important application prospects in noise figure measurements. In this paper, a 0.4 THz broadband terahertz noise source based on a photoconductive antenna is proposed. As a demonstration of feasibility, this terahertz noise source is generated by mixing three beams of Gaussian-shaped incoherent light. The resulting excess noise ratio (ENR) across different frequency bands is as follows: 20.9 dB, with a flatness of ±7.9 dB in the 75~110 GHz range; 19.3 dB, with a flatness of ±6.2 dB in the 110~170 GHz range; 20.6 dB, with a flatness of ±4.8 dB in the 170~260 GHz range; and 18.7 dB, with a flatness of ±4.3 dB in the 260~400 GHz range. These results demonstrate that the terahertz noise source based on photoconductive antennas that we proposed shows great potential in high-frequency bands and noise figure measurements.

1. Introduction

Terahertz (THz) is the name given to the region of the electromagnetic spectrum lying between the microwave band (<100 GHz) and the far-infrared band (>10 THz) [1]. Terahertz noise sources are important devices for measuring the noise figure and characterizing device performance. THz noise is used in areas such as radiometer calibration [2] and radar performance testing [3].
In recent years, many THz noise sources have been developed using electron devices, such as transistors [4], Schottky diodes [5], and heterojunction bipolar transistors (HBTs) [6]. Ghanem et al. [7] achieved terahertz noise output in the 140~325 GHz range based on Schottky diodes, which are the highest frequency electronic noise sources currently available. However, the power of the output terahertz noise spectrum generated by this method decreases dramatically with increasing frequency. Terahertz noise can also be generated using photonic techniques. For instance, Song et al. [8] used array waveguide gratings to filter the incoherent light generated by an amplified spontaneous emission (ASE) optical noise and mixed it with uni-traveling-carrier photodiode (UTC-PD). This scheme generates terahertz noise with an ENR of about 20 dB in the frequency range of 295~355 GHz. Sun et al. [9] performed multi-wavelength filtering of the ASE noise spectrum to generate flat terahertz noise via multi-beam mixing. Liu et al. [10] used two rectangular optical beat frequencies of different bandwidths to generate flat terahertz noise in the range of 130~170 GHz. Chen et al. [11] used a monolithically integrated dual-mode chaotic laser as a light source for terahertz noise sources. This scheme generates terahertz noise with an ENR of about 47 dB in the frequency range of 237~281 GHz. This terahertz noise photon generation technique has the advantages of high frequency and a high and flat excess noise ratio, which is the best technique explored in recent years to generate terahertz noise.
Photoconductive antennas (PCAs) generate photo-generated carriers on the surface of the semiconductor material under an incoherent light-varying photocurrent that radiates terahertz waves. Molter et al. [12] used a super-luminescent diode (SLD) and an Er-doped fiber amplifier to directly excite a photoconductive antenna, generating continuous terahertz waves from 0.1~1 THz. Bai et al. [13] prepared a low-temperature GaAs thin-film photoconductive antenna, which generated continuous terahertz waves of ~2.5 THz via excitation with a 1550 nm laser. The intrinsic constraints of photoconductive switches (PCSs) have led researchers to explore alternative methods for generating high-frequency signals. Mohammad et al. [14] used hot carrier lasers to excite the plasma, and these plasmonic decays produce high-energy hot electrons and photoemit them from the material, which can generate high-frequency terahertz signals. Therefore, a photoconductive antenna can be used to generate a terahertz noise source.
In this paper, a method for generating terahertz noise using the multi-optical mixing of photoconductive antennas is proposed and experimentally demonstrated. This method provides a terahertz noise source solution based on photoconductive antennas. Theoretically, we simulate and verify that multi-optical mixing can generate terahertz noise. Furthermore, experimental verification was carried out in the range of 75~400 GHz. The results show that the generated terahertz noise has an ENR of 20.7 dB flatness ± 7.9 dB in the range of 75~110 GHz, an ENR of 19.3 dB flatness ± 6.2 dB within the range of 110~170 GHz, an ENR of 20.6 dB flatness ± 4.8 dB within the range of 170~260 GHz, and an ENR of 18.7 dB flatness ± 4.3 dB within the range of 260~400 GHz. This method can effectively enhance the frequency band of terahertz noise sources.

2. Diagram of Experimental and Theoretical Principle

Figure 1a shows a schematic diagram of the generation of terahertz noise based on photoconductive antennas using three optical mixing. The experimental setup includes a super-luminescent diode (Thorlabs SLD770, SLD, Newton, MA, USA), a circulator (CIRC), fiber Bragg gratings (FBG), a semiconductor optical amplifier (Innolume SOA-780-20-YY-30dB, SOA, Dortmund, Germany), a polarization controller (PC), and a photoconductive antenna (toptica #EK-00831, PCA, Munich, Germany). The experiments used an SLD with a central wavelength of 773 nm and a bandwidth of 17 nm as an incoherent light source. Three Gaussian beams are filtered through three FBGs and then coupled to the SOA through the CIRC for optical amplification. Finally, they are injected into the photoconductive antenna to generate THz noise. In addition, we injected optical noise with a power of 30 mW into the PCA for photoelectric conversion in experimental tests.
The THz noise signal output from PCA is coupled to 8th, 12th, 18th and 24th harmonic mixers (VDI, SAX-185, SAX-186, SAX-187, and SAX-188) for down-conversion in the range of 75~400 GHz. The electrical spectrum analyzer (ESA, R&S, and FSW-50) used in the experiment is equipped with an R&S FSV-B21 module (the LO/IF connection port of the external mixer). Therefore, the mixer can be used as an extension module of the ESA for real-time measurement. The LO signal for down-conversion is generated from the internal local oscillator of the ESA. Then, the IF signal output from the mixer is transmitted to the IF input port of the ESA for real-time measurement. Figure 1b shows the diagram of the experimental setup of the terahertz noise source, and the yellow box diagram shows the schematic of the horn antenna connected to the PCA. The horn antenna is used in the range of 170~260 GHz to improve the impedance matching between the radiated terahertz signal and the waveguide, thus increasing the coupling efficiency.
A cross-section of the terahertz PCA electrode gap is shown in Figure 2, which displays a typical structure of a PCA consisting of a ~1 μm thick LT-GaAs layer on a ~500 μm thick GaAs layer and a metal anode–cathode. Excitation of the gap with continuous incoherent light (1, 2, and 3) excites electron-hole pairs in the photoconductor material, causing the carrier concentration to rise and the resistivity of the material to fall. Under the excitation of incoherent lights, the charges in the photoconductor are generated, accelerated, and recombined in a very short time [15]. As current is injected into the electrodes, any photocarriers generated near the antenna electrodes are collected by the antenna prior to recombination, which in turn generates a terahertz noise signal with differential frequencies of υ1υ2, υ1υ3, and υ2υ3 near the metal electrodes [16].
The principle of photon mixing to generate terahertz noise is based on the spectrum-to-frequency mapping theory. The spectrum of SLD after filtering can be regarded as incoherent light with a Gaussian shape. Then, the optical spectrum SSLD(υ) input to the PCA can be expressed as follows [9]:
S S L D υ = S S L D , 0 3 K = 1 3 exp υ υ k 2 2 σ 2
where SSLD,0 is the peak height at the central frequency of the noise spectrum, υ represents the central frequency of light, and σ is the spectral full width at half maximum (FWHM) of Gaussian noise, respectively.
The noise spectral density S(ƒ) is obtained when multiple beams of incoherent light pass through the PCA for optical mixing, which can be expressed as follows [9,17]:
S ( f ) = 2 K R 0 2 ( f ) P 2 3 π σ 1 3 i = 2 3 j = 1 2 exp f υ i υ j 2 4 σ 2 + exp f 2 4 σ 2
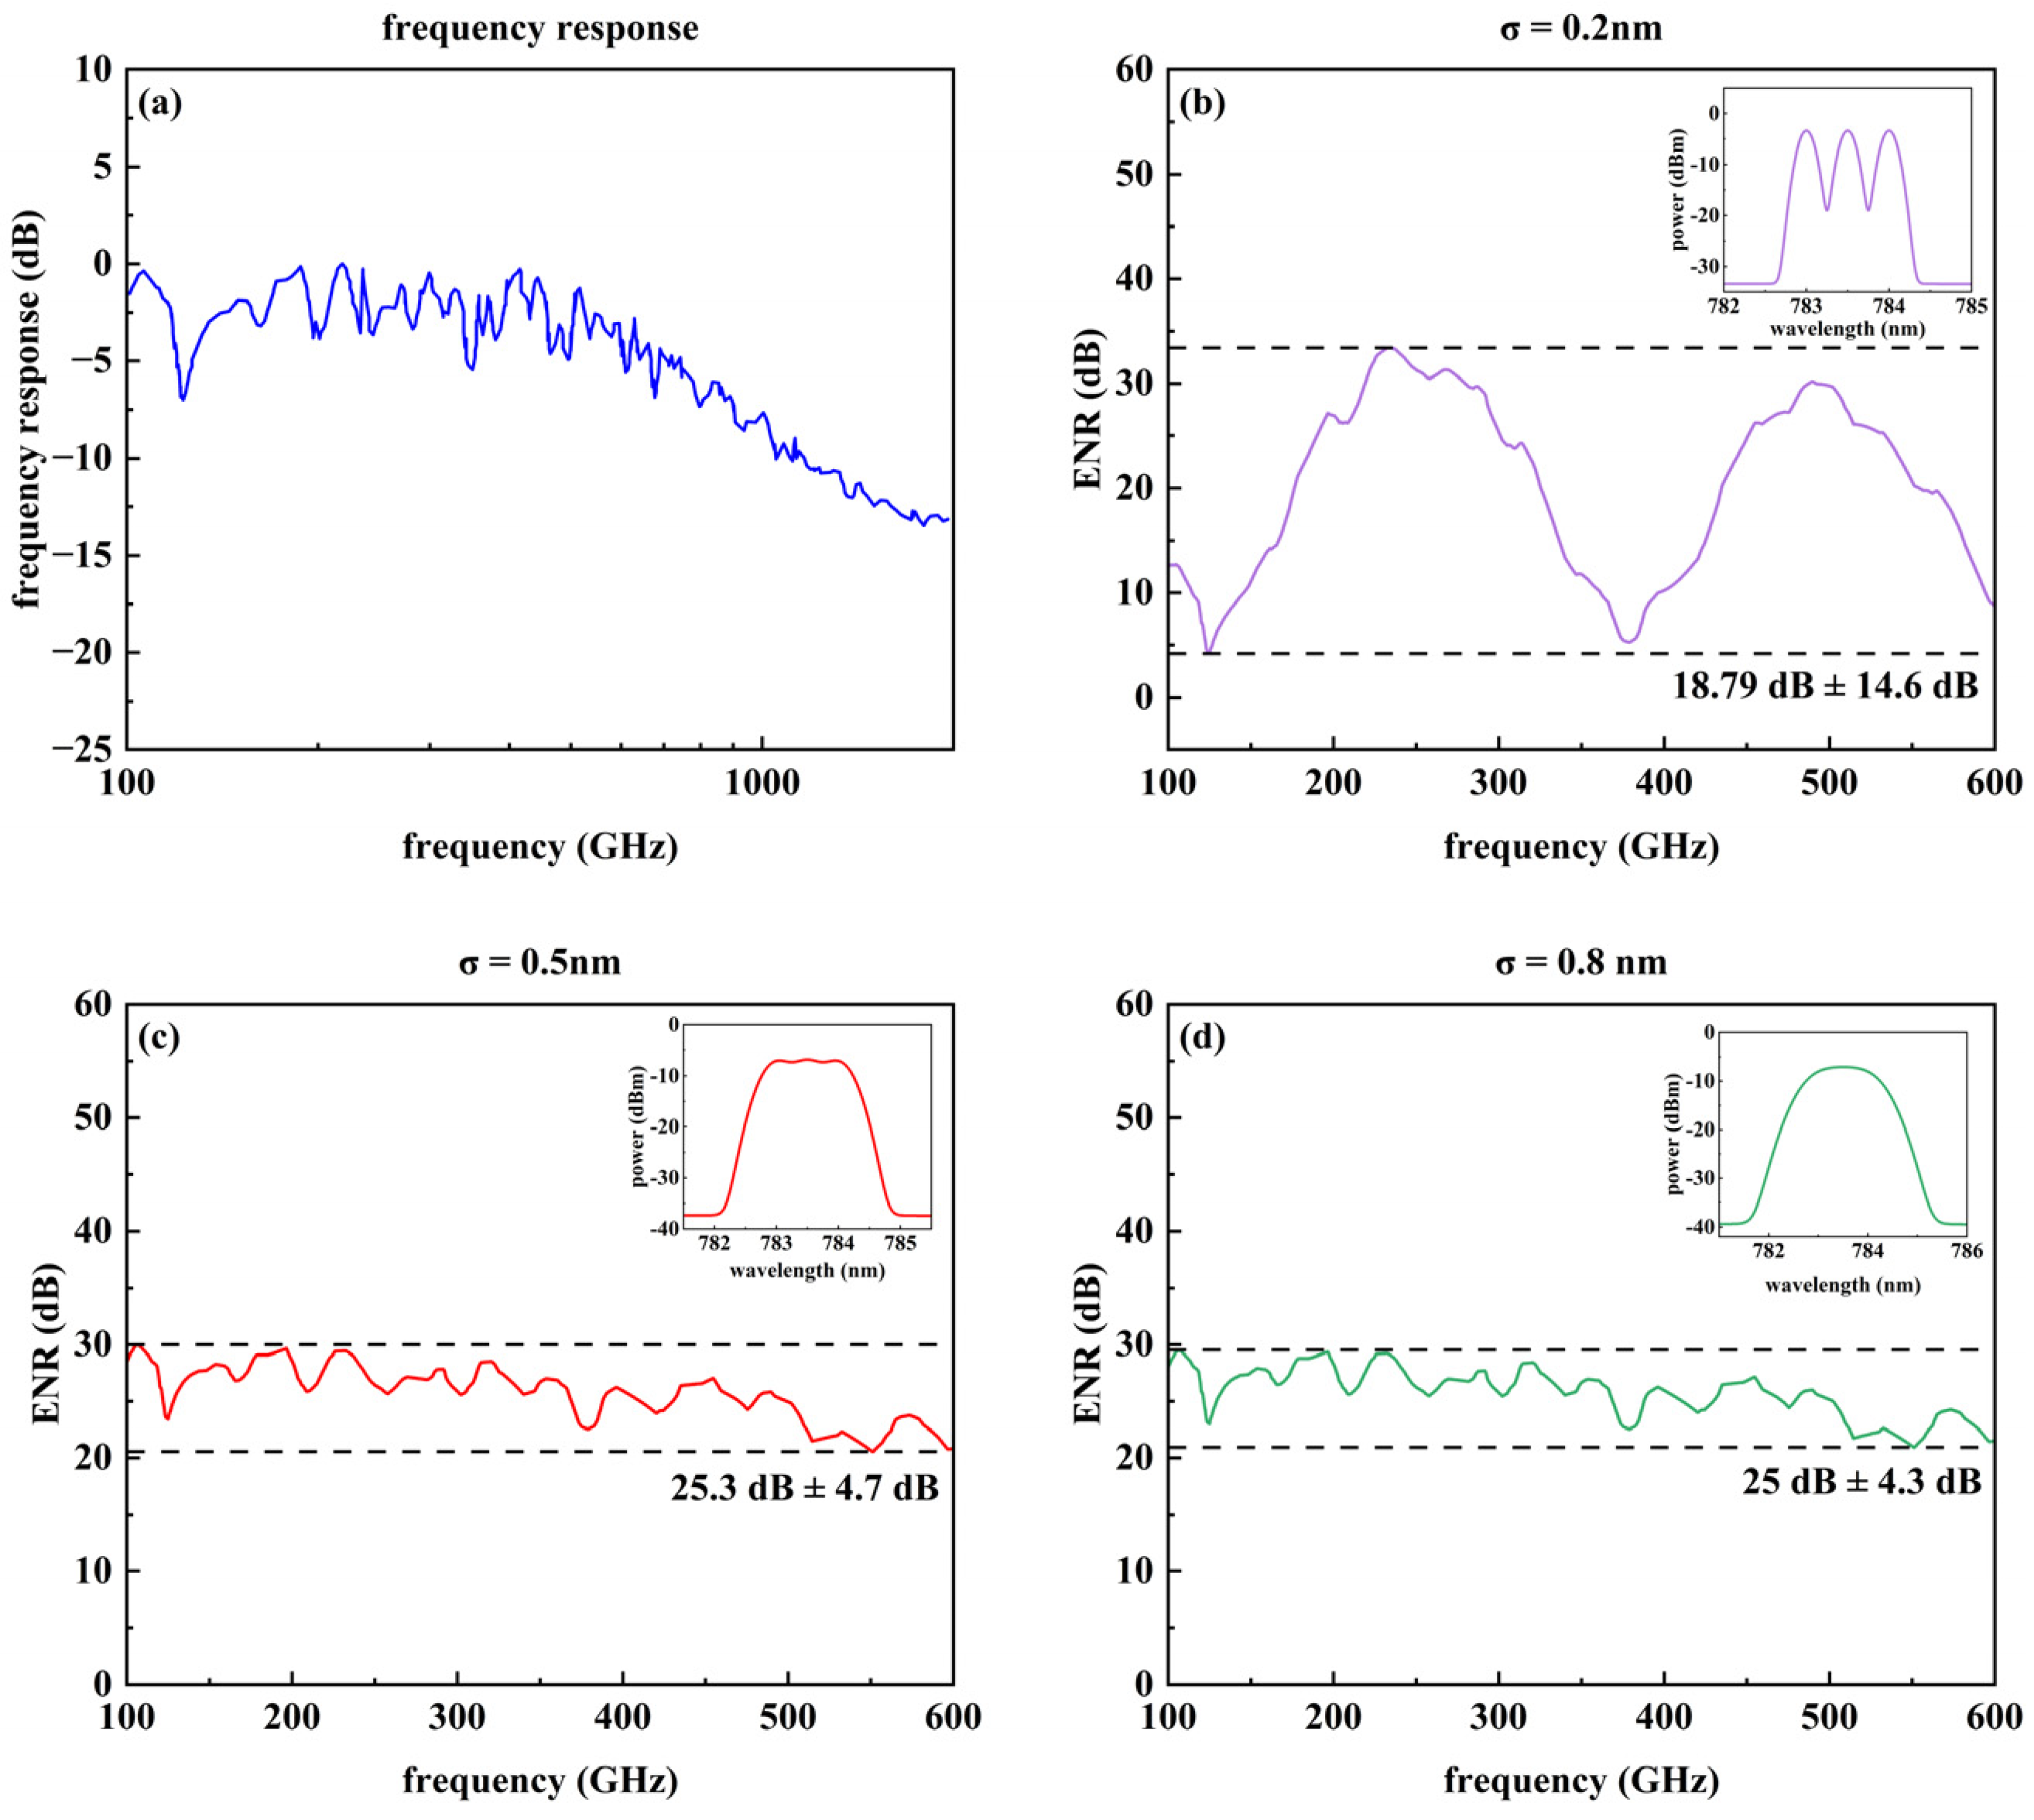
where K is the maximum power transfer, R0 is the photoconductive antenna impedance, ℜ(ƒ) is the responsivity of the frequency characteristics of the PCA (see Figure 3a), and P represents the average optical power, respectively.
The excess noise ratio, commonly used to characterize the power level of noise, can be expressed as follows [18]:
ENR = 10 log P h P c P 0 = S f dBm / Hz ( 174 dBm / Hz )
where Ph and Pc are the output noise power levels of the noise source in the hot and cold states and P0 is the reference power level at standard room temperature (290 K). For the photonic noise sources, the hot and cold states correspond to the output power spectral density of the PCA with and without incident light excitation, respectively. At standard room temperature, the power spectral density in the off state is approximately equal to the thermal noise power of the PCA, that is, −174 dBm/Hz.
Flatness can be defined as half the difference between the maximum and minimum values of the ENR, reflecting fluctuations in the noise power spectrum. We first run a simulation using the PCA response function to quantitatively determine the center wavelength and line width of the incoherent light used. Note, the response function is from a PCA product (Toptica EK-00831). From Figure 3a, we can observe that the PCA has a response bandwidth of over 1 THz. In the simulation, we keep the line widths of the three incoherent lights the same as 0.2 nm and then traverse their own center wavelengths. After this, we can determine the optimum location of the center wavelengths as 783 nm, 783.5 nm, and 784 nm, where the flatness of the generated noise spectrum is relatively better, as shown in Figure 3b. At this time, the ENR of the generated terahertz noise is 18.79 dB, with a flatness of ±14.6 dB. Secondly, we increase the line width of the three lights from 0.2 to 0.8 to further improve the flatness. The simulation results shown in Figure 3c are from a group of three Gaussian lights with the same line width as 0.5 nm. In this case, the generated terahertz noise has a frequency range of 100~600 GHz and an ENR of 25.3 dB, with a flatness of ±4.7 dB. In addition, the simulation results of mixing three beams of Gaussian optical light with a line width of 0.8 nm are also shown in Figure 3d, where the ENR of the generated terahertz noise is 25 dB, with a flatness of ±4.3 dB. These results suggest that when the line width reaches more than 0.5 nm, the flatness of the noise has already stabilized.

3. Results and Discussion

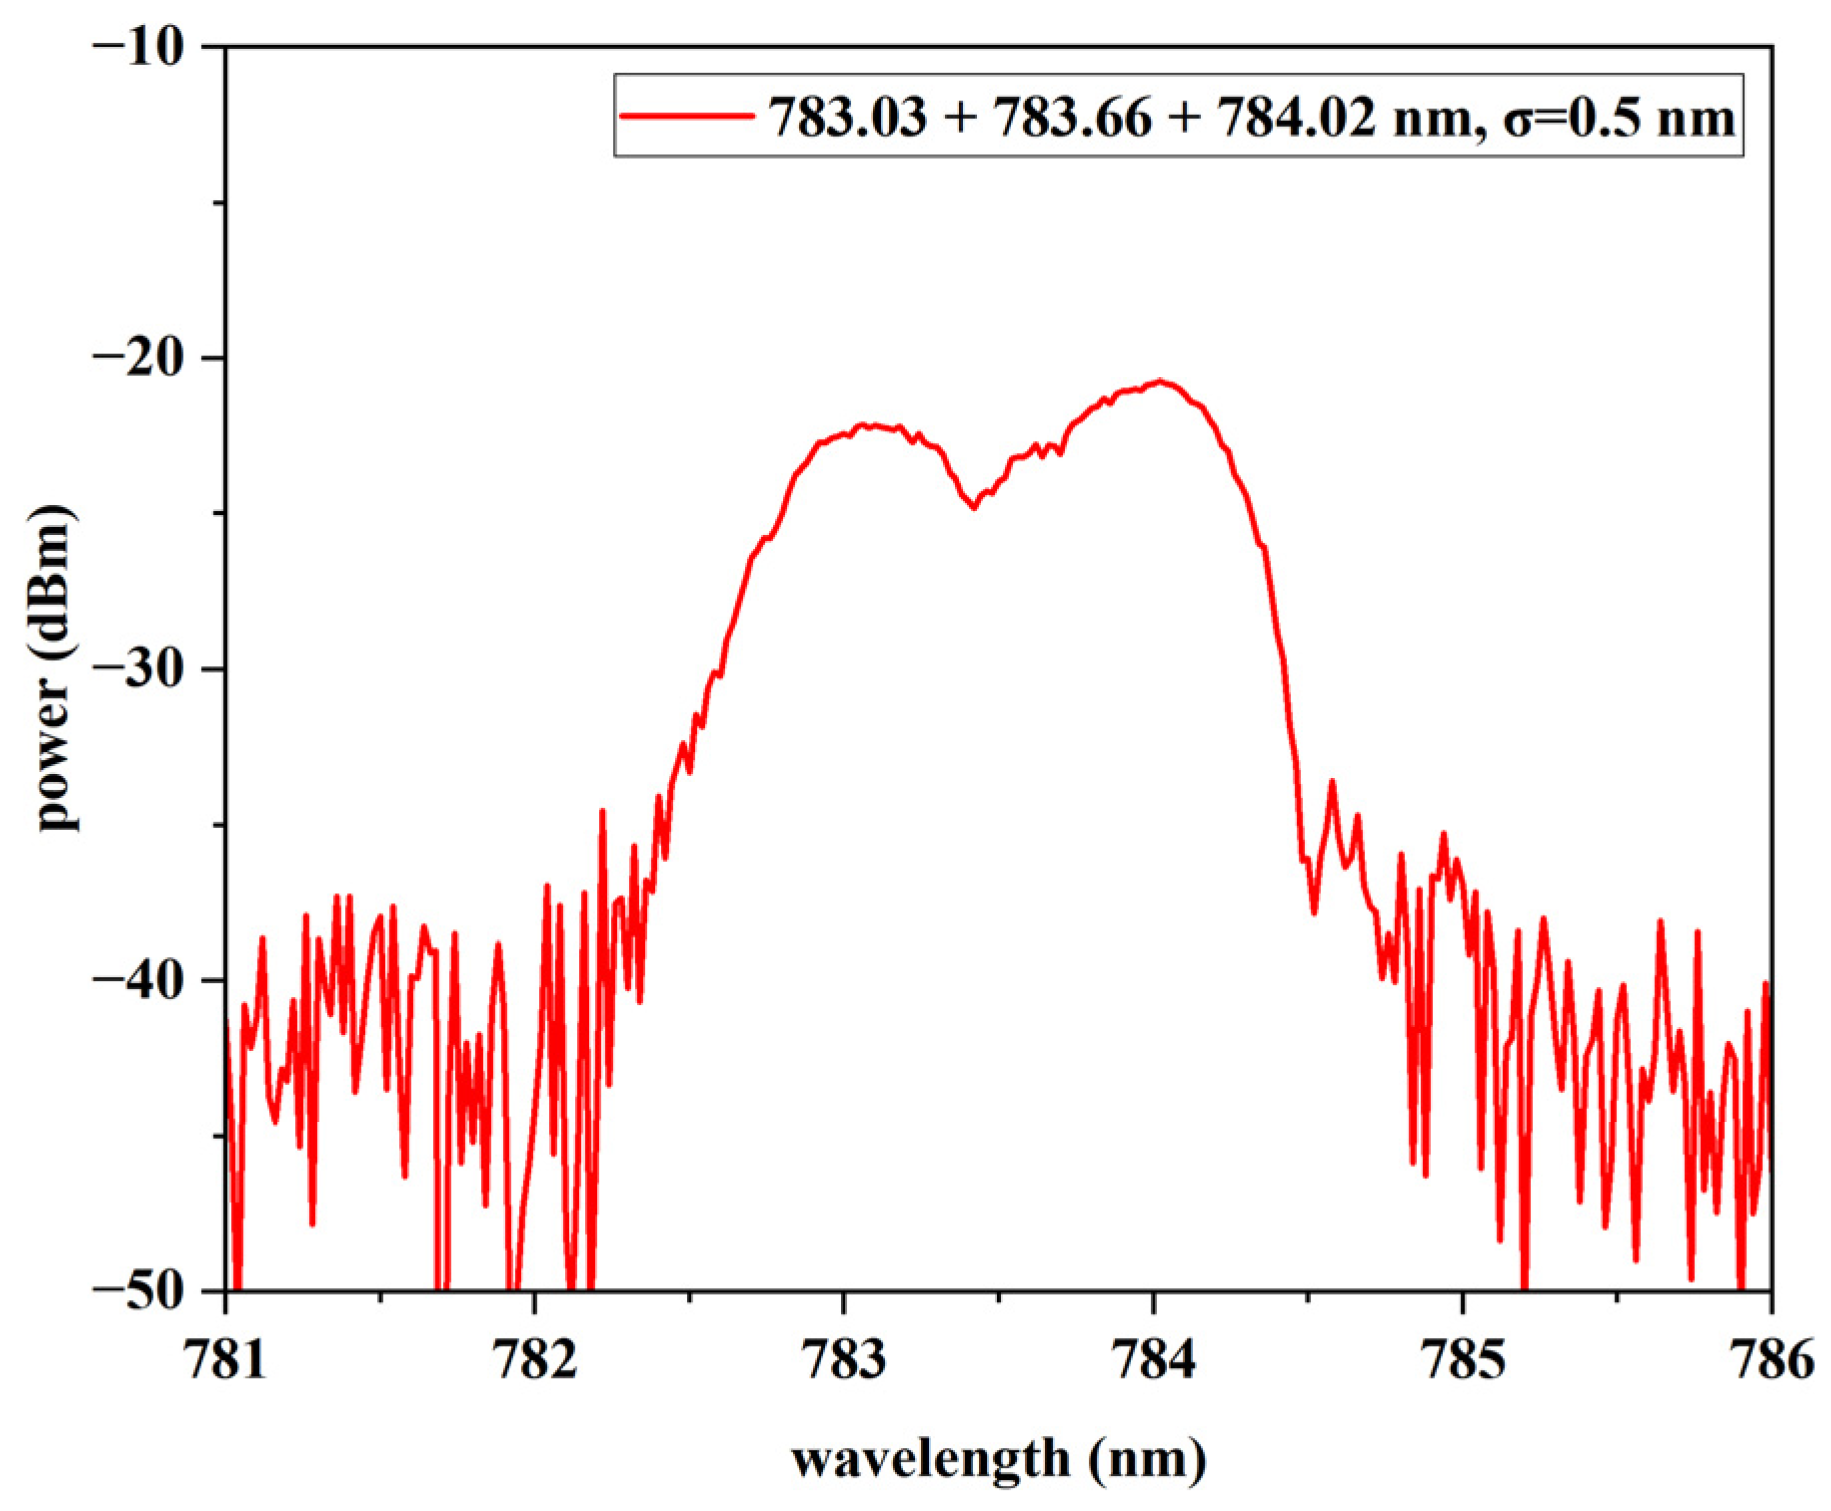
Figure 4 shows the measured spectra of SLD after fiber Bragg gratings filtering. Gaussian-shaped incoherent light has central frequencies of 783.02 nm, 783.66 nm, and 784.03 nm, respectively, and has the same FWHM σ of 0.5 nm. The experimental measurements are consistent with the simulation, as shown in the inset of Figure 3c.
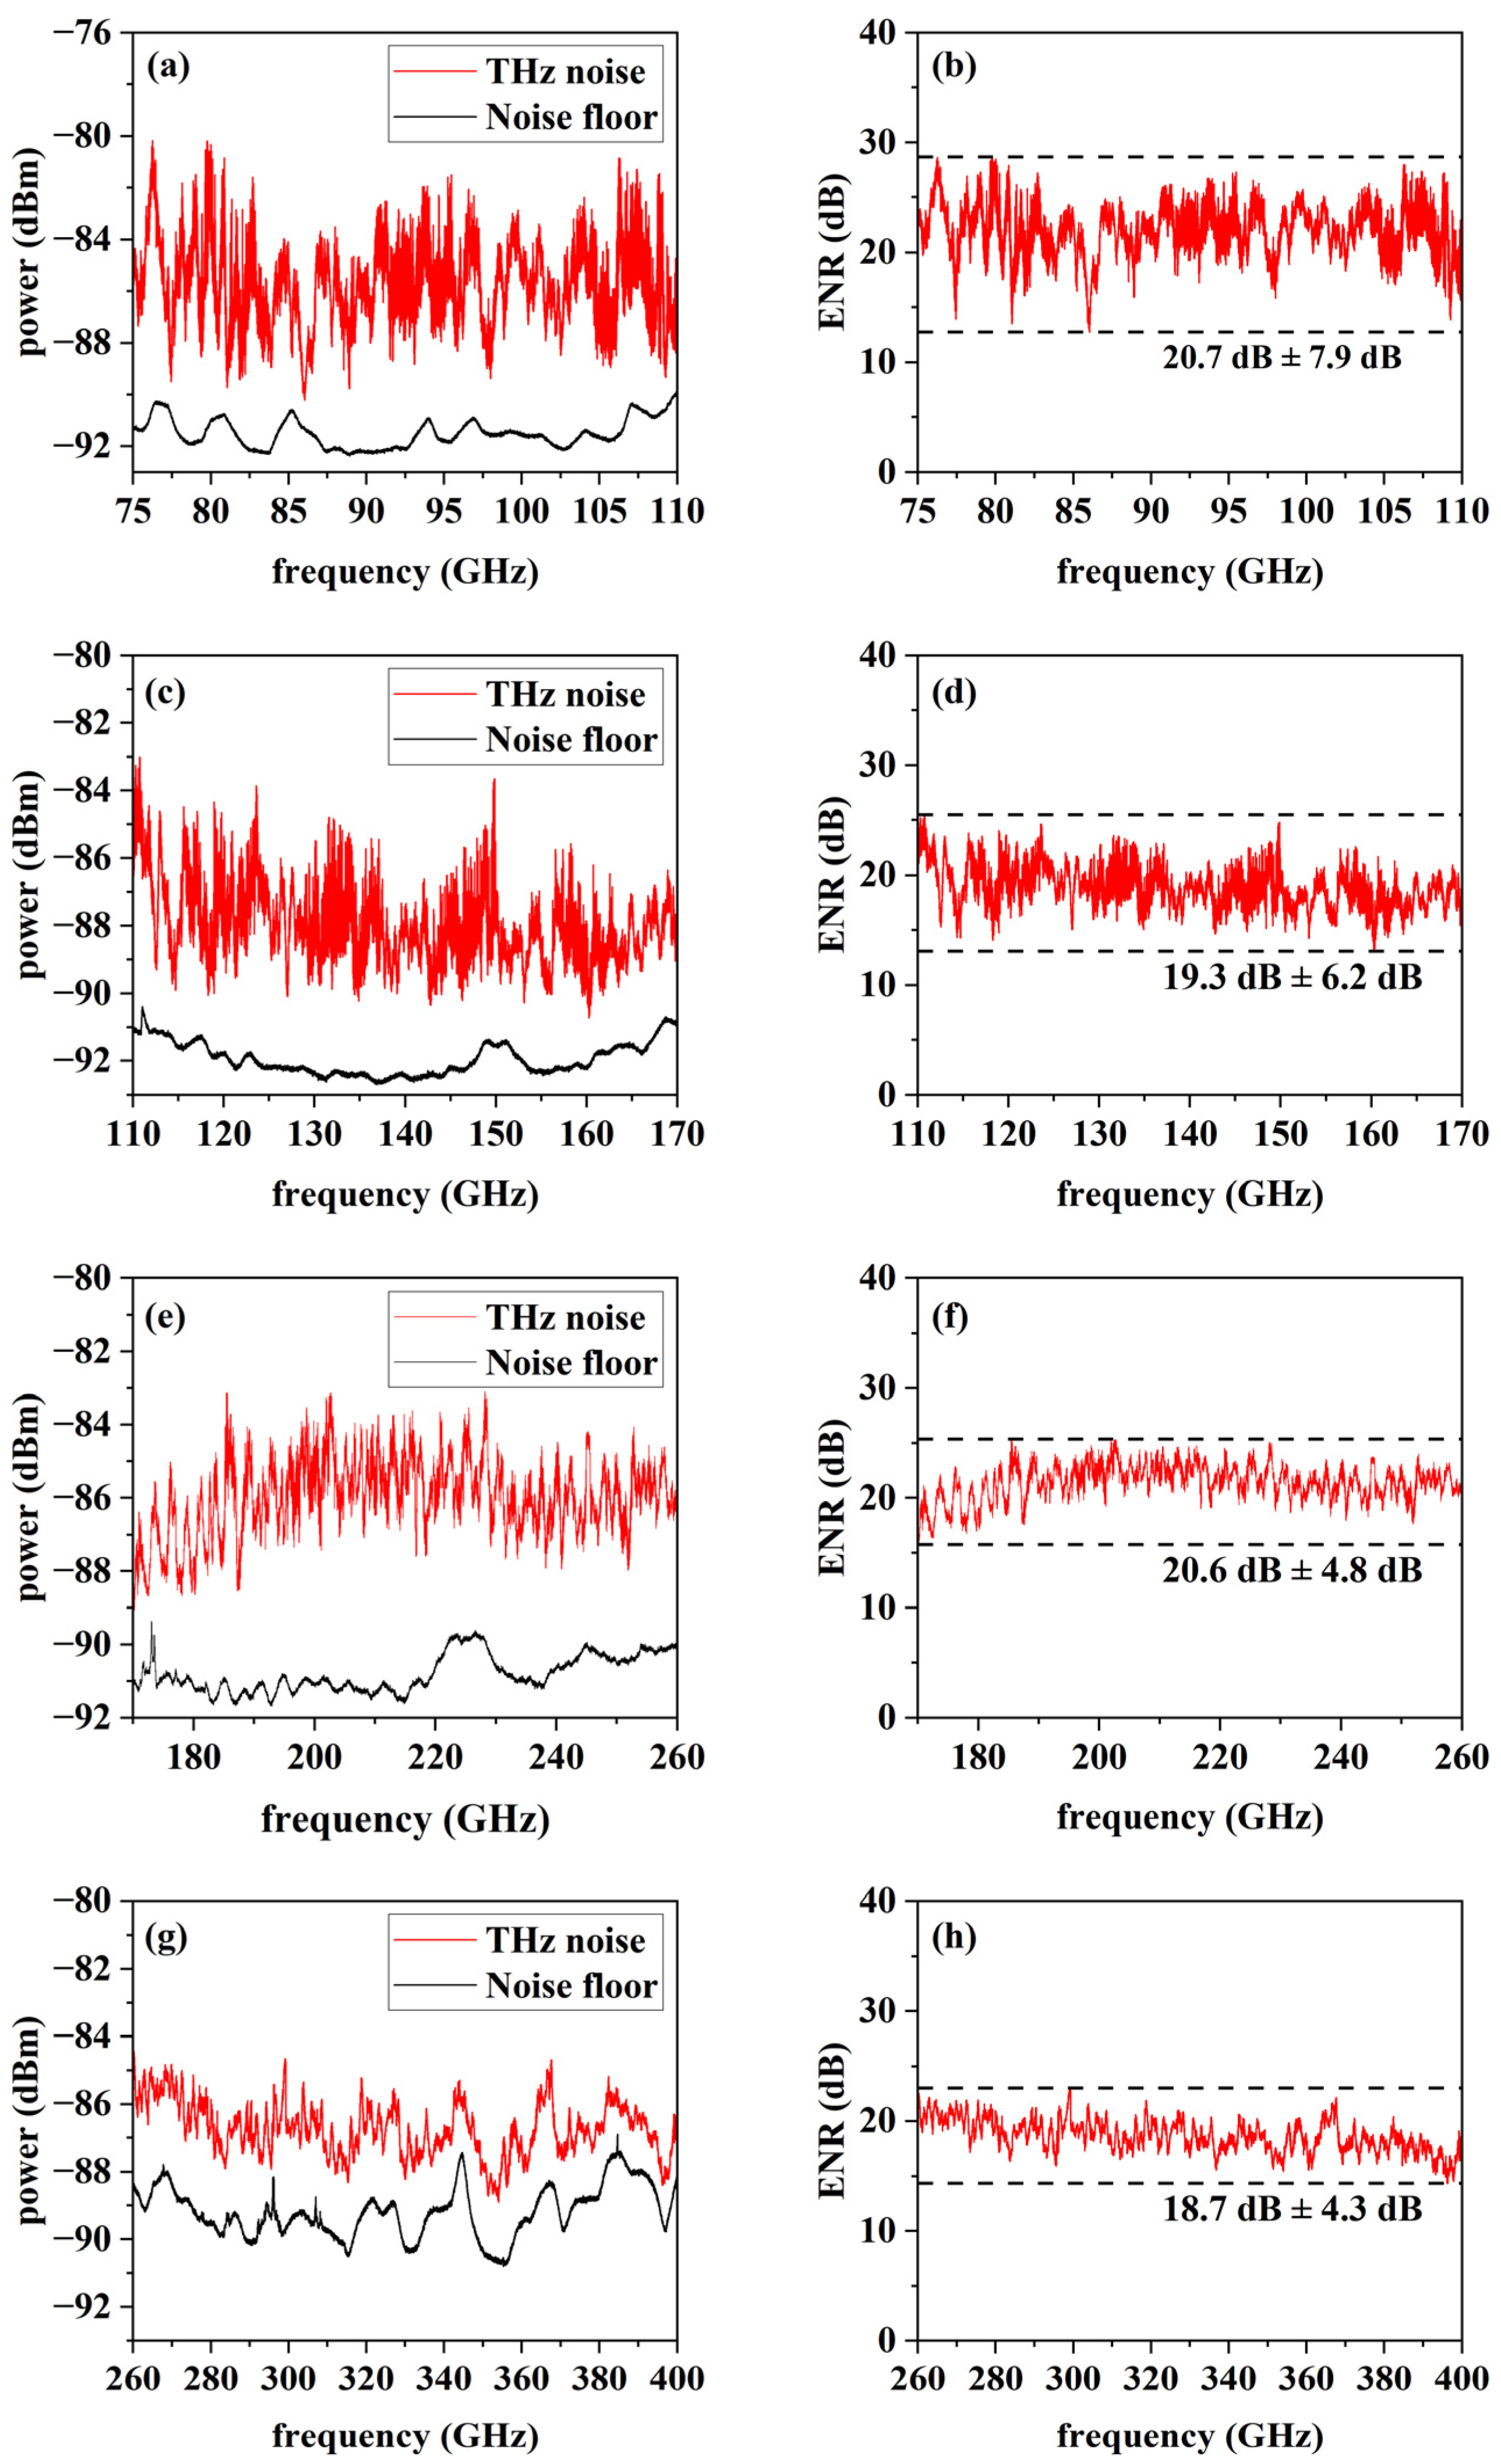
Figure 5 shows the experimental results of THz noise in the frequency range of 75~400 GHz via the mixing of three Gaussian-shaped SLD wavelength-sliced light beams. The results of the terahertz noise power spectra, as shown in Figure 5a,c,e,g and Figure 5b,d,f,h, show the ENR curves calculated from the power spectra. In Figure 5b,d, we use rectangular waveguides to receive terahertz noise. The ENR of the terahertz noise in the range of 75~110 GHz is 20.7 dB, with a flatness of ±7.9 dB. In the range of 110~170 GHz, the ENR of the terahertz noise is 19.3 dB, with a flatness of ±6.2 dB. In Figure 5f,h, a horn antenna is used between the harmonic mixer and the PCA to improve coupling efficiency. The ENR of the terahertz noise in the range of 170~260 GHz is 20.6 dB, with a flatness of ±4.8 dB. In the range of 260~400 GHz, the ENR of the terahertz noise is 18.7 dB, with a flatness of ±4.3 dB. Limited by harmonic mixers, we cannot measure terahertz noise in higher frequency bands.
First, we discuss the flatness of the terahertz noise source in the frequency range of 75~170 GHz, as shown in Figure 5b,d, where the internal composition of the photo conductive antenna consists of a spiral antenna whose polarization direction is circularly polarized [19], while the output rectangular waveguide has a linear polarization direction. This leads to some impedance mismatch when receiving terahertz noise in the lower frequency band, which in turn affects the flatness of the ENR. Compared to Figure 5b,d, the use of a horn antenna effectively improves the flatness of terahertz noise. The slightly lower ENR curve obtained from the experimental calculations than the simulation is due to the air loss between the PCA and rectangular waveguides or horn antennas throughout the frequency range.
Second, we discussed the limitation of terahertz noise sources. Due to the used measurement equipment, the measured maximum frequency of the noise source is limited at 400 GHz. That is, when its operation frequency is above 400 GHz, the noise power falls below the floor noise of the harmonic mixer. Therefore, there are three methods to improve the ENR. One is to introduce nano-electrodes into the PCA so that its responsiveness can be enhanced. The other is to optimize the coupling efficiency between the PCA and the waveguide to reduce the transmission loss. In addition, we can also use multiple PCAs as an array to increase terahertz radiation.
Finally, Table 1 shows the ENR, flatness, and frequency bands of terahertz noise sources reported in recent years, and compares them with the noise source based on photoconductive antennas in this study. Compared to electronic [20] and UTC-PD-based photonic technologies [21], the terahertz noise source scheme based on photoconductive antennas can effectively broaden the operating frequency band of the noise source. In addition, the carrier lifetime of the photoconductor material for PCA is about 1 ps, and the theoretical bandwidth of the noise source can be up to 2 THz, but it is limited by the harmonic mixer’s floor noise and noise power. Therefore, we can introduce plasma hot carrier dynamics to generate terahertz signals using hot carriers and reduce the carrier lifetime to ~11 fs, which can greatly increase the bandwidth of terahertz noise sources [22].

4. Conclusions

In conclusion, we propose a terahertz noise source generation scheme based on a photoconductive antenna and verify the feasibility of the scheme via simulation and experiments. In the experiments, a 780 nm photoconductive antenna was used to generate terahertz noise in the range of 75 to 400 GHz. In the 75~110 GHz band, the ENR is 20.7 dB, with a flatness of ±7.9 dB; in the 110~170 GHz band, the ENR is 19.3 dB, with a flatness of ±6.2 dB; in the 170~260 GHz band, the ENR is 20.6 dB, with a flatness of ±4.8 dB; and in the 260~400 GHz band, the ENR is 18.7 dB, and with a flatness of ±4.3 dB. Due to its high-frequency characteristics, the proposed method has potential applications in the measurement of high-frequency electronic devices. In addition, our proposed scheme based on photoconductive antennas demonstrates great potential in expanding the frequency range of noise sources.

Author Contributions

Conceptualization, Y.W.; methodology, Y.C., F.Q., P.L., W.L. and Y.S.; software, Y.C., L.L. and Z.Z.; validation, Y.C. and Y.W.; formal analysis, Y.C., P.L., W.L. and Y.S.; investigation, Y.C., L.L. and Z.Z.; resources, Y.W.; data curation, Y.C.; writing—original draft preparation, Y.C.; writing—review and editing, Y.C., P.L., W.L., Y.S. and Y.W.; visualization, Y.C.; supervision, Y.C. and Y.W.; project administration, Y.W.; funding acquisition, Y.W. All authors have read and agreed to the published version of the manuscript.

Funding

This research was funded by the National Natural Science Foundation of China (NSFC) under Grant 61927811 and Guangdong Introducing Innovative and Entrepreneurial Teams of “The Pearl River Talent Recruitment Program” (2019CX01X019, 2019ZT08X340).

Institutional Review Board Statement

Not applicable.

Informed Consent Statement

Not applicable.

Data Availability Statement

The data presented in this study are available from the authors upon reasonable request.

Conflicts of Interest

The authors declare no conflicts of interest.

References

  1. Fattinger, C.; Grischkowsky, D. Terahertz beams. Appl. Phys. Lett. 1989, 54, 490–492. [Google Scholar] [CrossRef]
  2. Brown, S.T.; Desai, S.; Wenwen, L.; Tanner, A.B. On the Long-Term Stability of Microwave Radiometers Using Noise Diodes for Calibration. IEEE Trans. Geosci. Remote Sens. 2007, 45, 1908–1920. [Google Scholar] [CrossRef]
  3. Porranzl, M.; Wagner, C.; Jaeger, H.; Stelzer, A. On-Wafer Noise Characterization of an Automotive Monostatic Radar Transceiver with Self-Interference Evaluation. IEEE Trans. Microw. Theory Tech. 2019, 67, 3494–3505. [Google Scholar] [CrossRef]
  4. Diebold, S.; Weissbrodt, E.; Massler, H.; Leuther, A.; Tessmann, A.; Kallfass, I. A W-band monolithic integrated active hot and cold noise source. IEEE Trans. Microw. Theory Tech. 2014, 62, 623–630. [Google Scholar] [CrossRef]
  5. Azevedo Goncalves, J.C.; Ghanem, H.; Bouvot, S.; Gloria, D.; Lepilliet, S.; Ducournau, G.; Gaquiere, C.; Danneville, F. Millimeter-Wave Noise Source Development on SiGe BiCMOS 55-nm Technology for Applications up to 260 GHz. IEEE Trans. Microw. Theory Tech. 2019, 67, 3732–3742. [Google Scholar] [CrossRef]
  6. Alawar, M.; Fiorese, V.; Lépilliet, S.; Gloria, D.; Ducournau, G.; Dubois, E. A G-Band Glass Interposer Technology for the Integration of an Amplified Noise Source based on SiGe BiCMOS 55-nm Technology. In Proceedings of the 2024 IEEE Radio Frequency Integrated Circuits Symposium (RFIC), Washington, DC, USA, 16–18 June 2024; pp. 31–34. [Google Scholar]
  7. Ghanem, H.; Azevedo Goncalves, J.C.; Chevalier, P.; Alaji, I.; Aouimeur, W.; Lepilliet, S. Modeling and Analysis of a Broadband Schottky Diode Noise Source up to 325 GHz Based on 55-nm SiGe BiCMOS Technology. IEEE Trans. Microw. Theory Tech. 2020, 68, 2268–2277. [Google Scholar] [CrossRef]
  8. Song, H.J.; Shimizu, N.; Furuta, T.; Wakatsuki, A.; Nagatsuma, T. Subterahertz noise signal generation using a photodetector and wavelength-sliced optical noise signals for spectroscopic measurements. Appl. Phys. Lett. 2008, 93, 241113. [Google Scholar] [CrossRef]
  9. Sun, Y.H.; Chen, Y.X.; Li, P.; Zinsou, R.; Wang, A.B.; Wang, Y.C. Flat Millimeter-Wave Noise Generation by Optically Mixing Multiple Wavelength-Sliced ASE Lights. IEEE Photonics Technol. Lett. 2021, 33, 1270–1273. [Google Scholar] [CrossRef]
  10. Liu, J.B.; Liu, W.J.; Sun, Y.H.; Guo, Y.; Zhang, Y.W.; Xu, L.M.; Wang, Y.C. Generation of broadband flat millimeter-wave white noise using rectangular ASE slices mixing. Opt. Commun. 2022, 530, 129106. [Google Scholar] [CrossRef]
  11. Chen, T.X.; Liu, W.J.; Tao, X.Y.; Lu, D.; Sun, Y.H.; Liu, J.B.; Jia, Z.W.; Wang, Y.C. Millimeter-wave noise generation based on a monolithically integrated dual-mode chaotic laser. Opt. Lett. 2023, 48, 4649–4652. [Google Scholar] [CrossRef] [PubMed]
  12. Molter, D.; Kolano, M.; Freymann, G.V. Terahertz Cross-Correlation Spectroscopy Driven by Incoherent Light from a Superluminescent Diode. Opt. Express 2019, 27, 12659–12665. [Google Scholar] [CrossRef] [PubMed]
  13. Bai, Z.C.; Liu, X.; Ding, J.; Cui, H.L.; Su, B.; Zhang, C.L. Terahertz Generation and Detection of 1550-nm-Excited LT-GaAs Photoconductive Antennas. J. Mod. Opt. 2021, 68, 824–829. [Google Scholar] [CrossRef]
  14. Taghinejad, M.; Xia, C.Y.; Hrton, M.; Lee, K.; Kim, A.; Li, Q.; Guzelturk, B.; Kalousek, R.; Xu, F.; Cai, W.S.; et al. Terahertz radiation of plasmonic hot carriers. In Proceedings of the Photonic and Phononic Properties of Engineered Nanostructures XIV, San Francisco, CA, USA, 29 January–1 February 2024; p. 1289602. [Google Scholar]
  15. Burford, N.M.; El-Shenawee, M.O. Review of terahertz photoconductive antenna technology. Opt. Eng. 2017, 56, 010901. [Google Scholar] [CrossRef]
  16. Preu, S.; Döhler, G.H.; Malzer, S.; Wang, L.J.; Gossard, A.C. Tunable, continuous-wave Terahertz photomixer sources and applications. J. Appl. Phys. 2011, 109, 061301. [Google Scholar] [CrossRef]
  17. Kuwashima, F.; Jarrahi, M.; Cakmakyapan, S.; Morikawa, O.; Shirao, T.; Iwao, K.; Kurihara, K.; Kitahara, H.; Furuya, T.; Wada, K.; et al. Evaluation of High-Stability Optical Beats in Laser Chaos by Plasmonic Photomixing. Opt. Express 2020, 28, 24833–24844. [Google Scholar] [CrossRef] [PubMed]
  18. Oeuvrard, S.; Lampin, J.F.; Ducournau, G.; Lepilliet, S.; Danneville, F. On wafer silicon integrated noise source characterization up to 110 GHz based on germanium-on-silicon photodiode. In Proceedings of the 2014 International Conference on Microelectronic Test Structures (ICMTS), Udine, Italy, 24–27 March 2014; pp. 150–154. [Google Scholar]
  19. Gregory, I.S.; Baker, C.; Tribe, W.R.; Bradley, I.V.; Evans, M.J.; Linfield, E.H.; Davies, A.G.; Missous, M. Optimization of photomixers and antennas for continuous-wave terahertz emission. IEEE J. Quantum Electron. 2005, 41, 717–728. [Google Scholar] [CrossRef]
  20. Zhao, R.; Zhang, Z.; Zhang, Y.; Zhang, S.; Duan, X.; Li, Y. Design and Implementation of 50GHz-110GHz Ultra-Broadband Noise Source. In Proceedings of the 2022 International Conference on Microwave and Millimeter Wave Technology (ICMMT), Harbin, China, 12–15 August 2022; pp. 1–3. [Google Scholar]
  21. Ghanem, H.; Lepilliet, S.; Danneville, F.; Ducournau, G. 300-GHz Intermodulation/Noise Characterization Enabled by a Single THz Photonics Source. IEEE Microw. Wirel. Compon. Lett. 2020, 30, 1013–1016. [Google Scholar] [CrossRef]
  22. Taghinejad, M.; Xia, C.Y.; Hrton, M.; Lee, K.; Kim, A.; Li, Q.; Guzelturk, B.; Kalousek, R.; Xu, F.; Cai, W.S.; et al. Determining hot-carrier transport dynamics from terahertz emission. Science 2023, 382, 299–305. [Google Scholar] [CrossRef] [PubMed]
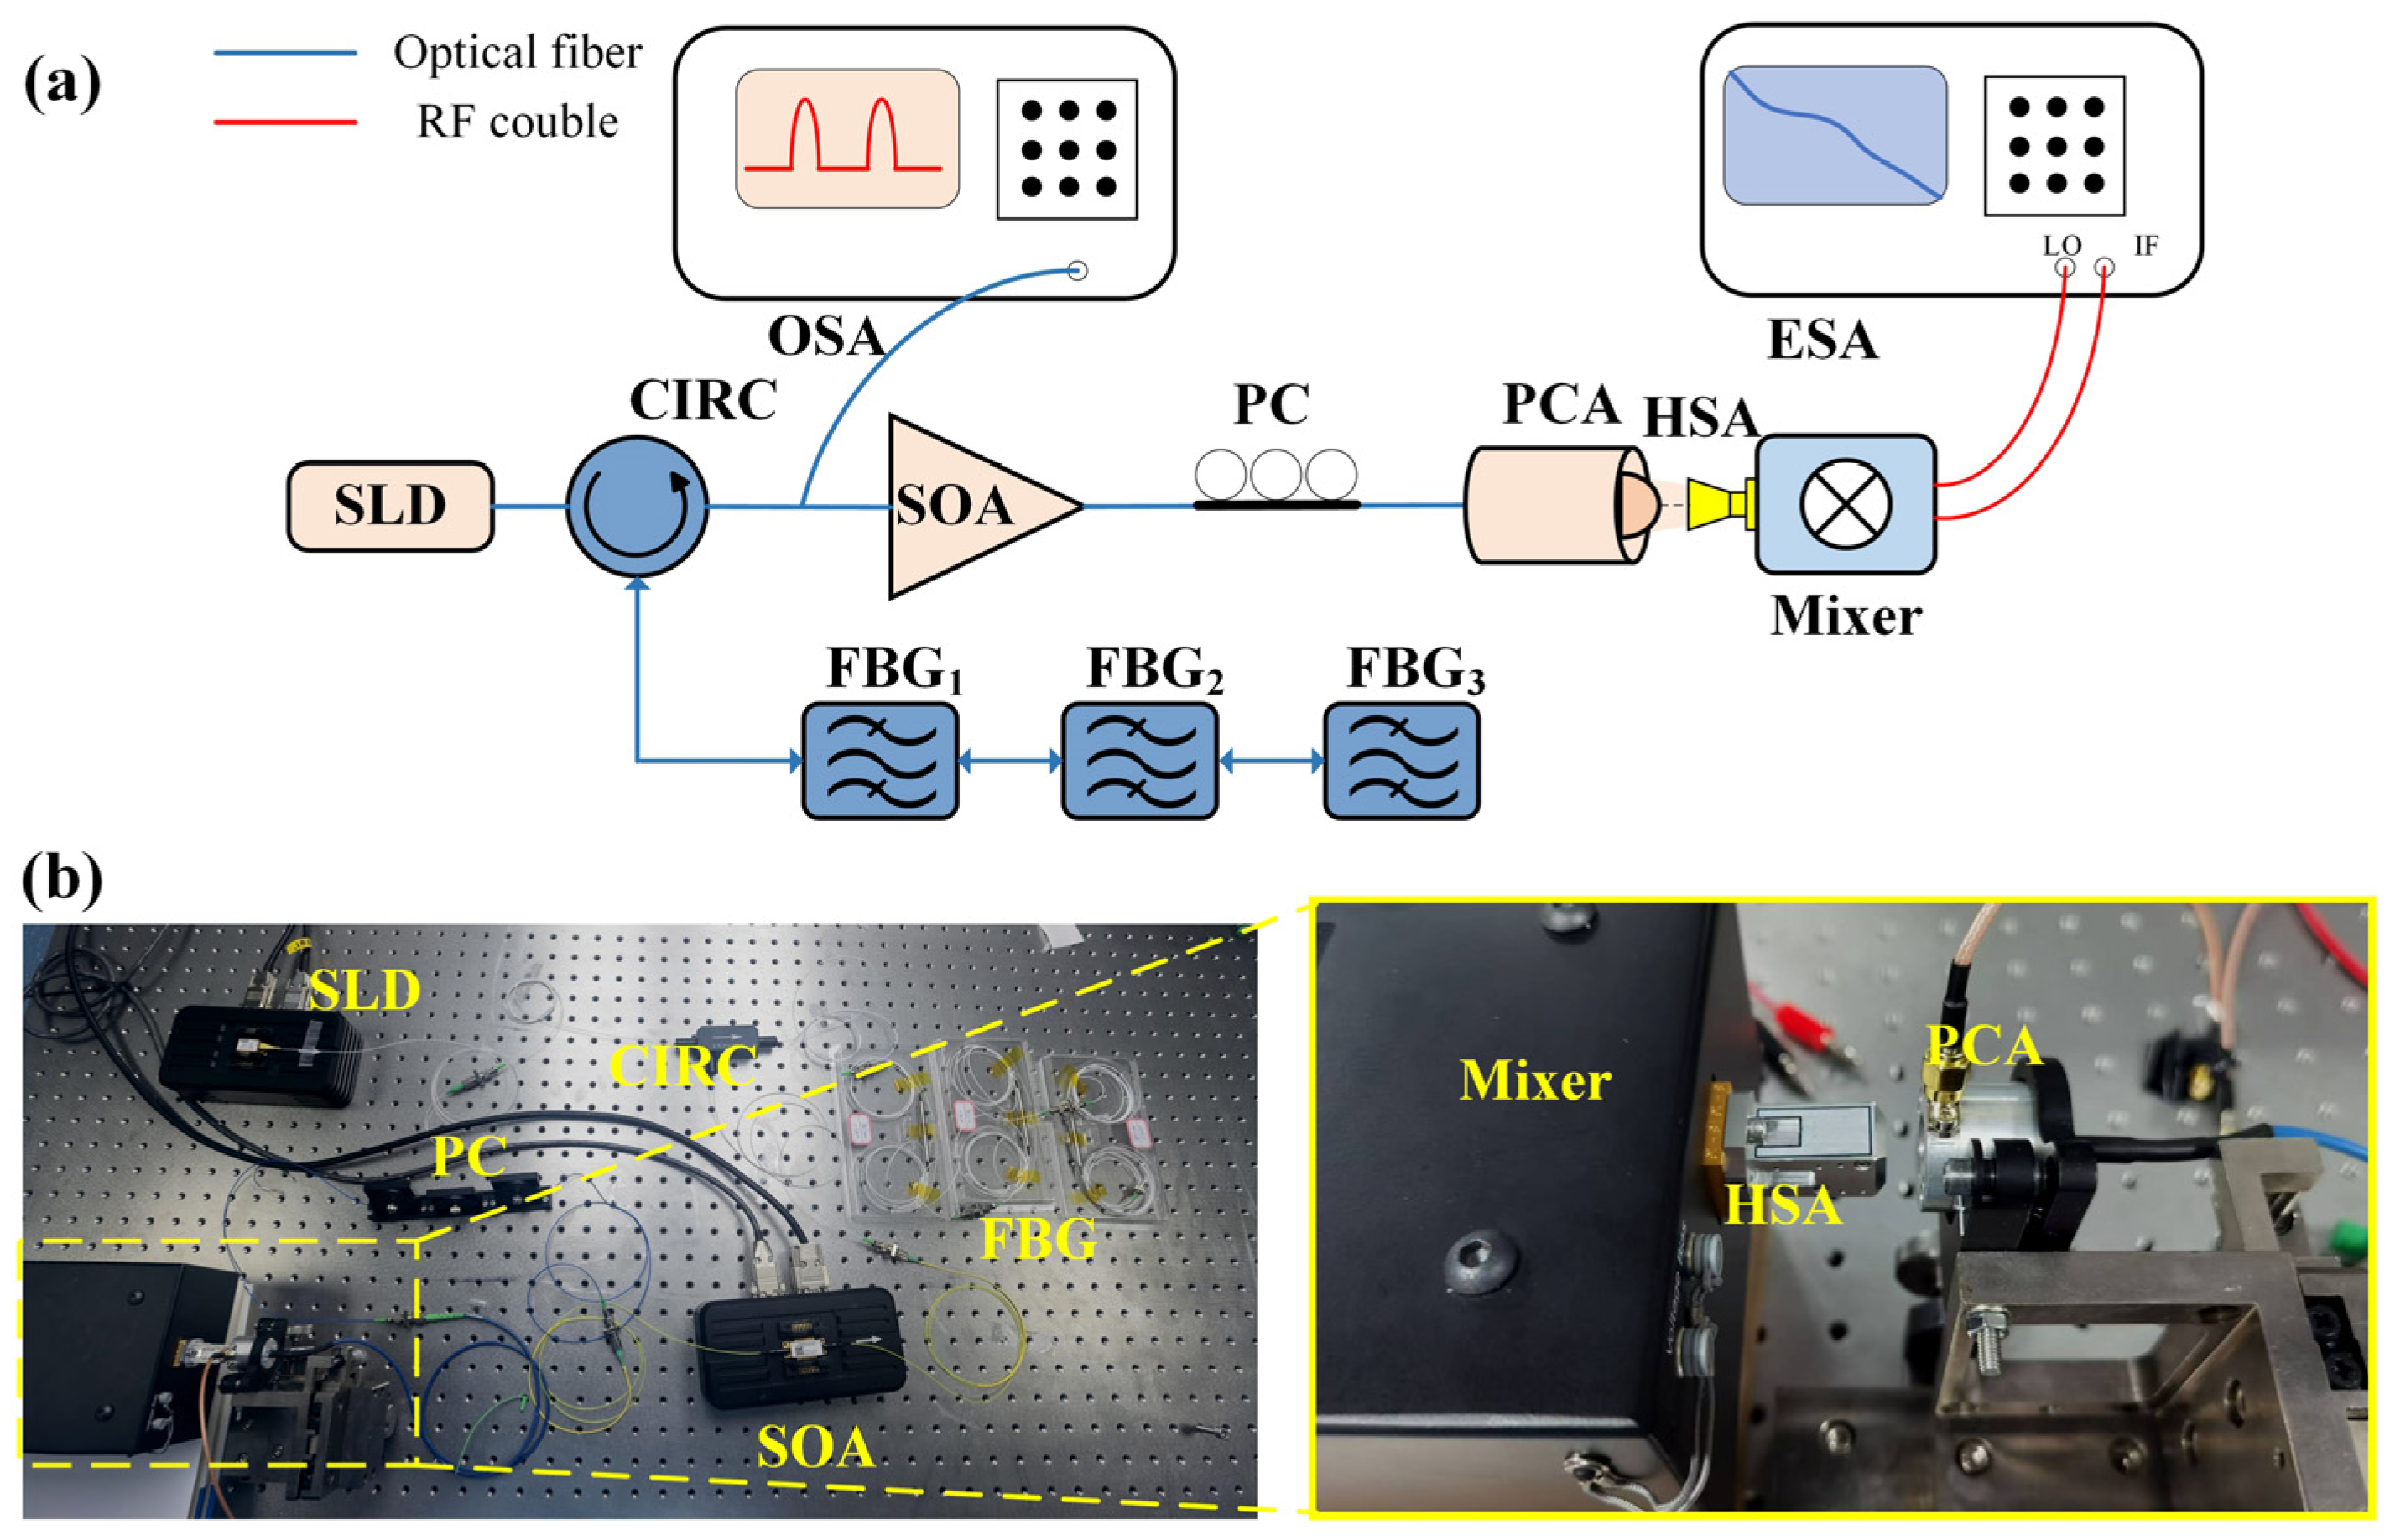
Figure 1. (a) Schematic diagram for generating 75~400 GHz terahertz noise based on photoconductive antennas. (b) Terahertz noise source experimental setup diagram, the yellow block diagram shows the schematic of the 170~400 GHz band horn antenna connected to the PCA. SLDs, super-luminescent diodes; CIRC, circulator; SOA, semiconductor optical amplifier; FBG, fiber Bragg gratings; PC, polarization controller; HSA, horn antenna; mixer, harmonic mixer; ESA, electrical spectrum analyzer; and OSA, optical spectrum analyzer.
Photonics 12 00252 g001
Figure 2. Cross-section of optical carrier generation at the electrode gap of an LT-GaAs-based PCA, with the red line indicating the electric field lines and the black line indicating terahertz generation via two beams of incoherent light in a thin layer of LT-GaAs.
Photonics 12 00252 g002
Figure 3. Responsivity function of the frequency characteristics of PCA (a) and simulated ENR curves of the mixing of three Gaussian light beams with σ = 0.2 nm (b), σ = 0.5 nm (c), and σ = 0.8 nm (d). The inset shows the spectrum of the Gaussian mixing used, with center frequencies of 783 nm, 783.5 nm, and 784 nm.
Photonics 12 00252 g003
Figure 4. Measured results of optical spectra after fiber Bragg gratings filtering, with center frequencies of 783.03 nm, 783.66 nm, and 784.02 nm.
Photonics 12 00252 g004
Figure 5. Power spectrum THz noise in the frequency range of 75~110 GHz (a), 110~170 GHz (c), 170~260 GHz (e), and 260~400 GHz (g) via the mixing of three Gaussian-shaped SLD wavelength-sliced light beams. Calculated ENR of terahertz noise in the frequency range of 75~110 GHz (b), 110~170 GHz (d), 170~260 GHz (f), and 260~400 GHz (h).
Photonics 12 00252 g005
Table 1. Frequency, flatness, and ENR of noise sources in comparison to this work.
YearGenerating TechnologyDeviceFrequency (GHz)ENR (dB)Flatness (dB)Ref
2022ElectronicsGaAs Schottky Diodes50~1107~19±6[20]
2024ElectronicsSi Schottky Diodes140~17020~24±2[6]
2014PhotonicsGeHSPD75~11035±3[18]
2020PhotonicsUTC-PD260~32028±2.5[21]
2023PhotonicsUTC-PD237~28147-[11]
2022Photonic mixingUTC-PD130~170-±1.75[10]
2025Photonic mixingPCA75~40018.7~20.7±7.9This work
Disclaimer/Publisher’s Note: The statements, opinions and data contained in all publications are solely those of the individual author(s) and contributor(s) and not of MDPI and/or the editor(s). MDPI and/or the editor(s) disclaim responsibility for any injury to people or property resulting from any ideas, methods, instructions or products referred to in the content.