Abstract
Fiber-reinforced composites, such as glass fiber-reinforced polymer (GFRP), are widely used across industries but are susceptible to inclusion defects during manufacturing. Detecting and classifying these defects is crucial for ensuring material integrity. This study classifies four common inclusion defects—metal, peel ply, release paper, and PTFE film—in GFRP using terahertz technology and machine learning. Two GFRP sheets with inclusion defects at different depths were fabricated. Terahertz time-domain signals were acquired, and a cross-correlation-based deconvolution algorithm extracted impulse responses. LSTM-RNN, Bi-LSTM RNN, and 1D-CNN models were trained and tested on time-domain, frequency-domain, and impulse response signals. The defect-free region exhibited the highest classification accuracy. Bi-LSTM RNN achieved the best recall and macro F1-score, followed by 1D-CNN, while LSTM-RNN performed worse. Training with impulse response signals improved classification while maintaining accuracy.
1. Introduction
Glass fiber-reinforced polymer (GFRP) composites are high-performance structural materials characterized by high specific strength, high specific modulus, excellent fatigue resistance, and corrosion resistance. Due to these advantages, they are increasingly utilized in aerospace, automotive, and marine industries [1]. However, during manufacturing, composite components are prone to internal defects due to process variations or human error. These defects significantly degrade mechanical properties and may even pose safety hazards [2,3]. Therefore, conducting non-destructive testing (NDT) and assessment before and during service is crucial to identifying potential defects and failures. Implementing timely preventive or corrective measures ensures structural integrity, meets performance requirements, and mitigates safety risks [4].
The common defects of composite materials in engineering applications include delamination, inclusions, debonding, and porosity. Among these, inclusion defects refer to the presence of metallic or non-metallic foreign materials within the composite, such as particles, films, peel ply, or release paper [5]. These defects primarily arise from raw material contamination, human error, or inadequate environmental cleanliness in the molding workshop [6]. Inclusion defects reduce the mechanical strength of composites and can serve as initiation sites for corrosion, ultimately shortening material lifespan and increasing the risk of safety incidents [7]. Therefore, detecting and classifying inclusion defects in GFRP is a critical step in both manufacturing and operational stages, carrying significant research importance. By accurately classifying different types of inclusion defects, their impact on material properties can be assessed, enabling appropriate repair or optimization measures. This ensures improved composite material quality, enhances structural safety, and optimizes the manufacturing process.
Currently, non-destructive testing (NDT) methods for detecting inclusion defects in composites include X-ray, ultrasonic, and infrared thermography [8]. While these techniques are effective, each has its own limitations [9]. X-ray computed tomography (XCT) is a powerful tool for studying the microstructure of composites in laboratory settings and serves as a reference method for small specimens [10]. However, its high cost and additional shielding requirements make online applications challenging. Ultrasound, primarily used in transmission mode, lacks depth information, limiting its ability to assess internal structures [11]. Infrared thermography, a versatile non-contact technique, has a shallow penetration depth, restricting its effectiveness in detecting subsurface or deep defects [12]. Therefore, there is a need for an NDT method that is safe, minimally affected by environmental factors, offers greater depth penetration, and provides higher spatial resolution to complement existing techniques.
Terahertz (THz) technology is an emerging detection method with several advantages, including non-destructive, non-electrical, and non-contact sensing [13,14]. Terahertz time-domain spectroscopy (THz-TDS) is characterized by high penetration depth, broad bandwidth, and short wavelength [15], making it especially suitable for analyzing dielectric and non-polar materials [16]. The rich spectral information provided by THz-TDS enables a detailed examination of internal structures [17,18] and offers unique capabilities not available in conventional spectroscopic techniques. Consequently, THz-TDS gained increasing attention in the non-destructive testing (NDT) of composite materials. Zhang et al. [19] demonstrated that hidden defects simulated by artificial polytetrafluoroethylene inserts could be detected using THz-TDS imaging. Wang et al. [20] employed THz-TDS signals to detect inclusions of various shapes and materials embedded in glass fiber-reinforced polymer (GFRP). Similarly, other studies [21,22,23,24] confirmed the effectiveness of THz-TDS imaging in detecting different types of buried defects in GFRP.
The rapid development of machine learning introduced a new approach to solving the defect classification problem. By extracting features from ultrasonic signals using neural networks, Cruz et al. [25] effectively classified defects in welded joints. Min et al. [26] achieved automatic classification of carbon fiber-reinforced polymer (CFRP) defects based on ultrasonic signals processed by convolutional neural networks (CNNs). Similarly, Bang et al. [27] utilized a thermal imaging dataset of composites with defects and combined it with deep learning techniques for identifying defects in composites. Duan et al. [28] applied infrared thermography to automatically classify air, water, and oil defects in stainless steel. Rogala et al. [29] employed CNNs to classify different types of structural damage in composites based on X-ray inspection results, demonstrating high classification accuracy. Deep learning technology has been increasingly applied in non-destructive testing using infrared, ultrasonic, and X-ray techniques. One-dimensional sequence models demonstrated strong performance in processing, classifying, and predicting one-dimensional data. However, no studies explored the use of terahertz NDT combined with machine learning for classifying inclusion defects in composite materials.
In this work, we extend the sequential data processing model to classify inclusion defects in GFRP. This study focuses on the classification of four common types of inclusion defects in GFRP materials: metal, peel ply, release paper, and polytetrafluoroethylene (PTFE) film. We will fabricate two GFRP sheets, each containing four types of inclusion defects buried at varying depths, and collect time-domain signals from defect and non-defect regions to form the dataset. Next, we will extract the impulse response of the signals using a one-dimensional, mutual correlation-based deconvolution algorithm. Finally, we will train and test three neural network models—long short-term memory recurrent neural network (LSTM-RNN), bidirectional attentional LSTM-RNN (Bi-LSTM RNN), and the one-dimensional convolutional neural network (1D-CNN)—using the original terahertz time-domain, frequency-domain, and impulse response signals. The performance of these models will be evaluated, and the effects of pixel reconstruction will be compared.
2. Sample Preparation and Experimental Setup
2.1. GFRP Sample with Multi-Inclusion
Two GFRP laminates designed and fabricated for this study are shown in Figure 1, serving as training and test samples. The specimens were made from G20000 unidirectional glass fiber prepreg, produced by Weihai Guang Wei Company, Weihai, China. Each layer had a thickness of 0.2 mm, and the external dimensions of the specimens were 120 mm × 120 mm × 3.2 mm and 70 mm × 70 mm × 3.2 mm, with a lay-up sequence of [0°/90°]8s. The GFRP specimen was cured at 120 °C for 12 h on the electric heating table. The inclusion defects are 12 mm diameter circular flakes in the training samples, arranged from top to bottom, consisting of metal, peel ply, release paper, and PTFE film. The defect depths, from left to right, were 0.4 mm, 0.6 mm, 0.8 mm, 1.0 mm, 1.2 mm, and 1.4 mm. Similarly, the inclusion defects are 9 mm diameter circular flakes in the test samples, from top to bottom, including metal, peel ply, release paper, and PTFE film, corresponding to the training samples. The defect depths, from left to right, were 0.2 mm, 0.8 mm, and 1.6 mm, respectively.
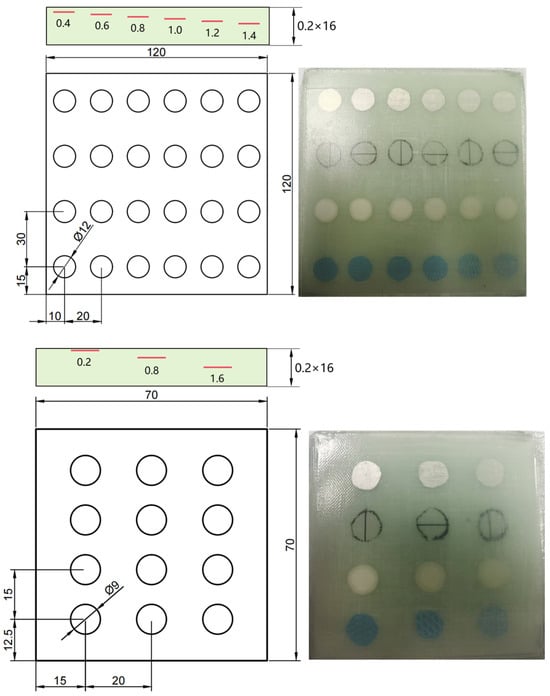
Figure 1.
Schematics of the design layout (top and middle panels; the sizes are in unit of mm), and images of the two as-fabricated GFRP laminates.
2.2. Detection Device
The experiment in this study utilized the QT-TO1000 terahertz tomography imaging system manufactured by Qingyuan Peak Reach Company, Qingyuan, China, as illustrated in Figure 2. The system consists of three main components: a femtosecond laser, emitter and detector, and a two-dimensional motor platform. The terahertz signal is generated by a photoconductive antenna and detected by low-temperature-grown GaAs (a photoelectric crystal). The system has a THz pulse width of 250 fs, and the time domain range is from 0 to 100 ps with 0.05 resolution. The system operates in a spectral range of 0.064 THz, with a frequency resolution of 20 GHz and a peak dynamic range of 80 db. The waveform Is sampled at a frequency of 500 Hz and the time sampling interval is 0.01 ps. During the experiment, the system should operate at a temperature of 20 °C ± 5 °C and a relative humidity of 20–40%. To ensure stable operation, strong sources of electromagnetic interference should be avoided whenever possible.

Figure 2.
Schematic diagram of the QT-TO1000 terahertz tomographic system and equipment principles.
Considering the material of the substrate, it is always metal. Consequently, THz waves cannot penetrate through it. Therefore, this analysis is all based on the reflection-mode THz-TDS system. The maximum scanning range of the two-dimensional motor platform is 150 mm × 150 mm, and the minimum scanning step is 0.05 mm. During the THz testing process, the THz reference signal was first recorded to determine the focus location by setting a metal plate at the sample location. Then, the tested sample is placed below the probe and the system is refocused on the surface of the sample. It is worth noting that all measurements are performed under the same experiment condition.
2.3. THz-TDS Signals Collection
The GFRP laminates were placed on a motorized X-Y 2D stage. Terahertz time-domain spectral signals were collected from four types of inclusion defects and non-defective regions in the training samples to construct the dataset. These signals were labeled as metal, peel ply, release paper and PTFE film, and non-defective, respectively.
A total of 26,525 signals were obtained, with 3260, 3150, 3217, 3258, and 13,640 signals corresponding to metal, peel ply, release paper and PTFE film, and non-defective regions, respectively. For each region (non-defective and four inclusion defect types), 80% of the signals were used as the training dataset, while the remaining 20% were allocated for validation.
For the test dataset, THz-TDS signals were collected by uniformly scanning the test specimen point-by-point over a 138 × 138 grid using a 0.5 mm scanning platform, yielding a total of 19,044 signals. The detailed information of the dataset is listed in Table 1.

Table 1.
Sample sizes of each label.
3. Signal Processing
3.1. Interpretability Analysis
To analyze the interpretability of the one-dimensional sequence model for classifying inclusion defects, Figure 3 presents a typical set of terahertz time-domain signals and the corresponding spectral signals. These signals were collected from the non-defective region and four different inclusion defect areas at the same depth.
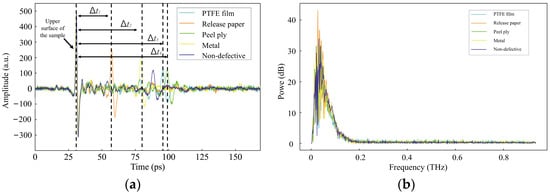
Figure 3.
(a) Typical terahertz time-domain signals and (b) the corresponding spectral signals collected from different areas of the as-fabricated GFRP laminates. The dashed lines in (a) show the time delays between signals of the non-defective area and the four defective areas, which are calculated to be Δt1 = 25.2294 ps, Δt2 = 50.1619 ps, Δt3 = 68.849 ps, and Δt4 = 71.2844 ps, respectively.
As shown in Figure 3a, the terahertz reflection signals of different types of inclusion defects and non-defective regions exhibit distinct characteristics. Notably, the amplitude variations of metal and release paper defects are more pronounced than those of non-defective regions, whereas the signals of PTFE film and release cloth inclusions appear relatively similar. In addition to the surface peak, the release paper defect reaches its maximum value around 60 ps, while the non-defective region reaches its peak at approximately 88 ps. This indicates that distinguishing release paper defects from non-defective areas is relatively straightforward. In contrast, the reflected signals from PTFE film and peel ply defects exhibit similar amplitudes, peak positions, and peak times, making their differentiation more challenging.
The frequency-domain signals reveal the absorption characteristics of different inclusion defect types and non-defective regions. Reflection peaks correspond to weak absorption, whereas reflection valleys indicate strong absorption, which occurs due to the interaction between the material’s molecular resonance and terahertz waves. The strong absorption frequency (SAF) and weak absorption frequency (WAF) vary depending on the defect type. As shown in Figure 3b, at 0.075 terahertz, the spectral signals of the non-defective region and the four defective regions exhibit significant differences. The SAF and WAF values of the non-defective signals differ markedly from those of the defective regions, making them easier to distinguish in the frequency domain. Additionally, PTFE film and metal defects display pronounced SAF and WAF values compared to the non-defective regions, indicating their clear identifiability. In contrast, the SAF and WAF values of release paper and peel ply defects are relatively close, making their classification more challenging. However, a slight difference in the amplitude of their WAF values provides a potential distinguishing factor. Overall, the differences in SAF, WAF, and amplitude contribute to the feasibility of classifying these materials with promising classification accuracy.
3.2. Cross-Correlation Terahertz Impulse Extraction
Impulse terahertz waves are highly effective for investigating delaminated materials in reflection mode, sharing several similarities with the ultrasonic impulse-echo method. By analyzing the time-of-flight information from reflection signals, the thickness of multiple layers can be accurately determined. Moreover, this approach facilitates the detection of boundary changes within delaminated materials, offering valuable insights into their internal structure.
The measured signal S(t) can be expressed as the convolution of the incident terahertz signal Ein(t) with the impulse response function h(t), which encapsulates the material’s properties, combined with random noise n(t). The composition diagram is shown in Figure 4 and the equation is as follows:

Figure 4.
Schematic diagram of the composition of measurement signal.
By analyzing the terahertz time-of-flight, the terahertz time-domain signal can be represented as the convolution of the system’s response function with the incident terahertz wave’s reference signal, superimposed with unavoidable experimental noise. For significant delamination defects, direct analysis of the terahertz signal provides thickness and positional information. However, in cases of thin multi-delamination structures or deeper defects, the measured terahertz signals overlap, making it challenging to accurately determine thickness and position using conventional methods such as signal subtraction and resonance peak detection.
To address this challenge, deconvolution of terahertz signals is essential for extracting the impulse response function, enabling precise localization and characterization of defects in delaminated materials. This study proposes a deconvolution algorithm based on cross-correlation to extract the impulse response function from terahertz time-domain signals. The algorithm leverages the correlation between the reference and measured signals. The flowchart of the algorithm is shown in Figure 5, with the specific steps outlined as follows:
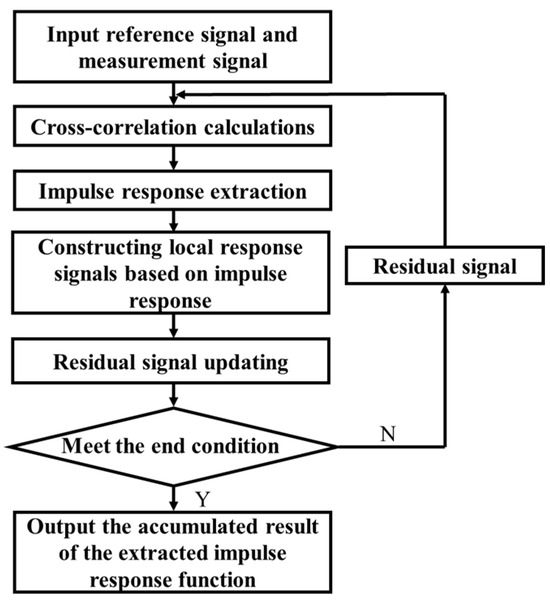
Figure 5.
Algorithm flowchart.
- (1)
- Input signal
The measurement signal S(t) and the reference signal (incident pulse) Ein(t) are taken as inputs.
- (2)
- Cross-correlation calculation
The cross-correlation function R(t) is obtained by calculating the cross-correlation between the measurement signal S(t) and the reference pulse Ein(t). The purpose is to strengthen the part of the signal that is related to the characteristics of the sample while suppressing the noise component. The expression is given below:
- (3)
- Impulse response extraction
Find the time tmax and amplitude Amax of the absolute maximum in R(t) and obtain the impulse response h(t) corresponding to the absolute maximum. The expression is as follows:
is the Dirac delta function, which is commonly used to describe the temporal position of the impulse response.
- (4)
- Constructing local response signals based on impulse response
The local response signal L(t) is obtained by convolving the extracted impulse response h(t) with the reference pulse Ein(t). The expression is as follows:
- (5)
- Iterative solution of residual signals
The reconstructed local response signal L(t) is subtracted from the measurement signal S(t) to obtain the residual signal Si+1(t):
- (6)
- Output results
The final impulse response hout(t) is obtained by accumulating all the impulse response functions extracted by the iterative process:
The proposed algorithm processes typical terahertz time-domain signals from four types of inclusion defects and defect-free regions. The reconstructed impulse responses are displayed on the right side of Figure 6. The convolution results obtained from the cross-correlation algorithm indicate the time of flight of the terahertz impulse response within the sample. The figure demonstrates that the algorithm effectively extracts impulses from the upper and lower surfaces of the material, as well as from inclusion defect regions. Additionally, the convolution results clearly depict the change in reflectivity sign caused by the variation in the reflectivity index from GFRP to inclusion defects and back to GFRP.
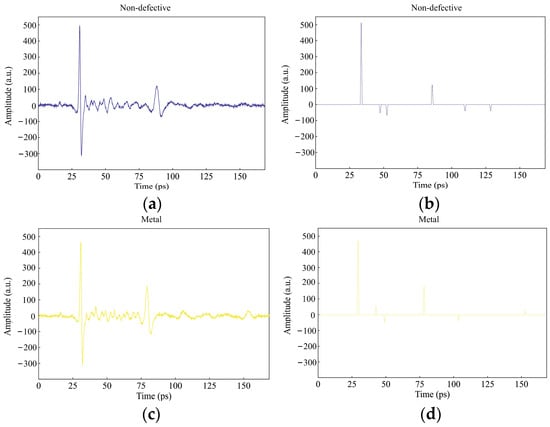
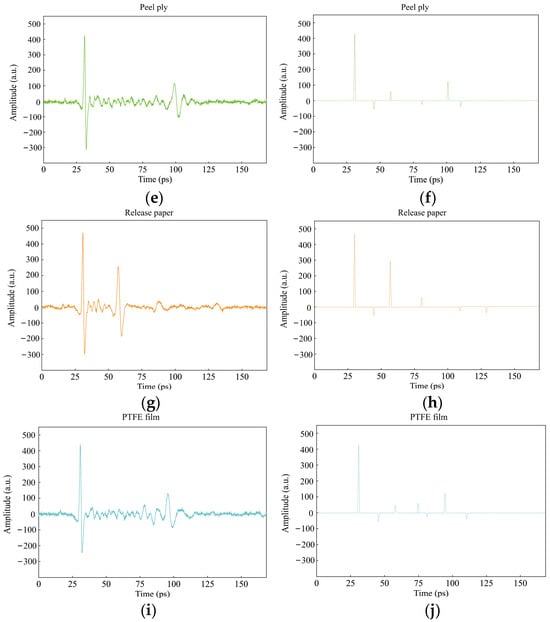
Figure 6.
Extraction of impulse response function for four types of inclusion defects and defect-free regions: (a,c,e,g,i) are the raw terahertz time-domain signals of the selected defect-free region and the four inclusions, respectively. Additionally, (b,d,f,h,j) are the impulse extraction functions corresponding to no defects and four kinds of inclusions defects.
To assess the accuracy of the proposed algorithm in extracting the defective impulse response function, the impulse response signal is reconstructed and evaluated based on two metrics: root mean square error (RMSE) and compression ratio (CR), which correspond to reconstruction accuracy and sparsity dimensions, respectively.
- (1)
- Relative root mean squared error
RMSE is a critical metric for evaluating the performance of pulse extraction algorithms. The calculation formula is as follows:
The reconstructed signal is denoted as , which is obtained by convolving the reference terahertz wave with the maximized pulse function. The original signal is denoted as . The smaller the RMSE value, the higher the reconstruction accuracy of the signal processing algorithm.
- (2)
- Compression ratio
The compression ratio is a key metric for assessing signal sparsity. It effectively measures the complexity of the signal. Denoted as CR, it is calculated using the following formula:
where N is the number of sampling points in the original THz signal, and M is the number of sampling points of the THz signal after sparse processing.
The results are shown in Table 2:

Table 2.
Algorithm validation results.
The results show that the proposed pulse extraction algorithm achieves high reconstruction accuracy and strong signal sparsity. It greatly reduces signal complexity and filters out noise while retaining the accuracy of material feature information. It provides more efficient and concise input data for subsequent deep learning classification algorithms for composite material inclusion defects.
4. Neural Network Structure
4.1. LSTM-RNN
LSTM is a specially structured RNN designed for processing long-duration signals [30]. It outperforms conventional RNNs and addresses the issues of gradient vanishing and explosion when training on long-duration data. The model consists of an LSTM layer (hidden layer), an output layer, and a fully connected layer between them. The structural design emphasizes the addition of a fully connected layer after the LSTM output layer, with classification results produced via a sigmoid function. The LSTM layer in this study consists of 128 units, selected through trial and error. The fully connected layer comprises five nodes. The output layer consists of five nodes, representing the non-defective region and four types of inclusion defect regions.
The LSTM layer comprises three main gates: the forget gate, input gate, and output gate, labeled as boxes “1”, “2”, and “3” in Figure 7, respectively. The forget gate decides whether to discard the cell state of previous moment, ct−1, and the input gate calculates the state cell
based on the input vector xt and the hidden state ht−1. ft, it, and ct represent the forget gate, the input gate, and the cell state, respectively. Function σ (·) represents the sigmoid function, which enables the value between 0 and 1, and function tanh (·) represents the hyperbolic tangent function, mapping values to the range [−1, 1]. The output gate generates the hidden state ht at time t based on the current cell state.
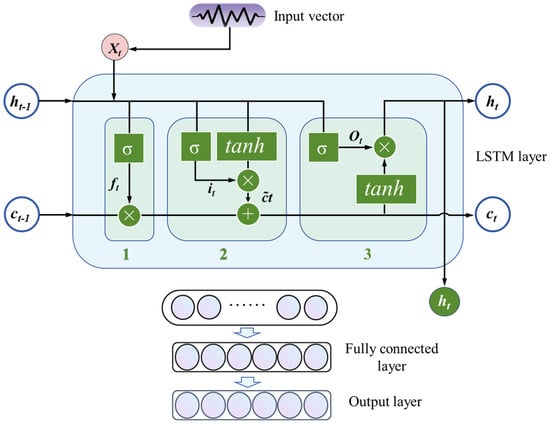
Figure 7.
Data flow diagram of LSTM-RNN model.
4.2. Attention Based Bi-LSTM-RNN
Figure 8 depicts the data flow of the attention-based Bi-LSTM-RNN model. Building upon the LSTM-RNN, a backward LSTM propagation layer with 128 cells is added following the forward LSTM propagation layer. Additionally, an attention layer is introduced between the backward LSTM propagation layer and the fully connected layer.
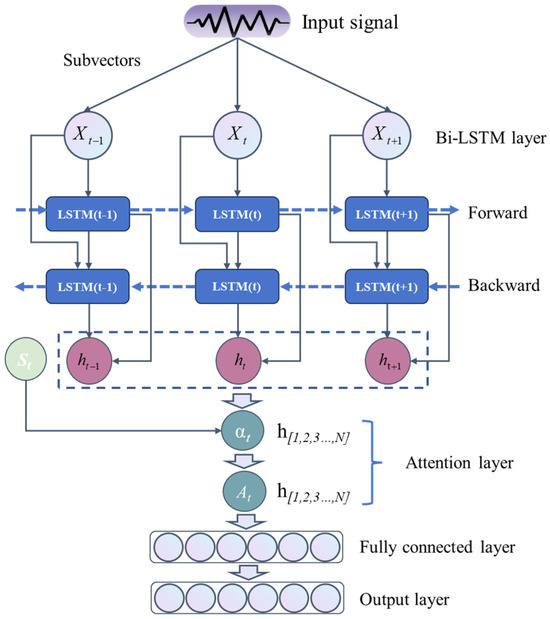
Figure 8.
Data flow diagram of attention based Bi-LSTM-RNN model.
In the forward propagation layer, the input vectors are {x1, x2,…, xn}; whereas in the backward propagation layer, the input vectors are {xn, xn−1,…, x1} and the hidden state of the forward propagation layer. The hidden state of Bi-LSTM-RNN can be described by
where the function ⊙ is a concatenation function that connects the outputs of the forward and the backward propagation layers through concatenation. and are the hidden states of the forward and the backward propagation layers, which are calculated iteratively according to the forward and the backward sequences of time, respectively. The output At of the attention layer can be calculated by combing all the hidden states h1, h2, …, and hN with weights αt [31],
Here αt is given by
where st is the output of a hidden state at time t. Similar to the LSTM-RNN model, the Adam optimization algorithm with a learning rate of 0.00001 was selected and categorical cross entropy was used as the loss function.
4.3. 1D-CNN
Both terahertz time-domain and frequency-domain signals are one-dimensional sequential data; therefore, 1D-CNN can be employed for feature extraction [32]. 1D-CNN typically adopts a hierarchical structure composed of convolutional and pooling layers. Each of the first three convolutional layers contains 64 convolutional kernels of the size 1 × 3. A max-pooling layer is applied to reduce redundant features. The next two convolutional layers, designed for extracting high-order features, each contain 128 convolutional kernels of the size 1 × 3. A global average pooling layer is employed to mitigate overfitting. The convolutional layer extracts the features of the input vector through the convolutional kernel. SoftMax activation function and the Adam optimizer with learning rate of 0.00001 was applied. Categorical cross entropy was used as the loss function. The 1D-CNN structure is illustrated in Figure 9.
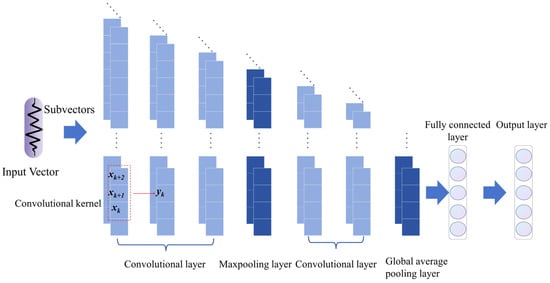
Figure 9.
Data flow diagram of 1D-CNN model.
5. Result and Evaluation
All experiments were conducted on a system equipped with an Intel® Core® i7-8750H processor, 64 GB of RAM, and a NVIDIA® GTX 4060 GPU. The experiments utilized Anaconda3, which includes PyTorch 3.11.0 as the deep learning framework. The terahertz time-domain signals, impulse response signals, and corresponding spectral signals of the training samples served as input vectors for training and validating the three models. The same types of signals from the test samples were used to evaluate model performance. As previously mentioned, the models were trained and validated using terahertz time-domain signals, impulse response signals, and corresponding spectral signals. The model was subsequently tested using terahertz time-domain signals, impulse response signals, and corresponding spectral signals. These signals were collected by scanning the entire specimen area point by point in the cross-sectional plane. During testing, each input signal was classified by the model into one of five categories: a non-defective region or one of four defective regions at specific depths. Based on the classification results of all point-by-point signals, an image with different colored pixels was constructed: dark blue represents non-defective regions, while yellow, green, orange, and cyan correspond to defective regions of metal, peel ply, release paper, and PTFE film, respectively.
The results indicate that, across all three networks, the defect-free region exhibits the highest classification accuracy for both time-domain and frequency-domain signals. This is because the defect-free signal is free from impurity interference, exhibits greater stability, and has a more consistent waveform structure. These characteristics enable the neural network to effectively learn and extract signal features, leading to higher classification accuracy.
Figure 10 presents the reconstructed terahertz images of the test specimen along with the corresponding confusion matrices for the three neural network models (the labels 0, 1, 2, 3, and 4 represent non-defective, metal, peel ply, release paper, and PTFE film, respectively). These models were trained and tested using raw terahertz time-domain signals. Consequently, the reconstructed images generated by these neural networks enable efficient detection of various inclusion defects. The occurrence of green, yellow, orange, or cyan pixels in the expected defect-free regions, as well as blue pixels in the anticipated defect regions, indicates misclassification errors.
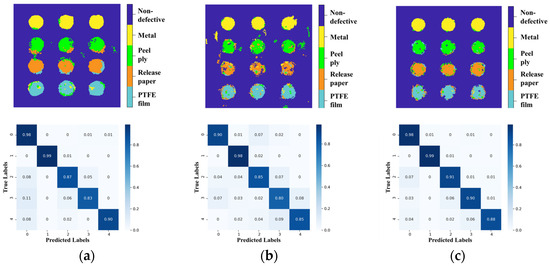
Figure 10.
Top panel: reconstructed terahertz images with inclusion defects (in different colors), and bottom panel: the corresponding confusion matrices for (a) 1D-CNN, (b) LSTM-RNN, and (c) Bi-LSTM-RNN. Each neural network was trained by terahertz time-domain signals.
Based on the reconstructed images and confusion matrices in Figure 10, we can quantitatively evaluate the performance of the three neural network models. The diagonal elements of the confusion matrix indicate the recall rates, which represent the proportion of correctly identified samples within each category. The results demonstrate that all three models effectively distinguish non-defective areas and defective regions with different inclusion types. The 1D-CNN model achieves recall rates of 0.99 and 0.90 for metal and PTFE film defective regions, respectively, while the Bi-LSTM-RNN model attains recall rates of 0.98, 0.99, 0.91, 0.90, and 0.88 for metal, peel ply, release paper, and PTFE film defects. Notably, for peel ply and release paper defective regions, the Bi-LSTM-RNN model outperforms both the LSTM-RNN and 1D-CNN models. In non-defective regions, Bi-LSTM-RNN and 1D-CNN exhibit the highest recall. Overall, the Bi-LSTM-RNN model maintains consistently high recall rates above 0.86 across all categories, as corroborated by the clear reconstructed image in Figure 10c.
Figure 11 presents the reconstructed images and confusion matrices obtained after training and testing the three models using impulse response signals. The images indicate that all three models accurately predict the defective regions. Quantitatively, each model achieves a recall rate exceeding 0.85 for these regions. Among them, the Bi-LSTM-RNN model demonstrates the highest performance, with recall rates surpassing 0.90. Its reconstructed image is very clear, especially in terms of the performance of the edges of the defective regions.
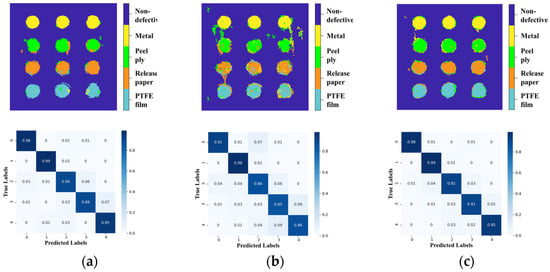
Figure 11.
Top panel: reconstructed terahertz images with inclusion defects (in different colors), and bottom panel: the corresponding confusion matrices for (a) 1D-CNN, (b) LSTM-RNN, and (c) Bi-LSTM-RNN. Each neural network was trained by impulse response signals.
Figure 11 presents the reconstructed images and confusion matrices obtained after training and testing the three models using impulse response signals. The images indicate that all three models accurately predict the defective regions. Quantitatively, each model achieves a recall rate exceeding 0.85 for these regions. Among them, the Bi-LSTM-RNN model is demonstrated.
By comparing Figure 10 and Figure 11, it is evident that when the three models were trained and tested using the impulse response signals extracted by the proposed algorithm, they exhibited higher classification accuracy. This further validates the accuracy and reliability of the impulse response signal extraction algorithm presented in this study.
Figure 12 shows the reconstructed images and confusion matrices depicted when the three models were trained and tested by terahertz spectral signals. The results indicate that peel ply and release paper are classified with lower accuracy compared to non-defective and metal. This may be because peel ply and release paper exhibit similar terahertz spectra, leading to weaker distinguishing signals. Consequently, the neural network encounters greater difficulty in distinguishing these two categories accurately. Additionally, a detailed analysis of the confusion matrix reveals specific misclassification patterns. The likelihood of misclassifying PTFE film as release paper is relatively high, whereas the likelihood of misclassifying ‘release paper’ as ‘PTFE film’ is relatively low. This difference in misclassification likelihood can be attributed to the inherent properties of the two materials, which lead to overlapping spectral features and reduced classification accuracy.
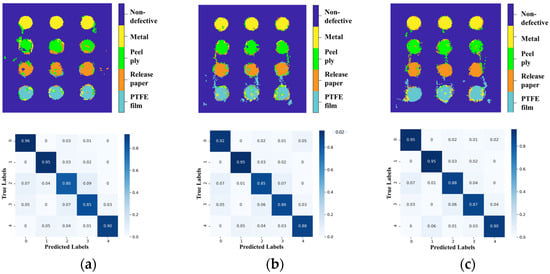
Figure 12.
Top panel: reconstructed terahertz images with inclusion defects (in different colors), and bottom panel: the corresponding confusion matrices for (a) 1D-CNN, (b) LSTM-RNN, and (c) Bi-LSTM-RNN. Each neural network was trained by terahertz frequency-domain signals.
Table 3 shows the evaluations of three sequential models using time-domain, impulse response signals, and frequency-domain signals. For the non-defective type, both 1D-CNN and Bi-LSTM achieve an accuracy of 0.98 in the time domain (TD) for the impulse response functions (IF), while 1D-CNN attains a slightly lower accuracy of 0.96 in the frequency domain (FD). For Peel ply, Bi-LSTM achieves the highest precision in the TD and IF domains, reaching 0.91 and 0.92, respectively, surpassing 1D-CNN (0.87 TD, 0.90 IF) and LSTM (0.85 TD, 0.86 IF). For release paper, Bi-LSTM also demonstrates superior precision in the TD and IF domains, achieving 0.90 and 0.91, respectively, compared to 1D-CNN (0.83 TD, 0.89 IF) and LSTM (0.80 TD, 0.85 IF). For PTFE film, 1D-CNN and Bi-LSTM exhibit equally high precision in the IF and FD domains (0.95 and 0.90, respectively). However, 1D-CNN holds a slight advantage over Bi-LSTM in the TD, while both outperform LSTM across all three domains.

Table 3.
Evaluations of three sequential models using time-domain, impulse response signals, and frequency-domain signals.
The macro F1 score represents the harmonic mean of precision and recall averaged over all output categories, providing a comprehensive metric for evaluating model performance. Analysis shows that the Bi-LSTM model outperforms the others based on the macro F1 score, followed closely by the 1D-CNN model, while the LSTM model performs relatively poorly. This ranking remains consistent regardless of whether the models are trained on time- or frequency-domain signals, demonstrating the reliability of this performance assessment across different signal types.
Regarding computational time, 1D-CNN exhibits the lowest cost across different types, ranging from 3.5 s to 6.5 s. The computational cost of LSTM ranges from 4.8 s to 6.9 s, whereas Bi-LSTM has the highest cost, varying from 5.8 s to 8.2 s. Notably, within the same model, the impulse response function consistently exhibits the shortest computation time, improving computational efficiency.
6. Conclusions
This study integrates terahertz time-domain spectroscopy (THz-TDS) with neural network models to classify inclusion defects in glass fiber-reinforced polymer (GFRP) composites. GFRP samples with various inclusion defects at different depths were fabricated to construct a comprehensive dataset for model training and testing. The proposed cross-correlation-based deconvolution algorithm effectively extracts impulse response functions, enhancing defect classification accuracy and training efficiency. Among the three evaluated neural network models, the Bi-LSTM RNN achieved the highest recall rates and macro F1-scores, demonstrating superior performance. The 1D-CNN model also exhibited strong classification capability, particularly for certain defect types, while the LSTM-RNN model was relatively less effective. Additionally, the analysis of different signal types revealed that impulse response signals consistently improved classification performance across all models.
To further enhance the effectiveness and applicability of the proposed approach, future research will focus on three key aspects:
- (1)
- Optimization of neural network models. Future work will integrate transformer-based models and attention mechanisms to improve feature extraction and classification accuracy, especially for small or overlapping defects. Model generalization will also be enhanced through data augmentation and transfer learning techniques.
- (2)
- Advanced signal processing techniques. To improve defect detection sensitivity, adaptive filtering, wavelet transform methods, and multi-scale analysis will be explored. Additionally, a feature fusion strategy integrating time-domain, frequency-domain, and impulse response signals will be developed to maximize useful information extraction from THz signals.
- (3)
- Expansion of defect and material types. To validate the robustness and universality of the method, future studies will include additional defect types, such as porosity and inclusions, and extend the approach to different composite material systems. This will ensure broader applicability in industrial non-destructive evaluation and quality control.
By addressing these aspects, this study aims to further improve the accuracy, reliability, and generalizability of the proposed method, making it more suitable for real-world composite material inspection applications.
Author Contributions
Y.S. contributed to the conception of the study and wrote the manuscript. X.L. performed the experiments and wrote the manuscript together; J.A. contributed significantly to the analysis; K.L. assisted with performing the analysis; Y.L. assisted with constructive discussions; H.C., supervision. All authors have read and agreed to the published version of the manuscript.
Funding
This research is funded by the National Natural Science Foundation of China The grant number: (No. 52275512).
Institutional Review Board Statement
Not applicable.
Informed Consent Statement
Not applicable.
Data Availability Statement
The experimental data are available locally.
Acknowledgments
A great deal of support was received from Hui Cheng.
Conflicts of Interest
The authors declare that they have no known competing financial interests or personal relationships that could have appeared to influence the work reported in this paper.
Abbreviations
The following abbreviations are used in this manuscript:
| GFRP | Glass fiber-reinforced polymer |
| THz-TDS | Terahertz time-domain spectroscopy |
| THz | Terahertz |
| PTFE | Polytetrafluoroethylene |
| 1D-CNN | One-dimensional convolutional neural network |
| LSTM | Long short-term memory |
References
- Ciardiello, R.; Fiumarella, D.; Belingardi, G. Enhancement of the Mechanical Performance of Glass-Fibre-Reinforced Composites through the Infusion Process of a Thermoplastic Recyclable Resin. Polymers 2023, 15, 3160. [Google Scholar] [CrossRef] [PubMed]
- Lunetto, V.; Galati, M.; Settineri, L.; Iuliano, L. Sustainability in the manufacturing of composite materials: A literature review and directions for future research. J. Manuf. Process. 2023, 85, 858–874. [Google Scholar] [CrossRef]
- Zhou, H.; Zhu, J.; Wang, C.; Gu, X.; Yang, J.; Wang, J.; Zhang, W. Optimization design for 3D-braided composite structure under thermo-mechanical load. Struct. Multidiscip. Optim. 2023, 66, 193. [Google Scholar] [CrossRef]
- Wang, B.; Zhong, S.; Lee, T.L.; Fancey, K.S.; Mi, J. Non-destructive testing and evaluation of composite materials/structures: A state-of-the-art review. Adv. Mech. Eng. 2020, 12, 1687814020913761. [Google Scholar]
- Zhou, K.; Hoh, H.J.; Wang, X.; Keer, L.M.; Pang, J.H.L.; Song, B.; Wang, Q.J. A review of recent works on inclusions. Mech. Mater. 2013, 60, 144–158. [Google Scholar] [CrossRef]
- Gong, Y.; Shao, H.; Luo, J.; Li, Z. A deep transfer learning model for inclusion defect detection of aeronautics composite materials. Compos. Struct. 2020, 252, 112681. [Google Scholar] [CrossRef]
- Luo, N.; Xiao, S.; Wang, Z.; Liu, B. Influence of inclusion defects on bending properties and failure modes of composites. J. Phys. Conf. Ser. 2022, 2285, 12003. [Google Scholar] [CrossRef]
- Nsengiyumva, W.; Zhong, S.; Lin, J.; Zhang, Q.; Zhong, J.; Huang, Y. Advances, limitations and prospects of nondestructive testing and evaluation of thick composites and sandwich structures: A state-of-the-art review. Compos. Struct. 2021, 256, 112951. [Google Scholar] [CrossRef]
- Gholizadeh, S. A review of non-destructive testing methods of composite materials. Procedia Struct. Integr. 2016, 1, 50–57. [Google Scholar] [CrossRef]
- Naresh, K.; Khan, K.A.; Umer, R.; Cantwell, W.J. The use of X-ray computed tomography for design and process modeling of aerospace composites: A review. Mater Des. 2020, 190, 108553. [Google Scholar] [CrossRef]
- Yang, H.; Yang, L.; Yang, Z.; Shan, Y.; Gu, H.; Ma, J.; Zeng, X.; Tian, T.; Ma, S.; Wu, Z. Ultrasonic detection methods for mechanical characterization and damage diagnosis of advanced composite materials: A review. Compos. Struct. 2023, 324, 117554. [Google Scholar] [CrossRef]
- Ardebili, A.; Alaei, M.H. Non-destructive testing of delamination defects in GFRP patches using step heating thermography. NDT E Int. 2022, 128, 102617. [Google Scholar] [CrossRef]
- Stoik, C.D.; Bohn, M.J.; Blackshire, J.L. Nondestructive evaluation of aircraft composites using transmissive terahertz time domain spectroscopy. Opt. Express 2008, 16, 17039. [Google Scholar] [CrossRef]
- Redo-Sanchez, A.; Heshmat, B.; Aghasi, A.; Naqvi, S.; Zhang, M.; Romberg, J.; Raskar, R. Terahertz time-gated spectral imaging for content extraction through layered structures. Nat. Commun. 2016, 7, 12665. [Google Scholar] [CrossRef] [PubMed]
- Tu, W.; Zhong, S.; Shen, Y.; Incecik, A. Nondestructive testing of marine protective coatings using terahertz waves with stationary wavelet transform. Ocean. Eng. 2016, 111, 582–592. [Google Scholar] [CrossRef]
- Wang, Q.; Li, X.; Chang, T.; Hu, Q.; Yang, X. Terahertz spectroscopic study of aeronautical composite matrix resins with different dielectric properties. Optik 2018, 168, 101–111. [Google Scholar] [CrossRef]
- Dong, J.; Locquet, A.; Melis, M.; Citrin, D.S. Global mapping of stratigraphy of an old-master painting using sparsity-based terahertz reflectometry. Sci. Rep. 2017, 7, 15098. [Google Scholar] [CrossRef]
- Dong, J.; Locquet, A.; Citrin, D.S. Depth resolution enhancement of terahertz deconvolution by autoregressive spectral ex trapolation. Opt. Lett. 2017, 42, 1828. [Google Scholar] [CrossRef]
- Zhang, J.; Wang, J.; Han, X.; Cui, H.; Shi, C.; Zhang, J.; Shen, Y. Noncontact detection of Teflon inclusions in glass-fiber-reinforced polymer composites using terahertz imaging. Appl. Opt. Opt. Technol. Biomed. Opt. 2016, 55, 10215. [Google Scholar] [CrossRef]
- Wang, J.; Xu, T.; Zhang, L.; Chang, T.; Zhang, J.; Yan, S.; Cui, H. Nondestructive damage evaluation of composites based on terahertz and X-ray image fusion. NDT E Int. 2022, 127, 102616. [Google Scholar] [CrossRef]
- Wang, Q.; Li, X.; Chang, T.; Zhang, J.; Liu, L.; Zhou, H.; Bai, J. Nondestructive imaging of hidden defects in aircraft sandwich composites using terahertz time-domain spectroscopy. Infrared Phys. Technol. 2019, 97, 326–340. [Google Scholar] [CrossRef]
- Wang, J.; Zhang, J.; Chang, T.; Liu, L.; Cui, H. Terahertz nondestructive imaging for foreign object detection in glass fiber-reinforced polymer composite panels. Infrared Phys. Technol. 2019, 98, 36–44. [Google Scholar] [CrossRef]
- Jördens, C.; Scheller, M.; Wietzke, S.; Romeike, D.; Jansen, C.; Zentgraf, T.; Wiesauer, K.; Reisecker, V.; Koch, M. Terahertz spectroscopy to study the orientation of glass fibres in reinforced plastics. Compos. Sci. Technol. 2010, 70, 472–477. [Google Scholar] [CrossRef]
- Bretz, L.; Häfner, B.; Lanza, G. Non-destructive measurement of fiber mass content of glass fiber sheet molding compound using Terahertz radiation. Measurement 2021, 168, 108386. [Google Scholar] [CrossRef]
- Cruz, F.C.; Filho, E.F.S.; Albuquerque, M.C.S.; Silva, I.C.; Gouvêa, L.L. Efficient feature selection for neural network-based detection of flaws in steel welded joints using ultrasound testing. Ultrasonics 2017, 73, 1–8. [Google Scholar] [CrossRef]
- Meng, M.; Chua, Y.J.; Wouterson, E.; Ong, C.P.K. Ultrasonic signal classification and imaging system for composite mate rials via deep convolutional neural networks. Neurocomputing 2017, 257, 128–135. [Google Scholar] [CrossRef]
- Bang, H.; Park, S.; Jeon, H. Defect identification in composite materials via thermography and deep learning techniques. Compos. Struct. 2020, 246, 112405. [Google Scholar] [CrossRef]
- Duan, Y.; Liu, S.; Hu, C.; Hu, J.; Zhang, H.; Yan, Y.; Tao, N.; Zhang, C.; Maldague, X.; Fang, Q.; et al. Automated defect classification in infrared thermography based on a neural network. NDT E Int. 2019, 107, 102147. [Google Scholar] [CrossRef]
- Rogala, T.; Przystałka, P.; Katunin, A. Damage classification in composite structures based on X-ray computed tomography scans using features evaluation and deep neural networks. Procedia Struct. Integr. 2022, 37, 187–194. [Google Scholar] [CrossRef]
- Ji, D.; Lin, J.; Gao, F. Deep LSTM-based autoencoder for CFRP damage imaging using Lamb wave and correlation factor weighted delay-and-sum algorithm. J. Phys. Conf. Ser. 2024, 2762, 12071. [Google Scholar] [CrossRef]
- Li, S.; Xie, J.; Wang, X.; Ge, F. Prediction of the creeping of AFC based on fuzzy reasoning and Bi-LSTM fusion iteration. Artif. Intell. Rev. 2024, 57, 142. [Google Scholar] [CrossRef]
- Mohammed Alsumaidaee, Y.A.; Yaw, C.T.; Koh, S.P.; Tiong, S.K.; Chen, C.P.; Yusaf, T.; Abdalla, A.N.; Ali, K.; Raj, A.A. Detection of Corona Faults in Switchgear by Using 1D-CNN, LSTM, and 1D-CNN-LSTM Methods. Sensors 2023, 23, 3108. [Google Scholar] [CrossRef] [PubMed]
Disclaimer/Publisher’s Note: The statements, opinions and data contained in all publications are solely those of the individual author(s) and contributor(s) and not of MDPI and/or the editor(s). MDPI and/or the editor(s) disclaim responsibility for any injury to people or property resulting from any ideas, methods, instructions or products referred to in the content. |
© 2025 by the authors. Licensee MDPI, Basel, Switzerland. This article is an open access article distributed under the terms and conditions of the Creative Commons Attribution (CC BY) license (https://creativecommons.org/licenses/by/4.0/).