Abstract
This paper presents a combined theoretical and experimental method for noise suppression in the repetition frequency (fr) locking of erbium-doped fiber optical frequency combs (OFCs). This study proposed a novel mathematical model to bridge the noise relationship of fr between the free-running and locked modes, and analyzed this relationship from two perspectives: the additional phase noise and the frequency stability. In addition, to integrate theoretical modeling with experimental validation, this study designed fr locking strategy that uses a phase-locked loop (PLL) with PFD + PIID (a phase frequency detector and a proportional, first-order integer, second-order integer, first-order differential controller). Under synchronization of the fr with a microwave reference (REF), this study achieved OFC additional frequency stabilities of 2.81 × 10⁻¹⁵@1 s and 8.08 × 10⁻¹⁹@10,000 s at 200 MHz fundamental frequency locking and 4.25 × 10⁻¹⁶@1 s and 1.91 × 10⁻¹⁹@10,000 s at 1200 MHz harmonic locking. The simulated and experimental results are in good agreement, confirming the consistency of the theoretical model and experiment. This work provides a reliable theoretical model that can be used to predict stability for OFC locking and significantly improves the additional frequency stability of OFCs.
1. Introduction
Since their groundbreaking realization in 2000 [1], optical frequency combs (OFCs) have demonstrated significant potential in various applications [2], including precision frequency measurement [3,4], time-frequency transfer [5,6,7,8], and optical frequency conversion [9,10]. These applications exploit the distinctive comb-like spectral properties of OFC, where each radio frequency (RF) or optical spectral line follows the formula fn = fceo ± nfr ± fbeat (with n being the comb tooth order, fceo the carrier-envelope offset frequency, fr the repetition frequency, and fbeat the beat frequency) [11,12]. This attribute facilitates precise conversion between the RF and optical frequencies, with the precision heavily contingent upon the frequency stability of the OFCs. Therefore, enhancing the frequency stability is essential for accurate and reliable measurements, transfers, and conversions, directly impacting the precision and dependability of these applications. Improving the frequency stability of OFCs remains a key focus in ongoing research and technological advancements. The frequency stability of OFCs is typically achieved by synchronization with external microwave or optical references through a phase-locked loop (PLL). Optical references offer stability at 1 s from the 10−15 to 10−18 level and long-term stability at 1000 s to 10,000 s from the 10−17 to 10−20 level [10,11,13,14,15,16,17,18,19,20], whereas microwave references offer a stability range from the 10−12 to 10−14 level and long-term stability at the 1000 s to 10,000 s from the 10−15 to 10−17 level [11,13,14,21,22]. The high stability of the optical reference is essentially achieved by amplifying the phase gain through harmonic locking, where the phase gain for harmonics is nu/φ (u is the output voltage of the phase detector, φ is the phase difference between the reference and the OFCs, and the phase gain for the fundamental frequency is u/φ). Similarly, the frequency stability of OFCs utilizing a microwave reference source (REF) can also be enhanced by employing higher-order harmonic locking [8,11,14,22,23]. However, higher-order harmonic locking causes the system’s phase control range to decrease by a factor of n, leading to a reduction in the system’s anti-interference capability. Therefore, despite existing methods, effective strategies to further improve OFC frequency stability are limited.
This paper applies “First-Principles Thinking” to deconstruct and redesign the OFC frequency locking system, identifying key factors influencing stability. To achieve this, the system is initially broken down into independent components: the OFCs, the phase frequency detector (PFD), the phase error controller, and the REF. Based on the fundamental characteristics of these components, this study developed mathematical models that describe their behavior. Through an analysis of phase noise suppression factor (PSF) and stability suppression factor (SSF) in the Laplace domain, this study proposes a comprehensive mathematical model that uses measurable system noise as input to simulate the additional phase noise and stability of the OFC repetition frequency. Additionally, the derived PSF and SSF characterize the OFC noise suppression performance. By utilizing experimental and simulated results, the model and system design were iteratively optimized, significantly improving the repetition frequency stability of the OFCs. To enhance the frequency stability and noise suppression capabilities of existing OFC systems, this study ultimately devises a PLL frequency locking system based on a PFD + PIID (proportional, first-order integral, second-order integral, first-order differential phase error controller). The PFD provides a wide phase detection range of (−2π, 2π), which is four times greater than that of multiplier (e.g., mixer) and twice that of phase detectors [13,14,19,24], significantly expanding the phase detection range and improving the signal-to-noise ratio (SNR). Moreover, the PFD has low noise and excellent frequency response linearity, enabling more accurate phase change detection and more effective suppression of OFC noise.
The experimental results validate the mathematical models and system design. Over a 1 s measurement period, this study achieved OFC additional frequency stabilities of 2.81 × 10⁻¹⁵ at a fundamental frequency locking of 200 MHz and 4.25 × 10⁻¹⁶ at a harmonic locking of 1200 MHz. Over a 10,000 s measurement period, this study achieved additional frequency stabilities of 8.08 × 10⁻¹⁹ at 200 MHz and 1.91 × 10⁻¹⁹ at 1200 MHz. Compared with existing locking strategies, the stability is improved significantly, and the noise suppression effect was significantly enhanced. These experimental results are consistent with the theoretical predictions of the mathematical model, confirming the reliability of the proposed model in analyzing OFC locking. This research provides valuable guidance for optimizing OFC frequency locking strategies by reducing noise and improving stability, thereby enhancing the precision and reliability of OFCs and supporting broader and more precise applications in scientific and industrial fields, including but not limited to optical frequency measurement, time-frequency transfer, and optical frequency conversion.
2. Theoretical Model and Experimental Implement
2.1. Theoretical Model
As depicted in Figure 1a, the system in this study adopts a PFD + PIID locking strategy: The PFD converts the phase difference between fr and the reference signal REF into a voltage signal representing the phase error. In the PIID phase error controller, the proportional component offers rapid phase error correction; the first-order integrator mitigates the residual steady-state error of the proportional component; the second-order integrator further reduces the residual error of the first-order integrator, enhancing the locking precision; and the first-order differential component enhances the dynamic response speed and suppresses high-frequency oscillation interference. As depicted in Figure 1b, the principle of OFCs can be referred to our previous work [20]. The PLL composed of PFD, PIID, and OFC forms the locking strategy of this paper. As shown in the Figure 2, it presents the experimental method for collecting data required for theoretical simulation.
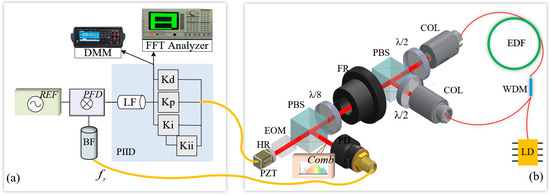
Figure 1.
Schematic diagram of the experimental setup: (a) repetition frequency locking system, DMM, digit multimeter; FFT analyzer, dynamic signal analyzer; BF, bandpass filter, whose center frequency of the passband is the locking frequency; REF, microwave reference source; PFD, phase frequency detector; LF, loop filter; Kp, proportional gain; Ki, first-order integral gain; Kii, second-order integral gain; Kd, first-order differential gain; (b) Er-fiber mode-locked laser that generates OFCs: PZT, piezoelectric actuator; HR, high reflector; EOM, electro-optic modulator; PBS, polarizing beam splitter cube; PD, photodetector; λ/8, eighth-wave plate; FR, Faraday rotator; λ/2, half-wave plate; Col, fiber collimator; EDF, Er-doped fiber; WDM, 980 nm/1550 nm wavelength division multiplexer; LD, laser diode; Comb, optical output signal of OFCs.
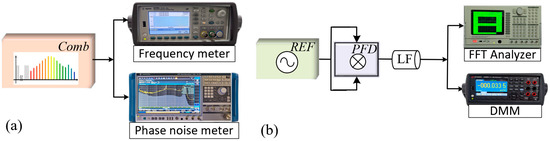
Figure 2.
Schematic diagram of the background noise measurement method: (a) OFC background noise, frequency meter (53230A, KEYSIGHT, Santa Rosa, CA, USA), and phase noise meter (FSWP, Rohde & Schwarz, Munich, Germany). (b) PFD background noise, REF (SMA100B Rohde & Schwarz, Munich, Germany).
2.1.1. Model of Additional Phase Noise and Frequency Stability
The background phase noise SFree(f) of the OFCs and the equivalent background phase noise SPDF(f) of the PFD in free-running mode can be obtained experimentally. Since SFree(f) and SPDF(f) are statistically independent, the result of the superposition of both phase noises is the direct sum. Therefore, according to Formulas (A7) and (A8) in Appendix A, the phase noise SLocked(f) of OFCs in locked mode can be obtained as
The equivalent impact of the PFD background voltage noise on the phase noise of OFCs is denoted as SPDF(f) (the equivalent background phase noise of the PFD), and Sother(f) is defined as the equivalent impact of other circuit noise. The derivation of T can be found in Appendix A.1.
After phase noise enters the locked loop, it is suppressed by PSF T2(f). Since the influences of the voltage noise of the PFD and other circuits are negligible compared with SFree(f), as SFree(f) >> (SPDF(f) + Sother(f)), in the calculation of SLocked (f), SPDF(f) and Sother(f) can be neglected. Therefore, the following relationship holds
Substitute Formula (2) into the relationship formula between Allan variance and phase noise [25]. The resulting relationship is obtained as
where is the Allan variance of OFCs in locked mode, and where τ is the sampling time interval.
According to the noise model of a mode-locked laser [25,26], the theoretical trend coincides with the measured trend, as illustrated by the curve “free comb” in Figure 3a. Thus, SFree(f) decreases rapidly with increasing frequency offset f [25,26,27]. Moreover, because the period of f in sin4(πfτ) is 1/τ, it is a function that approximates a comb, thus, it can be approximated as sampling T2 at intervals of Δf = 1/τ. Therefore, in Formula (3), the limits of integration can be approximated as (0, 1/τ). Meanwhile T2 is a monotonically increasing function, as illustrated by the curves T2 in Figure 3, therefore, according to the integral mean value theorem, the upper bound of can be approximated as
where is the additional frequency stability of the OFCs in locked mode, and where is the frequency stability of the OFCs in free-running mode. As illustrated by the curve T in the Figure 3c, the SSF is defined as , and SSF characterizes the ability of the locking system to suppress the noise represented by frequency stability of the OFCs in free-running mode.
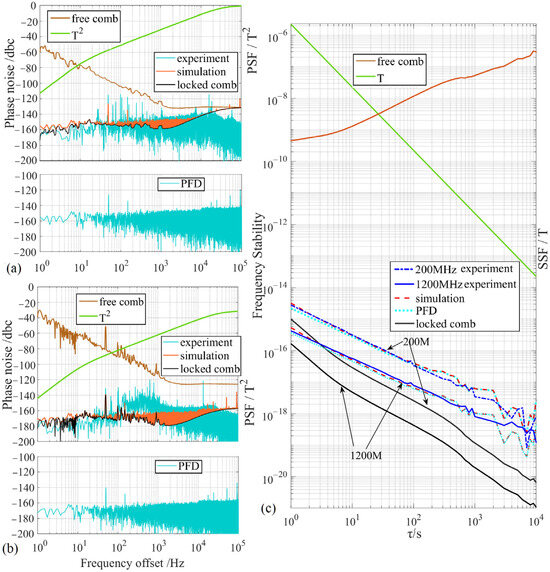
Figure 3.
Experimental and simulated results: (a) additional phase noise at 200 MHz fundamental frequency locking; (b) additional phase noise at 1200 MHz harmonic locking; (c) additional frequency stability at fundamental and harmonic locking. PFD, equivalent background noise SPFD(f) and of PFD; experiment, experimental result of Soverall(f) and ; simulation, simulation results of Soverall(f) and ; locked comb, SLocked(f) and in locked mode; free comb, SFree(f) and in the free-running mode; T2, phase noise suppression factor (PSF); T, frequency stability suppression factor (SSF).
The background voltage noise of the PFD also affects the phase noise and frequency stability of the OFCs in locked mode, meaning that the PFD’s voltage noise is converted into the corresponding equivalent background phase noise SPDF(f) for the OFCs. Because the background noise of PFD is persistent, and not reduced by suppression of the locking system, the SPDF(f) is directly measured by the DMM and FFT analyzer. Since SLocked(f) and SPDF(f) are statistically independent, the result of the superposition of the two phase noises is the direct sum. Therefore, the overall additional phase noise of the OFCs in locked mode is obtained as
By substituting Formula (5) into the relationship formula between the Allan variance and phase noise [25,28], the overall additional frequency stability of the OFCs in locked mode can be obtained as
where is the equivalent background frequency stability of the PFD.
2.1.2. Model of the n-th Harmonic Locking
The frequency of the n-th harmonic is n times the fundamental frequency, and the phase variation is also amplified by n times. While G(s) >> 1, therefore, the phase error transfer function Rn(s) representing the output of the PFD can be approximated as [24]
Thus, the additional phase noise in the n-th harmonic locking is obtained as
The additional frequency stability of the n-th harmonic locking is obtained as
Finally, this section derives the theoretical model of OFCs in the free-running mode, that is, the mathematical relationships (Formulas (5) and (6)) between the background noise of OFC, and the PFD in the free-running mode and the additional phase noise or frequency stability of the fr in locked mode. In addition, this model is extended to the noise model of OFCs in the harmonic locked mode (Formulas (8) and (9)). The theoretical model analysis in this section provides positive guidance for frequency locking strategies in experimental design. By iteratively optimizing the locking strategies of system through simulation and experimentation, the noise performance of OFCs has been improved, providing a theoretical basis for this improvement.
2.2. Experimental Implement
Figure 1 depicts the experimental setup for the fr locking of OFC. As depicted in Figure 1b, this paper utilized an Er-fiber femtosecond laser, which is based on the mode-locking mechanism of a nonlinear amplification loop mirror (NALM). The EOM in Figure 1b is used for locking with the optical frequency reference, but it is not employed in the locking process with the microwave reference, which is why it is not connected in the diagram. More details on this can be found in our previous work [20]. The fundamental repetition frequency fr of the OFCs is 200 MHz. Figure 1a illustrates the fr locking system. The fr from a PD of the OFCs and the REF were fed back into the PFD and LF, which generated phase error. The phase error is modulated by the PIID controller and then applied to the OFCs to adjust fr. The fr of the OFCs is fed back to the PFD through the BF, where it is phase-compared with the REF, forming a PLL. The DMM is the Truevolt 34461A(KEYSIGHT, Santa Rosa, CA, USA), which is employed to measure the PFD output voltage Vout. The calculations related to Vout and other experimental data are referred to Appendix A.2.
To analyze the phase noise and frequency stability of fr, this study employs a combined experimental–computational approach based on the theoretical model established in preceding section, with the method illustrated in Figure 2, through the experimental and computational steps that follow:
Step 1: OFC background noise evaluation in the free-running mode
- Measured the OFC background phase noise SFree(f) utilizing a phase noise meter and the corresponding background frequency stability utilizing a frequency meter (Figure 2a);
- Simulated phase noise SLocked(f) and stability using Formulas (2) and (4) in the locked mode.
Step 2: PFD background noise evaluation
- Connected both PFD inputs to REF and measured the output voltage with a DMM (Figure 2b);
- Simulated the equivalent PFD background phase noise SPDF(f) and frequency stability via Formulas (A10)–(A12).
Step 3: Overall System noise simulation
- Combine SFree(f), , SPDF(f), and in Formulas (5)–(6) to simulated overall additional phase noise Soverall(f) and frequency stability ;
- For n-th harmonic locking, simulated the overall additional phase noise Sn-overall(f) and frequency stability via Formulas (8)–(9).
According to the steps outlined above, this paper ultimately enables the simulation of the additional phase noise and frequency stability of the OFC, based on its noise data in the free-running mode.
3. Experimental Results and Discussion
First, following the methodology detailed in the preceding section, this paper measured the background phase noise and corresponding frequency stability of the OFCs (Figure 3 “free comb”) and the PFD (Figure 3 “PFD”) in the free-running mode. The phase noise SFree(f) at the 1 Hz offset for the 200 MHz fundamental frequency (Figure 3a “free comb”) and the 1200 MHz harmonic (Figure 3b “free comb”) were measured to be −39.8 dBc/Hz and −60.3 dBc/Hz, respectively. The frequency stability was determined to be 4.50 × 10⁻¹⁰ at τ = 1 s (Figure 3c “free comb”). Uncertainties in the measurement results attributable to noise, the environment, equipment, and other interferences during the measurement process prevent the phase noise of the two systems from differing strictly by a factor of n2. As illustrated by the curve “free comb” in Figure 3c, the frequency stability increases with τ, primarily because temperature variations induce frequency drift in the OFCs. As illustrated by the curves “locked comb” in Figure 3, the simulated results SLocked(f) demonstrate the suppression of the OFC’s background noise SFree(f) (Figure 3 “free comb”) by the locking system, and the additional phase noise was −169.7 dBc/Hz at the 1 Hz offset for the 200 MHz fundamental frequency and the additional frequency stability was 1.01 × 10⁻¹⁵ at τ = 1 s.
As illustrated by the curves “PFD” in Figure 3, the equivalent background phase noise SPFD(f) was −154.8 dBc/Hz at the 1 Hz offset for the 200 MHz fundamental frequency and the equivalent frequency stability was 2.23 × 10⁻¹⁵ at τ = 1 s. This represents the equivalent impact of the PFD’s background noise on the phase noise and frequency stability when the input signal frequency is 200 MHz. The frequency distribution is relatively uniform, predominantly consisting of white noise.
As illustrated by the curves “simulation” in Figure 3, for the 200 MHz fundamental frequency locking, the simulated overall additional phase noise Soverall(f) at the 1 Hz offset was −154.8 dBc/Hz, and the simulated overall additional frequency stability was 3.23 × 10⁻¹⁵ at τ = 1 s and 2.73 × 10⁻¹⁸ at τ = 10,000 s. For the 1200 MHz harmonic locking, the simulated additional phase noise Sn-overall(f) at the 1 Hz offset was −170.4 dBc/Hz, and the simulated additional frequency stability was 5.39 × 10⁻¹⁶ at τ = 1 s and 4.55 × 10⁻¹⁹ at τ = 10,000 s. From the simulated results, for the system in this paper, it can be concluded that the impact of PFD noise on the measurement results is more significant.
Finally, utilizing the experimental setup depicted in Figure 1 and the methodology detailed in the preceding section, the experimental results of the curves “experiment” are presented in Figure 3. For the 200 MHz fundamental frequency locking, the overall additional phase noise at the 1 Hz offset was measured to be −168.7 dBc/Hz, and the overall additional frequency stability was 2.81 × 10⁻¹⁵ at τ = 1 s and 8.08 × 10⁻¹⁹ at τ = 10,000 s. For the 1200 MHz harmonic locking, the overall additional phase noise at the 1 Hz offset was measured to be −182.3 dBc/Hz, and the overall additional frequency stability was 4.25 × 10⁻¹⁶ at τ = 1 s and 1.91 × 10⁻¹⁹ at τ = 10,000 s. As shown in Table 1 and Table 2, compared with the commonly used Multiplier + PI (proportional–integral) locking strategies, employing a PFD + PIID achieves lower additional phase noise and improving frequency stability. Furthermore, for the n-th harmonic locking, the experimental results approximate a factor of 1/n compared to the fundamental frequency locking described in the preceding section.

Table 1.
Comparison of phase noise improvement.
Table 2.
Comparison of frequency stability improvement.
To validate the theoretical model and experimental methods presented in this paper, the simulated results were compared with the experimental results. As illustrated in Figure 3, the theoretical and experimental results are generally consistent. However, due to measurement noise introduced by factors such as the testing environment, equipment, and power supply, a slight discrepancy in the phase noise results remains. In contrast, the measurement of frequency stability benefits from the averaging of a large amount of data during the calculation process, which helps suppress measurement noise, resulting in better consistency between the simulated and experimental results.
4. Conclusions
In summary, this paper introduces a low-noise, high-stability frequency locking method for OFCs by employing a PFD + PIID as the phase error comparator and controller. This approach effectively suppresses the OFC noise and ensures synchronization with the REF, particularly in harmonic locking scenarios. This paper develops a theoretical model based on Laplace transforms and PLL feedback control principles to derive PSF and SSF, utilizing OFC noise in free-running mode as input to predict experimental results. A comparative analysis between the simulated and experimental results reveals good agreement, validating the proposed method and model. The analysis indicates that beyond higher harmonic locking, the keys to reducing OFC noise and improving frequency stability lie in the use of low-noise phase detection components and the design of the controller. Moreover, minimizing environmental interference and system noise through temperature control, vibration control, and other methods is crucial for reducing noise in free-running OFCs. Future work will focus on continuously optimizing the OFCs and locking system, further enhancing the frequency stability of OFCs by improving noise suppression capabilities, reducing background noise of OFCs, vibration isolation, and enhancing environmental stability. These advancements will broaden the applicability of OFC technology in precision frequency measurement, time–frequency transfer, and optical frequency conversion.
Author Contributions
Conceptualization, methodology, investigation, software, visualization, X.C.; resources, M.L.; resources, B.R.; resources, X.Y.; resources, Z.H.; supervision, R.D.; supervision, S.Z.; funding acquisition, project administration, P.Z. All authors have read and agreed to the published version of the manuscript.
Funding
This research was funded by the Quantum Control and Quantum Information of the National Key Research and Development Program of China, grant number 2020YFA0309800; the Strategic Priority Research Program of the Chinese Academy of Sciences, grant number XDB35030101; and the Innovation Program for Quantum Science and Technology, grant number 2021ZD0300903.
Institutional Review Board Statement
Not applicable.
Informed Consent Statement
Not applicable.
Data Availability Statement
The original contributions presented in this study are included in the article. Further inquiries can be directed to the corresponding author.
Conflicts of Interest
The funders had no role in the design of the study; in the collection, analyses, or interpretation of data; in the writing of the manuscript; or in the decision to publish the results.
Abbreviations
The following abbreviations are used in this manuscript:
| OFCs | Optical frequency combs |
| PLL | Phase-locked loop |
| PFD | Phase frequency detector |
| PIID | A phase frequency detector and a proportional, first-order integer, second-order integer, first-order differential controller |
| PSF | Phase noise suppression factor |
| SSF | Stability suppression factor |
| REF | Radio frequency |
| RF | Microwave reference |
| SNR | Signal-to-noise ratio |
| NALM | Nonlinear amplification loop mirror |
Appendix A
Appendix A.1
As depicted in Figure 1b, the repetition frequency fr of OFCs is influenced by the cavity length L (optical path) of the mode-locked laser [29]. The relationship can be expressed as fr = c/(L0 + ΔL). Because L0 >> ΔL (the PZT drive voltage u induces a cavity length change of ΔL = KL u), the following approximation can be expressed as
where the initial cavity length L0 (optical path), the speed of light c, and the coefficient of PZT length variation KL. Thus, let , the frequency difference Δfr between fr and REF, which is the derivative of φ(t) [28]
Let the Laplace transform be , ( is the Laplace transform operator). By performing the Laplace transform on Formula (A2), the transfer function between the phase output φ(t) of the fr and the drive voltage u(t) can be expressed as
where s is the complex variable in the Laplace transform, where s = γ + j2πf, γ is the damping coefficient, f is the offset from the center frequency of fr, and j is the imaginary unit.
As depicted in Figure 1a, the PFD converts the phase difference between fr and REF into a voltage signal of phase error. In the PIID phase error controller, the proportional component offers rapid phase error correction; the first-order integrator mitigates the residual steady-state error of the proportional component; the second-order integrator further reduces the residual error of the first-order integrator, enhancing the locking precision; and the first-order differential component enhances the dynamic response speed and suppresses high-frequency oscillation interference.
The transfer function of PFD is given as D(s) = KD (where KD is PFD voltage gain coefficient and is a constant for PFD). The transfer function of the PFD + PIID controller is P(s) = (sKd + Kp + Ki/s + Kii/s2). Consequently, the open-loop transfer function of the entire system can be expressed as
Kp is the proportional gain, Ki is the first-order integral gain, Kii is the second-order integral gain, Kd is the first-order differential gain, and KD is the PFD voltage gain.
The close-loop phase error transfer function can be expressed as [24]
As illustrated in Figure A1, the phase output signal UOFC of the fr is fed back to the PFD and compared with the phase signal UREF of the REF, forming a closed loop. The phase error signal E(s) adjusts the OFC output fr continuously, locking fr to the REF.
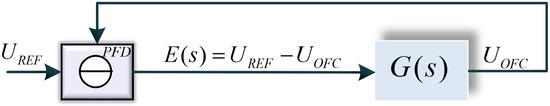
Figure A1.
Schematic diagram of the mathematical model of the OFC locking system: UREF, phase of REF in the Laplace domain; UOFC, phase of fr in the Laplace domain; E(s), phase error signal in the Laplace domain; G(s), transfer function of the OFCs and locking system.
In free-running mode, the phase noise F(s) of fr is the relative difference between UREF and UOFC, as F(s) + UOFC = UREF. In the locked mode, as (t is time after locking), UOFC has been stabilized and is independent of s. By applying the final value theorem [24] and Formula (A5), the phase error signal e(t) in the time domain can be expressed as
Therefore, when the OFCs are locked, as t→∞, that is, at steady state [24], the relationship between E(s) and F(s) is expressed as
As this paper discusses the OFC locking system’s frequency response, s is substituted by s = j2πf [24]. By utilizing Formula (A5), as illustrated by the curves T2 in Figure 3, the PSF T2(f) is defined as
This establishes the relationship between the phase noise F(s) in free-running mode and the phase error E(s) in locked mode. The PSF T2(f) characterizes the locking system’s ability to suppress the phase noise of the OFCs in free-running mode.
Appendix A.2
The PFD output voltage Vout is obtained as
To evaluate the frequency stability, first, the frequency fluctuation y is calculated via the following formula [28]
where fr represents the fundamental frequency, ΔVout is the differential of Vout, and Δt is the differential of t. Next, the additional frequency stability is obtained utilizing the Allan variance formula [28].
The FFT analyzer used was the Stanford Research Systems SR785, which measured the voltage power spectral density SVout(f). The phase noise distribution is [28]
Substitute into the following formula to obtain the additional phase noise distribution in logarithmic coordinates [28]
As illustrated by the curves “experiment” in Figure 3, the experimental results of additional phase noise and frequency stability had been obtained.
References
- Niering, M.; Holzwarth, R.; Reichert, J.; Pokasov, P.; Udem, T.; Weitz, M.; Hänsch, T.W.; Lemonde, P.; Santarelli, G.; Abgrall, M.; et al. Measurement of the Hydrogen 1s–2s Transition Frequency by Phase Coherent Comparison with a Microwave Cesium Fountain Clock. Phys. Rev. Lett. 2000, 84, 5496–5499. [Google Scholar] [CrossRef] [PubMed]
- Fortier, T.; Baumann, E. 20 years of developments in optical frequency comb technology and applications. Commun. Phys. 2019, 2, 153. [Google Scholar] [CrossRef]
- Zheng, X.; Sun, Y.R.; Chen, J.J.; Jiang, W.; Pachucki, K.; Hu, S.M. Measurement of the Frequency of the 23S-23P Transition of 4He. Phys. Rev. Lett. 2017, 119, 263002. [Google Scholar] [CrossRef] [PubMed]
- Picqué, N.; Hänsch, T.W. Frequency comb spectroscopy. Nat. Photonics 2019, 13, 146–157. [Google Scholar] [CrossRef]
- Lu, H.; Li, Z.; Wang, J.; Meng, H.; Zhao, J. Two-Way Optical Time and Frequency Transfer Over a 20-km Fiber Link Based on Optical Frequency Combs. IEEE Photonics J. 2019, 11, 1–7. [Google Scholar] [CrossRef]
- Shen, Q.; Guan, J.-Y.; Zeng, T.; Lu, Q.-M.; Huang, L.; Cao, Y.; Chen, J.-P.; Tao, T.-Q.; Wu, J.-C.; Hou, L.; et al. Experimental simulation of time and frequency transfer via an optical satellite–ground link at 10-18 instability. Optica 2021, 8, 471–476. [Google Scholar] [CrossRef]
- Jung, K.; Kim, J. Subfemtosecond synchronization of microwave oscillators with mode-locked Er-fiber lasers. Opt. Lett. 2012, 37, 2958–2960. [Google Scholar] [CrossRef] [PubMed]
- Chen, Z.; Yu, D.; Lu, G.; Zhang, Y.; Yu, S.; Luo, B.; Guo, H. Dual-comb-enhanced microwave clock synchronization over commercial fiber. Optica 2024, 11, 1268–1276. [Google Scholar] [CrossRef]
- Bahmanian, M.; Scheytt, J.C. A 2–20-GHz Ultralow Phase Noise Signal Source Using a Microwave Oscillator Locked to a Mode-Locked Laser. IEEE Trans. Microw. Theory Tech. 2021, 69, 1635–1645. [Google Scholar] [CrossRef]
- Yan, L.; Zhao, W.; Zhang, Y.; Zhang, P.; Zhao, C.; Zhang, X.; Guo, W.; Zhang, S.; Jiang, H. Ultra-Stable Microwave Signal Generation with Er: Fiber-Based Optical Frequency Comb. In Proceedings of the 2019 Joint Conference of the IEEE International Frequency Control Symposium and European Frequency and Time Forum (EFTF/IFC), Orlando, FL, USA, 14–18 April 2019; pp. 1–3. [Google Scholar]
- Heinecke, D.C.; Bartels, A.; Fortier, T.M.; Braje, D.A.; Hollberg, L.; Diddams, S.A. Optical frequency stabilization of a 10 GHz Ti:sapphire frequency comb by saturated absorption spectroscopy inr87ubidium. Phys. Rev. A 2009, 80, 053806. [Google Scholar] [CrossRef]
- Minamikawa, T.; Hayashi, K.; Mizuguchi, T.; Hsieh, Y.-D.; Abdelsalam, D.G.; Mizutani, Y.; Yamamoto, H.; Iwata, T.; Yasui, T. Real-Time Determination of Absolute Frequency in Continuous-Wave Terahertz Radiation with a Photocarrier Terahertz Frequency Comb Induced by an Unstabilized Femtosecond Laser. J. Infrared Millim. Terahertz Waves 2016, 37, 473–485. [Google Scholar] [CrossRef]
- Jun, Y.; Schnatz, H.; Hollberg, L.W. Optical frequency combs: From frequency metrology to optical phase control. IEEE J. Sel. Top. Quantum Electron. 2003, 9, 1041–1058. [Google Scholar] [CrossRef]
- Kim, K.; Diddams, S.A.; Westbrook, P.S.; Nicholson, J.W.; Feder, K.S. Improved stabilization of a 1.3 µm femtosecond optical frequency comb by use of a spectrally tailored continuum from a nonlinear fiber grating. Opt. Lett. 2006, 31, 277–279. [Google Scholar] [CrossRef] [PubMed]
- Leopardi, H.; Davila-Rodriguez, J.; Quinlan, F.; Olson, J.; Sherman, J.A.; Diddams, S.A.; Fortier, T.M. Single-branch Er:fiber frequency comb for precision optical metrology with 10−18 fractional instability. Optica 2017, 4, 879–885. [Google Scholar] [CrossRef]
- Ning, K.; Hou, L.; Fan, S.-T.; Yan, L.-L.; Zhang, Y.-Y.; Rao, B.-J.; Zhang, X.-F.; Zhang, S.-G.; Jiang, H.-F. An All-Polarization-Maintaining Multi-Branch Optical Frequency Comb for Highly Sensitive Cavity Ring-Down Spectroscopy. Chin. Phys. Lett. 2020, 37, 064202. [Google Scholar] [CrossRef]
- Pang, L.; Han, H.; Zhao, Z.; Liu, W.; Wei, Z. Ultra-stability Yb-doped fiber optical frequency comb with 2 × 10⁻¹⁸/s stability in-loop. Opt. Express 2016, 24, 28993–29000. [Google Scholar] [CrossRef] [PubMed]
- Shao, X.; Han, H.; Wang, H.; Ma, J.; Hu, Y.; Li, C.; Teng, H.; Chang, G.; Wang, B.; Wei, Z. High power optical frequency comb with 10−19 frequency instability. Opt. Express 2023, 31, 32813–32823. [Google Scholar] [CrossRef] [PubMed]
- Deng, Z.; Liu, Y.; Zhu, Z.; Luo, D.; Gu, C.; Zhou, L.; Xie, G.; Li, W. Ultra-precise optical phase-locking approach for ultralow noise frequency comb generation. Opt. Laser Technol. 2021, 138, 106906. [Google Scholar] [CrossRef]
- Zhang, P.; Zhang, Y.-Y.; Li, M.-K.; Rao, B.-J.; Yan, L.-L.; Chen, F.-X.; Zhang, X.-F.; Chen, Q.-F.; Jiang, H.-F.; Zhang, S.-G. All polarization-maintaining Er:fiber-based optical frequency comb for frequency comparison of optical clocks. Chin. Phys. B 2022, 31, 054210. [Google Scholar] [CrossRef]
- Briles, T.C.; Stone, J.R.; Drake, T.E.; Spencer, D.T.; Fredrick, C.; Li, Q.; Westly, D.; Ilic, B.R.; Srinivasan, K.; Diddams, S.A.; et al. Interlocking Kerr-microresonator frequency combs for microwave to optical synthesis. Opt. Lett. 2018, 43, 2933–2936. [Google Scholar] [CrossRef] [PubMed]
- Li, M.; Yang, X.; Rao, B.; Yan, L.; Chen, X.; Yuan, R.; Zhang, P.; Zhang, Y.; Liu, T. A low phase noise high power Er-fiber frequency comb synchronized to the hydrogen maser clock by harmonic phase locking. Front. Phys. 2023, 11, 1044842. [Google Scholar] [CrossRef]
- Fortier, T.M.; Kirchner, M.S.; Quinlan, F.; Taylor, J.; Bergquist, J.C.; Rosenband, T.; Lemke, N.; Ludlow, A.; Jiang, Y.; Oates, C.W.; et al. Generation of ultrastable microwaves via optical frequency division. Nat. Photonics 2011, 5, 425–429. [Google Scholar] [CrossRef]
- Best, R.E. Phase-Locked Loops: Design, Simulation, and Applications; McGraw-Hill Education: New York, NY, USA, 2003. [Google Scholar]
- Paschotta, R. Noise of mode-locked lasers (Part I): Numerical model. Appl. Phys. B 2004, 79, 153–162. [Google Scholar] [CrossRef]
- Sauvage, G. Phase Noise in Oscillators: A Mathematical Analysis of Leeson’s Model. IEEE Trans. Instrum. Meas. 1977, 26, 408–410. [Google Scholar] [CrossRef]
- Behzad, R. A Simple Model of Feedback Oscillator Noise Spectrum. In Monolithic Phase-Locked Loops and Clock Recovery Circuits: Theory and Design; IEEE: New York, NY, USA, 1996; pp. 180–181. [Google Scholar]
- Rubiola, E. Phase Noise and Frequency Stability in Oscillators; Cambridge University Press: Cambridge, UK, 2008. [Google Scholar]
- Tan, W.K.; Wong, H.-Y.; Kelly, A.E.; Sorel, M.; Marsh, J.H.; Bryce, A.C. Temperature Behaviour of Pulse Repetition Frequency in Passively Mode-Locked InGaAsP/InP Laser Diode—Experimental Results and Simple Model. IEEE J. Sel. Top. Quantum Electron. 2007, 13, 1209–1214. [Google Scholar] [CrossRef]
Disclaimer/Publisher’s Note: The statements, opinions and data contained in all publications are solely those of the individual author(s) and contributor(s) and not of MDPI and/or the editor(s). MDPI and/or the editor(s) disclaim responsibility for any injury to people or property resulting from any ideas, methods, instructions or products referred to in the content. |
© 2025 by the authors. Licensee MDPI, Basel, Switzerland. This article is an open access article distributed under the terms and conditions of the Creative Commons Attribution (CC BY) license (https://creativecommons.org/licenses/by/4.0/).