Error in Table 1
In the original publication, there was a mistake in Table 1 as published. In Table 1, we incorrectly used the symbols
µs and
µa to represent scattering efficiency and absorption efficiency, respectively. These symbols were already used in the text to denote the scattering coefficient and absorption coefficient, which could lead to confusion. We have corrected the symbol for scattering efficiency to
Qs and for absorption efficiency to
Qa. Additionally, we mistakenly labeled “Anisotropy Coefficient” as “Anisotropy Efficiency”. The corrected
Table 1 appears below. Furthermore, the following sentence regarding
Qs and
Qa was added at the end of Section 2.3:
“The scattering coefficient µs of polystyrene microspheres was calculated based on the scattering efficiency Qs determined using Mie scattering theory. The absorption of polystyrene microspheres was neglected because the absorption efficiency Qa = 0.0.”
Appendix B
The simulation presented in the published study was found to have the following issue: In this simulation, the scattering angle and the azimuthal angle of the scattering direction were determined based on random numbers. Since and are independent, separate random numbers should be used for their determination. However, the simulation inadvertently employed the same random number for both and . A corrected simulation, in which independent random numbers were appropriately assigned, was performed to re-estimate the absorbance of Sample M. The results revealed that the simulated absorbance values after correction were higher than those obtained from the original simulation. Nonetheless, the qualitative trend was preserved, whereby the absorbance of Sample M, which contained dispersed scatterers, was smaller than that of the non-scattering sample.
In response, we reviewed and revised the calculation methods for the input parameters of the simulation, namely the absorption coefficient , the scattering coefficient , and the anisotropy coefficient , as well as the distribution of the incident light specified in the simulation. These adjustments enabled the corrected simulation (the revised Monte Carlo simulation, hereafter referred to as revised MC) to reproduce the experimental results, thereby addressing the aforementioned issue. The primary modifications are given as follows:
(1) The calculation method for the absorption coefficient derived from the absorbance measurement results: In this paper, the absorption coefficient of Trypan Blue was obtained from the linear relationship between the absorbance and concentration measured using the configuration shown in Figure 1a. Specifically, the relationship (where and are positive real constants) was used to calculate . However, the intercept reflects losses due to the reflection during absorption measurements. Therefore, it is more appropriate to evaluate and as proportional (such that as ) by removing the influence of . In the revised MC, the corrected relationship and , which excludes the effect of reflection losses, was adopted as the true value.
(2) The parameter settings used to calculate the scattering coefficient and anisotropy coefficient of polystyrene spheres (PSs): In this paper, the scattering coefficient
and anisotropy coefficient
of the polystyrene spheres (PSs), which serve as scatterers, were determined through calculations based on Mie scattering theory using the refractive index and diameter of the PSs listed in
Table 1. In contrast, for the revised MC, the real part of the refractive index of the PSs used to calculate
and
was computed using the first term of the Sellmeier equation [39,48] to account for its wavelength dependence. Furthermore, although the nominal diameter of the PSs provided by the manufacturer was 500 nm, the mean diameter of the lot used was 510 nm, which was considered more appropriate. Therefore, the diameter of the PSs used to calculate
and
in the revised MC was set to 510 nm.
(3) Incident beam distribution: In the simulation described in this paper, the incident beam distribution was assumed to follow a two-dimensional Gaussian distribution. In contrast, the revised MC adopted a flat-top distribution, which more accurately reproduced the experimental results. The flat-top distribution refers to a uniform distribution within a specified rectangular range, with the distribution dropping to zero outside this range.
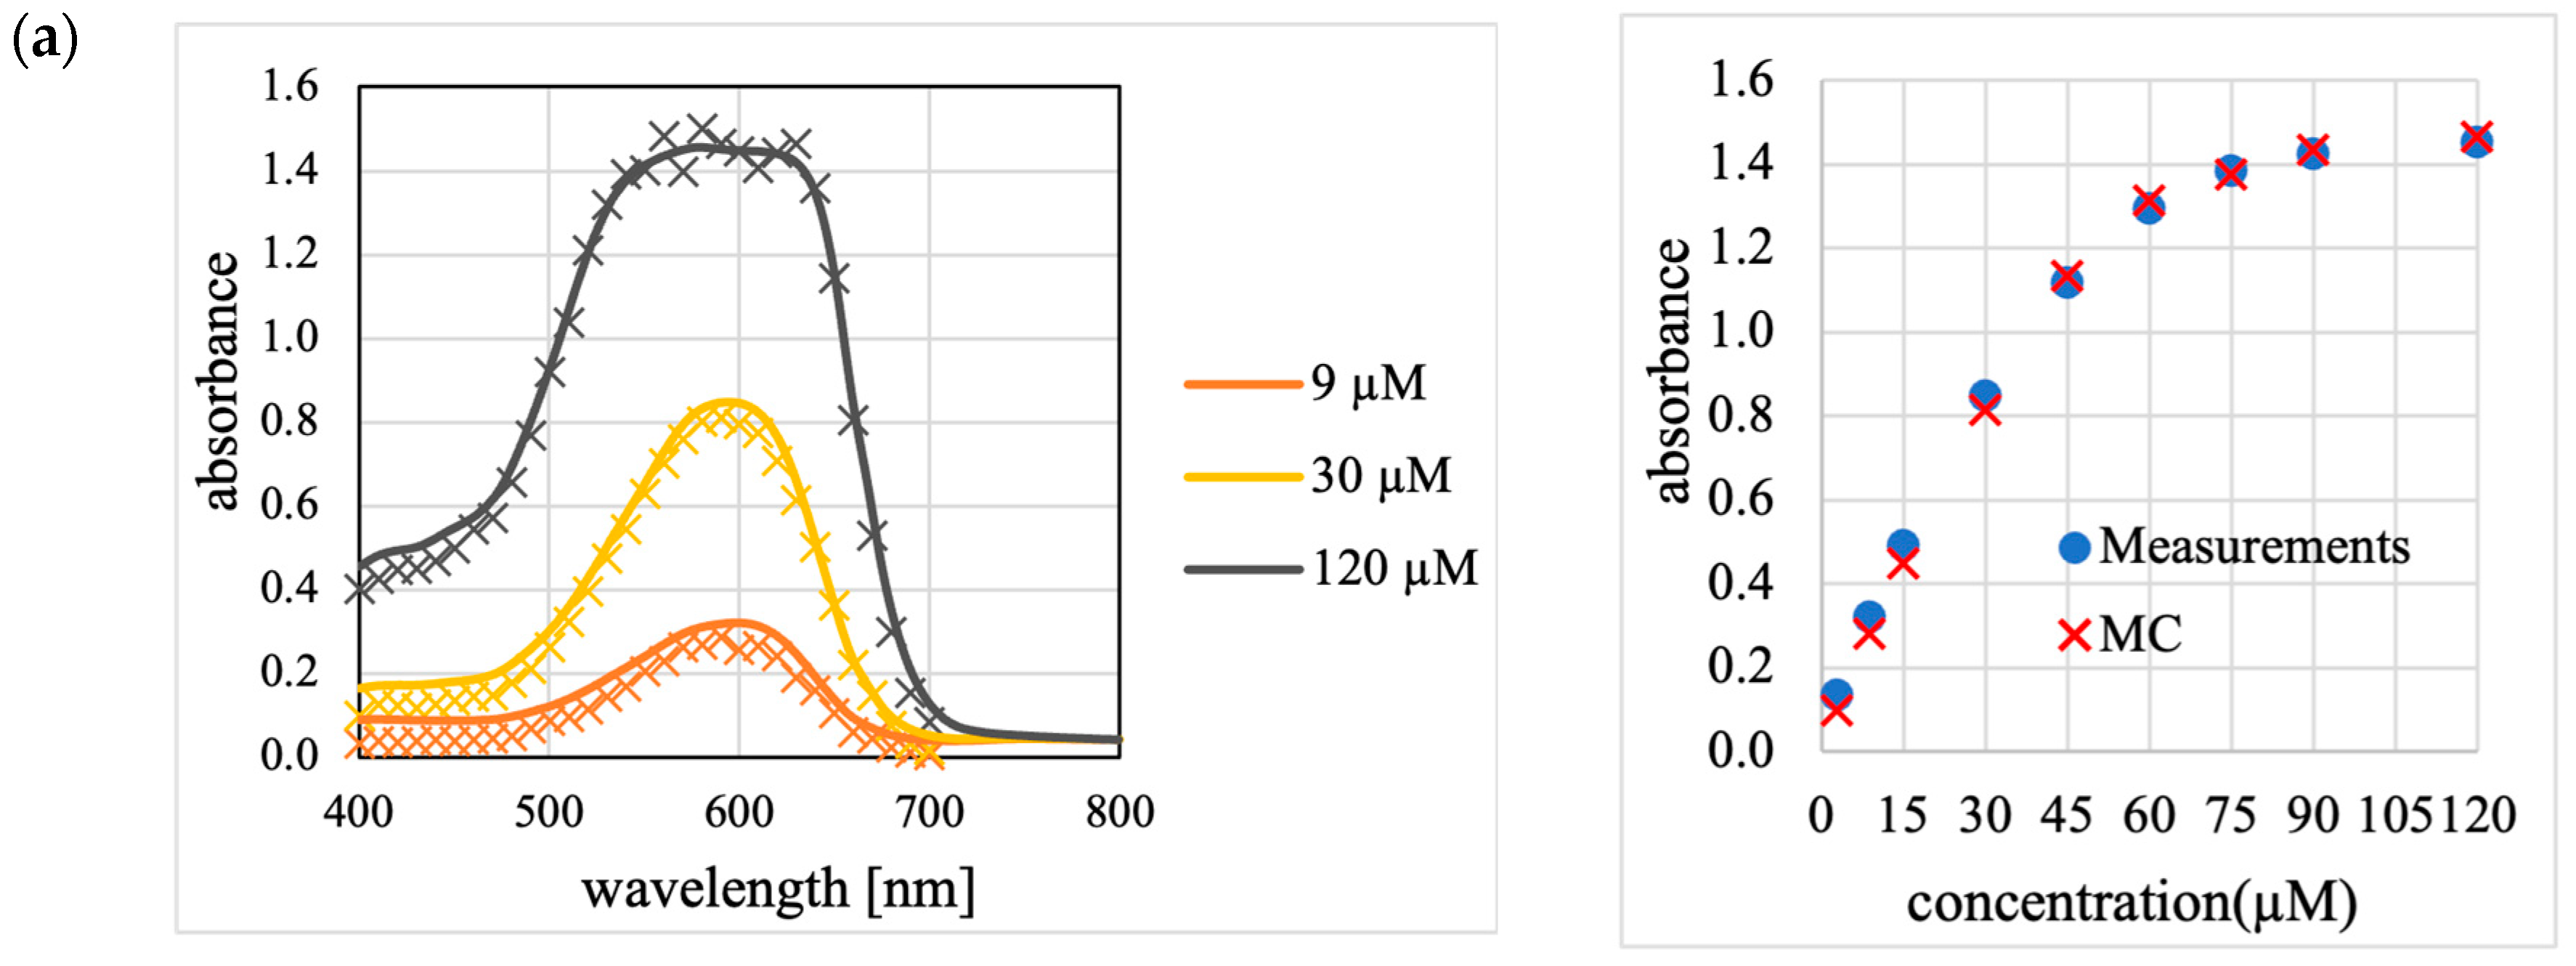
Figure A2 presents a reproduction of the absorbance measurement results of the aqueous Trypan Blue solution and Sample M (Figure 5) using the revised MC.
Figure A2.
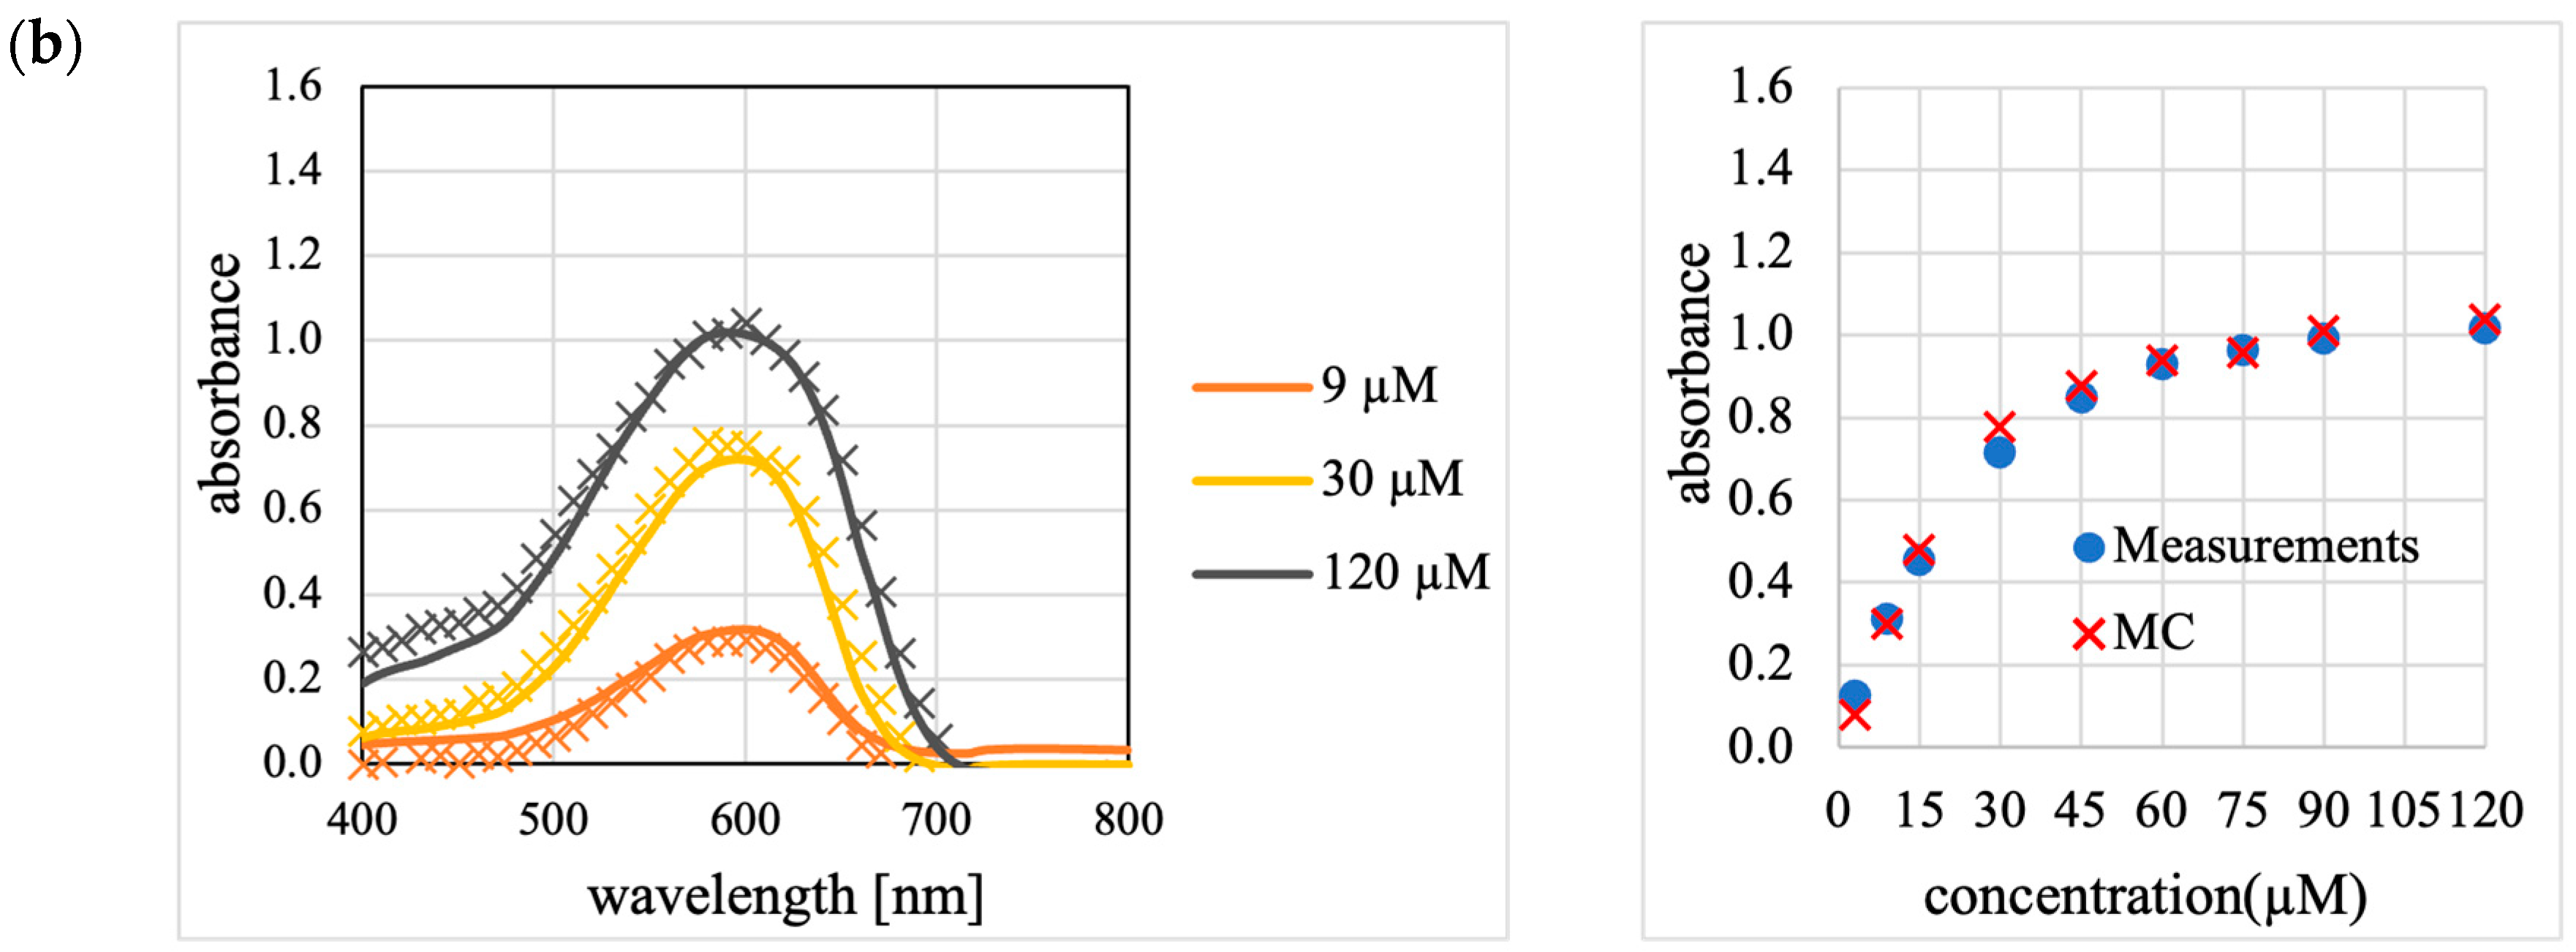
The absorbance of (a) the non-scattering Trypan Blue solution and (b) scattering Sample M, measured using the setup shown in Figure 2, as reproduced by the revised MC. This figure replaces the simulation results presented in Figure 6 with those from the revised MC. As shown in Figure 6, the left panels display the absorption spectra (solid lines represent the experimental results, and cross marks represent the revised MC results), while the right panels show the relationship between the concentration and absorbance at the absorption peak wavelength of 591 nm.
Figure A2.
The absorbance of (a) the non-scattering Trypan Blue solution and (b) scattering Sample M, measured using the setup shown in Figure 2, as reproduced by the revised MC. This figure replaces the simulation results presented in Figure 6 with those from the revised MC. As shown in Figure 6, the left panels display the absorption spectra (solid lines represent the experimental results, and cross marks represent the revised MC results), while the right panels show the relationship between the concentration and absorbance at the absorption peak wavelength of 591 nm.
References
With this correction, a reference has been added as follows:
48. Gienger, J.; Bär, M.; Neukammer, J. Extinction Spectra of Suspensions of Microspheres: Determination of the Spectral Refractive Index and Particle Size Distribution with Nanometer Accuracy. Appl. Opt. 2018, 57, 344–355.
The authors state that the scientific conclusions are unaffected. This correction was approved by the Academic Editor. The original publication has also been updated.


