Article

Improved Accuracy of the 3D Measurement Method Utilizing Differential Modulation Based on Multi-Color Channel Fusion

AVIC Cheng’du Aircraft Industrial (Group) Co., Ltd., Chengdu 610073, China
*
Author to whom correspondence should be addressed.
Photonics 2025, 12(3), 172; https://doi.org/10.3390/photonics12030172
Submission received: 4 January 2025 / Revised: 25 January 2025 / Accepted: 26 January 2025 / Published: 20 February 2025
(This article belongs to the Special Issue Recent Advances in Super-Resolution Optical Microscopy)

Abstract

:
The traditional structured light illumination measurement method usually utilizes peak detection and curve fitting to extract the target position of the modulation curve, while the modulation function is extremely insensitive to the variation of the peak position with height, which leads to the inability to further improve the measurement accuracy. Meanwhile, in the dual CCD detection system, there are problems such as signal matching, image matching, and difficult control of differential variables, which are also major difficulties and challenges. An improved-accuracy measurement method utilizing differential modulation based on multi-color channel fusion is proposed in this article, which adopts color CCD instead of black and white CCD in traditional measurement systems. By constructing a differential modulation measurement model and using the linear region with the highest slope of the differential modulation curve, the target position can be extracted based on the zero point localization method instead of the traditional peak localization method, which can successfully achieve further improvement in measurement accuracy. Simulation and experiments are carried out to verify the feasibility of the proposed method.

1. Introduction

The existing micro/nano-optical measurement approaches mainly include the laser confocal method, white light interferometry (WLI), digital holography technology, and structured illumination microscopy (SIM). Among them, the laser confocal method utilizes the intensity information of the light field to measure the topography of the object. It receives the signal only from the focal plane through pinhole filtering to realize the height mapping of the object pixels. The laser confocal method has extremely high longitudinal resolution, but it belongs to point measurement, which leads to a low efficiency [1,2]. Both white light interferometry (WLI) and digital holography technology are essentially interferometric techniques that use the phase information of the light field to detect the three-dimensional topography of objects with a measurement accuracy of nanometers. However, for the surface with excessive roughness and the structure with large curvature, they will fail because the effective interference fringe cannot be formed [3,4,5,6,7]. Structured illumination microscopy (SIM) utilizes the modulation information of the light field to realize 3D measurement. By projecting the sinusoidal grating fringe on the surface of the object to be measured, the three-dimensional detection is realized by using the principle that the modulation information of the fringe is sensitive to the change in the height of the object. This method has the characteristics of a large field of view measurement, high precision, high efficiency, and high adaptability, which is unique in the field of micro/nano measurement and has become a hot spot in the research field of micro/nano structure detection [8,9,10,11,12].
At present, in order to achieve 3D morphology recovery, the micro/nano 3D measurement method based on structured illumination mainly obtains the accurate focusing position of pixel points through peak detection and curve fitting. However, the vertical modulation response curve of pixel points is most gentle at the peak position, which has the lowest slope of the curve. The modulation value is the least sensitive to changes in object surface height near the peak position of the curve. Therefore, traditional peak localization methods are one of the key issues limiting the application of structured light illumination measurement methods in higher precision micro/nano detection fields. Traditional peak localization methods can no longer meet the increasing demand for measurement accuracy, and the peak value of the modulation curve is greatly affected by factors such as the measurement environment. One of the methods to solve this problem is to build a dual CCD detection system [13], which obtains two modulation degree curves with a certain degree of difference and constructs a differential modulation curve. The linear region with the highest slope of the differential modulation curve is used for zero point localization instead of traditional peak localization methods, achieving an improvement in localization accuracy and measurement accuracy. On the other hand, the dual CCD detection system unavoidably introduces new issues, such as signal matching, image matching, and difficulty in controlling differential quantities, which increases the complexity and cost of the measurement system [14,15].
An improved-accuracy measurement method utilizing differential modulation based on multi-color channel fusion is proposed in this article. By extracting multi-channel modulation information, a differential modulation curve is constructed, and target position extraction is further performed using zero point localization. This article first introduces the principle of a differential modulation measurement method based on color CCD, further analyzes the problem and solution of multi-channel color crosstalk, and finally proves the feasibility of this method through simulation and experimental verification.

2. Method Principle

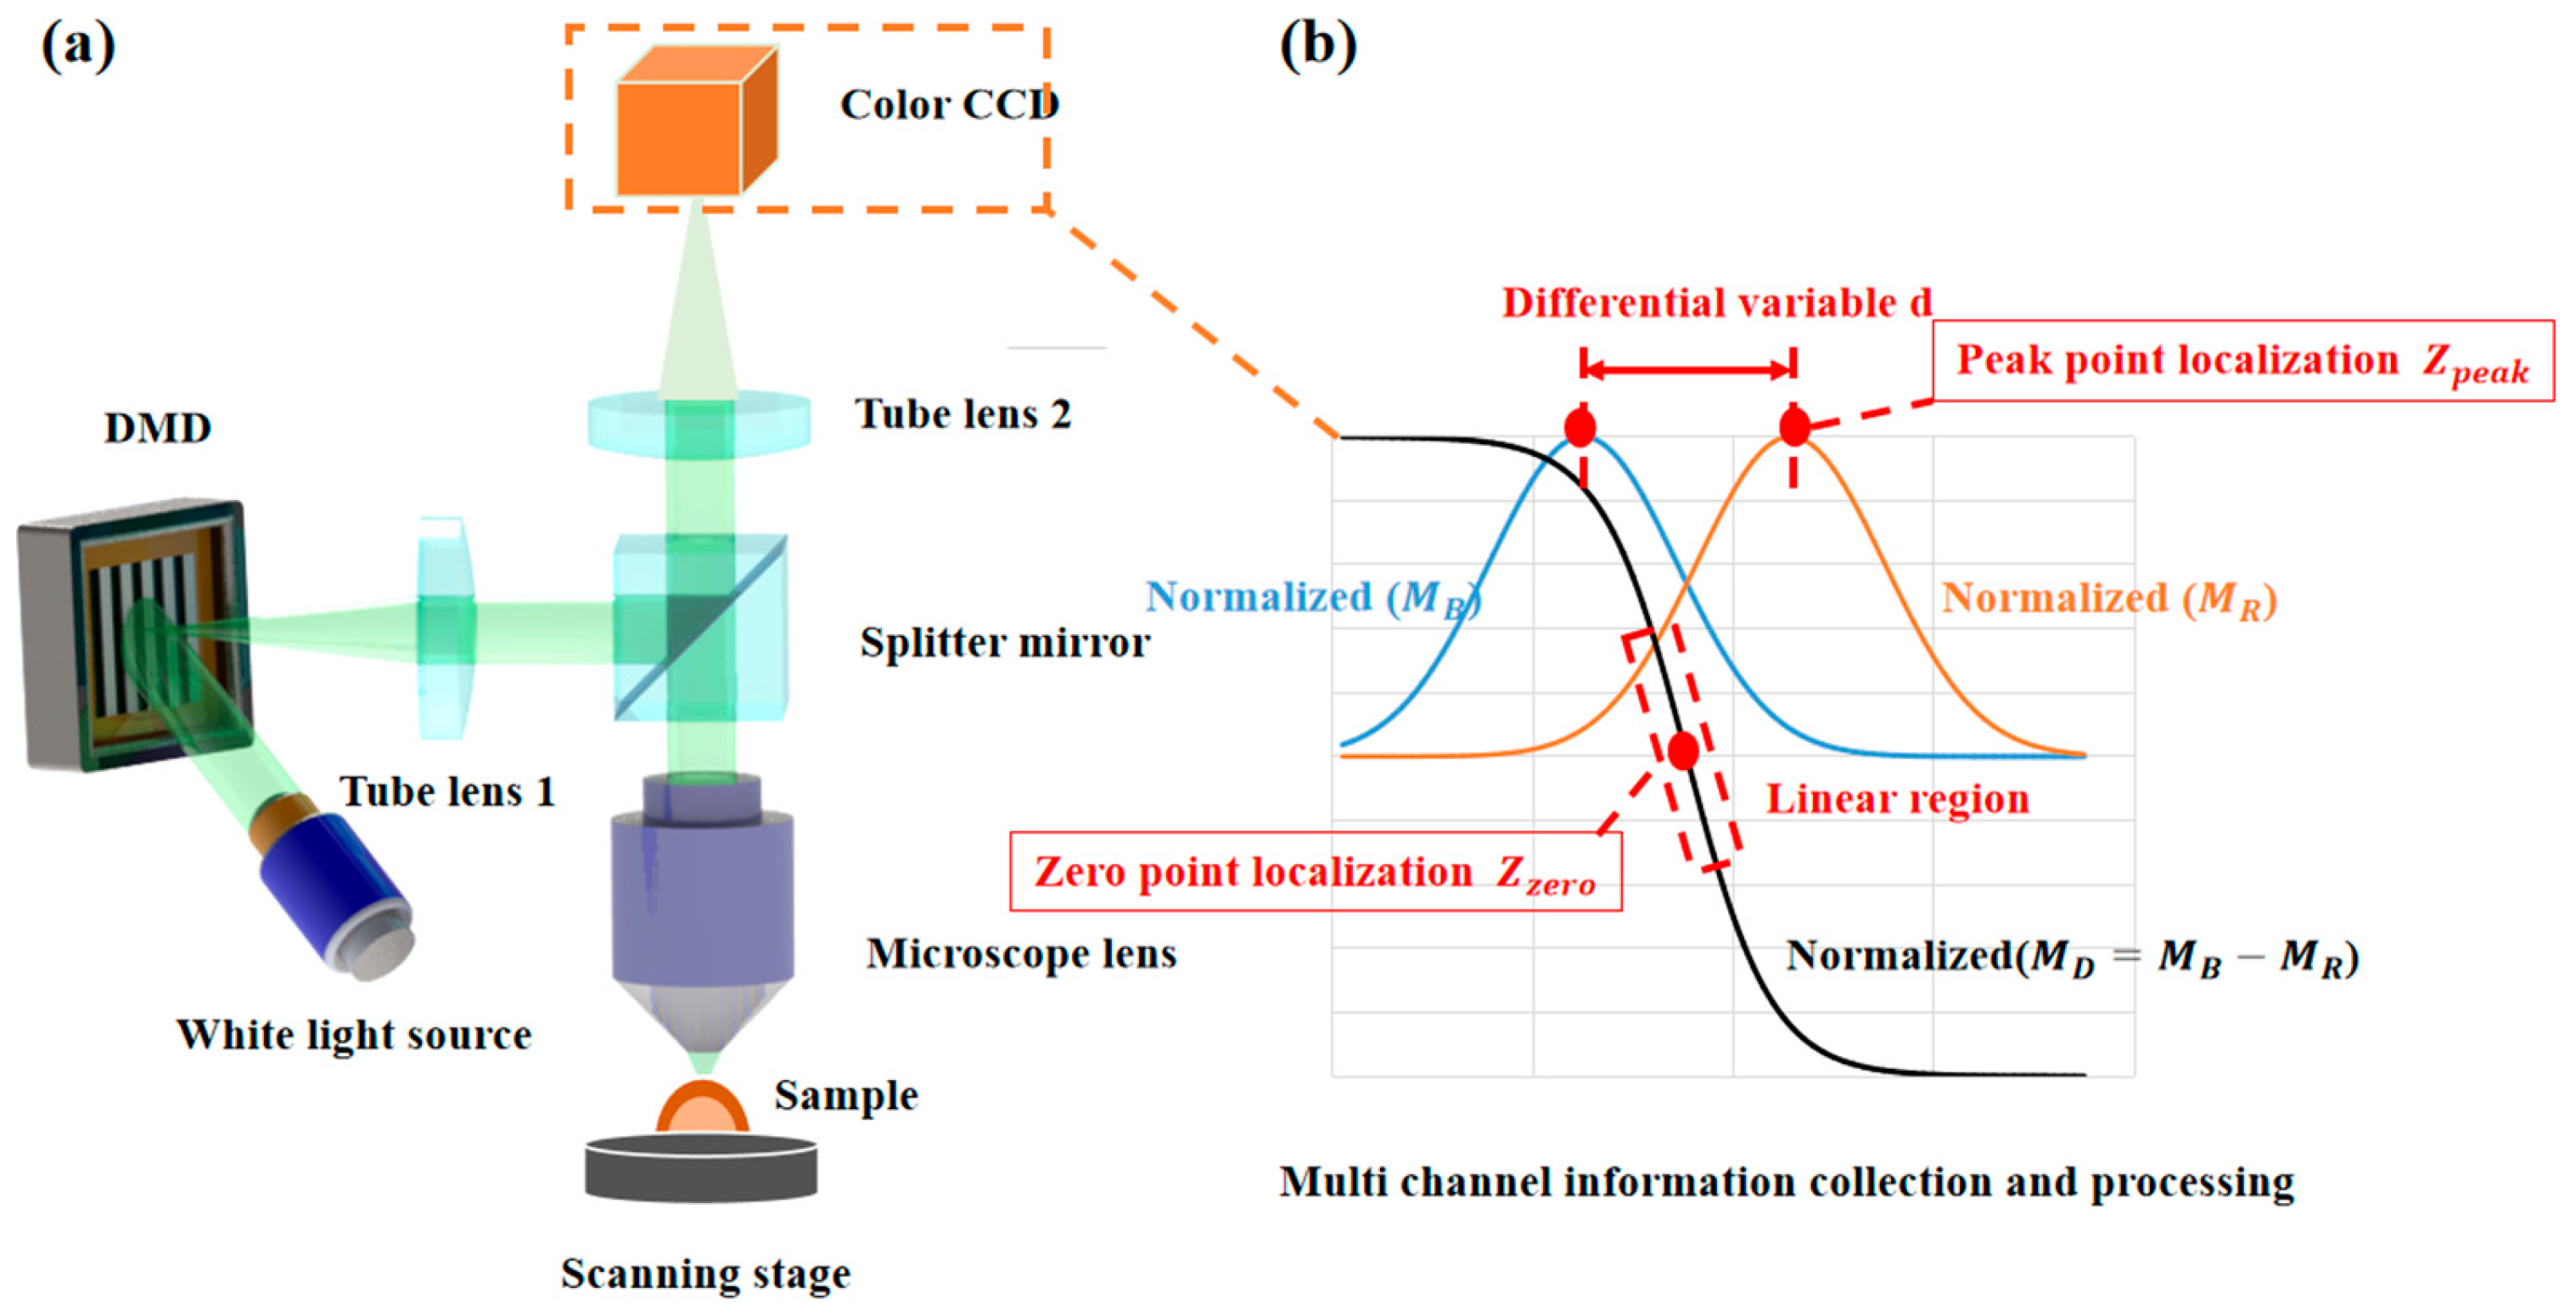
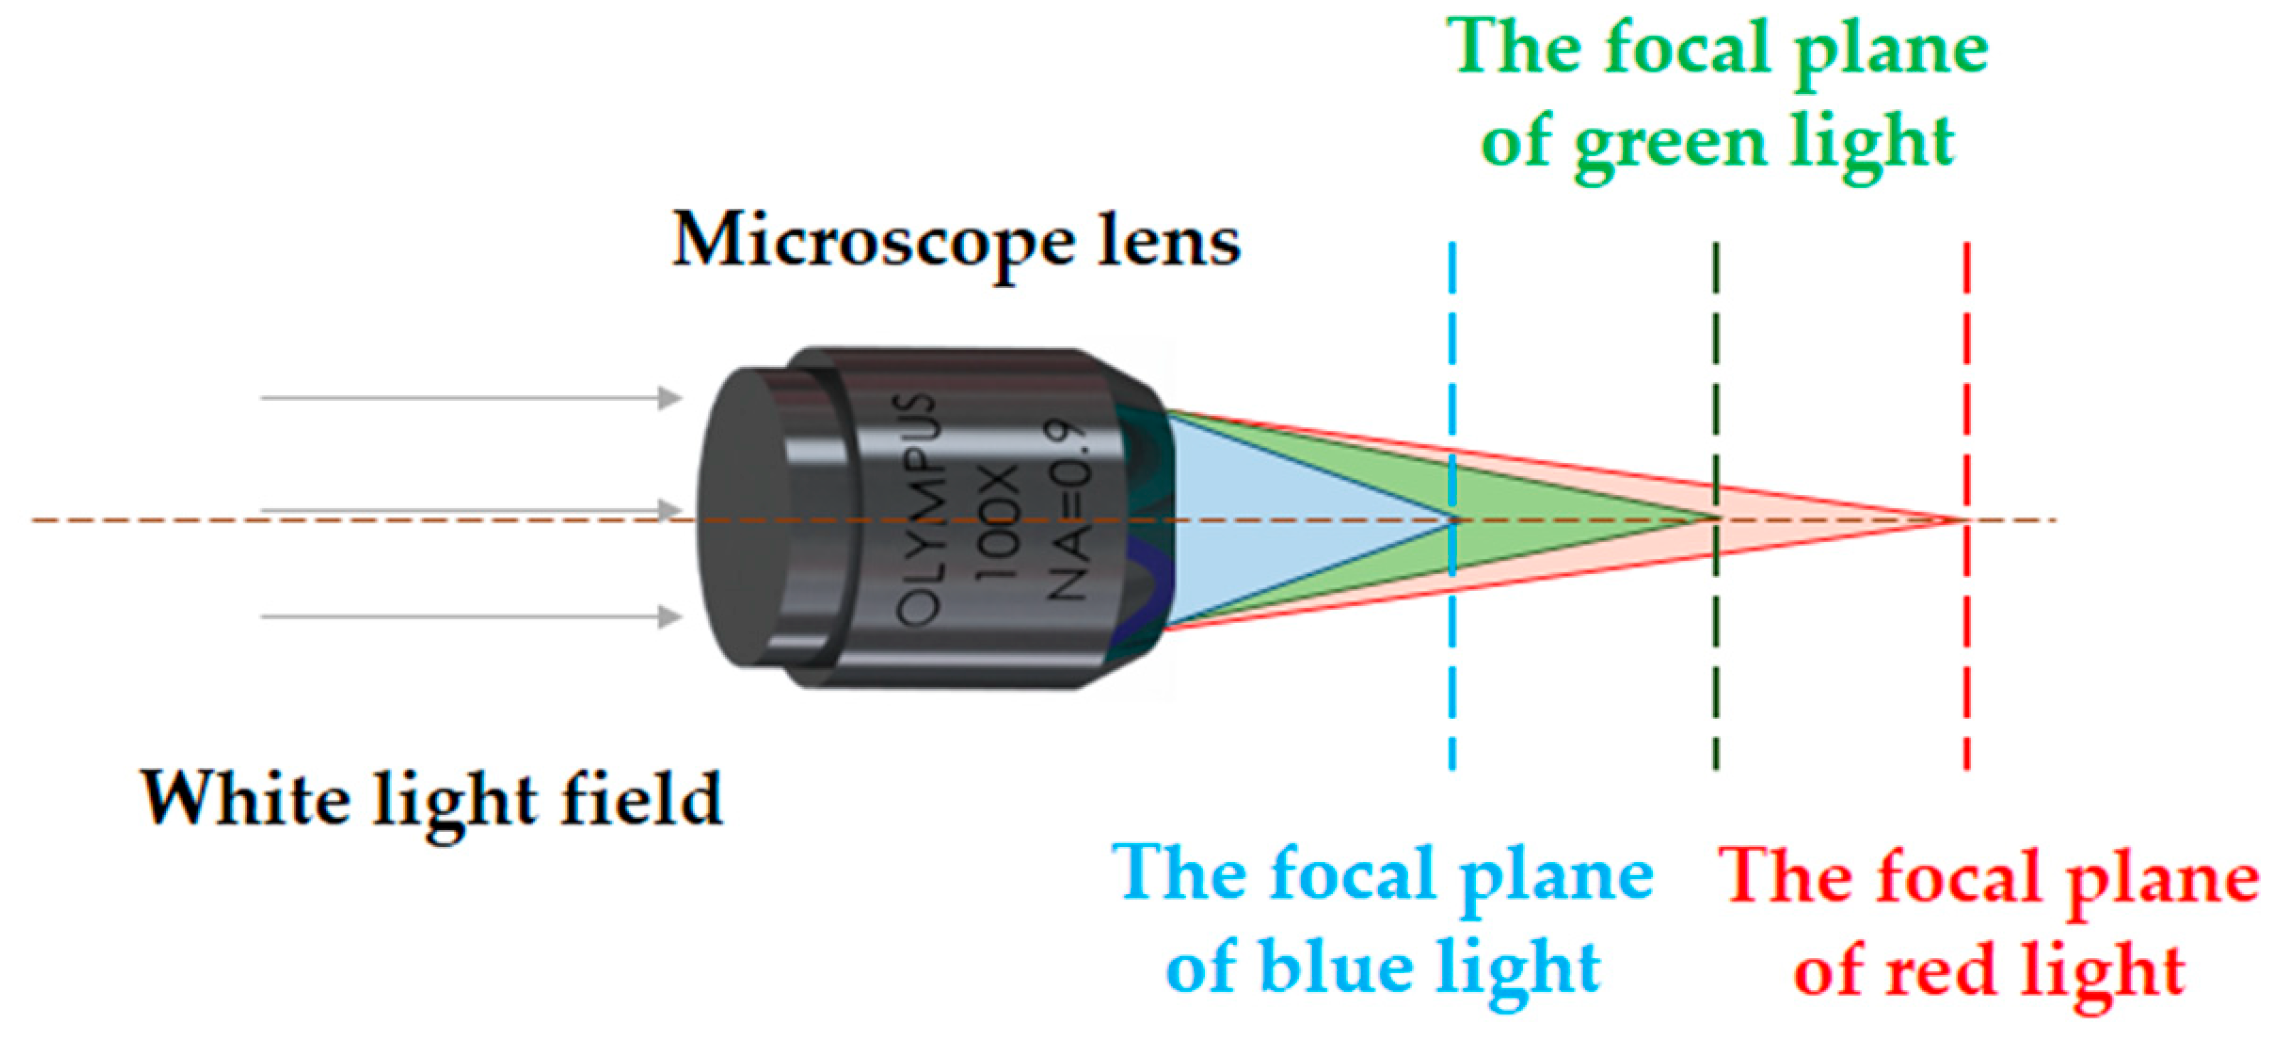
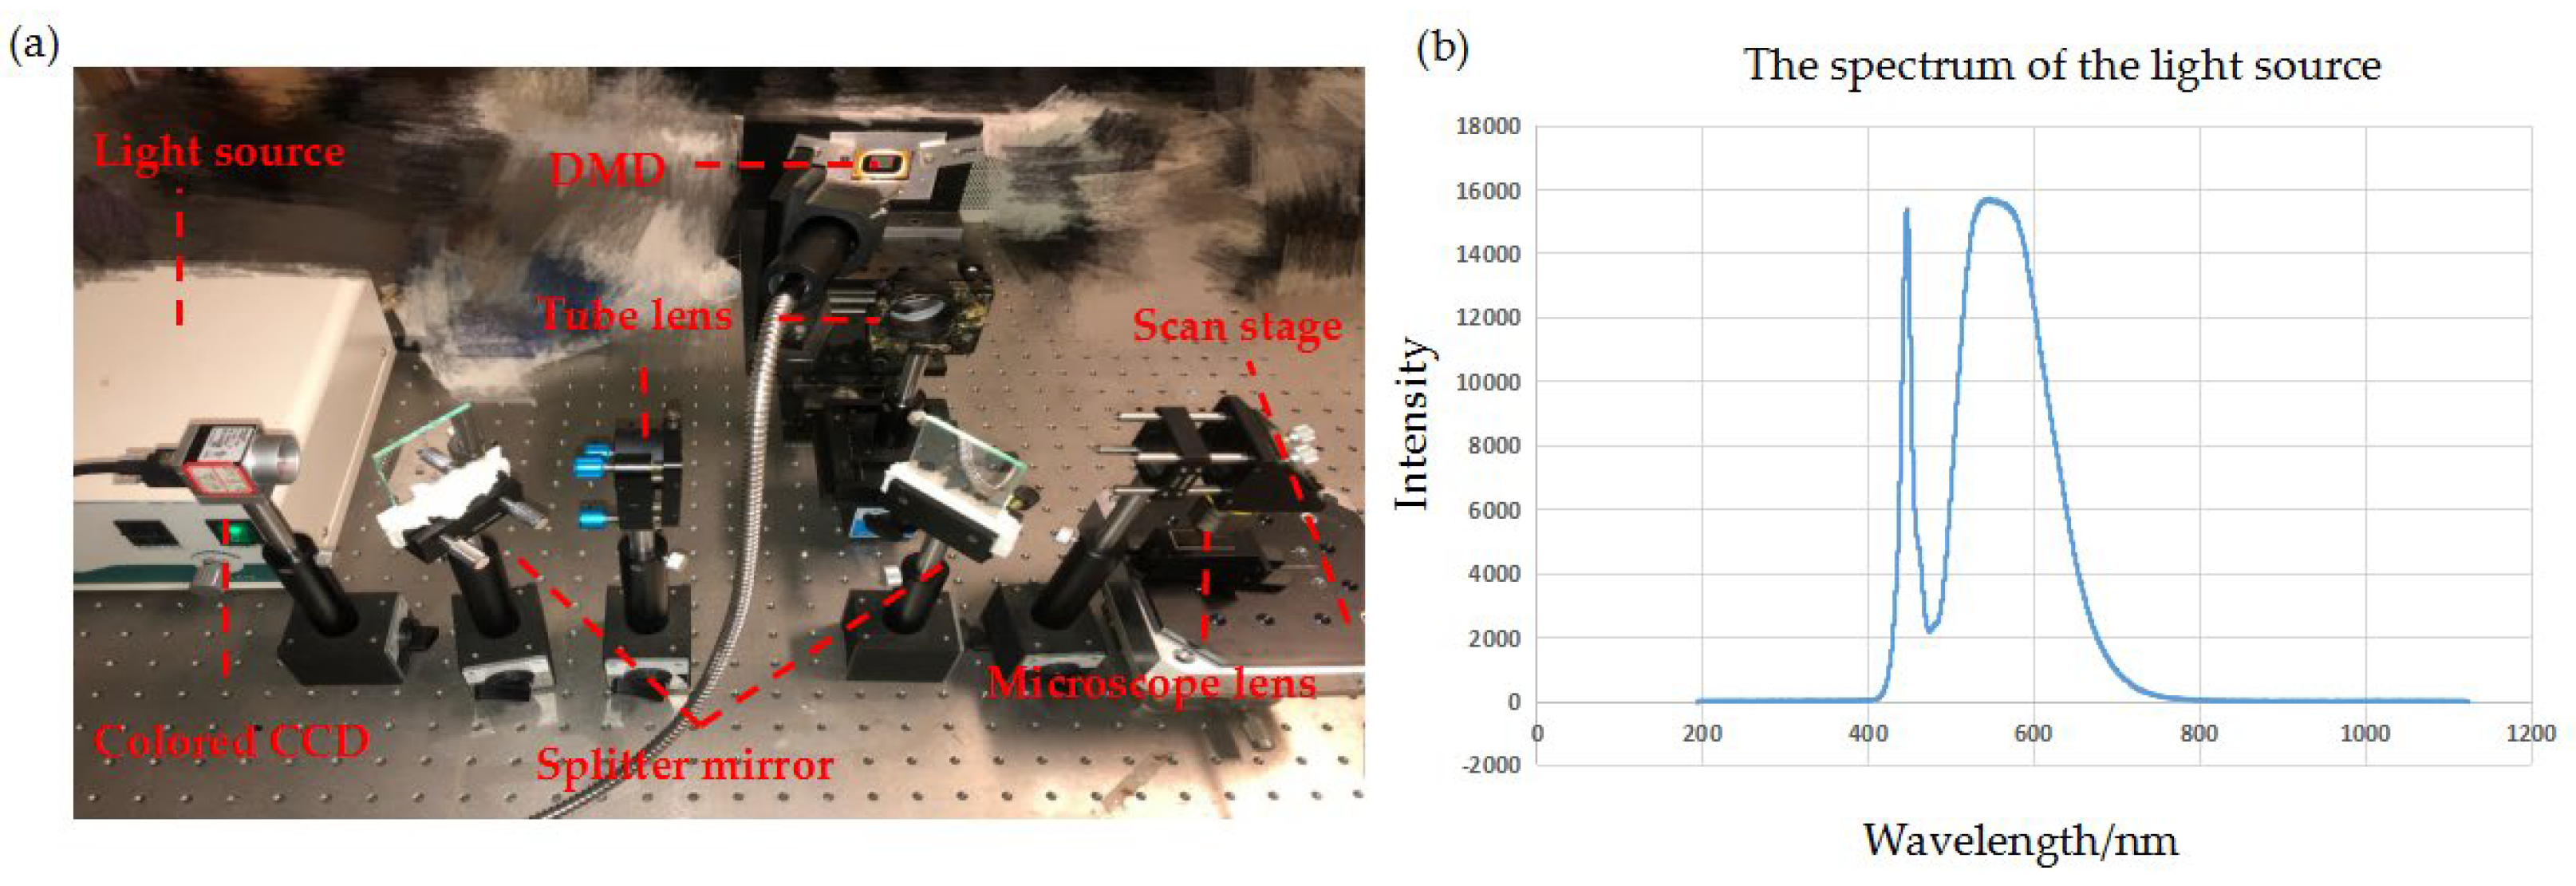
2.1. Measurement System

The structure of the differential modulation measurement system based on color CCD proposed in this article is shown in Figure 1a. The measurement system mainly includes a white light source, a digital micromirror array (DMD), a tube lens, a splitter mirror, a microscope lens, a high-precision longitudinal scan stage, and a color CCD detector. Firstly, the DMD is controlled by the computer to generate a sinusoidal grating fringe required for measurement and illuminated by a white light source. Then the sinusoidal grating fringe is projected onto the surface of the object through tube lens 1, splitter mirror, and microscope lens. The modulated and reflected light field on the object surface is received by a color CCD detector through a microscope lens, splitter mirror, and tube lens 2. The color image sequence contains fringe information of R, G, and B channels, which contain the three pieces of the modulation degree information. According to the required differential variable, any two modulation curves of different color channels can be extracted to construct the differential modulation curve as shown in Figure 1b. The linear region of the differential modulation curve is utilized for zero point localization to extract the target position and achieve 3D morphology detection with higher precision compared with traditional methods based on a single modulation curve.

2.2. Theoretical Analysis

Firstly, according to the theory of geometric optics, it is known that there exists a dispersion phenomenon in the propagation of various colored lights in different media. The refractive index of each colored light will differ in that medium, which will reflect the difference in the focal plane of each colored light when imaged by a microscope lens. Consequently, based on the Cauchy dispersion formula, the relationship between the refractive index and wavelength of light waves in a certain medium can be expressed as:
n = A + B λ 2 + C λ 4
where n represents the refractive index of each colored light in a certain medium; λ represents the wavelength of each colored light; and A, B and C are constants determined by the characteristics of the certain medium, which can be found in the corresponding manuals for typical optical materials. Further, according to the lens imaging theory, the relationship between the focal length of the image and the refractive index can be expressed as:
f = n 0 n n 0 ( r 1 r 2 ) 1
where f represents the focal length, n represents the refractive index of each colored light in a certain medium; n 0 represents the refractive index of the space in which the measurement system is located, which can generally be regarded as 1 when placed in air; and r 1 and r 2 represent the equivalent radius of the front and rear spherical surfaces of the lens, both of which are constants. According to Equation (2), the focal length of the image is inversely proportional to the refractive index. Therefore, under the imaging of a microscope lens, each colored light with different wavelengths will produce focal planes at different positions, as shown in Figure 2. Correspondingly, this will generate modulation information with a certain degree of difference, providing a theoretical basis for the method introduced in this article.
Specifically, assuming that the R and B channels are utilized to realize detection, after projecting the sinusoidal grating fringe onto the surface of the object, the light intensity distributions of the R channel and B channel in the color CCD at a certain longitudinal scan distance z can be obtained, which can be expressed as:
I R ( x , y ; z ) = I 0 ( x , y ; z ) + M R ( x , y ; z ) c o s ( 2 π f 0 x + φ 0 ) I B ( x , y ; z ) = I 0 ( x , y ; z ) + M B ( x , y ; z ) c o s ( 2 π f 0 x + φ 0 ) M B ( x , y ; z ) = M R ( x , y ; z + d )
where I R ( x , y ; z ) and I B x , y ; z , respectively, represent the detected light intensity of R channel and B channel; I 0 ( x , y ; z ) represents the background intensity; M R ( x , y ; z ) and M B x , y ; z , respectively, represent the modulation information of the R channel and B channel; f 0 and φ 0 , respectively, represent the normalized frequency and the initial phase of the projected sinusoidal grating fringe; and d represents the differential variable between R channel and the B channel, the value of which mainly depends on the bandwidth of the white light source. According to the principle of modulation extraction based on multi-step phase-shifting technology, assuming that L phase-shifted sinusoidal grating fringes are projected at each vertical scan distance, the modulation information can be expressed as:
M ( x , y ; z ) = i = 1 L I i ( x , y ; z ) s i n ( 2 i π / L ) 2 + i = 1 L I i ( x , y ; z ) c o s ( 2 i π / L ) 2 1 2
where I i ( x , y ; z ) represents the i t h light intensity at each vertical scan distance. Substitute Equation (3) into Equation (4), the modulation function of the R channel, the modulation function of the B channel, and the differential modulation function can be, respectively, expressed as:
M R ( z ) = M m a x e ( z f k × F W H M ) 2 M B ( z ) = M m a x e ( z + d f k × F W H M ) 2 M D ( z ) = M B ( z ) M R ( z ) = M m a x ( e ( z + d f k × F W H M ) 2 e ( z f k × F W H M ) 2 )
where z represents the vertical scan distance; M R ( z ) and M B z , respectively, represent the modulation function that varies with z of the R channel and B channel; M D ( z ) represents the differential modulation function; M m a x represents the maximum value of the modulation function, which mainly depends on the intensity of the light source; f represents the focal length of the microscope lens; k is a constant that equals 1 / 4 l n ( 2 ) ; and F W H M represents the full width at half maximum of the modulation curve, which is determined by the optical system and can be expressed as:
F W H M = 0.04407 λ 0 f 0 ( 1 f 0 ) s i n 2 ( 0.5 a r c s i n ( N A / n ) )
where λ 0 represents the center wavelength of the light source; f 0 represents the normalized frequency of the projected sinusoidal grating fringe; N A represents the numerical aperture of the microscope lens; and n represents the refractive index of the medium of the microscope lens. Once the parameters of the optical measurement system are determined, FWHM is a constant that can be calculated.
As shown in Figure 1b, the blue curve represents the modulation function of the B channel, the orange curve represents the modulation function of the R channel, and the black curve represents the differential modulation function. It can be seen that the linear region of the differential modulation curve has the largest slope distribution and the modulation value is extremely sensitive to changes in the scan distance. As a result, theoretically, utilizing zero point localization instead of traditional peak localization can achieve higher accuracy in the extraction of the targeted position, which will lead to a higher accuracy measurement. According to Figure 1b and Equation (5), the zero point position of the differential modulation function can be expressed as:
Z z e r o = Z p e a k d 2
where Z p e a k represents the peak point position of the single modulation function, and d represents the differential variable. Consequently, the height value of a certain pixel can be expressed as:
h = Z z e r o × z
where z represents the vertical scan step, which is a pr-set constant before measurement. After obtaining the height value of all pixels by the illustrated steps, the 3D morphology of the surface to be measured can be restored.

3. Simulation and Experiment
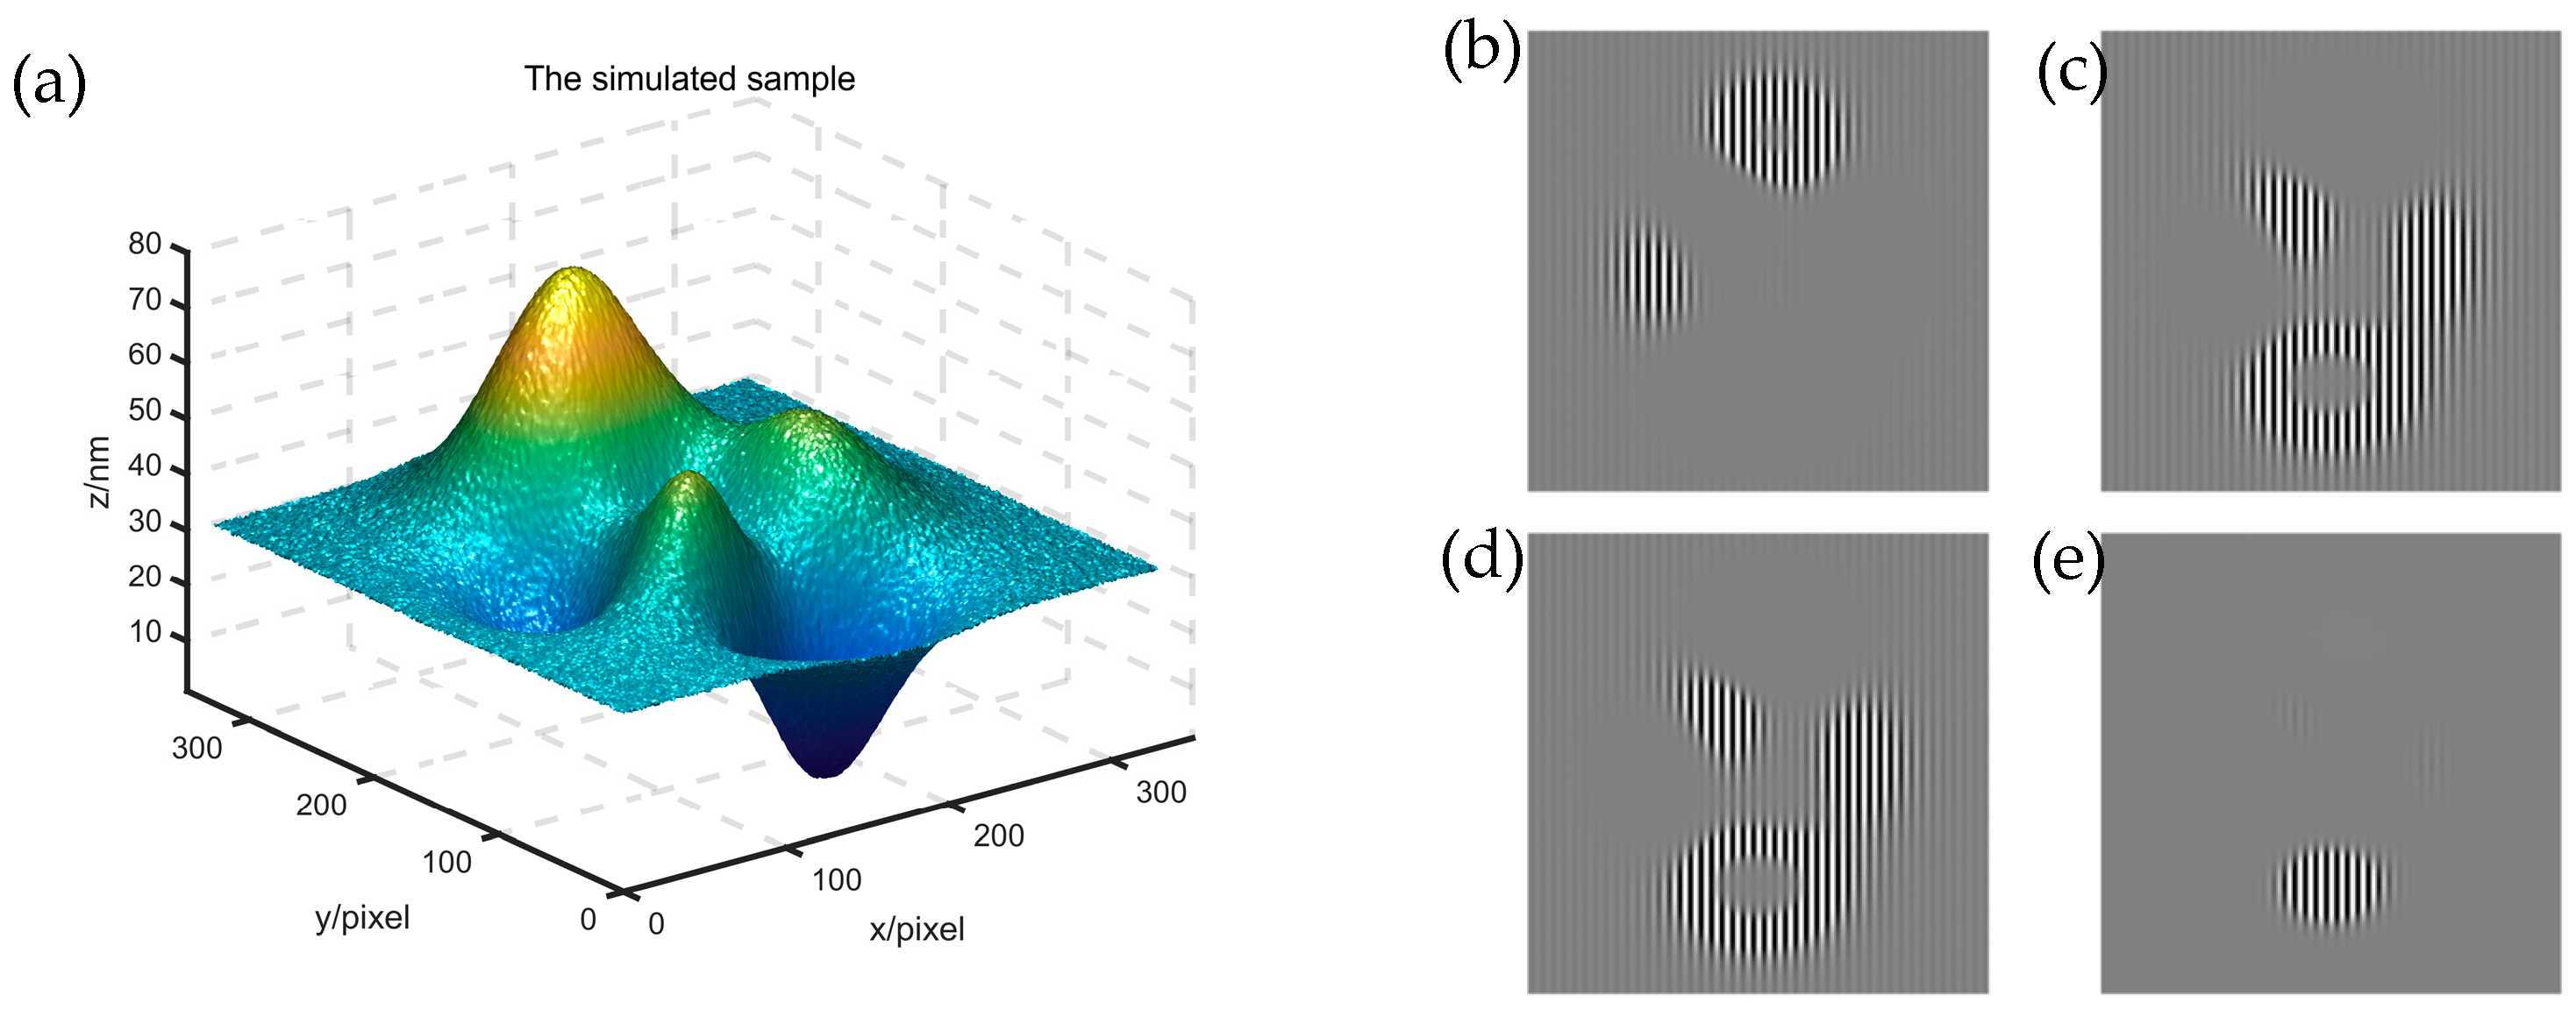
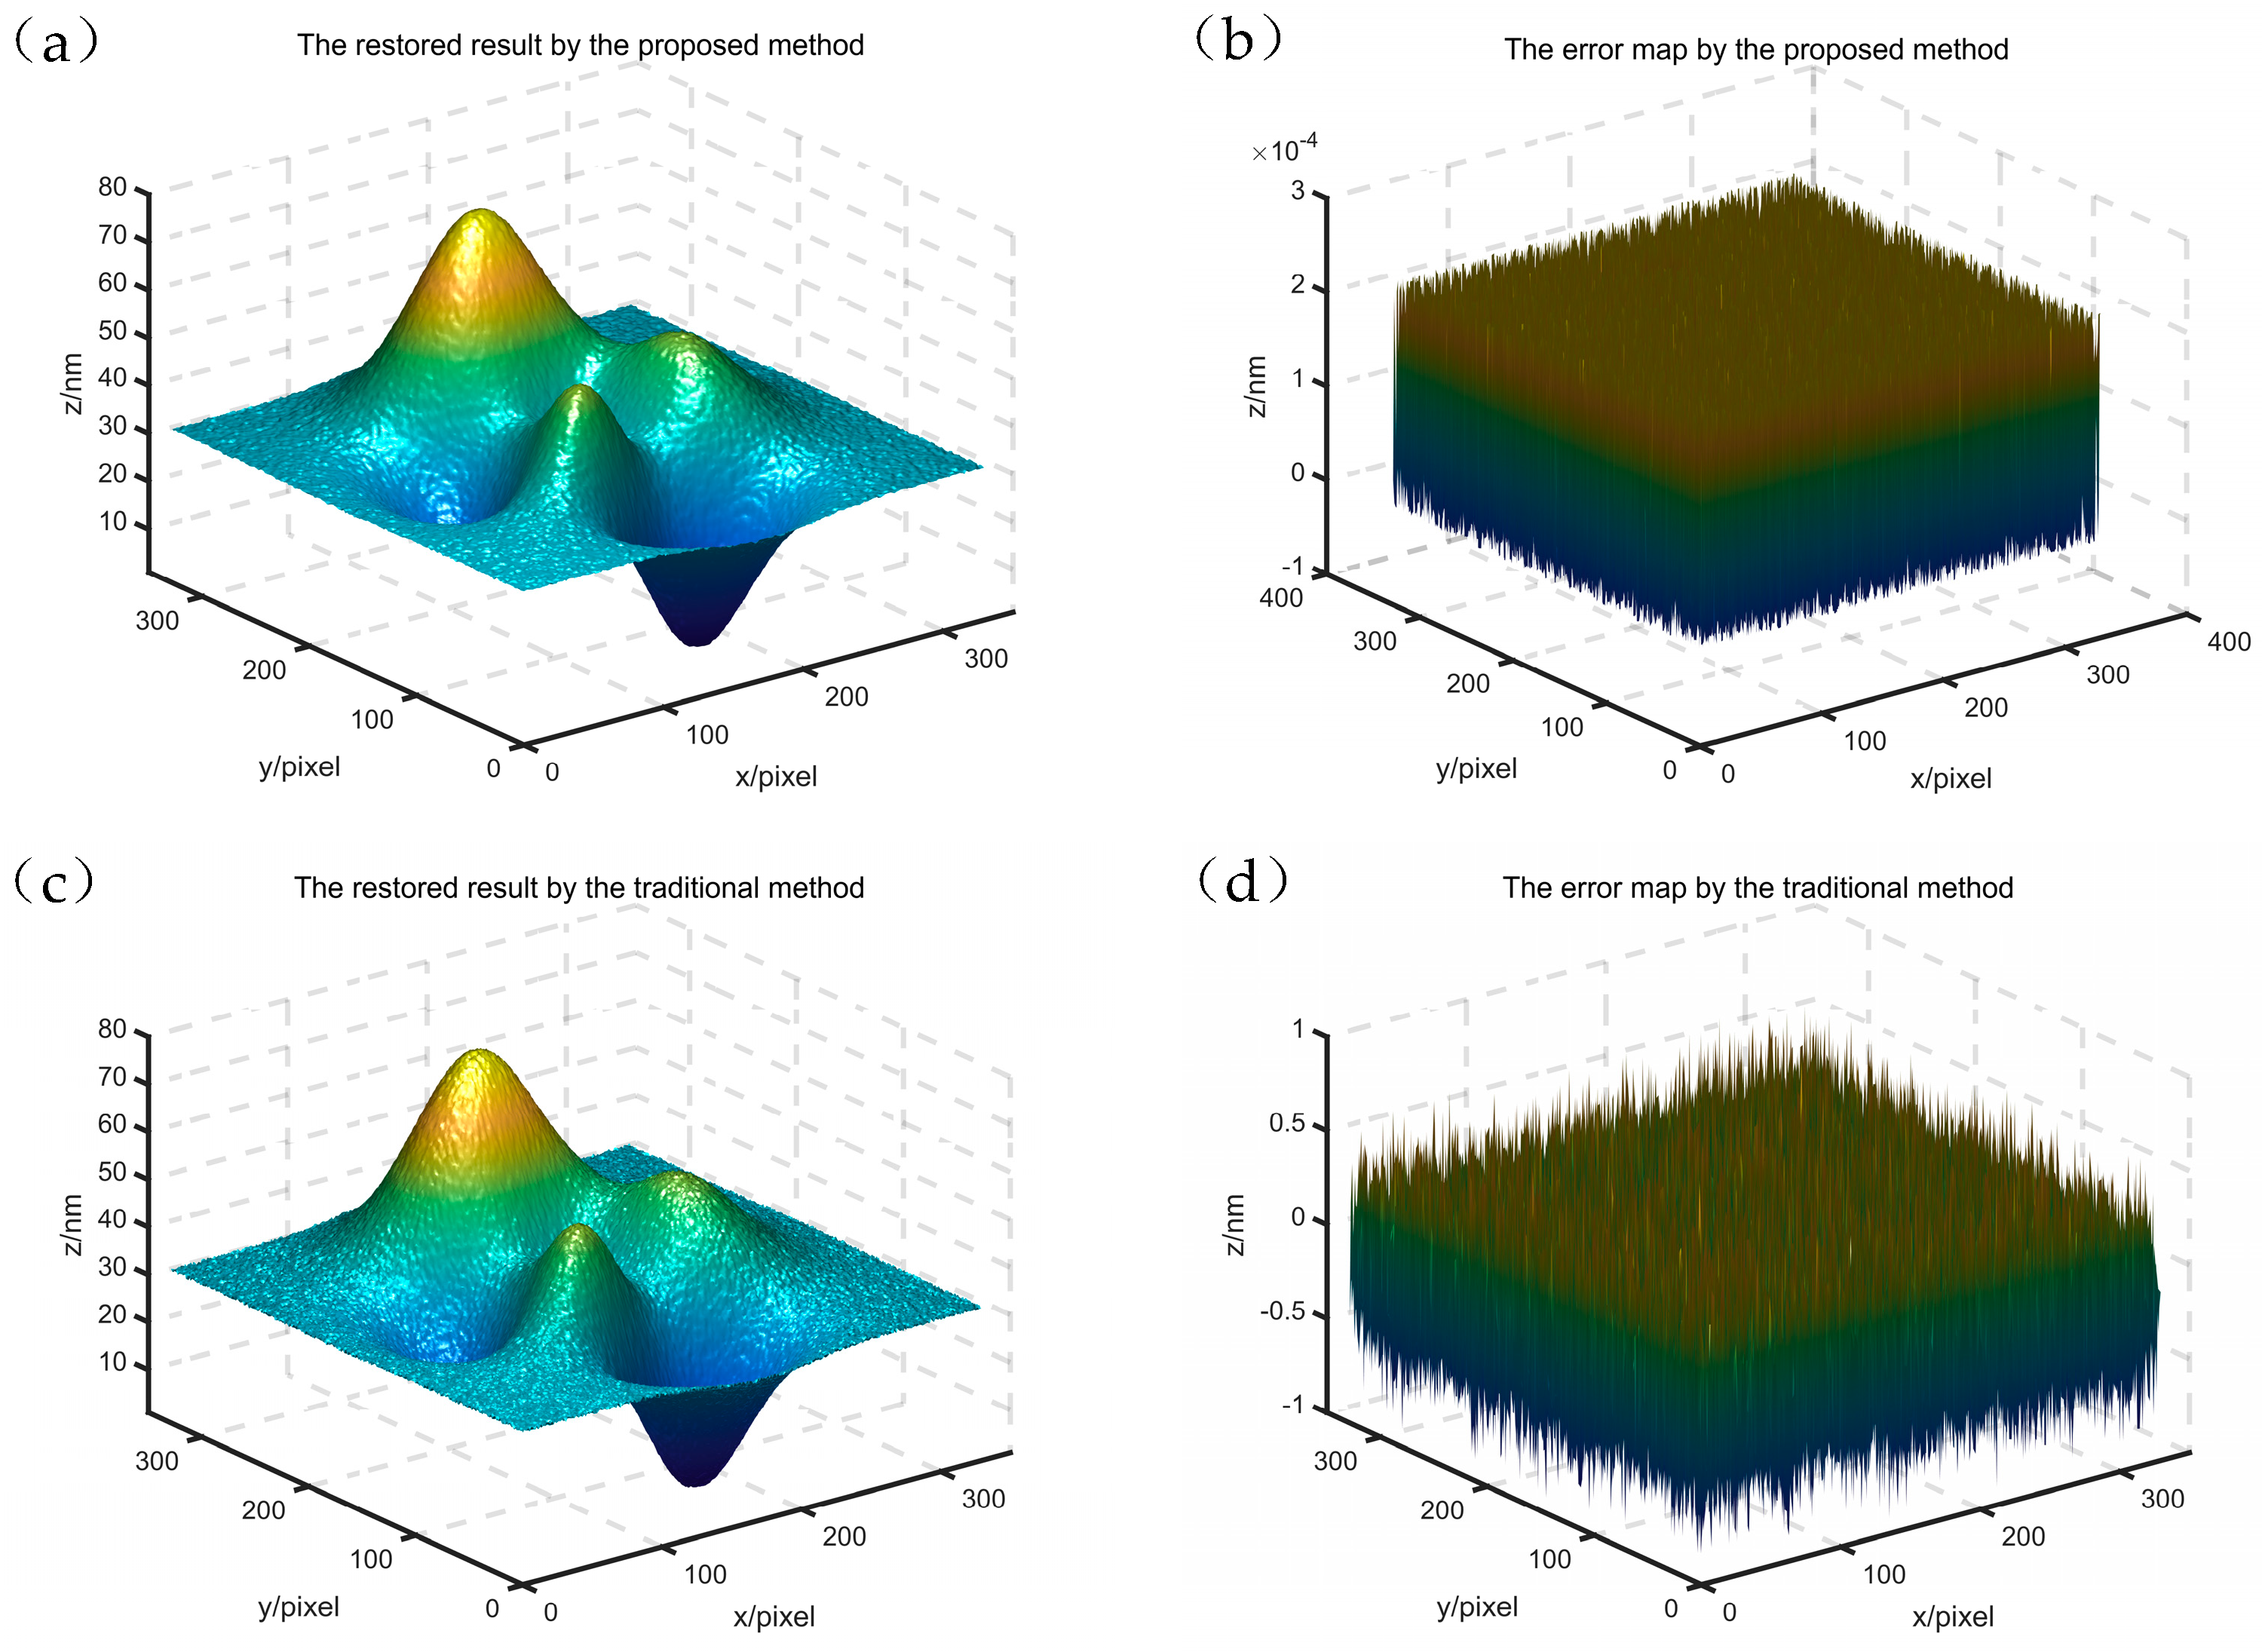
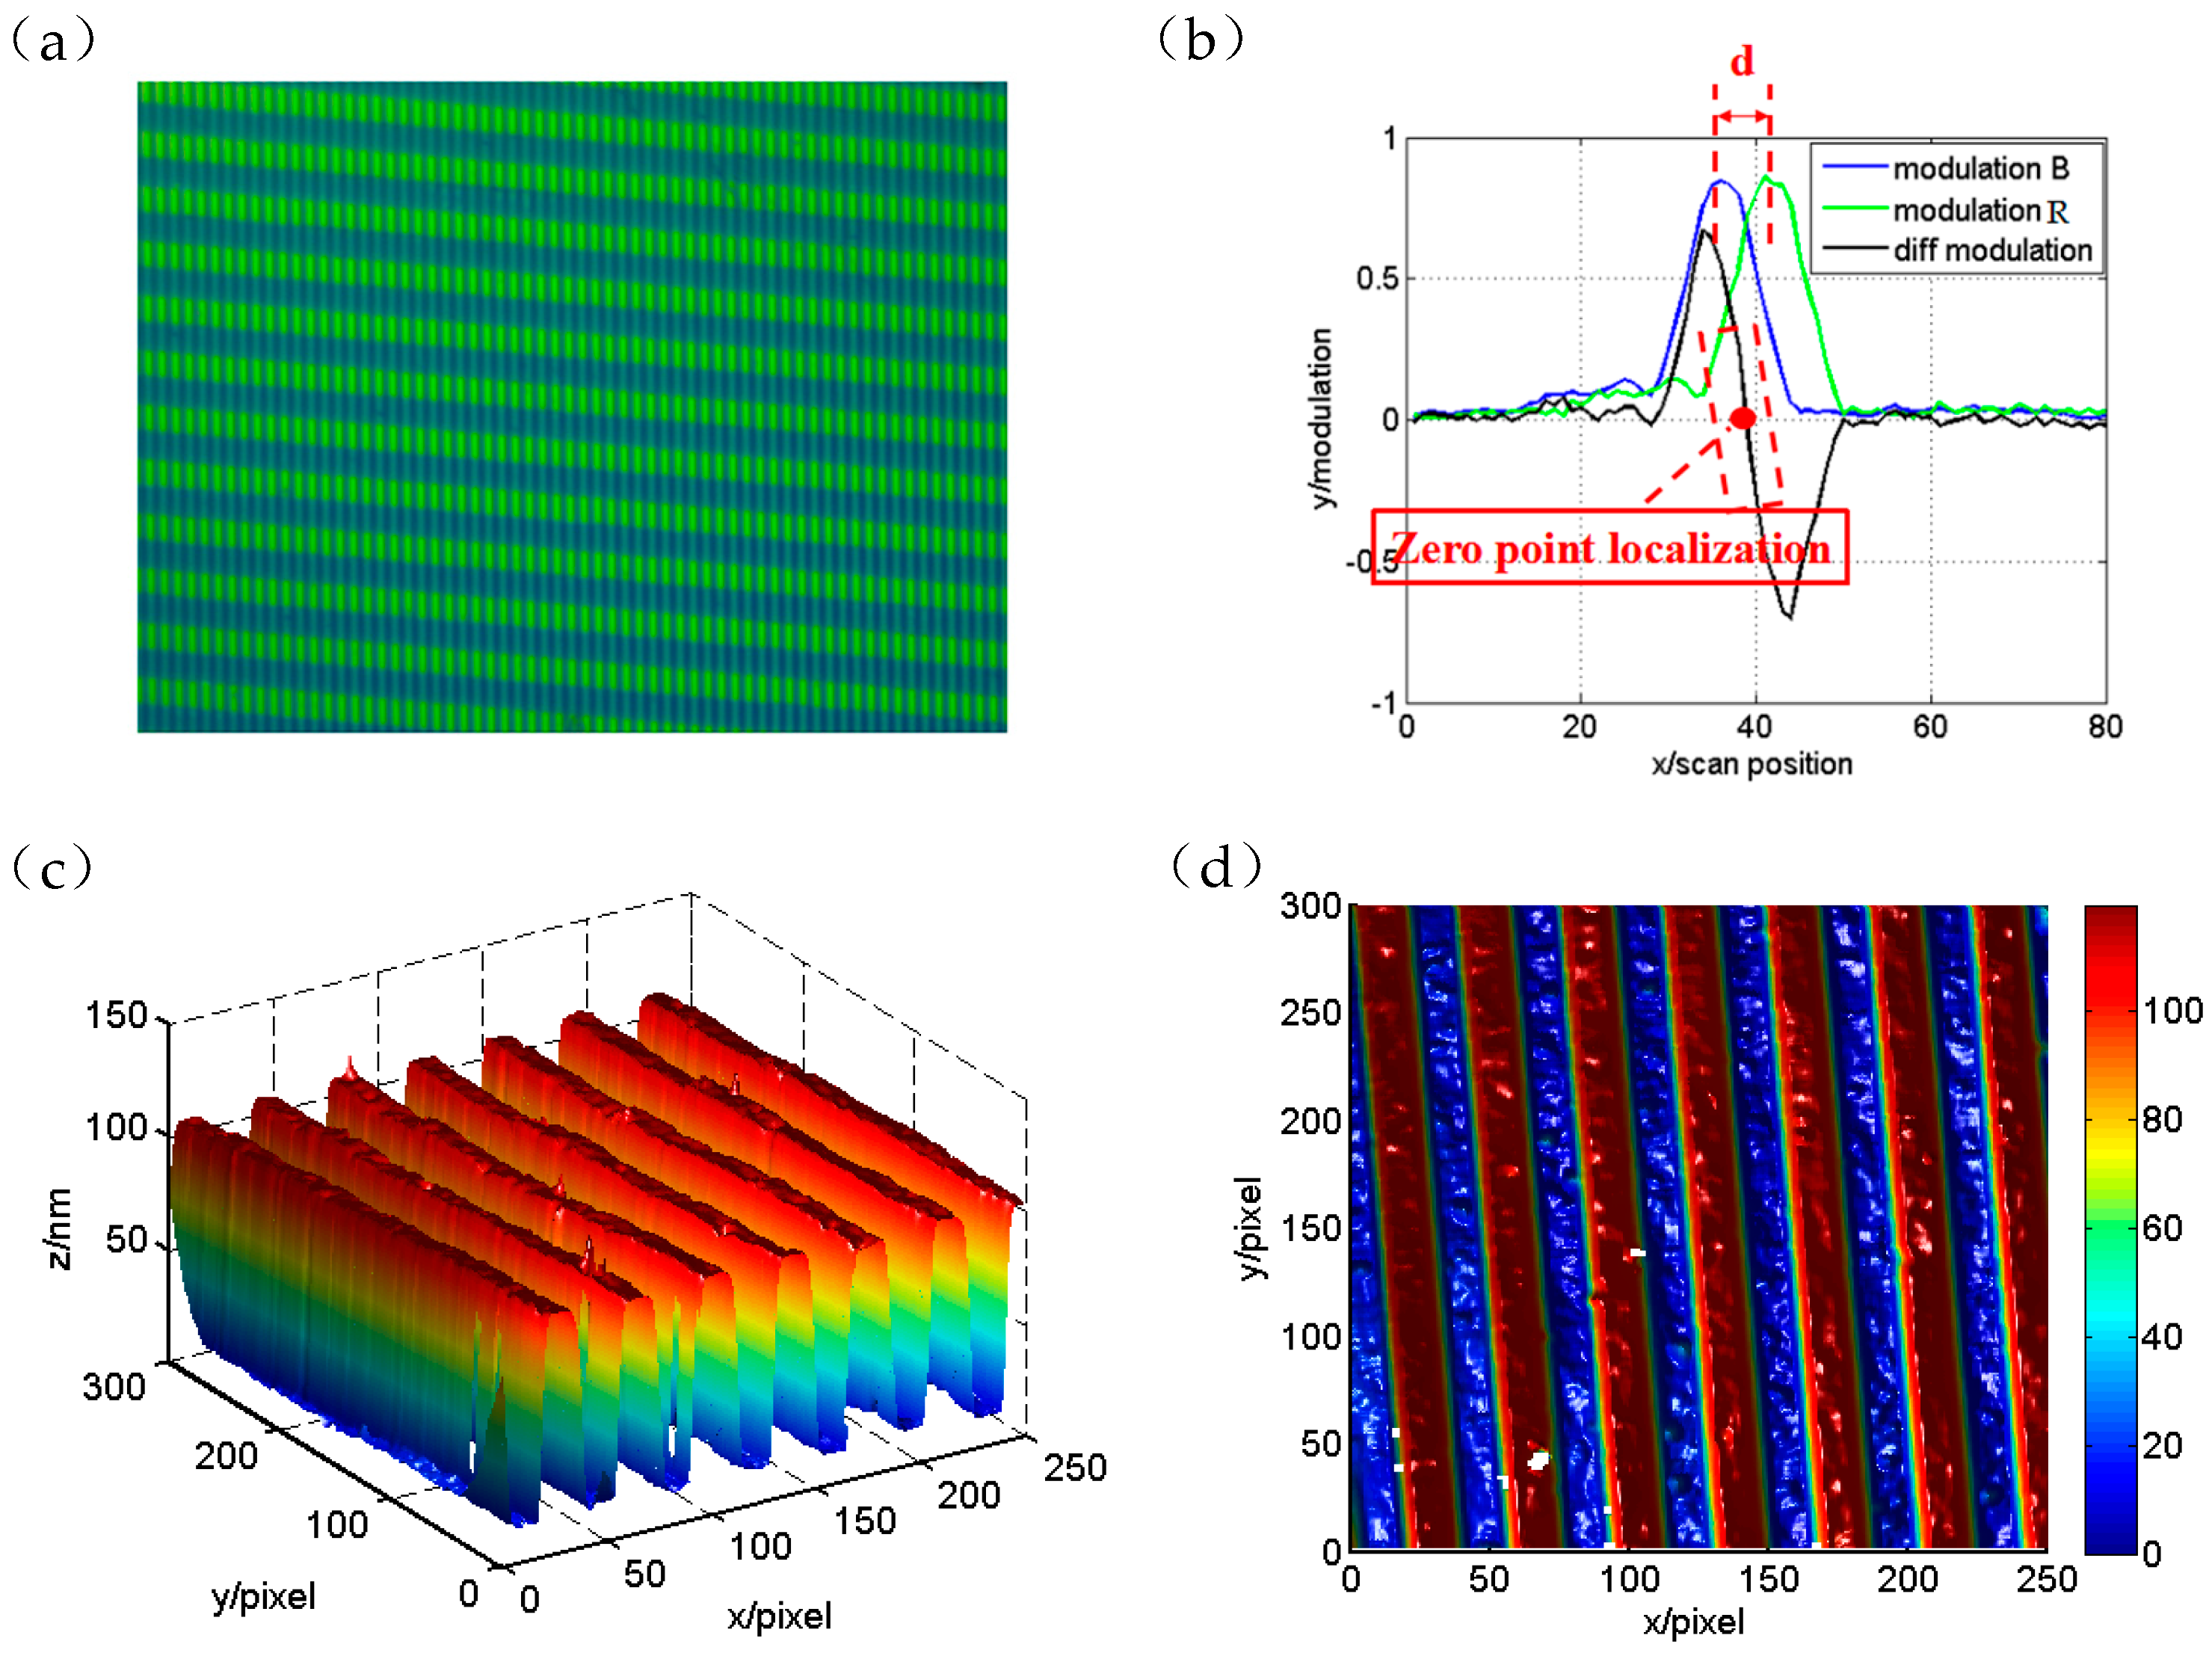
3.1. Simulation

To verify the feasibility of the proposed method and demonstrate its advantages compared to traditional methods based on peak detection, a simulation has been carried out based on MATLAB 2019b. As shown in Figure 3a, the absolute height from the peak to the valley of the simulated sample is 80 nm, and the simulated projected grating fringes are a set of 4-step phase-shifted fringe patterns with a period of 8 pixels. The FWHM of the modulation curve under this measurement system can be calculated as 362 nm. In this simulation, the simulated sample is scanned at a scan step of 20 nm from 0 nm to 2600 nm, which will produce 520 images.
Figure 3b,c demonstrates the captured grayscale images at the 40th scan of the R channel and B channel, while (c,d) demonstrate the captured grayscale images at the 80th scan of the R channel and B channel, respectively. It should be noted that 4 fringe patterns with a certain phase difference were actually projected at each scan position. As an example, only the images of fringe patterns with an initial phase φ 0 = 0 are shown here. After scanning, the image sequence R channel and B channel are stored in the computer and will be separately processed by the multi-step phase-shifted technique to obtain the modulation curves of the two channels, as shown in Figure 4b. Consequently, the differential modulation curve can be extracted, as shown in Figure 4c. Finally, the linear region of the differential modulation curve is extracted to locate the zero point position Z z e r o by the linear fitting algorithm, which can be substituted into Equation (8) to realize shape recovery of the simulated sample.
The restored result by the proposed method is shown in Figure 5a,b demonstrates the error distribution map by the proposed method, which can be obtained by taking the absolute value after subtracting from Figure 3a and Figure 5a. As shown in Figure 5b, the measurement error by the proposed method is within 4 × 10 4   nm , which can be ignored compared to the simulated sample’s height of 80 nm. As a comparison, the detection signal of the R channel is processed separately to obtain the restored result by the traditional peak detection algorithm based on peak fitting and peak point localization, as shown in Figure 5c. Consequently, the corresponding error distribution map can be obtained, as shown in Figure 5d, which indicates that the measurement error by the traditional method is around 1 nm, which is much higher than the measurement error by the proposed method.
This simulation indicates that the proposed method utilizing differential modulation based on multi-color channel fusion can effectively achieve high-precision 3D measurement, and the proposed linear fitting and zero point localization methods can improve the localization accuracy, which leads to higher measurement accuracy.

3.2. Experiment

In order to further verify the feasibility of the proposed method in practical applications, a corresponding experiment has been carried out on an optical isolation platform in a dark environment to avoid the influence of ambient light and vibration on measurement accuracy. As shown in Figure 6a, an experimental platform has been built, which mainly includes a white light source with a center wavelength of 580 nm and the full width at half maximum of 160 nm, as shown in Figure 6b, a digital micromirror device (DMD) with a resolution of 1920 × 1080 and the pixel size of 7.56 μm, two splitter mirrors, a microscope lens with a magnification of 10 × and the NA of 0.25, a scan stage with a resolution of 0.5 nm, a color CCD camera with a resolution of 2048 × 1536 and the pixel size of 4.4 μm, and two Tube lenses. An object with a grating structure on the surface is selected for the experiment and the step height is 138.3 nm, which was previously obtained by the stylus profiler.
In this experiment, a set of 4-step phase-shifted fringe patterns with a period of 8 pixels is utilized for projection, and the value of the normalized spatial frequency of the pattern is 0.5. The scan stage is controlled to scan vertically with a scan step of 100 nm 80 times from 0 nm to 8 μm. At each vertical scan position, 4 fringe patterns with a phase difference of π 2 are projected onto the surface of the tested sample. After scanning, 320 images are captured by the colored CCD and stored in the computer. Figure 7a shows the image at the 40th scan captured by the colored CCD.
By the proposed algorithm, the corresponding modulation curves can be obtained, as demonstrated in Figure 7b, which clearly indicates that there is an obvious linear region in the differential modulation curve. Figure 7c demonstrates the 3D view of the restored result and Figure 7d shows the 2D image of the restored result, which indicates that the proposed method can provide an effective approach for measuring the 3D morphology of micro/nano structures. In order to demonstrate the measurement accuracy and repeatability of the proposed method in practical environments, 10 experiments on the same sample, which has a step of 138.3 nm, were conducted under the same system and environment. As shown in Table 1, the maximum measurement error after 10 times is 4.9 nm and the repeatability after 10 times is 1.8 nm.

4. Discussion and Conclusions

A 3D measurement method utilizing differential modulation based on multi-color channel fusion is proposed in this article, which breaks the limitation of measurement accuracy caused by peak position localization in traditional structured light illumination measurement methods. By extracting multi-channel modulation information captured by colored CCD, a differential modulation curve is constructed, and the linear region with the highest slope of the curve is utilized for zero point localization to improve measurement accuracy. At the same time, the proposed method avoids the introduction of dual CCD detection systems, which eliminates errors caused by signal matching and simplifies the measurement system. Subsequently, the feasibility and advantage of the proposed method are verified through both simulation and experiment, which can provide an effective approach for micro/nano measurement in industrial applications.

Author Contributions

Conceptualization, L.L. and X.Z. (Xusheng Zhu); methodology, L.L. and X.Z. (Xusheng Zhu); software, H.Z.; validation, L.L. and X.Z. (Xinming Zhou); formal analysis, L.X. and W.L.; writing—original draft preparation, L.L., X.Z. (Xusheng Zhu), H.Z., X.Z. (Xinming Zhou), L.X. and W.L. All authors have read and agreed to the published version of the manuscript.

Funding

This research received no external funding.

Institutional Review Board Statement

Not applicable.

Informed Consent Statement

Not applicable.

Data Availability Statement

The data is unavailable due to privacy our company.

Conflicts of Interest

All authors were employed by the company AVIC Cheng’du Aircraft Industrial (Group) Co., Ltd. and declare that the research was conducted in the absence of any commercial or financial relationships that could be construed as a potential conflict of interest.

References

  1. Moussata, D.; Goetz, M.; Gloeckner, A.; Kerner, M.; Campbell, B.; Hoffman, A.; Biesterfeld, S.; Flourie, B.; Saurin, S.; Galle, P.R.; et al. Confocal laser endomicroscopy is a new imaging modality for recognition of intramucosal bacteria in inflammatory bowel disease in vivo. Gut 2011, 60, 26–33. [Google Scholar] [CrossRef] [PubMed]
  2. Michels, J.; Gorb, S.N. Detailed three-dimensional visualization of resilin in the exoskeleton of arthropods using confocal laser scanning microscopy: Detailed three-dimensional visualization of resilin. J. Microsc. 2012, 245, 1–16. [Google Scholar] [CrossRef]
  3. Ferraro, V.; Wang, Z.; Miccio, L.; Maffettone, P.L. Full-Field and Quantitative Analysis of a Thin Liquid Film at the Nanoscale by Combining Digital Holography and White Light Interferometry. J. Phys. Chem. C 2021, 125, 1075–1086. [Google Scholar] [CrossRef]
  4. Gouveia, C.; Zibaii, M.; Latifi, H.; Marques, M.J.; Baptista, J.M.; Jorge, P.A. High resolution temperature independent refractive index measurement using differential white light interferometry. Sens. Actuators B Chem. 2013, 188, 1212–1217. [Google Scholar] [CrossRef]
  5. Gong, Z.; Gao, T.; Chen, Y.; Zhang, B.; Peng, W.; Yu, Q.; Ma, F.; Mei, L.; Chen, K. Sub-ppb level detection of nitrogen dioxide based on an optimized H-type longitudinal acoustic resonator and a lock-in white-light interferometry demodulation algorithm. J. Quant. Spectrosc. Radiat. Transf. 2020, 253, 107136. [Google Scholar] [CrossRef]
  6. Ilhan, H.A.; Doğar, M.; Özcan, M. Digital holographic microscopy and focusing methods based on image sharpness: Holographic microscopy and focusing. J. Microsc. 2014, 255, 138–149. [Google Scholar] [CrossRef]
  7. Molaei, M.; Sheng, J. Imaging bacterial 3D motion using digital in-line holographic microscopy and correlation-based de-noising algorithm. Opt. Express 2014, 22, 32119. [Google Scholar] [CrossRef] [PubMed]
  8. Righolt, C.H.; Slotman, J.A.; Young, I.T.; Mai, S.; van Vliet, L.J.; Stallinga, S. Image filtering in structured illumination microscopy using the Lukosz bound. Opt. Express 2013, 21, 24431. [Google Scholar] [CrossRef] [PubMed]
  9. Mandula, O.; Kielhorn, M.; Wicker, K.; Krampert, G.; Kleppe, I.; Heintzmann, R. Line scan-structured illumination microscopy super-resolution imaging in thick fluorescent samples. Opt. Express 2012, 20, 24167. [Google Scholar] [CrossRef]
  10. Zuo, C.; Feng, S.; Huang, L.; Tao, T.; Yin, W.; Chen, Q. Phase shifting algorithms for fringe projection profilometry: A review. Opt. Lasers Eng. 2018, 109, 23–59. [Google Scholar] [CrossRef]
  11. Huang, M.; Jiang, K.; Shen, Z. Enhancing plasmonic structured illumination microscopy with surface plasmon coupled emission. Opt. Lett. 2025, 50, 483–486. [Google Scholar] [CrossRef] [PubMed]
  12. Ordóñez, L.; Lenz, A.J.; Ipus, E.; Lancis, J.; Tajahuerce, E. Single-pixel microscopy with optical sectioning. Opt. Express 2024, 32, 26038–26051. [Google Scholar] [CrossRef] [PubMed]
  13. Xie, Z.; Tang, Y.; Zhou, Y.; Deng, Q. Surface and thickness measurement of transparent thin-film layers utilizing modulation-based structured-illumination microscopy. Opt. Express 2018, 26, 2944. [Google Scholar] [CrossRef] [PubMed]
  14. Neil, M.A.; Juškaitis, R.; Wilson, T. Method of obtaining optical sectioning by using structured light in a conventional microscope. Opt. Lett. 1997, 22, 1905. [Google Scholar] [CrossRef] [PubMed]
  15. Patorski, K.; Trusiak, M.; Tkaczyk, T. Optically-sectioned two-shot structured illumination microscopy with Hilbert-Huang processing. Opt. Express 2014, 22, 9517. [Google Scholar] [CrossRef] [PubMed]
Figure 1. The diagram of measurement principle. (a) The measurement system of the proposed method. (b) The differential modulation curve.
Photonics 12 00172 g001
Figure 2. The diagram of the dispersion phenomenon of the microscope lens.
Photonics 12 00172 g002
Figure 3. The diagram of simulation. (a) The simulated sample. (b) The grayscale image at the 40th scan of the R channel. (c) The grayscale image at the 40th scan of the B channel; (d) The grayscale image at the 80th scan of the R channel. (e) The grayscale image at the 80th scan of the B channel.
Photonics 12 00172 g003
Figure 4. Data processing of pixel (200 × 200) in the simulation. (a) The light intensity curve of the R channel and B channel. (b) The modulation curve of the R channel and B channel. (c) The differential modulation curve. (d) The diagram of linear fitting and zero point localization.
Photonics 12 00172 g004
Figure 5. The results of the simulation. (a) The restored result by the proposed method. (b) The error map by the proposed method. (c) The restored result by the traditional method. (d) The error map by the traditional method.
Photonics 12 00172 g005
Figure 6. The diagram of the experimental system. (a) The experimental platform. (b) The spectrum of the light source.
Photonics 12 00172 g006
Figure 7. The results of the experiment. (a) The image at the 40th scan captured by the colored CCD. (b) The diagram of data processing. (c) The 3D view of the restored result. (d) The 2D image of the restored result.
Photonics 12 00172 g007
Table 1. The results of the experiments for measurement accuracy and repeatability.
Experimental GroupMeasurement ResultMeasurement Error
Group 1139.8 nm1.5 nm
Group 2141.6 nm3.3 nm
Group 3137.2 nm1.1 nm
Group 4143.2 nm4.9 nm
Group 5141.8 nm3.5 nm
Group 6139.5 nm1.2 nm
Group 7139.8 nm1.5 nm
Group 8140.2 nm1.9 nm
Group 9142.7 nm4.4 nm
Group 10138.9 nm0.6 nm
Disclaimer/Publisher’s Note: The statements, opinions and data contained in all publications are solely those of the individual author(s) and contributor(s) and not of MDPI and/or the editor(s). MDPI and/or the editor(s) disclaim responsibility for any injury to people or property resulting from any ideas, methods, instructions or products referred to in the content.

