Article

Laser Power Modulation of Fiber Coated with Multilayer-Graphene Based on Lithium Intercalation Method

1
State Key Laboratory of Quantum Optics Technologies and Devices, Shanxi University, Taiyuan 030006, China
2
Collaborative Innovation Center of Extreme Optics, Shanxi University, Taiyuan 030006, China
*
Authors to whom correspondence should be addressed.
Photonics 2025, 12(2), 169; https://doi.org/10.3390/photonics12020169
Submission received: 24 January 2025 / Revised: 15 February 2025 / Accepted: 17 February 2025 / Published: 19 February 2025
(This article belongs to the Special Issue Thermal Radiation and Micro-/Nanophotonics)

Abstract

:
Dynamic manipulation of light in optical fibers has attracted extensive interest due to its compatibility with various fiber-optic systems. The integration of two-dimensional (2D) materials on the surface of optical fibers is an effective method to manipulate light beams. However, it is still a huge challenge to acquire dynamic modulation for light signals in fiber. In this work, we develop electrically manipulable in-line multilayer graphene (MLG) devices by integrating a graphene-based lithium-ion (Li-ion) battery on a side-polished fiber. Through charge and discharge processes with a current of 400 µA, the output power of a 1550 nm laser can be cyclically tuned in the range of ~120 and ~240 µW with a response time of about 1.8 min. After 100 cycles of testing, the modulation power of the laser system remains nearly unchanged, exhibiting good stability. The optical modification of MLG is due to the shift of Fermi energy (Ef), which results from charge transfer between Li and graphene layers. Therefore, the light in the fiber can be modulated due to the change in the optical absorbance of MLG. Our findings imply potential value in fabricating fiber-intergraded 2D intercalation materials with high tunability.

1. Introduction

The integration of two-dimensional (2D) materials with optical fibers for signal modulation has emerged as a prominent research direction because of its significant advantages, including high modulation efficiency, fast response time, microminiaturization, and so on [1,2,3,4]. For instance, integrating black phosphorus and optical fiber leads to stable mid-infrared laser signals with Q-switched and mode-locked pulse characteristics [5,6,7]. Similarly, the tapered fiber coated by a molybdenum disulfide composite membrane was adopted to construct a novel Mach–Zehnder interferometer, and the blueshift spectra and excellent linearity were presented with the increasing hydrogen sulfide concentration [8].
Graphene, owing to its excellent dynamic tunability and ultra-wideband optical response, exhibits tremendous potential in optical fiber signal modulation [9,10,11,12,13]. Chen et al. have deposited graphene onto the surface of photonic crystal fibers to construct a hybrid photonic crystal fiber structure, achieving dynamic modulation depth at a low threshold value [14,15]. Graphene film was also transferred to the surface of D-shaped fiber for terahertz modulation, which exhibited fast optical switching times and dynamic spectral tuning [16,17]. These works have presented the great potential of graphene in the field of optical fiber modulation. However, due to the limited thickness of graphene (~0.34 nm) and its low density of states in the energy band structure, its optical modulation depth remains relatively low. Enhancing the modulation capability of graphene in optical fibers remains a pressing challenge.
An effective way to enhance light-matter interactions of graphene is to increase the number of graphene layers [18,19,20,21,22]. Ashok Kumar et al. find that the absorbance of graphene followed the function of the number of layers, which suggests that integrating thick graphene layers with optical fibers could significantly improve their optical modulation performance [23]. Conventional approaches, such as heterojunctions, chemical doping, and gate voltage modulation, are generally effective only for single or bilayer graphene, making it challenging to modulate the band structure of multilayer graphene [24,25,26,27,28]. Compared to this method, electrochemical intercalation has the advantages of large modulation depth and reversible circulation [29]. Graphene has high electrical conductivity, excellent mechanical stability, and weak van der Waals gap interlayer [25,29], which indicates graphene is suitable as a host material. Lithium has a small ionic size, high mobility, and high electrochemical activity, suggesting that lithium is a good guest material [25,29]. Many researchers have shown the tunable optical properties of graphene by intercalation. For example, Hu et al. have reported that lithium-ion intercalation can regulate electronic properties of graphene, achieving a maximum Fermi level modulation depth of 1.5 eV in multilayer graphene structure [29]. Yu et al. have also investigated the tunable optical properties of multilayer graphene in the infrared range using lithium-ion intercalation methods [30]. Inspired by these findings, we propose utilizing a lithium battery-structured device for optical signal modulation, leveraging the advantages of lithium-ion intercalation to modulate multilayer graphene effectively.
In this study, a Li multilayer graphene intercalation compound (LiGIC) is prepared by electrochemical reaction. In-situ optical and electrical measurements, such as Raman spectroscopy, absorbance spectroscopy, X-ray diffraction (XRD), and resistance test, are employed to characterize MLG before and after lithium (Li) intercalation. The suppression of the intrinsic 2D peak in the Raman spectra and a remarkable reduction in resistance indicates the Ef shift of MLG due to the loss of electrons of Li and transfer to graphene layers. Meanwhile, decreased optical absorbance is observed during the Li intercalation process. Therefore, we integrate the graphene-based lithium-ion battery into a side-polished fiber system to control the output power. Through charge and discharge processes with a current of 400 µA, the output power can be reversibly modulated between ~120 µW and ~240 µW. The response time is about 1.8 min. Meanwhile, the device shows a recyclable optical response during 100 cycles. Our results open a new possibility of 2D intercalation compounds for active laser modulators.

2. Experiments

2.1. Materials

MLG was grown on a nickel substrate using chemical vapor deposition (CVD) and provided by Six Carbon Technology (Shenzhen, China). The MLG sample was cut into 1 × 1 cm squares and covered with a 3 × 3 cm polyethylene (PE) film that was 80 μm thick. Thermal pressing was performed at 100 °C for about 30 s to ensure the MLG fully adhered to the film’ s surface. Then, the sample was floated on a saturated FeCl3 solution for nickel substrate etching. After 3 h of etching, the sample was transferred to deionized water and rinsed three times. Next, the sample was dried in a vacuum oven for 8 h. As for the preparation of cathode materials, Li-NMC (LiNiMnCoO2, 5:3:2), super-Li, and polyvinylidene fluriode (PVDF) with an 8:1:1 weight ratio was ground for 2 h. Then, N-methylpyrrolidone (NMP) solvent was added, and the mixture was stirred with a magnetic stirrer for 24 h to ensure uniform mixing. The mixed slurry was evenly coated on aluminum foil using a film applicator and dried in a vacuum oven for 12 h.

2.2. Device Fabrication for Characterization

The cathode material with a size of 1.2 × 1.2 cm was fixed onto PDMS (polydimethylsiloxane) and wetted with electrolyte. A polyethylene (16-μm-thick) membrane as a separator was then placed on top of the cathode material, and an additional electrolyte was added to ensure that the membrane was fully saturated. Next, a thermally pressed MLG film was placed over the top layer. Finally, these materials were placed between two PE films and sealed using thermal adhesive. Both the cathode material and anode MLG used Al foil as a current collector. The entire fabrication process was conducted in an argon-filled glove box [Super (1220/750/900), MIKROUNA, Shanghai, China] to prevent oxidation.

2.3. Device Fabrication for Laser Power Modulation

D-shaped fiber fixed on a glass substrate was purchased from Micro Photons Technology Co., Ltd. (Shanghai, China), with a depth of 6 μm and a length of 10 mm. The side-polished surface was wiped with acetone, followed by an ultrasound for 5 min in ultrapure water. Then, a freestanding MLG film was wet transferred on the side-polished surface of the optical fiber. To move residual water and enhance the adhesion between MLG and the side-polished surface, the MLG on the optical fiber was dried for 12 h in a 65 °C oven. After that, the device was fabricated inside a glovebox filled with an argon atmosphere. A membrane stored with electrolyte, Li-NMC, and PE film was placed on the top of MLG, respectively. Finally, the device was encapsulated with the Kapton tape.

2.4. Sample Characterization

The Raman measurements were conducted using a continuous-wave laser with a wavelength of 532 nm, and the emitted signals were collected and analyzed by a spectrometer. A microscope objective with ×50 magnification was selected to focus the laser through the top polyethylene film onto the surface of the MLG film. The resistance of the graphene film before and after intercalation was measured using the four-point probe method (Keithley 2602B, Mdevicet, Suzhou, China). XRD testing was performed by an X-ray photoelectron spectrometer (Panalytical Aeris Research) with a scanning angle range of 5° to 60°, a step size of 0.02°, and a scanning time of 10 min per sample. The electrochemical performance of the device was analyzed using an electrochemical workstation (Octostat200, Tianjin Brillante Technology Limited, Tianjin, China). The absorbance was tested using a spectrophotometer (PerkinElmer, Lambda1050+, PerkinElmer, Waltham, MA, USA), with a wavelength range of 1000–2000 nm.

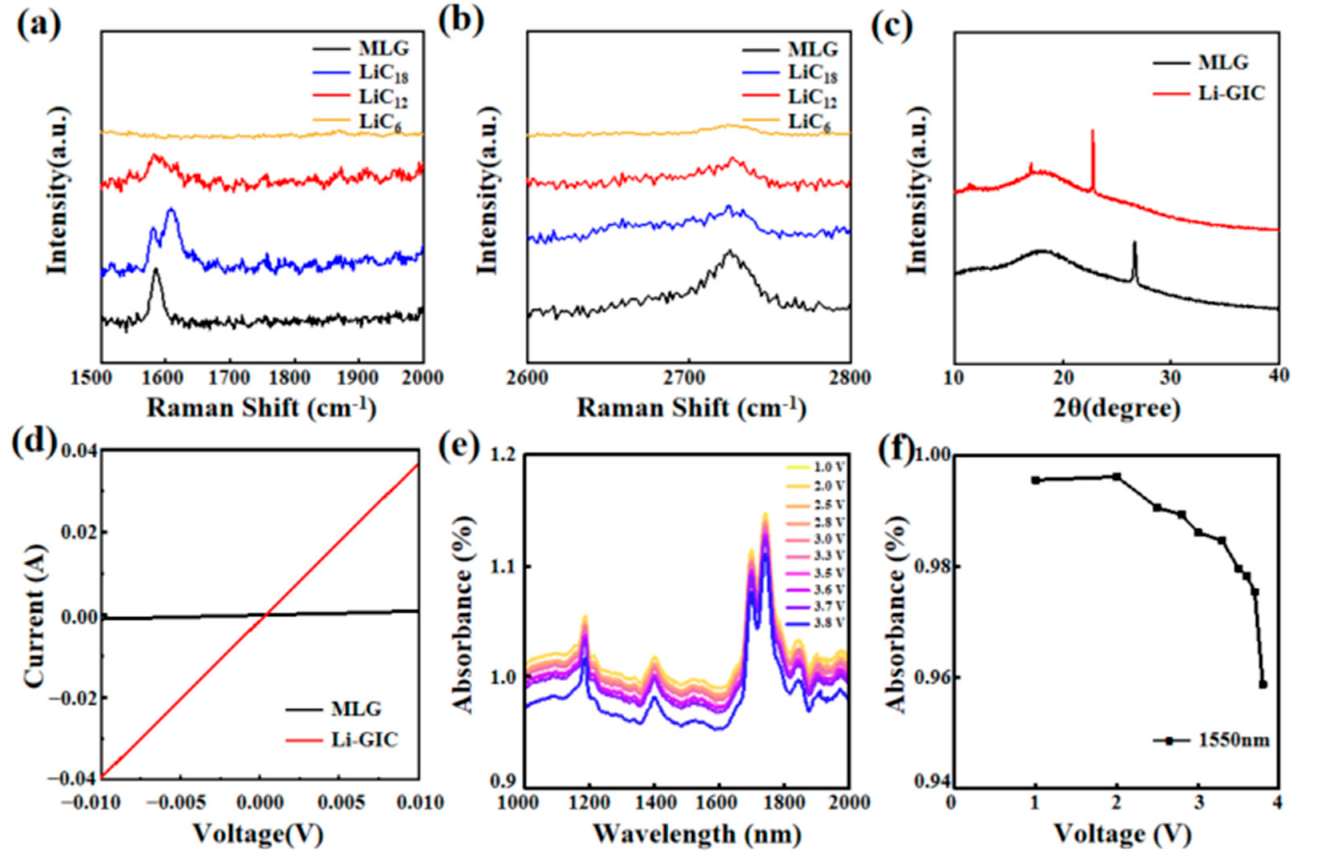
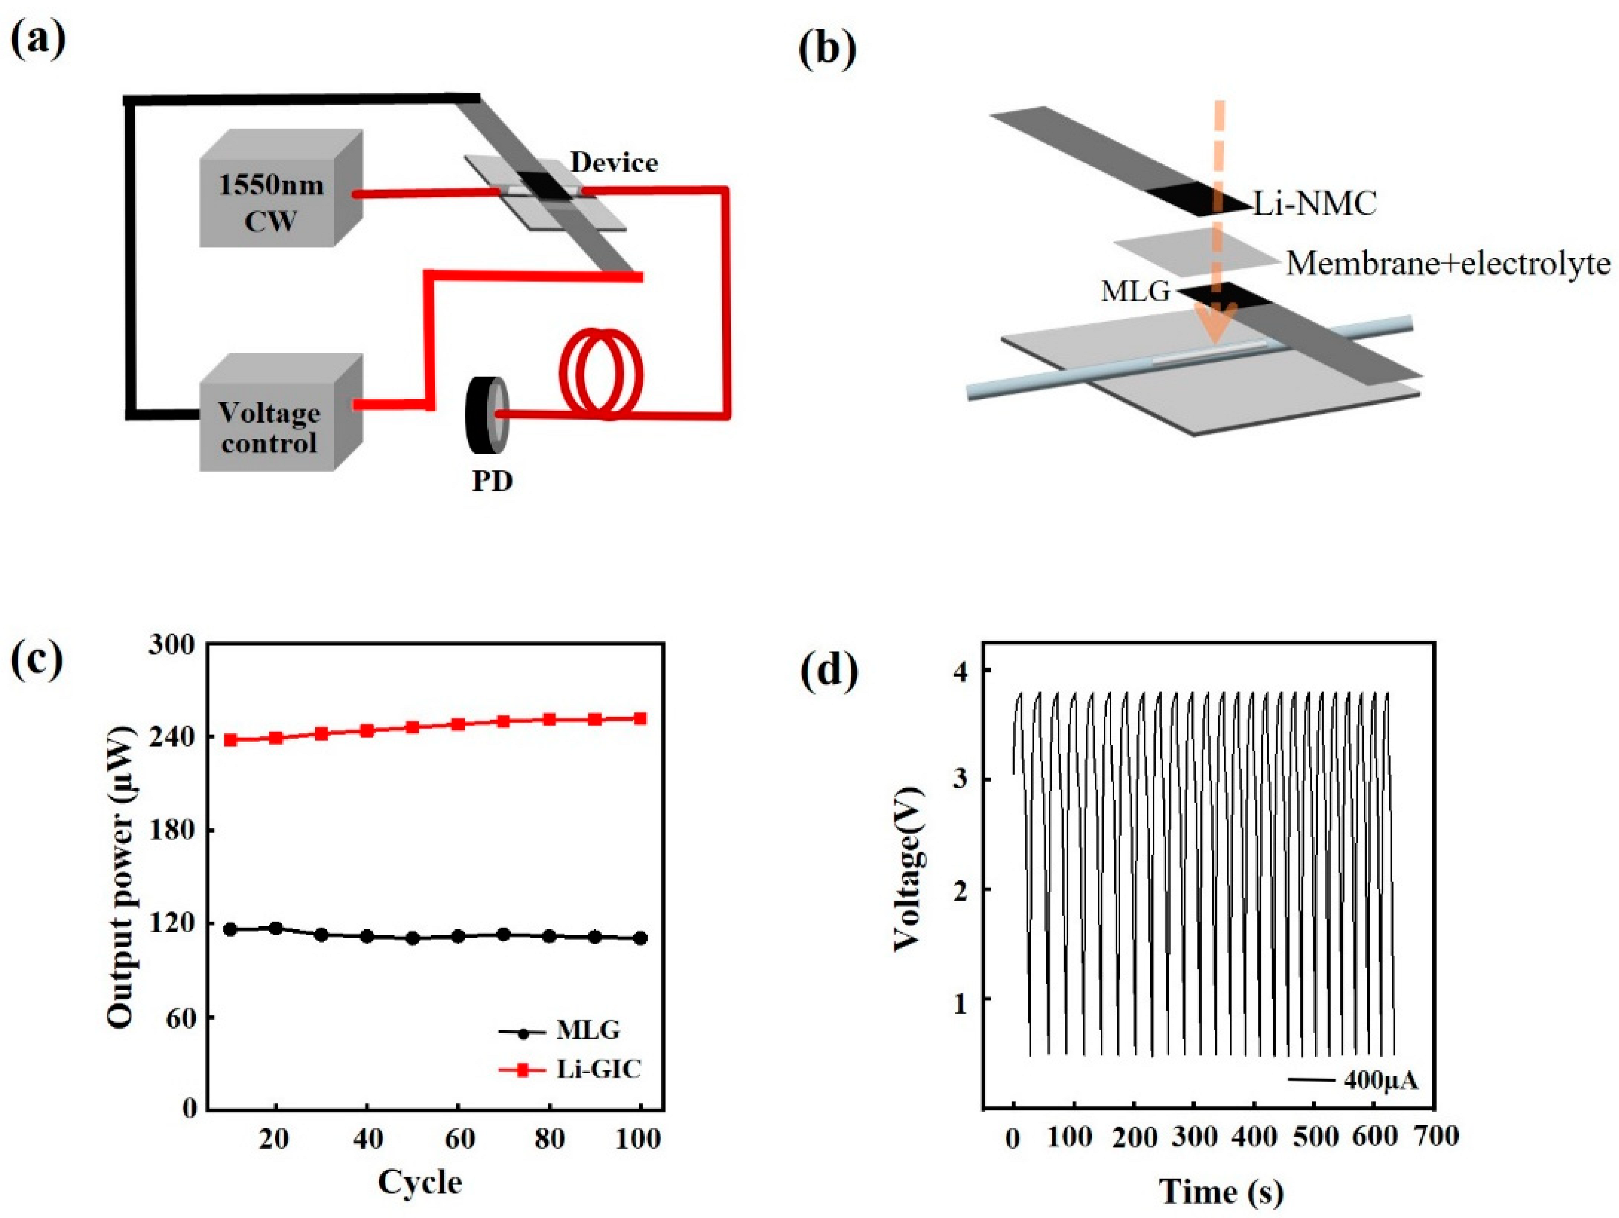
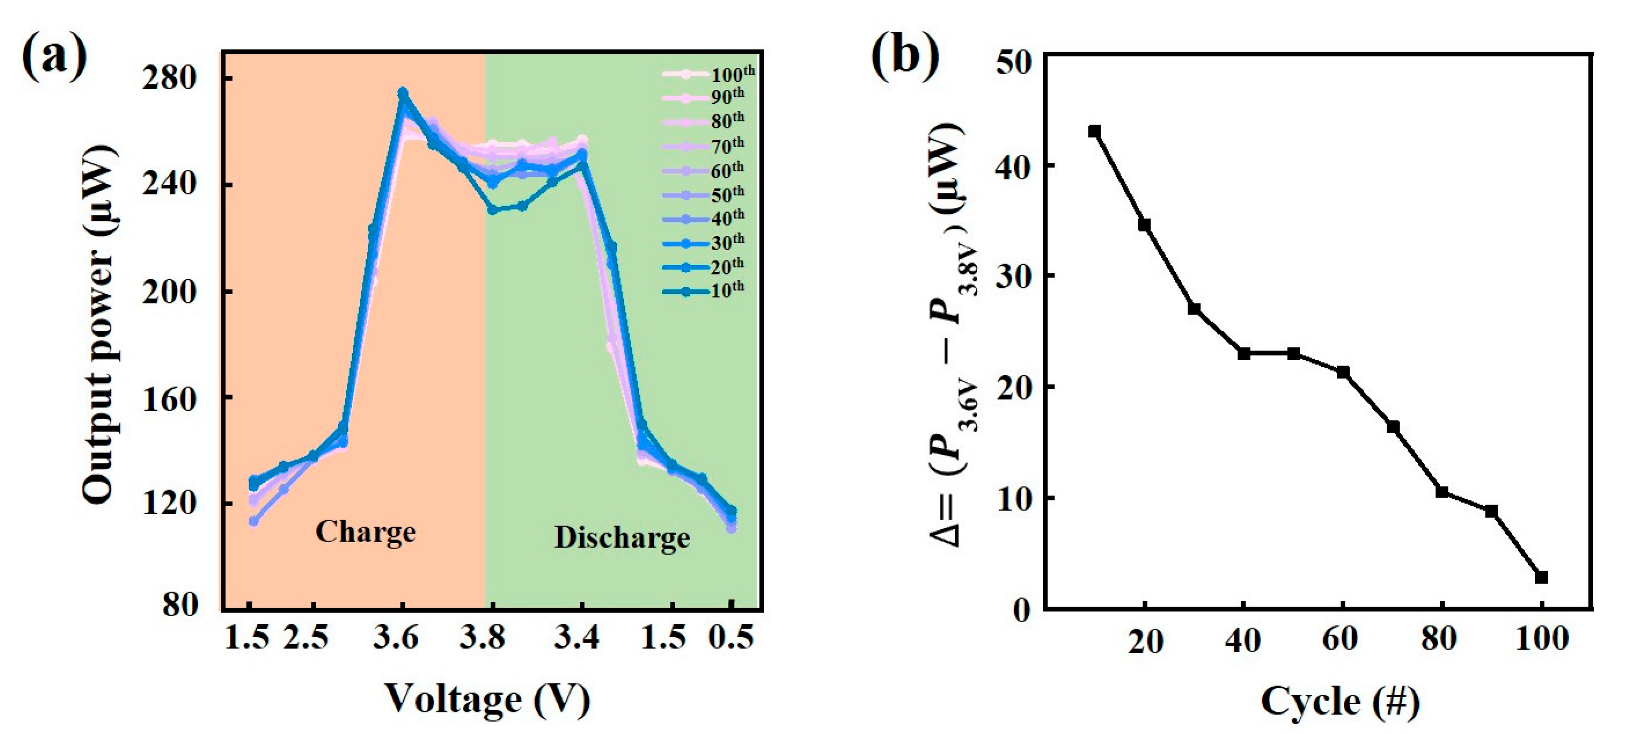
3. Results and Discussion

To simultaneously characterize the optical and electrical properties of MLG with Li intercalation, we design an electrochemical cell with a sandwich structure, as illustrated in Figure 1a. The electrolyte (LiPF6 in ethylene carbonate/diethyl carbonate, w/w = 1:1) is reserved in a polyethylene (PE) battery separator, which is placed between cathode Li-NMC and anode MLG. Two polyethylene films (80-μm-thick) with a Kapton tap are used to seal the device to prevent oxidation [31]. Figure 1b illustrates the working principle of this device. During charge process, Li-ions intercalate into the graphene interlayer and the electrons come to the graphene layers, which results in an Ef upshift of MLG as shown in Figure 1c. The path of Li-ions is the internal circuit of battery passing cathode Li-NMC, electrolyte, and anode MLG, respectively. The path of electrons is the external circuit of battery passing cathode Li-NMC, wire, and anode MLG, respectively. As for the discharge process, the Li-ions and electrons go back the same way to the cathode and form Li-NMC, which makes the Ef of MLG return to the Dirac point. Figure 1d,e are the typical charge voltage profiles of MLG with a constant current of 50 µA. Before 2.75 V, the voltage rises rapidly. Between 2.75 V and 3.59 V, the decomposition of organic electrolyte solution and the formation of solid electrolyte interphase allows an obvious slope change to be observed in the voltage profile. When obvious voltage plateaus appear in the voltage profile, the color of the MLG begins to change. From 3.52 to 3.68 V, 3.68 to 3.72 V, and 3.72 to 3.80 V, the color of gray changes to dark blue, dark red, and yellow, respectively, as their optical image in Figure 1f. Based on previous research, the dark blue, dark red, and yellow correspond to LiC18, LiC12, and LiC6, respectively [32,33,34].
Intercalation stages are defined as the ratio of host layers to guest layers. One, two, or three graphene layers sandwiched between the two layers of Li intercalant are referred to as stage 1, stage 2, and stage 3 of Li-GIC, respectively. The formation structure of Li-GIC with different colors is characterized by Raman spectroscopy, as shown in Figure 2a,b. The black line depicts the Raman spectrum of MLG, with the G peak at 1583.9 cm−1 and the 2D peak at 2725.1 cm−1. The result is similar to a previous study [35]. As for the Li-GIC with a dark blue color (blue line), the G peak splits into two peaks located at 1580.1 cm−1 and 1608.3 cm−1. The peak of 1580.1 cm−1 shows a redshift, which is due to the interior layer mode influenced by the combined effects of biaxial tensile strain. The peak of 1608.3 cm−1 appears to have a blue-shift, which is due to the boundary layer mode influenced by the charge transfer. The peak of 1608.3 cm−1 shows a stronger intensity compared with the peak of 1580.1 cm−1, which indicates a dominant boundary layer mode and corresponds to stage 3 (LiC18). For the Li-GIC with a dark red color (red line), two G peaks evolve a broad peak, and a decreased intensity is observed in both the G peak and the 2D peak. This represents the formation of the stage 2 intercalation compound (LiC12). For the Li-GIC with the yellow color (yellow line), the disappearance of the G peak and 2D peak corresponds to the formation of stage 1 (LiC6). This is due to the strong doping by charge transfer from Li to the graphene layer. Therefore, the inter-band optical transition is Pauli-blocked, and there is no resonant Raman process. Our Raman spectra measurements for Li-GIC agree well with previous studies [32,34,36,37].
In addition, we conduct X-ray diffraction (XRD) and transport measurements to characterize the MLG before and after Li intercalation. XRD spectra show in Figure 2c. The MLG represents a black curve, with the main diffraction peak at 2θ ≈ 26.5°. After Li intercalation (red curve), the characteristic peak’s position appears at 23.0°, and the intrinsic graphite peak eventually disappears. Our results are similar to the previous study, and the Li-GIC corresponds to LiC6 [38]. According to Bragg’s law (nλ = 2d × sinθ), the shift in peak position implies the increase in the interlayer distance (d) between graphene layers, where d, θ, n, and λ represent interplanar spacing, the angle between the incident X-rays and the crystal planes, the diffraction order, and the wavelength, respectively [31,39]. The angle of MLG before intercalation is 26.5°, corresponding to an interlayer distance of 0.34 nm. After intercalation, the peak shifted to 23.0°, corresponding to an interlayer distance of 0.37 nm. The calculated increase in interlayer spacing is consistent with the presence of Li atoms between graphene layers [40]. The four-point probe sheet resistance measurement is shown by the I−V curves in Figure 2d. Before Li intercalation (black line), the sheet resistance of MLG is 32.16 Ω/sq. After Li intercalation (red line), the materials resistance dropped to 1.05 Ω/sq. This result implies that Li loses electrons and transfers them into graphene layers. Actually, many research shows that intercalation is an effective method to reduce the resistance of materials [40].
The absorbance spectra in the range of 1000 to 2000 nm is measured during Li intercalation process, as shown in Figure 2e. During the charge process, the absorbance spectrum shows a reduction as a whole. From the initial 1.0 to 3.7 V, two obvious peaks at the wavelength of 1698 nm and 1740 nm, the absorbance reduces from 1.11% to 1.09% and 1.14% to 1.12%, respectively. When charged to 3.8 V, the absorbance reduces to 1.07% (1698 nm) and 1.07% (1740 nm). The decreased absorbance indicates the charge transfer from Li atoms to graphene layers and the upshift of the Ef. The increase in the Ef leads to the suppression of inter-band optical transitions with photon energy ω < 2Ef due to Pauli blocking, thereby decreasing the optical conductivity [3]. Figure 2f extracts the absorbance at 1550 nm during charge process. The absorbance of the MLG samples is almost unchanged for voltages less than 2 V. From 2 to 3.7 V, a gradual change in the absorbance is observed from 0.99% to 0.97%, presumably due to the formation of LiC18 and LiC12 (Figure 1e). From 3.7 to 3.8 V, the absorbance shows an obvious change from 0.97% to 0.96% because of the formation of LiC6 (Figure 1e).
To manipulate the light in the fiber, we integrated the graphene-based Li-ion battery into a fiber laser system, as depicted in Figure 3a,b, with its optical image shown in Figure S1. The light source is a continuous-wave laser with a central wavelength of 1550 nm. The light emitted from the laser is transmitted through the side-polished fiber and modulated by the electrochemical intercalation device, with the output light intensity recorded by the power meter. Through the charge and discharge processes, the output power of the laser can be controlled reversibly, as shown in Figure 3c. The black and red lines represent the output power with no intercalation (measured at 0.5 V) and with intercalation (measured at 3.8 V), respectively. For 100 cycles, the output power of the laser shows at ~120 µW with no intercalation and ~240 µW with intercalation, exhibiting good cyclic stability. Figure 3d shows the relationship between the response time and voltage. During the charge and discharge processes, with a current of 400 µA, the response time is about 1.8 min. After 100 cycles of testing, the modulation range remains nearly unchanged, demonstrating the good stability of the device. For other currents, the outpower and response time are shown in Figure S2. In addition, we exclude the effects of Li-NMC, electrolytes, and membranes on the modulation performance, and relevant experiments and detailed analysis are shown in Figure S3 [41,42,43].
Figure 4a shows the output power of the laser during the multiple charges (orange area) and discharge (green area) process. During the charge process, the output power increases from 1.5 to 3.6 V but reduces from 3.6 to 3.8 V. As more Li-ions intercalate between graphene layers, the interlayer distance increases from 0.34 nm for MLG to 0.37 nm for LiC6 (Figure 2c), which causes a slight volume expansion of material and implies an enhanced contact between the side-polished optical fiber and the graphene material. Relevant research shows that the improved contact facilitates the interaction between light and the material [44,45]. Therefore, during the charge processes, optical absorption efficiency of material will have a positive effect due to the enhanced contact because of the increased interlayer distance, but causes a negative effect because of the reduced optical absorbance (Figure 2e,f). From 1.5 to 3.6 V during the charge process, the reduced optical absorbance shows dominant influence, and thus, the output power of the optical fiber is enhanced. From 3.6 to 3.8 V during the charge processes, the enhanced contact between optical fiber and MLG plays a dominant role, and thus, the output power of the optical fiber is reduced. Figure 4b is the difference of output power between at 3.6 V and 3.8 V, extracted from Figure 4a. As the number of charge and discharge cycles increases, the difference of output power is reduced from 43 to 2.8 µW. Relevant research shows that the Li-ion battery will suffer a gradual capacity attenuation as the number of charges and discharges increases. Therefore, the amount of Li-ion intercalation into the graphene layer is reduced after multiple cycles, which indicates the formation of the Li-GIC may not be enough intercalation to LiC6, and the volume expansion of material is also reduced [46]. Thus, it will cause a degradation in contact between the side-polished optical fiber and the graphene material, which will result in a decline in optical absorption efficiency of material. After multiple charge and discharge processes, the influence between optical absorbance and contact becomes proximity, which makes output power remain almost unchanged, as shown in the voltage from 3.6 to 3.8 V during the 100th charging process in Figure 4a. Compared to the charge processes, a similar reversible change of output power is observed during discharge processes, as shown in Figure 4a. This is because the contact between optical fiber and the material changes reversibly. In summary, we demonstrate the control of the output power of a 1550 nm wavelength laser by integrating a graphene-based Li-ion battery on a side-polished fiber. Through a charge and discharge process with a current of 400 µA, the output power range is tuned from ~120 to ~240 µW, and the response time is about 1.8 min. Meanwhile, the graphene-based optoelectronic device shows good repeatable performance after 100 cycles. This modulation mechanism is attributed to the increase of Ef due to the charge moving from Li to graphene layers, directly influencing its optical and electrical properties. Our study reveals electrochemical intercalation is an efficient method to modulate laser power.

4. Conclusions

In summary, we demonstrated the control of the output power of a 1550 nm wavelength laser by integrating a graphene-based Li-ion battery on a side-polished fiber. Through a charge and discharge process with a current of 400 µA, the output power range was tuned from ~120 to ~240 µW, and the response time was about 1.8 min. Meanwhile, the graphene-based optoelectronic device showed good repeatable performance after 100 cycles. This modulation mechanism was attributed to the increase of Ef due to the charge move from Li to graphene layers, directly influencing its optical and electrical properties. Our study reveals that electrochemical intercalation is an efficient method to modulate laser power and has potential applications for fiber communication systems.

Supplementary Materials

The following supporting information can be downloaded at: https://www.mdpi.com/article/10.3390/photonics12020169/s1. Figure S1. Optical photographs of Fiber laser integrated a graphene-based Li-ion battery with front surface (a) and back surface (b). Figure S2. (a) Response time at the current of 100, 200, 300, and 400 μA. (b) Outpower modulation performance at the current of 100, 200, 300, and 400 μA. Figure S3. (a) Micrograph of the side-polished surface of optical fiber. (b) Micrograph of the side-polished surface of optical fiber after slight radial rotation. (c) Output power during the charge and discharge process at the current of 80 and 100 μA. The side-polished surface of optical fiber undergoes a slight radial rotation. Figure S4. Typical voltage profile of MLG during 25th to 100th charge and discharge cycles, with a constant current of 400 μA. (a) 25th to 50th, (b) 50th to 75th, (c) 75th to 100th.

Author Contributions

Validation, Z.F.; writing—original draft preparation, Z.F.; writing—review and editing, G.Z. and C.Q.; supervision, G.Z., Z.F., C.Q., Y.L., Z.W., L.X., and S.J.; project administration, G.Z.; funding acquisition, G.Z., L.X., and C.Q. All authors have read and agreed to the published version of the manuscript.

Funding

This study was financially supported by National Natural Science Foundation of China (NSFC) (Grant Nos. 62305200, U22A2091, 62127817, and 62075240), the National Key R&D Program of China (2022YFA1404201), and Fundamental Research Program of Shanxi Province (202203021222001).

Institutional Review Board Statement

Not applicable.

Informed Consent Statement

Not applicable.

Data Availability Statement

Data underlying the results presented in this paper are not publicly available at this time but may be obtained from the authors upon reasonable request.

Conflicts of Interest

The authors declare no conflicts of interest.

References

  1. Fu, Y.; Hansson, J.; Liu, Y.; Chen, S.; Zehri, A.; Samani, M.K.; Wang, N.; Ni, Y.; Zhang, Y.; Zhang, Z.-B.; et al. Graphene related materials for thermal management. 2D Mater. 2019, 7, 012001. [Google Scholar] [CrossRef]
  2. Li, X.; Li, B.-H.; He, Y.-B.; Kang, F.-Y. A review of graphynes: Properties, applications and synthesis. New Carbon. Mater. 2020, 35, 619–629. [Google Scholar] [CrossRef]
  3. Lin, L.; Deng, B.; Sun, J.; Peng, H.; Liu, Z. Bridging the Gap between Reality and Ideal in Chemical Vapor Deposition Growth of Graphene. Chem. Rev. 2018, 118, 9281–9343. [Google Scholar] [CrossRef]
  4. Naumis, G.G.; Barraza-Lopez, S.; Oliva-Leyva, M.; Terrones, H. Electronic and optical properties of strained graphene and other strained 2D materials: A review. Rep. Prog. Phys. 2017, 80, 096501. [Google Scholar] [CrossRef] [PubMed]
  5. Hua, K.; Wang, D.N.; Chen, Q. Passively mode-locked fiber laser based on graphene covered single-mode fiber with inner short waveguides. Opt. Commun. 2022, 505, 127520. [Google Scholar] [CrossRef]
  6. Kowalczyk, M.; Zhang, X.; Mateos, X.; Guo, S.; Wang, Z.; Xu, X.; Loiko, P.; Bae, J.E.; Rotermund, F.; Sotor, J.J.O.E. Graphene and SESAM mode-locked Yb:CNGS lasers with self-frequency doubling properties. Opt. Express 2019, 27, 590–596. [Google Scholar] [CrossRef] [PubMed]
  7. Wang, R.; Liu, Y.; Jiang, M.; Xu, X.; Wu, H.; Tian, Y.; Bai, J.; Ren, Z. Passively Q-switched and mode-locked fiber laser research based on graphene saturable absorbers. Opt. Quantum Electron. 2017, 49, 137. [Google Scholar] [CrossRef]
  8. Liu, S.; Xu, S.; Guan, J.; Qiu, G.; Tong, Z.; Yang, M.; Wei, Z.; Tan, C.; Wang, F.; Meng, H. Interferometric fiber sensor for lead ion detection based on MoS2 hydrogel coating. Opt. Commun. 2024, 559, 130416. [Google Scholar]
  9. Chen, K.; Zhou, X.; Cheng, X.; Qiao, R.; Cheng, Y.; Liu, C.; Xie, Y.; Yu, W.; Yao, F.; Sun, Z.; et al. Graphene photonic crystal fibre with strong and tunable light–matter interaction. Nat. Photonics 2019, 13, 754–759. [Google Scholar] [CrossRef]
  10. Chen, R.; Liu, W.; Huang, G.; Wang, D.; Qin, X.; Feng, W. Hydrogen sulfide sensor based on tapered fiber sandwiched between two molybdenum disulfide/citric acid composite membrane coated long-period fiber gratings. Appl. Opt. 2018, 57, 9755–9759. [Google Scholar] [CrossRef] [PubMed]
  11. Hajiani, T.; Shirkani, H.; Sadeghi, Z. Surface plasmon resonance photonic crystal fiber biosensor: Utilizing silver-phosphorene nanoribbons for Near-IR detection. Opt. Commun. 2024, 569, 130801. [Google Scholar] [CrossRef]
  12. Qin, Z.; Xie, G.; Ma, J.; Yuan, P.; Qian, L. 28 μm all-fiber Q-switched and mode-locked lasers with black phosphorus. Photonics Res. 2018, 6, 1074–1078. [Google Scholar] [CrossRef]
  13. Wang, S.; Su, M.; Tang, L.; Li, X.; Li, X.; Bai, H.; Niu, P.; Shi, J.; Yao, J. Graphene-coated D-shaped terahertz fiber modulator. Front. Phys. 2023, 11, 1202839. [Google Scholar] [CrossRef]
  14. Bakhshi, A.; Jalaly, M.; Vahedi, M. The effect of GO–Fe3O4 hybrid coating on the magnetic field detection by a tapered optical fiber sensor. Opt. Fiber Technol. 2022, 74, 103134. [Google Scholar] [CrossRef]
  15. Zhang, J.Y.; Ding, E.J.; Xu, S.C.; Li, Z.H.; Wang, X.X.; Song, F. Sensitization of an optical fiber methane sensor with graphene. Opt. Fiber Technol. 2017, 37, 26–29. [Google Scholar] [CrossRef]
  16. Hou, L.; Bi, K.; Li, Q.; Zhang, S.; Guo, M.; Zhuang, Y.; Huang, D.; Zhang, S.; Han, S.; Mei, L. Terahertz absorption properties of different graphene layers based on the Salisbury effect. Opt. Express 2024, 32, 23907–23915. [Google Scholar] [CrossRef] [PubMed]
  17. Wu, D.; Sun, M.; Zhang, W.; Zhang, W. D-Shaped photonic crystal fiber with graphene coating for terahertz polarization filtering and sensing applications. Opt. Fiber Technol. 2023, 79, 103373. [Google Scholar]
  18. Qi, Z.; Zhu, X.; Jin, H.; Zhang, T.; Kong, X.; Ruoff, R.S.; Qiao, Z.; Ji, H. Rapid Identification of the Layer Number of Large-Area Graphene on Copper. Chem. Mater. 2018, 30, 2067–2073. [Google Scholar] [CrossRef]
  19. Wu, D.; Sun, M.; Zhang, W.; Zhang, W. Simultaneous Regulation of Surface Properties and Microstructure of Graphene Oxide Membranes for Enhanced Nanofiltration Performance. ACS Appl. Mater. Interfaces, 2023; Online ahead of print. [Google Scholar] [CrossRef]
  20. Yankowitz, M. Unravelling the magic of twisted trilayer graphene. Nat. Mater. 2023, 22, 286–287. [Google Scholar] [CrossRef] [PubMed]
  21. Zhang, Y.; Zhou, Y.Y.; Zhang, S.; Cai, H.; Tong, L.H.; Liao, W.Y.; Zou, R.J.; Xue, S.M.; Tian, Y.; Chen, T.; et al. Layer-dependent evolution of electronic structures and correlations in rhombohedral multilayer graphene. Nat. Nanotechnol. 2025, 20, 222–228. [Google Scholar] [CrossRef] [PubMed]
  22. Zhao, T.; Shu, H.; Shen, Z.; Hu, H.; Wang, J.; Chen, X. Electrochemical Lithiation Mechanism of Two-Dimensional Transition-Metal Dichalcogenide Anode Materials: Intercalation versus Conversion Reactions. J. Phys. Chem. C 2019, 123, 2139–2146. [Google Scholar] [CrossRef]
  23. Mak, K.F.; Ju, L.; Wang, F.; Heinz, T.F. Optical spectroscopy of graphene: From the far infrared to the ultraviolet. Solid State Commun. 2012, 152, 1341–1349. [Google Scholar] [CrossRef]
  24. Chen, C.; Li, N.W.; Wang, B.; Yuan, S.; Yu, L. Advanced pillared designs for two-dimensional materials in electrochemical energy storage. Nanoscale Adv. 2020, 2, 5496–5503. [Google Scholar] [CrossRef] [PubMed]
  25. Lin, Y.C.; Matsumoto, R.; Liu, Q.; Solis-Fernandez, P.; Siao, M.D.; Chiu, P.W.; Ago, H.; Suenaga, K. Alkali metal bilayer intercalation in graphene. Nat. Commun. 2024, 15, 425. [Google Scholar] [CrossRef] [PubMed]
  26. Zhao, W.; Tan, P.H.; Liu, J.; Ferrari, A.C. Intercalation of few-layer graphite flakes with FeCl3: Raman determination of Fermi level, layer by layer decoupling, and stability. J. Am. Chem. Soc. 2011, 133, 5941–5946. [Google Scholar] [CrossRef] [PubMed]
  27. Bonavolonta, C.; Vettoliere, A.; Pannico, M.; Crisci, T.; Ruggiero, B.; Silvestrini, P.; Valentino, M. Investigation of Graphene Single Layer on P-Type and N-Type Silicon Heterojunction Photodetectors. Sensors 2024, 24, 6068. [Google Scholar] [CrossRef] [PubMed]
  28. Di Gaspare, A.; Pogna, E.A.A.; Salemi, L.; Balci, O.; Cadore, A.R.; Shinde, S.M.; Li, L.; di Franco, C.; Davies, A.G.; Linfield, E.H.; et al. Tunable, Grating-Gated, Graphene-On-Polyimide Terahertz Modulators. Adv. Funct. Mater. 2020, 31, 2008039. [Google Scholar] [CrossRef]
  29. Bao, W.; Wan, J.; Han, X.; Cai, X.; Zhu, H.; Kim, D.; Ma, D.; Xu, Y.; Munday, J.N.; Drew, H.D. Approaching the limits of transparency and conductivity in graphitic materials through lithium intercalation. Nat. Commun. 2014, 5, 4224. [Google Scholar] [CrossRef]
  30. Li, B.; Zheng, L.; Gong, Y.; Kang, P. Intercalation-driven tunability in two-dimensional layered materials: Synthesis, properties, and applications. Mater. Today 2024, 81, 118–136. [Google Scholar] [CrossRef]
  31. Yu, X.; Bakan, G.; Guo, H.; Ergoktas, M.S.; Steiner, P.; Kocabas, C. Reversible Ionic Liquid Intercalation for Electrically Controlled Thermal Radiation from Graphene Devices. ACS Nano 2023, 17, 11583–11592. [Google Scholar] [CrossRef] [PubMed]
  32. Liu, X.; Yin, L.; Ren, D.; Wang, L.; Ren, Y.; Xu, W.; Lapidus, S.; Wang, H.; He, X.; Chen, Z.; et al. In situ observation of thermal-driven degradation and safety concerns of lithiated graphite anode. Nat. Commun. 2021, 12, 4235. [Google Scholar] [CrossRef] [PubMed]
  33. Zeng, G.; Zhang, R.; Sui, Y.; Li, X.; OuYang, H.; Pu, M.; Chen, H.; Ma, X.; Cheng, X.; Yan, W.; et al. Tunable Optical Display of Multilayer Graphene through Lithium Intercalation. ACS Appl. Mater. Interfaces 2023, 15, 53688–53696. [Google Scholar] [CrossRef] [PubMed]
  34. Zeng, G.; Zhang, R.; Sui, Y.; Li, X.; OuYang, H.; Pu, M.; Chen, H.; Ma, X.; Cheng, X.; Yan, W.; et al. Inversion Symmetry Breaking in Lithium Intercalated Graphitic Materials. ACS Appl. Mater. Interfaces 2020, 12, 28561–28567. [Google Scholar] [CrossRef] [PubMed]
  35. Wu, J.-B.; Lin, M.-L.; Cong, X.; Liu, H.-N.; Tan, P.-H. Raman spectroscopy of graphene-based materials and its applications in related devices. Chem. Soc. Rev. 2018, 47, 1822–1873. [Google Scholar] [CrossRef]
  36. Liang, T.; Peng, G.; Zhang, X.; Wei, Y.; Zheng, X.; Luo, W.; Dai, M.; Deng, C.; Zhang, X. Modulating visible-near-infrared reflectivity in ultrathin graphite by reversible Li-ion intercalation. Opt. Mater. 2021, 121, 111517. [Google Scholar] [CrossRef]
  37. Song, H.; Xie, H.; Xu, C.; Kang, Y.; Li, C.; Zhang, Q. In Situ Measurement of Strain Evolution in the Graphene Electrode during Electrochemical Lithiation and Delithiation. J. Phys. Chem. C 2019, 123, 18861–18869. [Google Scholar] [CrossRef]
  38. Yadegari, H.; Koronfel, M.A.; Wang, K.; Thornton, D.B.; Stephens, I.E.L.; Molteni, C.; Haynes, P.D.; Ryan, M.P. Operando Measurement of Layer Breathing Modes in Lithiated Graphite. ACS Energy Lett. 2021, 6, 1633–1638. [Google Scholar] [CrossRef]
  39. Ergoktas, M.S.; Bakan, G.; Steiner, P.; Bartlam, C.; Malevich, Y.; Ozden-Yenigun, E.; He, G.; Karim, N.; Cataldi, P.; Bissett, M.A.; et al. Graphene-Enabled Adaptive Infrared Textiles. Nano Lett. 2020, 20, 5346–5352. [Google Scholar] [CrossRef] [PubMed]
  40. Song, X.Y.; Kinoshita, K.; Tran, T.D. Microstructural Character-ization of Lithiated Graphite. J. Electrochem. Soc. 1996, 6, 120–123. [Google Scholar] [CrossRef]
  41. Muhammad, A.R.; Rusdi, M.F.; Jafry, A.A.A.; Markom, A.M.; Jusoh, Z.; Haris, H.; Harun, S.W.; Yupapin, P. Evanescent field interaction of 1550 nm pulsed laser with silver nanomaterial coated D-shape fiber. Infrared Phys. Technol. 2021, 119, 103920. [Google Scholar] [CrossRef]
  42. Zeng, L.Z.; Ou, Z.T.; Yang, H.Y. Sensitivity Improvement of Plasmonic Optical Fiber Sensors with Graphene-Metal Nanowire Array. Acta Opt. Sin. 2022, 42, 1906002. [Google Scholar]
  43. Zhang, W.; Wan, J.; Lie, M.; Luo, Y.; Guo, M. Microfluidic refractive index sensor with D-shape fiber and microtube coupling. Acta Phys. Sin. 2022, 71, 210701. [Google Scholar] [CrossRef]
  44. Wan, K.T. Quantitative Sensitivity Analysis of Surface Attached Optical Fiber Strain Sensor. IEEE Sens. J. 2014, 14, 1805–1812. [Google Scholar] [CrossRef]
  45. Zheng, X.; Shi, B.; Zhang, C.-C.; Sun, Y.; Zhang, L.; Han, H. Strain transfer mechanism in surface-bonded distributed fiber-optic sensors subjected to linear strain gradients: Theoretical modeling and experimental validation. Measurement 2021, 179, 109510. [Google Scholar] [CrossRef]
  46. Zhu, G.L.; Zhao, C.Z.; Huang, J.Q.; He, C.; Zhang, J.; Chen, S.; Xu, L.; Yuan, H.; Zhang, Q. Fast Charging Lithium Batteries: Recent Progress and Future Prospects. Small 2019, 15, e1805389. [Google Scholar] [CrossRef] [PubMed]
Figure 1. Device structure and working principle. (a) Schematic diagram of the device structure consisting of anode MLG film, PE separator soaked in electrolyte, and cathode Li-NMC. Two pieces of Al foil are the current collector for cathode and anode materials. (b) Demonstration of Li-ions and electrons behavior during charge and discharge processes. (c) Schematic diagram of the Ef of MLG before and after Li intercalation. (d) Electrochemical potential versus lithiation time of MLG during charge process. (e) Detail of voltage profile versus time corresponding to the curve in the red box of (d). (f) Optical images of MLG, LiC18, LiC12, and LiC6, respectively.
Photonics 12 00169 g001
Figure 2. Characterization of MLG and Li-intercalated MLG. (a,b) Raman spectra of MLG and Li-GIC at different stages. (c) XRD test of MLG before (black line) and after intercalation (red line). (d) Four-probe I versus V curves for MLG before (black) and after intercalation (red line). (e) The absorbance spectra as a function of wavelength for MLG at different electrochemical potentials. (f) The absorbance at 1550 nm wavelength as a function of electrochemical potential versus Li/Li+.
Photonics 12 00169 g002
Figure 3. (a,b) Fiber laser system configuration includes a graphene-based Li-ion battery. (c) The output power of the laser corresponds to intercalation (red line) and no intercalation (black line) during 100 charge and discharge cycles. The current is 400 µA during the charge and discharge process. (d) Typical voltage profile of MLG during the first 25th charge and discharge cycles, with a constant current of 400 µA. The other voltage profile of MLG during the first 25th to 100th charge and discharge cycles is shown in Figure S4.
Photonics 12 00169 g003
Figure 4. (a) The output power of a laser during charge (orange area) and discharge (green area) for the 10th, 20th, 30th, 40th, 50th, 60th, 70th, 80th, 90th, and 100th cycles, respectively. The current is 400 µA during the charge and discharge process. (b) The difference of output power vs. the number of cycles. The difference of output power between 3.6 V and 3.8 V is extracted from (a).
Photonics 12 00169 g004
Disclaimer/Publisher’s Note: The statements, opinions and data contained in all publications are solely those of the individual author(s) and contributor(s) and not of MDPI and/or the editor(s). MDPI and/or the editor(s) disclaim responsibility for any injury to people or property resulting from any ideas, methods, instructions or products referred to in the content.

