Article

Liouvillian Superoperator and Maxwell–Bloch Dynamics Under Optical Feedback via the Self-Mixing Effect in Terahertz Quantum Cascade Lasers

1
School of Electronic and Electrical Engineering, University of Leeds, Leeds LS2 9JT, UK
2
School of Electrical Engineering and Computer Science, The University of Queensland, Brisbane, QLD 4072, Australia
3
School of Mathematics and Physics, The University of Queensland, Brisbane, QLD 4072, Australia
*
Author to whom correspondence should be addressed.
Photonics 2025, 12(11), 1134; https://doi.org/10.3390/photonics12111134
Submission received: 13 September 2025 / Revised: 23 October 2025 / Accepted: 27 October 2025 / Published: 17 November 2025
(This article belongs to the Special Issue Quantum Cascade Lasers: Recent Progress and Novel Applications)

Abstract

We present a Maxwell–Bloch dynamics model for Terahertz Quantum Cascade Lasers (THz QCLs) that integrates a density matrix transport model, independent of the number of states per QCL period, with the Maxwell wave equation under the slow-varying envelope approximation. This model is extended to include external homodyne feedback, generalizing the Lang–Kobayashi model typically used for diode lasers. Unlike previous approaches, our model allows for the simulation of the self-mixing (SM) effect in THz QCLs without the need for effective parameters, commonly used in diode laser models. We demonstrate the model’s ability to capture laser dynamics and analyze the SM effect through numerical simulations. The model enables us to evaluate the quality of THz QCL designs for SM applications, which is not possible with effective two-level treatment via the Lang–Kobayashi approach.

1. Introduction

Optical feedback interferometry through the self-mixing effect (SM) is a specialized sensing technique in which a small portion of the laser’s emitted radiation is re-injected into the cavity via an external mirror. This re-injected light interferes with the original beam, causing a perturbation in key laser characteristics, such as threshold gain, optical power, lasing frequency, and terminal voltage. By analyzing the perturbed response of the system, it becomes possible to study both the properties of the re-injected light and the external target. Essentially, this effect serves as a highly sensitive modulation tool, making it invaluable for advanced imaging and sensing applications.
The SM effect has been explored in nearly all types of lasers, including gas masers [1,2], semiconductor diode lasers [3,4,5], solid-state lasers [6,7,8], fiber lasers [9,10], fiber ring lasers [11,12], quantum cascade lasers [13,14,15,16,17,18,19], and interband cascade lasers [20]. A key advantage of this method is that it allows the same device to function both as the light source and the detector. This feature is particularly important in terahertz laser feedback interferometry (LFI) applications, where detector availability is often limited.
Terahertz quantum cascade lasers (THz QCLs) [21,22,23] are cutting-edge light sources operating in the typically underexplored far-infrared region of the spectrum. These structures maintain population inversion between lasing levels at scales as small as ∼10 meV, enabling frequency operation in the range of 1.2–5.7 THz [24,25,26,27], delivering high power performance [28], and operating at temperatures of up to 261 K in pulsed operation [29] and 129 K in continuous wave (CW) operation [30], without requiring an external magnetic field. Terahertz technology has found applications in various fields, such as medical diagnostics, free-space communications, and chemical sensing [31,32,33,34,35], as well as imaging via the self-mixing (SM) effect [15,16,17,18,36,37,38,39,40,41,42].
The most prominent model for the SM effect is the Lang–Kobayashi (LK) model [43], which combines a simplified Maxwell equation with an effective two-level rate equation that accounts for carrier transport within the lasing medium. However, the carrier transport in THz QCLs is significantly more complex. Several models have been proposed [44], each differing in numerical complexity and the extent to which quantum effects are considered. Semi-classical rate-equation (RE) approaches [45] are often the simplest, though they neglect coherence effects and quantum mechanical dephasing, which can lead to non-physical results when applied to THz QCLs [46]. Coherent quantum models, such as non-equilibrium Green’s function (NEGF) methods [47,48], provide detailed insight into quantum effects but suffer from high computational costs. Density matrix (DM) approaches [46,49,50,51,52,53] offer a balanced solution by extending RE models to include coherent effects while maintaining relatively low computational overhead.
These models typically account for various non-radiative interactions of electrons with alloy disorder (AD), longitudinal optical (LO) phonons, acoustic (AC) phonons, ionized impurities (II), interface roughness (IFR), and other electrons (EE). These scattering mechanisms are often treated using perturbation theory through the Fermi-golden rule [54], although more general treatments are possible within the DM [55], Wigner function [56], and NEGF frameworks.
The dynamics of various types of lasers are often modeled by coupling the Maxwell wave equation to a rate equation transport model [57] or a density matrix model [58], typically considering only a few lasing states [59]. The dominant model for the self-mixing effect, known as the Lang–Kobayashi (LK) model [43], was originally developed for diode lasers. This model employs only two lasing levels and a phenomenological medium polarization model that linearizes the material gain dependence on carrier concentration.
When such an approach is applied to more complex laser systems, such as terahertz quantum cascade lasers, where designs may involve over ten quasi-bound levels, two key issues arise: (i) reducing the quantum system to two effective lasing levels, and (ii) determining the parameters initially derived for diode lasers, which involve several approximations. This results in the creation of hybrid, device-specific models [40,41]. Consequently, there exists a gap in our understanding of how active media, which differ significantly from laser diodes, undergo the SM effect.
The general framework for laser dynamics in THz QCLs does exist. It combines the DM model and Maxwell wave equation, leading to the Maxwell–Bloch model. This methodology has been present in literature for a long time [60,61,62]; however, the key challenge is adjusting the superoperator of DM model for the laser system under consideration. The approach in [62] is a great example of high-detail modeling of dynamics, incorporating both spatial and temporal aspects of laser dynamics, where the drawback is a high computational cost.
The Lang–Kobayashi (LK) model typically incorporates only the time-dependent Maxwell equation, where the focus is not on the buildup of the optical field inside the laser cavity, but rather on the properties of its time-dependent envelope. To the best of our knowledge, the slow-varying time-dependent envelope approach has mostly been applied to systems with only a few lasing states [58,59,61,63]. The coupling of a superoperator for a quantum cascade laser (QCL) system with N states, however, has not been previously explored in the context of the LK model. This is precisely the gap our work addresses.
In [49], we introduced the slow-varying envelope approximation for THz QCLs, coupling the density matrix to the Maxwell wave equation. However, this earlier work did not consider optical feedback, which is a critical component of the self-mixing (SM) effect. In this paper, we extend that framework by exploiting the Hermiticity of the density matrix to reduce the superoperator size, enhancing numerical efficiency. We then formulate the Maxwell equation under optical feedback from first principles, deriving a SM model that goes beyond the LK approach. This new model couples our density matrix approach to the Maxwell wave equation both with and without external feedback. Notably, our dynamical SM model is independent of the number of states per QCL period and does not rely on any effective parameter determination, unlike the traditional diode laser models. We analyze dynamics of several typical representative THz QCL structures, compare the SM model output to the experimental results and discuss the effect of THz QCL design on SM applications.

2. Theoretical Model

2.1. Transport Model

The Density Matrix (DM) models require solving the Liouville equation: i d ρ ^ d t = [ H ^ , ρ ^ ] + i D ^ , which involves the density matrix ρ ^ , the Hamiltonian H ^ , and the dissipator D ^ . The dissipator is introduced to account for processes not included in the system’s Hamiltonian but which cause coherent interactions between the basis states. It ensures that the density matrix remains positive and semi-definite, and its evolution is typically described by the master equation in Lindblad form [64,65,66,67]. The most common form of the dissipator used in laser systems is based on scattering rates derived from the Fermi-golden rule, expressed as D ^ = ρ ^ τ , where the scattering tensor 1 / τ satisfies the Lindblad master equation. It is worth noting that alternative dissipators, which consider carrier transport in a more general way, are also discussed in the literature [55].
In [46,49], we developed a DM model illustrated in Figure 1, which models a QCL as an infinite period quantum system where periods interact via the nearest-neighbor approximation, resulting in infinitely sized banded tridiagonal system Hamiltonian H and the corresponding dissipator D and density matrix ρ . When these infinitely large variables are plugged into Liouville equation, the underlying periodicity in the model reduces to a system of density matrix equations that correspond to different partitions of the system Hamiltonian [46,49]:
i d d t ρ 1 ρ 0 ρ 1 = [ H 0 , ρ 1 ] + [ H 1 , ρ 0 ] + e K L ρ 1 i D 1 [ H 1 , ρ 1 ] + [ H 0 , ρ 0 ] + [ H 1 , ρ 1 ] i D 0 [ H 1 , ρ 0 ] + [ H 0 , ρ 1 ] e K L ρ 1 i D 1
Each partition in Equation (1) has a size of N × N , where N denotes the number of states in a single (central) QCL period. The unknowns in this system are the density matrix partitions ρ 0 , ± 1 , which correspond to the Hamiltonian partitions with the same indices. Detail on calculating coherent interaction terms between adjacent periods, denoted as H ± 1 , and dissipator terms can be found in [46,49].
The optical properties can be modeled via dipole approximation within the non-rotating-wave approximation (NRWA) [49]. The interaction energy V A C = e z ^ A ( t ) between lasing levels resonates at the transition frequency ω , leading to the formation of an optical field A ( t ) = A 0 exp ( i ω t ) + exp ( i ω t ) , which subsequently leads to H 0 Hamiltonian blocks having three components: H 0 = H D C + H A C + exp ( i ω t ) + H A C exp ( i ω t ) , where H D C is the tight-binding Hamiltonian and H A C ± = e Z A 0 , with Z being the dipole matrix. When this is plugged in Equation (1), the system expands to a 9 N 2 × 9 N 2 system in the complex plane. The steady-state analysis can be conducted by simply inverting the linear superoperator matrix [49]. However, the dynamic study necessitates coupling this system to the Maxwell wave equation, which significantly increases the computational load. The main challenge is that 9 N 2 ordinary differential equations (ODEs) in the complex plane result in a system of 18 N 2 × 18 N 2 in the real plane. However, both the system Hamiltonian and the density matrix must be Hermitian, and we can use these properties to reduce the system size. For example, the third equation in Equation (1) is the complex conjugate of the first, so only two equations are needed to solve the system. Moreover, when NRWA is applied, the density matrix must remain Hermitian ( ρ 0 = ρ 0 and ρ 1 = ρ 1 ), allowing us to remove one more equation. This reduces the system to 5 N 2 equations. Introducing NRWA results in the following identities, based on the Hermiticity of the system:
ρ 0 + = ( ρ 0 ) , ρ 1 + = ( ρ 1 ) , ρ 1 = ( ρ 1 + ) ρ 0 D C = ( ρ 0 D C ) , ρ 1 D C = ( ρ 1 D C ) , ρ 1 D C = ( ρ 1 D C )
The Liouville equation in Equation (1) under NRWA approximation can thus be reduced to the following:
i d ρ 1 + d t = [ H D C , ρ 1 + ] + [ H A C + , ρ 1 D C ] + [ H 1 , ρ 0 + ] + e K L P ρ 1 + i ρ 1 + τ D + ω ρ 1 + i d ρ 1 D C d t = [ H D C , ρ 1 D C ] + [ H 1 , ρ 0 D C ] + [ H A C + , ρ 1 ] + [ H A C , ρ 1 + ] + e K L P ρ 1 D C i ρ 1 D C τ D i d ρ 1 d t = [ H D C , ρ 1 ] + [ H A C , ρ 1 D C ] + [ H 1 , ( ρ 0 + ) ] + e K L P ρ 1 i ρ 1 τ D ω ρ 1 i d ρ 0 + d t = [ H 1 , ρ 1 + ] + [ H D C , ρ 0 + ] + [ H A C + , ρ 0 D C ] + [ H 1 , ( ρ 1 ) ] i ρ 0 + τ D 0 i ρ 0 + τ + ω ρ 0 + i d ρ 0 D C d t = [ H 1 , ρ 1 D C ] + [ H D C , ρ 0 D C ] + [ H A C + , ( ρ 0 + ) ] + [ H A C , ρ 0 + ] + [ H 1 , ( ρ 1 D C ) ] i ρ 0 D C τ D 0 i ρ 0 D C τ
This system consists of 5 N 2 equations; however, the terms highlighted in red possess special commutator linearization, which is further explained in the Appendix A. While this system can be used to obtain the steady-state solution, the superoperator does not exhibit a straightforward symmetric expansion, as discussed in [49].
The five commutator equations in Equation (3) can be linearized using the Khatri–Rao formulation introduced in [49]. Additionally, for dynamic analysis, it is also beneficial to separate the real and imaginary parts of the system in Equation (3) and reformulate it as a 10 N 2 ODE system in the real plane. This form is suitable for numerical integration methods within the GSL libraries in C++. The linearization process for the system in Equation (3) is detailed in the Appendix A and it results in the following:
d ρ d y n d t = L d y n ρ d y n + B N
where L d y n is a superoperator of size ( 10 N 2 2 ) × ( 10 N 2 2 ) , and B N arises from the normalization condition. Instead of inserting the equation i ρ 0 i i D C = 1 , we directly substituted ρ 0 N N D C = 1 i N ρ 0 i i D C into the system. The term ρ d y n is a ( 10 N 2 2 ) -dimensional column vector, formed by stacking the vectorized elements (unpacked row-wise) ρ 1 I + , ρ 1 R + , ρ 1 I D C , ρ 1 R D C , ρ 1 I , ρ 1 R , ρ 0 I + , ρ 0 R + , ρ 0 I D C , ρ 0 R D C in this order. Here, the indices I and R refer to the imaginary and real parts, respectively. The detailed construction of L d y n and B N is provided in the Appendix A.
The current density operator is given by J ^ = i e n 2 D L [ H ^ , z ^ ] , and the polarization operator is P ^ = e n 2 D L z ^ , where n 2 D is the sheet doping density. To correctly evaluate the expectation values of these operators, the tri-diagonal infinite-period Hamiltonian and density matrix must be used as illustrated in [46], where we need to seek the limit lim Q 1 Q Tr ( ρ ^ J ^ ) and lim Q 1 Q Tr ( ρ ^ P ^ ) , yielding the following:
J D C = i e n 2 D L Tr Z [ H 1 , ρ 1 D C ] + [ H D C , ρ 0 D C ] + [ H A C + , ρ 0 ] + [ H A C , ρ 0 + ] + [ H 1 , ρ 1 D C ] L H 1 ρ 1 D C ρ 1 D C H 1 P + = e n 2 D L Tr Z ρ 0 + g = ω c n ϵ 0 P + A = e ω n 2 D L c n ϵ 0 Tr Z ρ 0 + A
where n represents the refractive index, J D C is the current density, and g is the material gain calculated as an imaginary part of the susceptibility.
The driving term in Equation (3) corresponds to the optical electric field present in the H A C ± terms, which must be coupled to the Maxwell wave equation. It is important to note that, as suggested in [58], a generalization of this approach can be made to incorporate the spatial properties of the optical field.

2.2. Maxwell–Bloch Model

The Maxwell wave equation for an isotropic medium is represented by a four-dimensional partial differential equation [68]. In laser systems with a Fabry–Pérot cavity, two primary approaches are typically used to simplify this general formulation: the Traveling-Wave method [58], which reduces the problem to two dimensions (one spatial and one time dimension), and the Fourier method, where it is assumed that an orthogonal set of electromagnetic modes satisfies the Laplace equation by eliminating the spatial component of the general formulation. The Fourier method for the electric field of mode E m is given as follows:
2 E m t 2 + σ ϵ 0 n 2 E m t + ω m 2 E m = 1 ϵ 0 n 2 2 P m t 2
where ω m represents the resonant frequency of mode m, P m is the medium polarization, and σ is the conductivity, which is introduced to account for ohmic losses in the cavity. The conductivity is given by σ = ϵ 0 n c g t h ( ω m ) , where g t h ( ω m ) is the threshold modal gain. In a Fabry–Pérot resonator, the threshold gain is expressed as g t h ( ω m ) = Γ m 1 ( α m i r + α w ( ω m ) ) , where Γ m is the modal overlap factor for mode m, α m i r is the mirror loss, and α w ( ω m ) is the waveguide loss. In our calculations, we utilize the model from [69] to calculate the threshold gain.
Equation (6) is often simplified by introducing the slow-varying envelope approximation, E m = A m ( t ) e i ω t + e i ω t , which is consistent with the NRWA approximation introduced in Equation (3). For simplicity, we consider only a single cavity mode, so A m ( t ) = A ( t ) .
Optical feedback can be incorporated into Equation (6) using an equivalent electric circuit equation [68], by adding the term 8 γ e ϵ V c 1 2 d A d t to the right-hand side of the Maxwell wave equation, where γ e represents the external cavity loss, and V c is the normalization constant. However, a more common approach involves adding feedback terms after applying the slow-varying envelope approximation, which was originally introduced in [43] and is widely known as the Lang–Kobayashi model.
In the LK model, feedback is introduced by analyzing multiple reflections in an extended (compound) cavity system [70], represented by the term κ ˜ e i ω τ e x t , where κ ˜ = κ τ c = ( 1 R 2 ) R 3 R 2 1 τ c is the reinjection rate of light into the cavity. Here, κ is the coupling strength, R 2 is the reflectivity of the semi-transparent mirror, R 3 is the reflectivity of the target, τ c is the internal cavity round-trip time ( = 2 n L c ), and τ e x t is the round-trip time in the external cavity ( = 2 n e x t L e x t c ), where n e x t is the refractive index of the external medium and L e x t is the length of the external cavity.
The Maxwell wave equation via the Fourier method and under the slow-varying envelope approximation in presence of optical feedback simplifies to the following:
A t = σ 2 ϵ 0 n 2 + i ( ω ω m ) A i ω 2 ϵ 0 n 2 P + κ ˜ e i ω τ e x t A ( t τ e x t )
This formulation is analogous to the Lang–Kobayashi (LK) model, with the key difference being that the polarization term in Equation (7) is no longer treated analytically using a two-level approximation as in [43]. The formalism in Equation (7) enables coupling with the Bloch equations, where the polarization term can be computed in a more general manner, as described in Equation (5), and it accommodates the case of an N-level system.
To formulate a Maxwell–Bloch model that is compatible with the transport model in Equation (5), it is convenient to introduce a new variable, g c = κ / L , since κ ˜ can be expressed as κ ˜ = κ τ c = c 2 n · g c . This term can be interpreted as a coupling loss. By splitting the real and imaginary parts of Equation (7) and utilizing the relationship between material gain and medium polarization as outlined in Equation (5), we can formulate the Maxwell–Bloch model as:
d ρ d y n d t = L d y n ρ d y n + B N A R t = c 2 n ( g g t h ) A R ( t ) + ω ω m A I + g c cos ( ω τ e x t ) A R ( t τ e x t ) + g c sin ( ω τ e x t ) A I ( t τ e x t ) A I t = c 2 n g t h A I ( t ) ω ω m A R g c sin ( ω τ e x t ) A R ( t τ e x t ) + g c cos ( ω τ e x t ) A I ( t τ e x t ) + e ω n 2 D 2 L ϵ 0 n 2 Tr ( Z ρ 0 + )
Equation (8) represents a general Maxwell–Bloch formalism that couples the Liouvillian superoperator to the Maxwell equation under optical feedback for THz QCL. A key distinction from the conventional LK model is that we do not employ any approximations that reduce our N-level quantum system to an effective two-level laser model. Our approach does not require any linearization of the material gain with respect to carrier concentration, nor does it involve unit disparities that typically necessitate special normalization [43,68]. (Note that the electric field envelope A ( t ) is in [V/m] units).
Laser equation models [68] typically consist of a set of carrier concentration, Maxwell wave equation, and polarization equations. In contrast, the system in Equation (8) can be viewed as a merger of the carrier and polarization equations into a density matrix model via the system’s Liouvillian. The equations corresponding to the diagonal elements of the density matrix are equivalent to the rate equations, while the off-diagonal elements make a significant contribution to the medium polarization [46]. In Equation (8), we present a general framework for the QCL system, where our superoperator accommodates any number of states within the QCL structure. Moreover, optical feedback is incorporated in such a way that no effective parameters, like those used in the LK model, are needed.
In Equation (8), we have separated the real and imaginary parts of the Maxwell equation presented in Equation (7). Alternatively, we could have employed amplitude and phase equations, as performed in the LK model. The real part of the envelope, A R ( t ) , in Equation (8) captures the fundamental behavior of any laser: in the absence of feedback ( g c = 0 ), the material gain is clamped to the threshold gain at steady-state. However, with optical feedback, the reinjected loss introduces a perturbation to the threshold gain, thereby altering the steady-state behavior. By introducing an effective threshold gain as g t h e f f = g t h + g c sin ( ω τ e x t + ϕ ) , we can model the SM effect using an effective third mirror [71]. This approach could be applied to the QCL structure [72], although it would require inverse interpolation after mapping the steady-state behavior.

3. Numerical Results

The system of equations in Equation (8) can be numerically solved as a first-order ODE system, for which a variety of solvers are available in many computational libraries. In this work, we utilized the GSL library in C++ and applied the Runge–Kutta Cash–Karp algorithm, which is particularly effective for stiff problems [73].

3.1. THz QCL Dynamics Without Optical Feedback

The layer structure of the active region in THz QCL devices usually falls within three well-established designs, namely bound-to-continuum (BTC), longitudinal-optical (LO) phonon, and hybrid designs, each one having a unique set of advantages and drawbacks. One of the key differences between these designs is in the period length, whose reciprocal controls the lasing threshold [74]: BTC structures operate with a low threshold but poor temperature performance, while LO phonon-based QCLs, in contrast, operate well at high temperatures, but have a very high threshold (thus only pulsed operation is usually achieved). Hybrid QCL designs combine aspects of LO and BTC schemes to achieve a moderately low threshold, large dynamic range, continuous-wave (CW) operation, and tolerance to high operating temperatures.
We will analyze representative structures of each of the three QCL design schemes, with our primary goal being to investigate the application of the model in Equation (8) across a broad set of THz QCL designs. We focus on three structures: Device A–a 3.4 THz structure based on the LO-phonon scheme [28]; Device B–a 2 THz structure based on the BTC scheme [46]; and Device C–a 3.4 THz structure based on the Hybrid scheme [75].
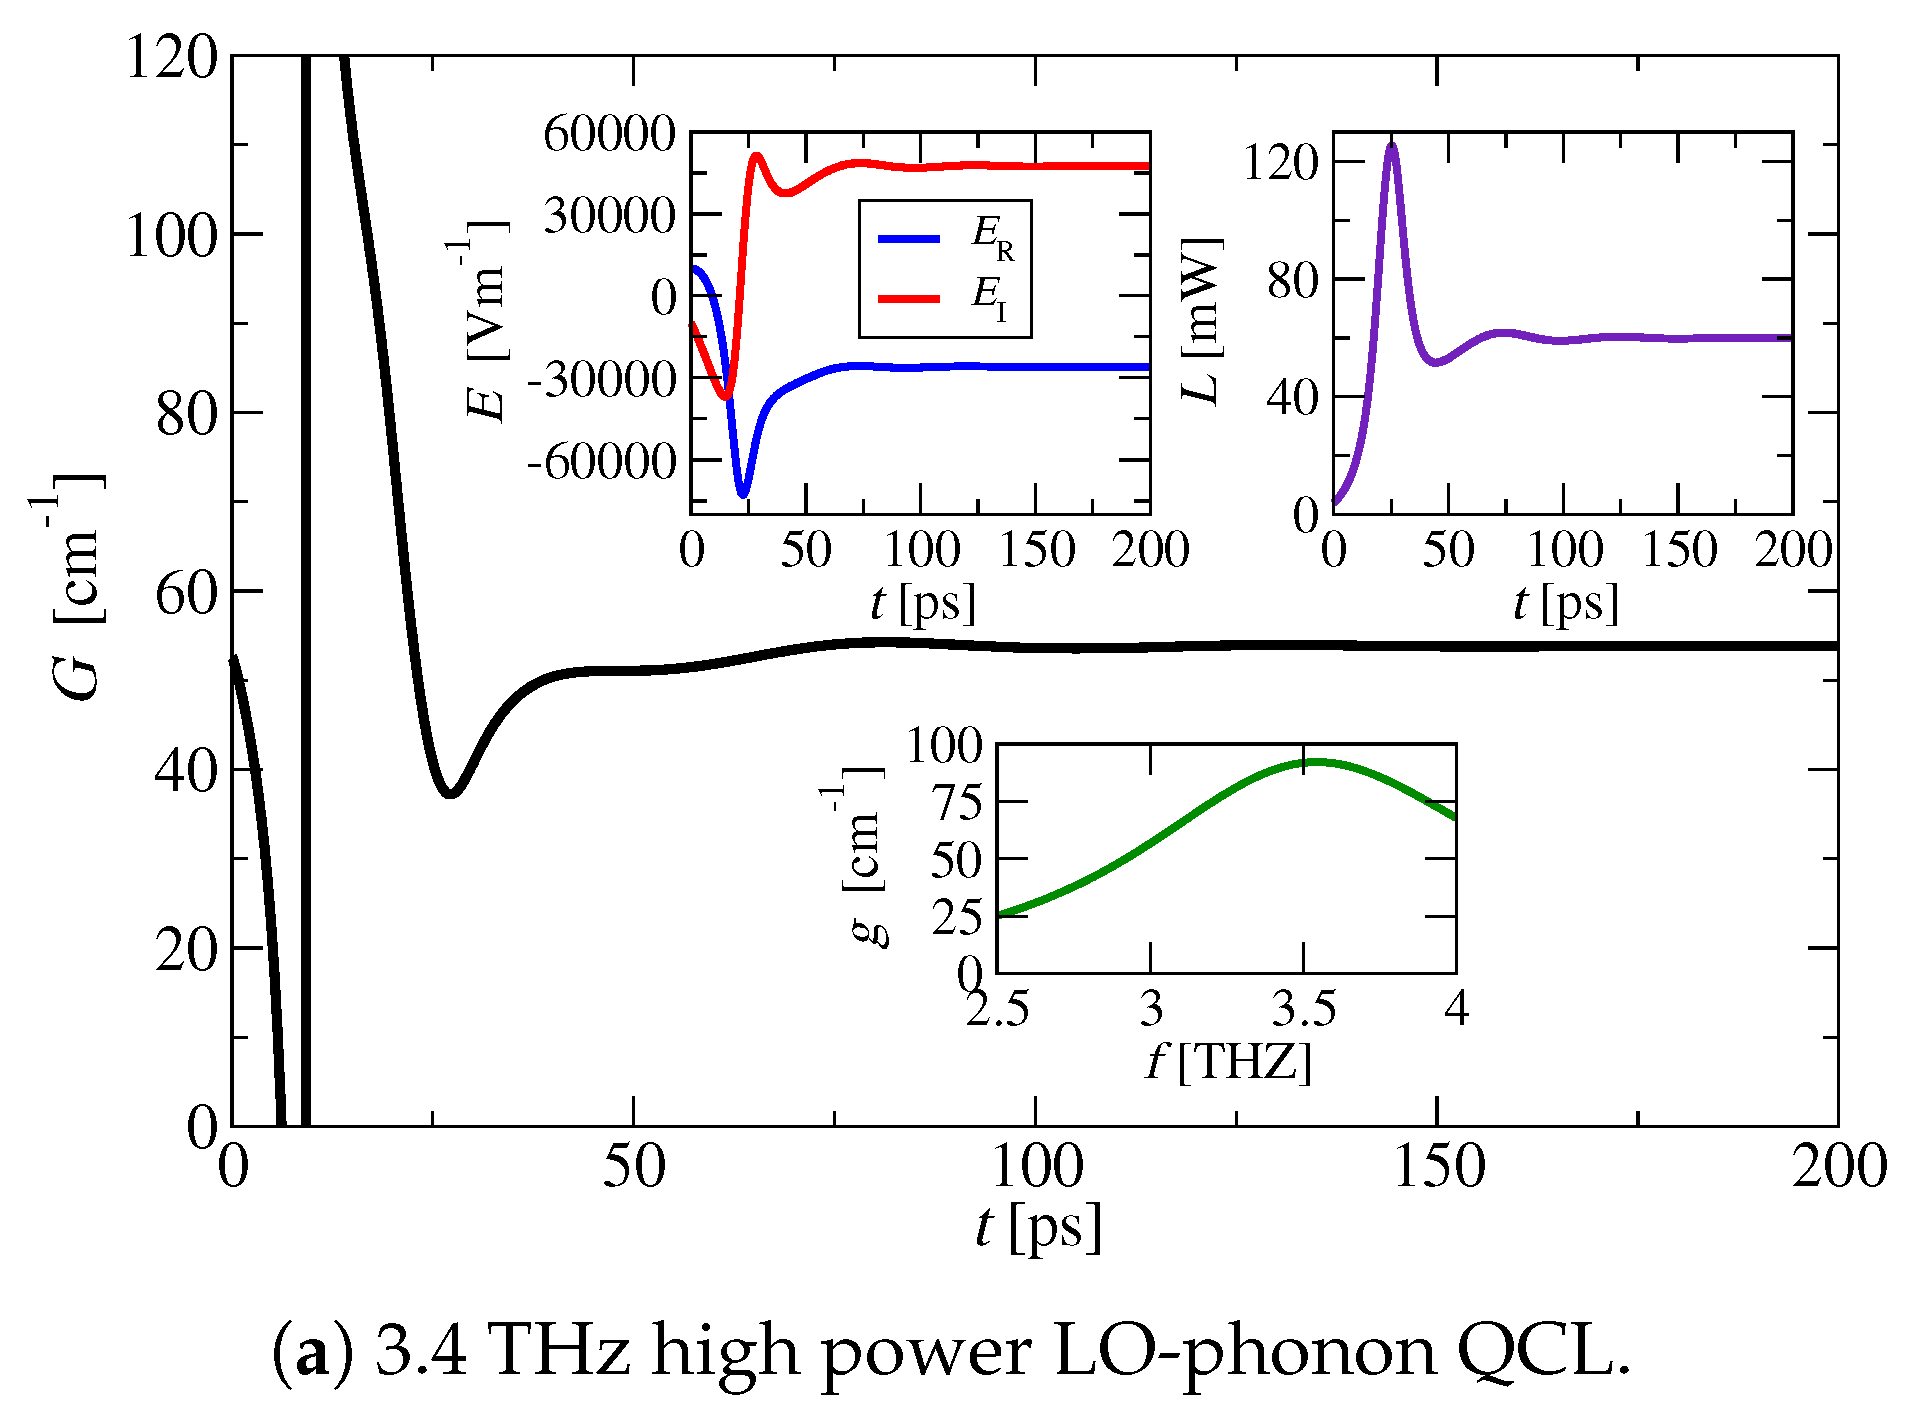
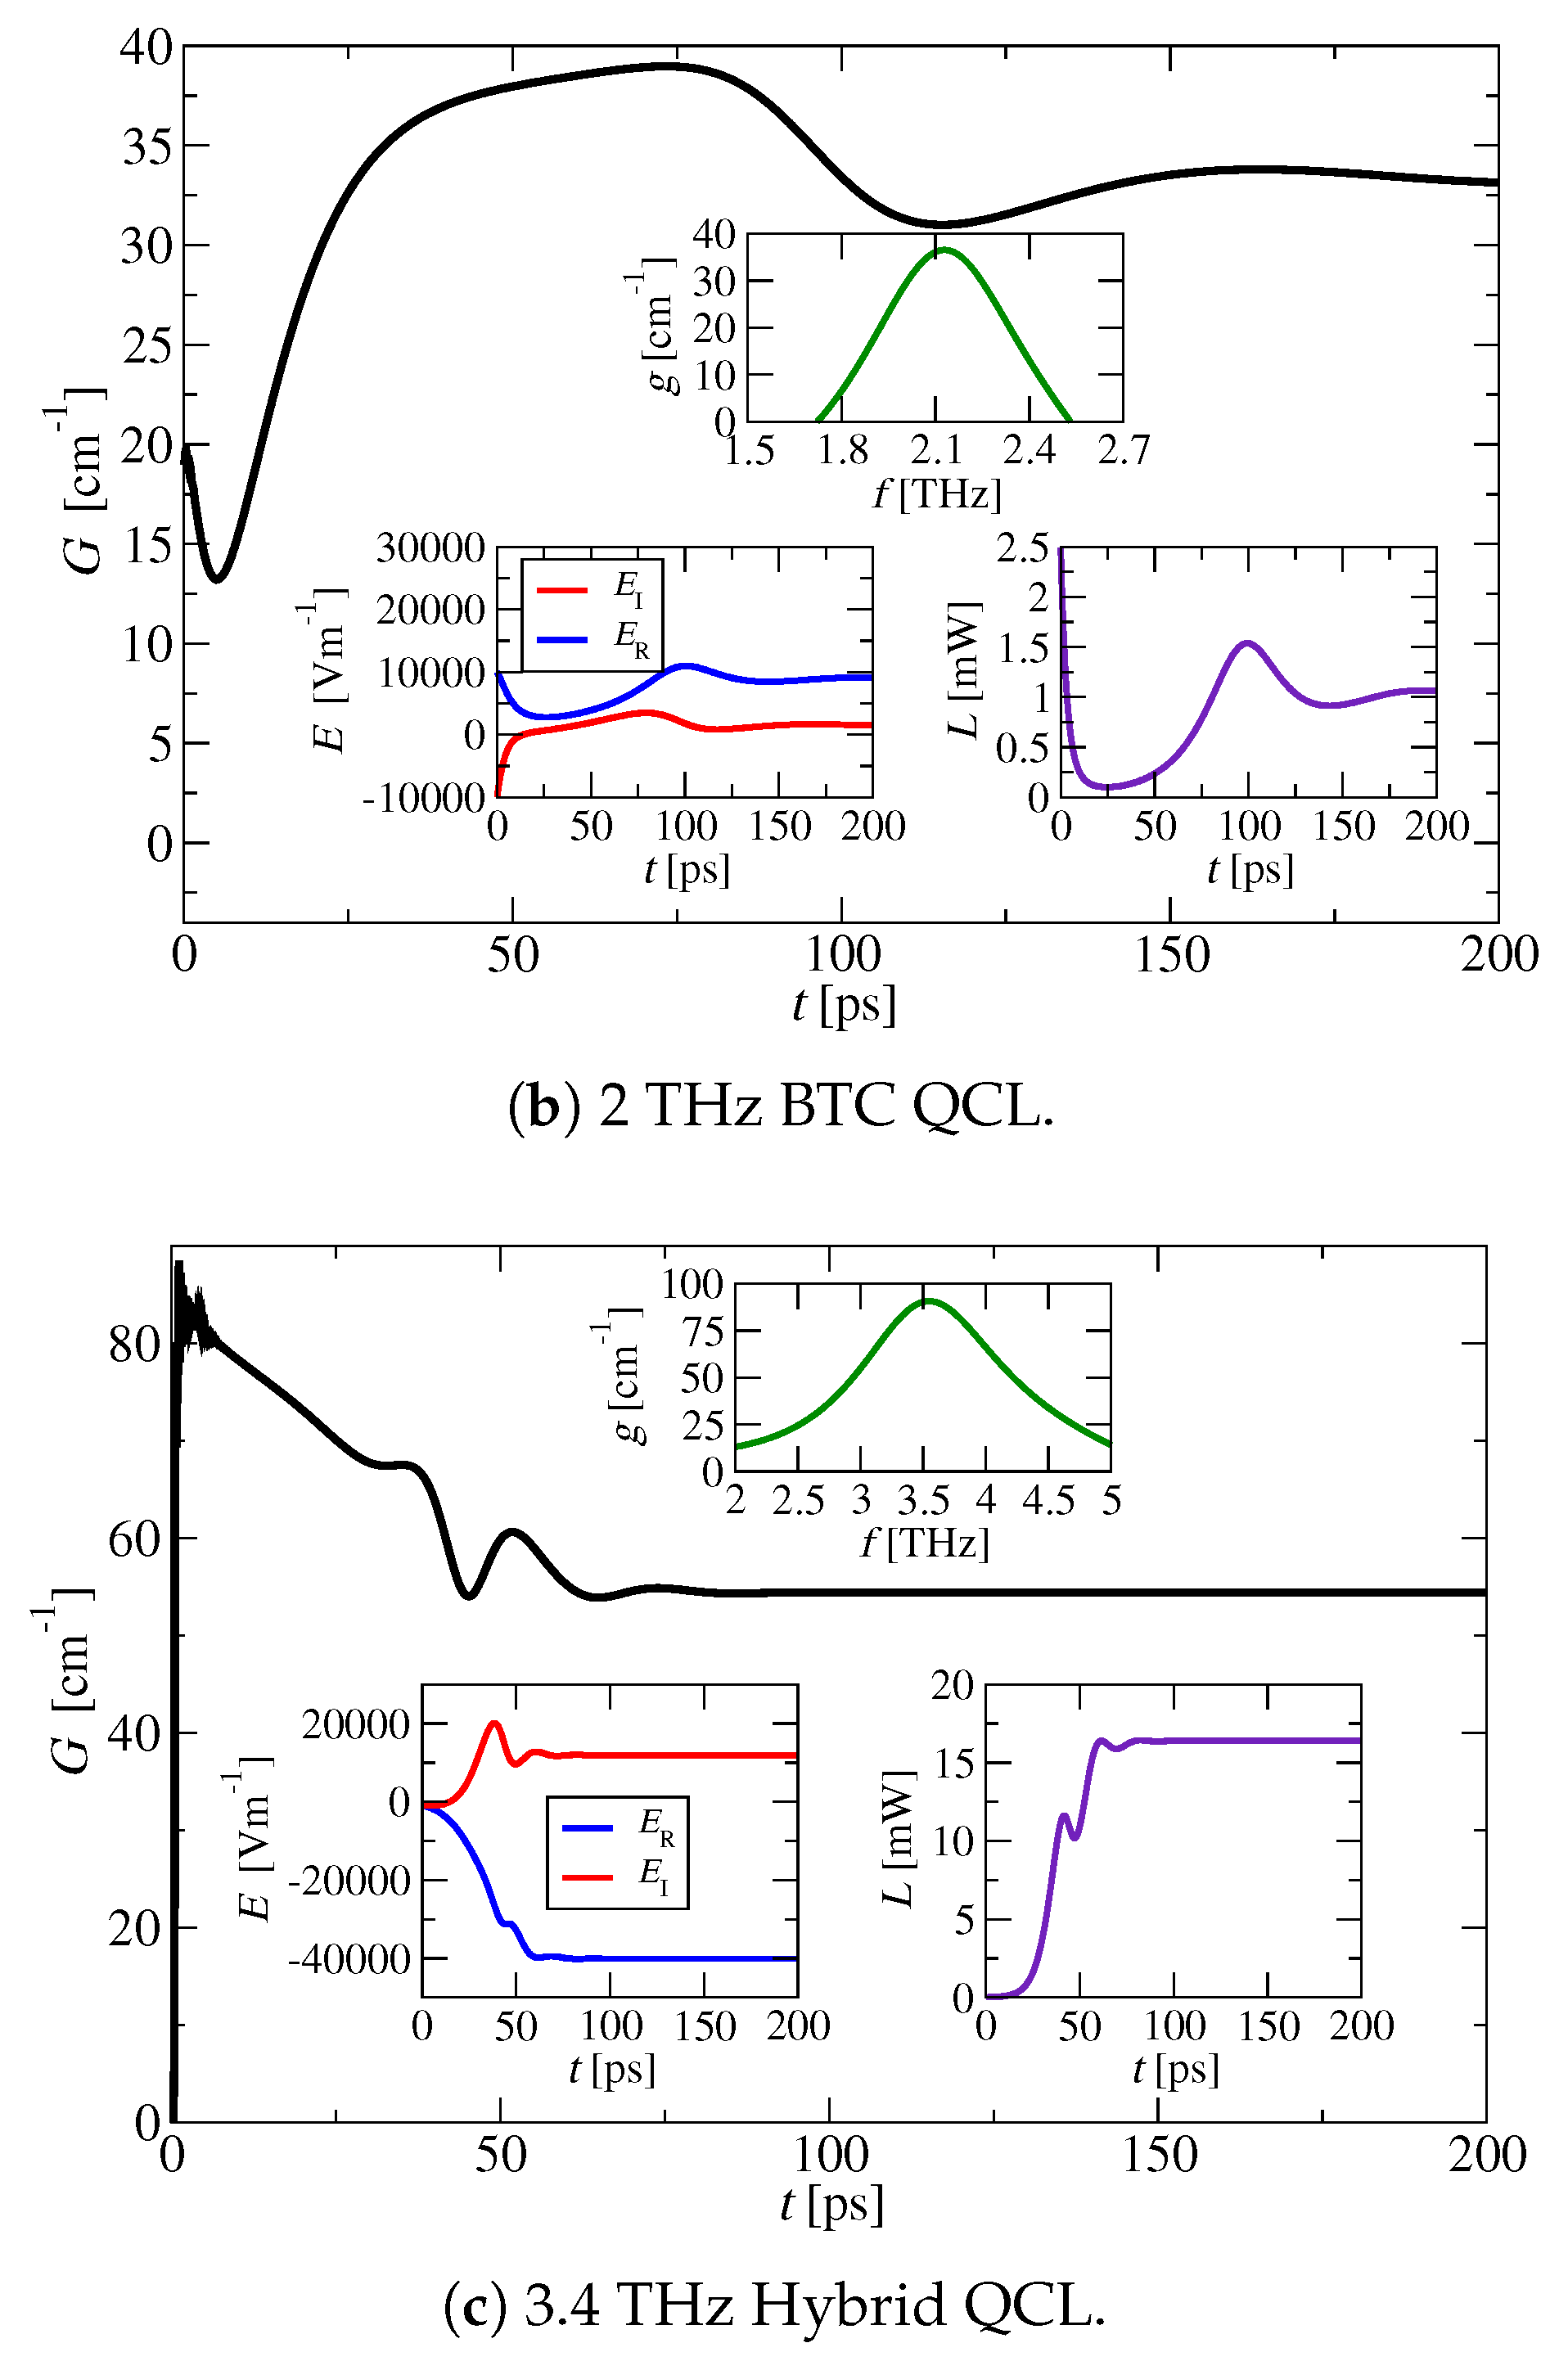
We applied our steady-state DM model [46,49] to all three structures to obtain current density and material gain dependence on the applied electric bias, upon which we applied the dynamics model that allows us to extract optical power and investigate gain dynamics, as shown in Figure 2. An example of steady-state transport characteristics for Device C is presented in Figure 3.
The threshold gain g t h is calculated using the modal loss model in [69], where we assumed a surface-plasmon waveguide (without loss of generality). The gain dependence on electric bias G ( K ) is calculated, assuming negligible optical field in the system, resulting in what is commonly referred to as “single-pass” material gain, which is not clamped by the modal loss. The dynamic model in Equation (8) can be applied at voltages where g > g t h . The bias points at which we present the dynamic results are illustrated in Figure 2.
We assume no optical feedback in Equation (8) ( g c = 0 ) and set the initial guess for the electric field to arbitrary values ( E R , E I ) = ( 10 4 , 10 4 ) [ Vm 1 ] in all simulations. The initial guess for the density matrix elements is set close to the steady-state solution at very low optical field, as we do not have a model for spontaneous emission.
In Figure 2, we show the main features of THz QCL laser dynamics as the gain stabilizes and limits to the modal loss in steady-state. In a Fabry–Perot cavity with length L c , the round-trip time is approximately given by 2 n L c / c 22 L c [ ps mm 1 ] . Typical cavity lengths for THz QCLs are between 1 mm and 3 mm , which results in round-trip times on the scale of 22–66 ps. In the examples presented in Figure 2, we observe that the transient effects occur on a timescale shorter than the round-trip time. This is due to the short upper lasing level (ULL) lifetime of approximately 12 ps , meaning that QCL devices do not exhibit relaxation oscillations, which are typical in other types of lasers [76]. The rapid gain recovery observed in THz QCLs has been experimentally verified [77,78,79] and is a vital characteristic for high-speed modulation applications.
It is important to note that the choice of the initial guess significantly impacts the solution of the ODE, especially due to the stiff nature of this numerical problem. In some cases, starting with a very low electrical field value can prevent the method from converging. Additionally, the method may diverge if the simulation includes states that do not contribute meaningfully to the primary QCL transport behavior (e.g., higher continuum-like states).
For the structure shown in Figure 2c, the initial guess underestimated the steady-state value, resulting in a much longer transient period. However, this example demonstrates that the simulation can still reach the steady-state even when the initial guess is not optimal.
We also emphasize that the optical field in the Liouvillian superoperator of Equation (4) influences the steady-state current density calculation in our transport model. In [46], we accounted for this effect by varying only the real part of the optical field until the modal gain stabilized at the loss level. In this work, we apply the model in Equation (8) at each bias point where g > g t h to obtain the corrected values for both the steady-state current density and optical power.
Figure 3 illustrates how the current density is influenced by the inclusion of the optical field within the Liouvillian, which causes the material gain to be constrained by modal loss. In principle, the dynamic model should be taken into account when computing the current density. This is especially crucial when focusing solely on transport characteristics, as neglecting the dynamic effects on current density could result in an underestimation by 20–30%. However, this does not notably increase the computational cost. One can sweep the optical field to determine the point at which the material gain is limited by the modal loss, and this can be achieved with various root-finding algorithms, which typically converge quickly.
The initial conditions used in Figure 2 do not accurately represent the internal state of the QCL or the spontaneous emission processes. The response shown represents the dynamics for a specific initial condition. For instance, the result in Figure 2b may suggest that the gain recovery time (GRT) is longer than the cavity round-trip time, which could imply that mode-locking is possible. However, this is not observed experimentally [78]. In Figure 2b, we simulated the dynamics at the peak of power, while the experimental data in [78] shows that GRT increases as the bias is raised, with a measured GRT of around 25 ps at a bias point below the peak power.
The model in Equation (8) can be utilized to estimate GRT by introducing active modulation of the waveguide loss as g t h = g t h + g m o d ( t ) , while maintaining the feedback g c = 0 for bias values above threshold and once the laser has reached its steady state. The modulation function g m o d ( t ) can represent any active modulation effect that alters the waveguide loss, allowing us to explore various modulation schemes to predict the QCL’s dynamic response and GRT.

3.2. Self-Mixing Effect

To simulate the SM effect, the first step is to evaluate the transport properties of the device by solving for the steady-state solution of Equation (8). We use the fitting method described in [46] to match the transport behavior of the 3.4 THz structure in [75]. The device is assumed to have a cavity length of 1.88 mm, a ridge width of 150 μ m , and a ridge height of 14.2 μ m , with a contact resistance of 1.2 Ω . We set the bias at K = 4.56 kV cm 1 , corresponding to a current density of 357.3 A cm 2 . The SM effect is modeled using Equation (8) by incorporating the coupling loss and the cavity round-trip time. The system is most responsive when ω τ ext is an integer multiple of π / 2 . Therefore, for a given frequency, the strongest response is achieved by adjusting the external cavity length in increments of half a wavelength (80 μ m ).
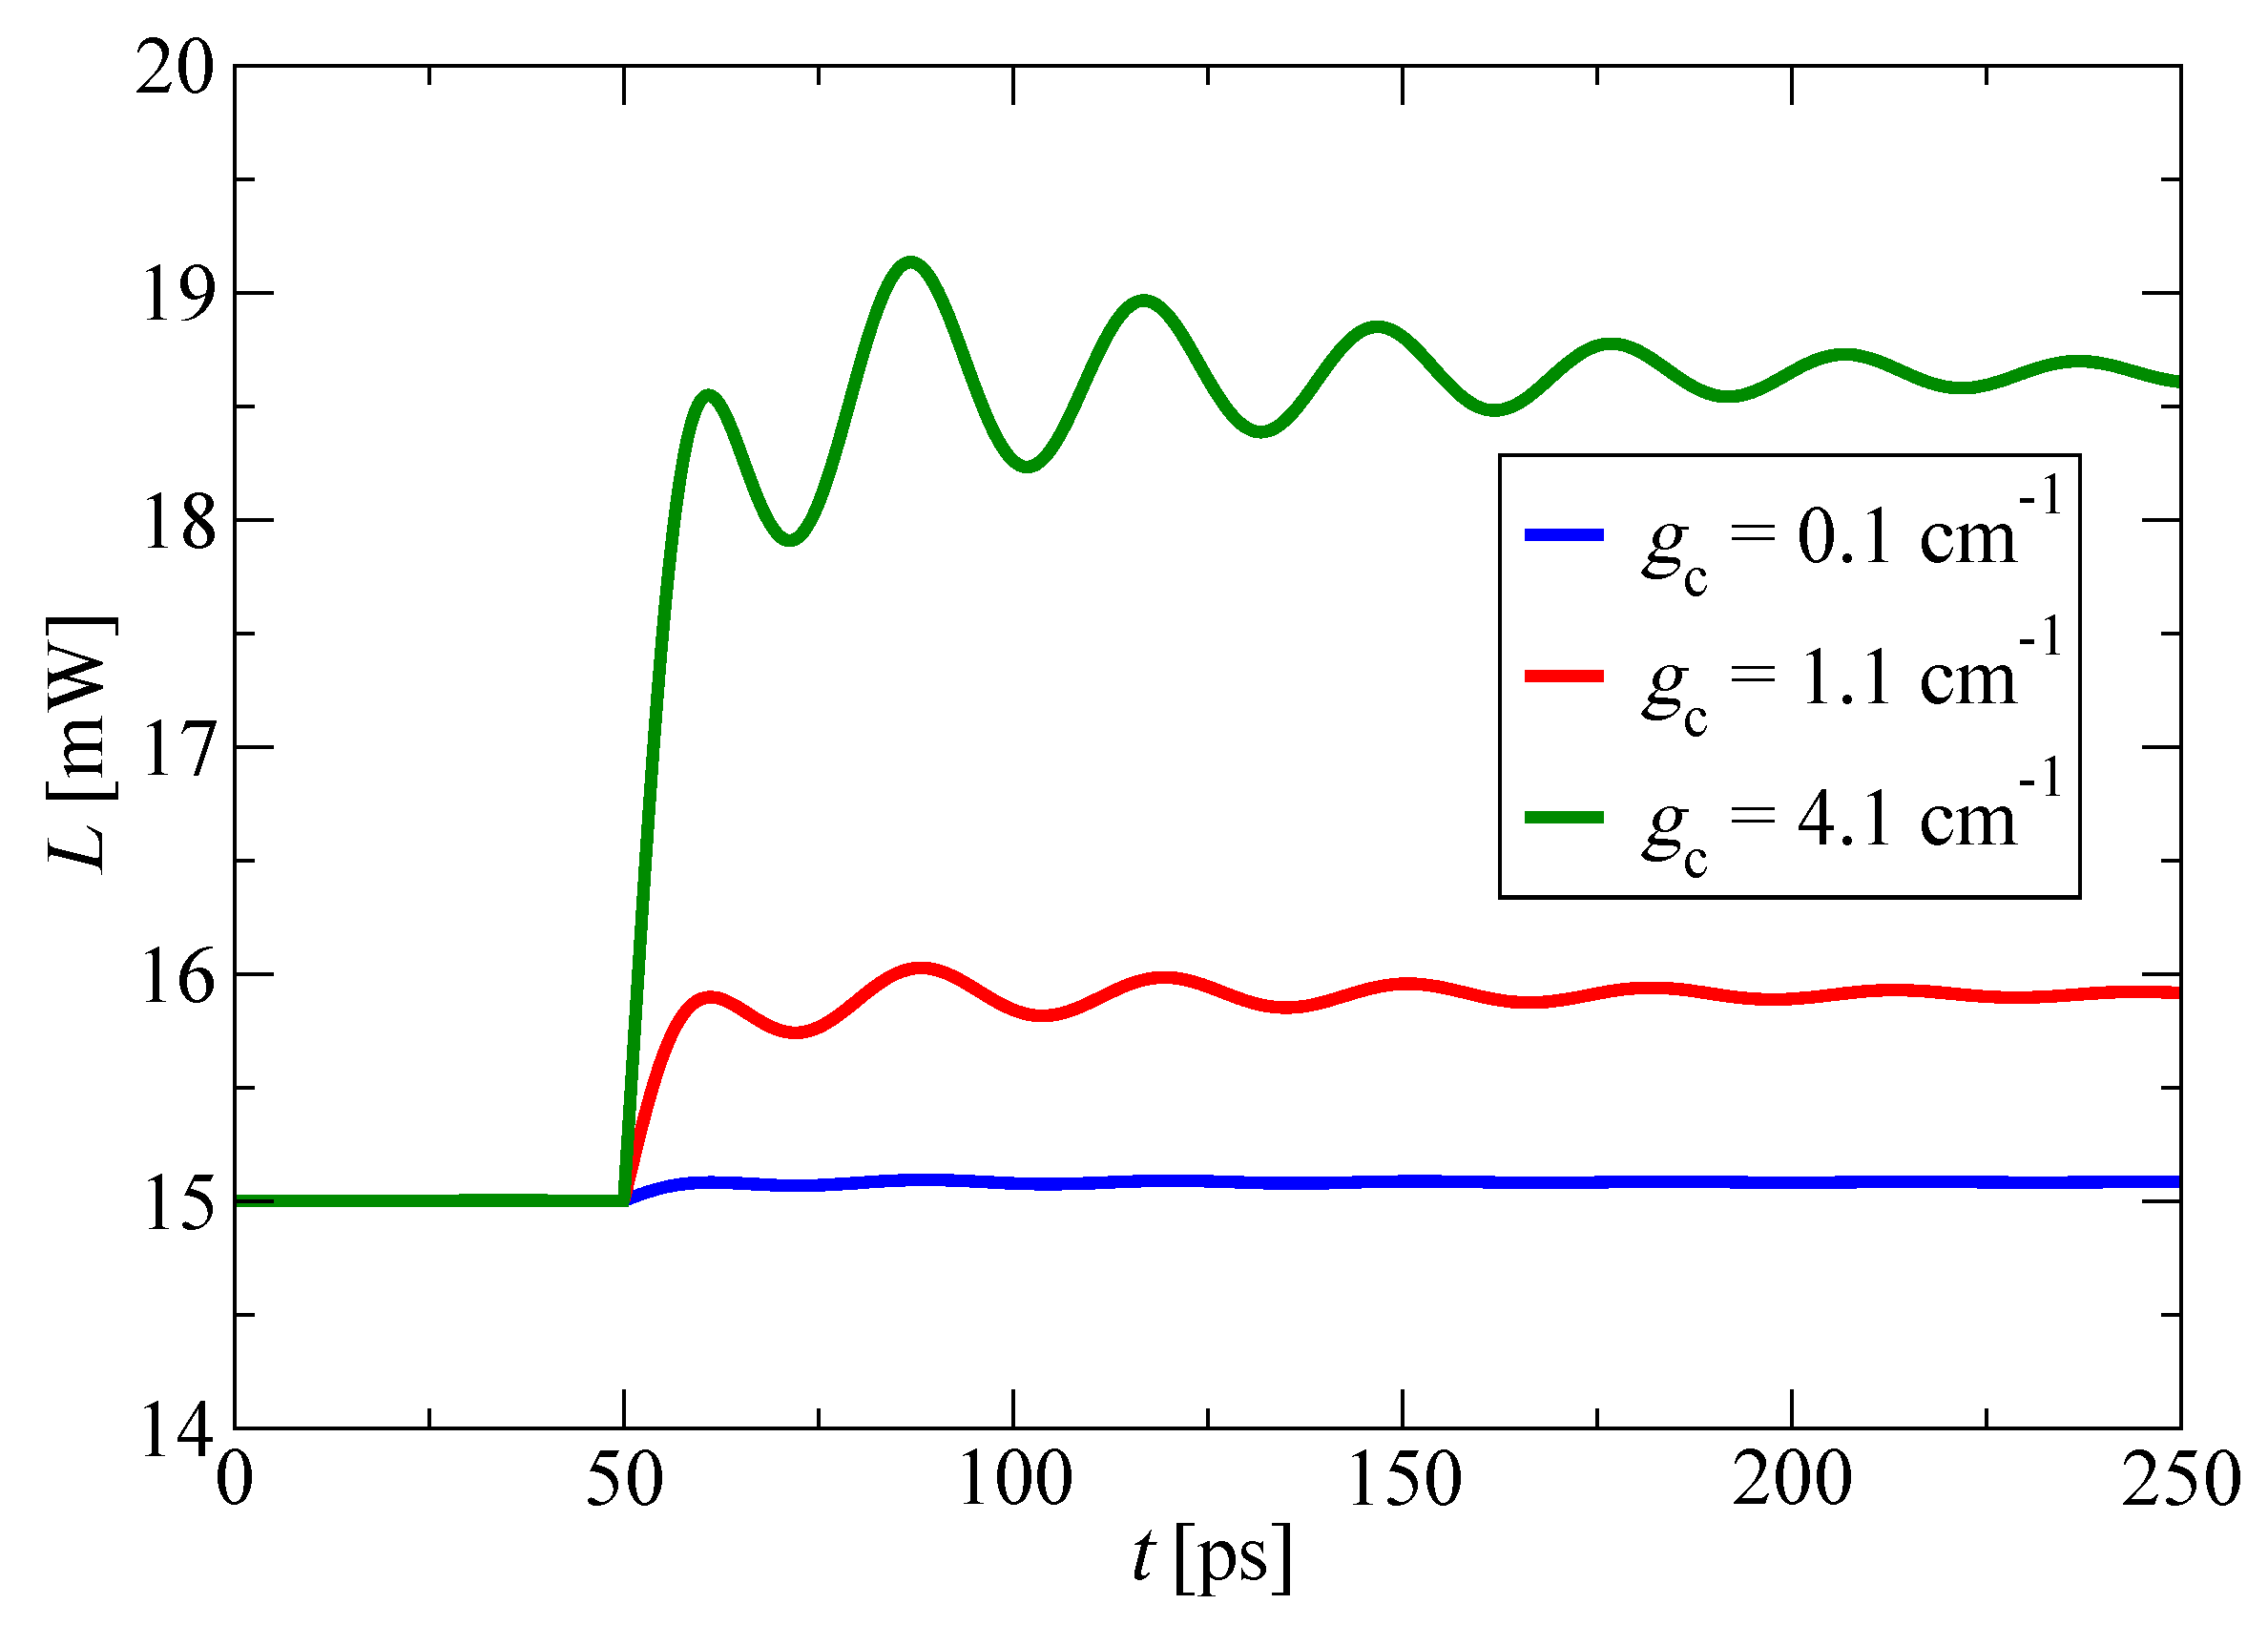
In Figure 4, we show the picosecond dynamics of optical power under the self-mixing effect. The external cavity length is fixed at L ext = 0.7 m + 80 [ μ m ] , while three different coupling loss values are considered to represent weak, moderate, and strong feedback regimes [80]. It is important to note that the model in Equation (8) does not account for temperature variations in the laser medium, though this could be incorporated at a high computational cost. The coupling loss in Figure 4 induces a dynamic response on a timescale shorter than the cavity round-trip time, after which a new steady state is reached. In practical SM effect applications, changes in the terminal voltage V sm are typically measured instead of optical power. The SM effect also modulates current density in a manner similar to that shown in Figure 4, allowing us to extract V sm by inverse interpolation of the current–voltage curve, once the data in Figure 3 is scaled by the device dimensions.
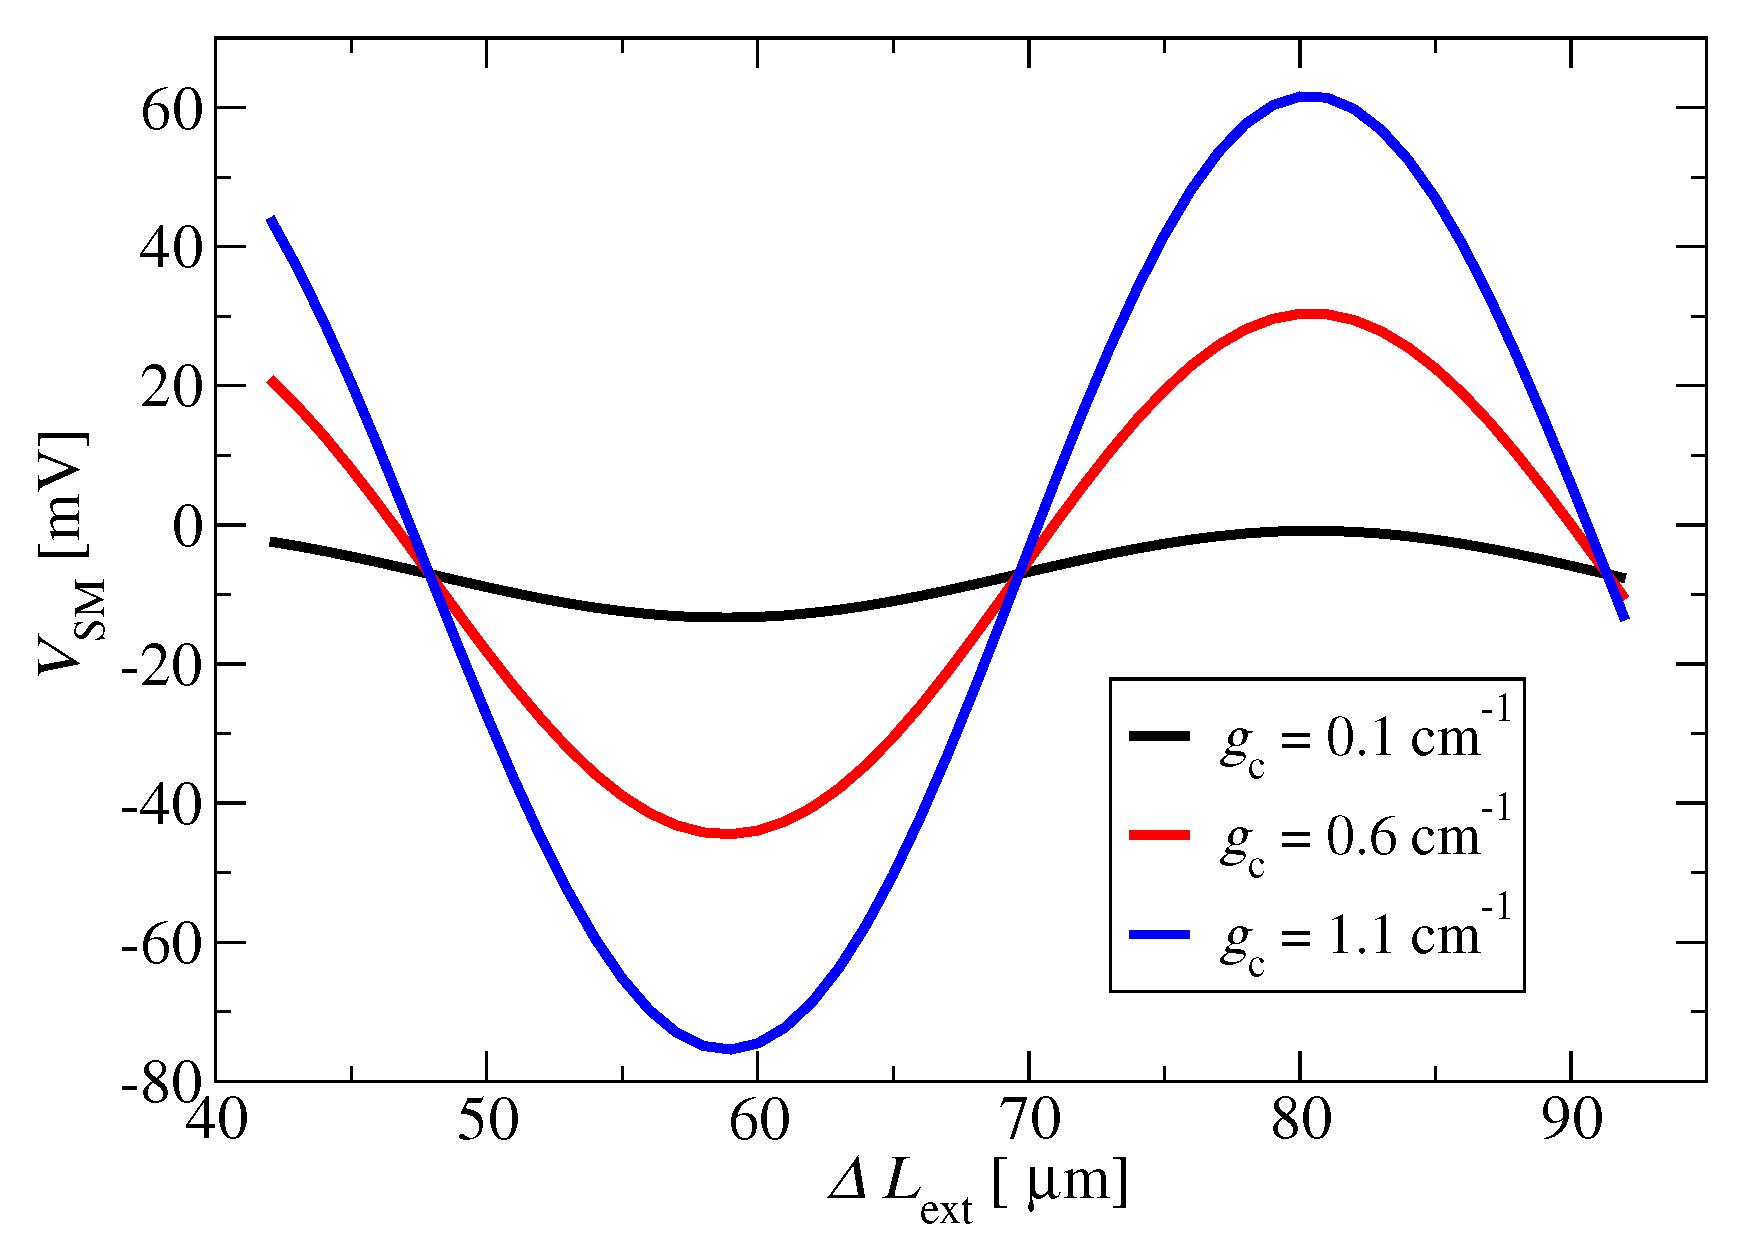
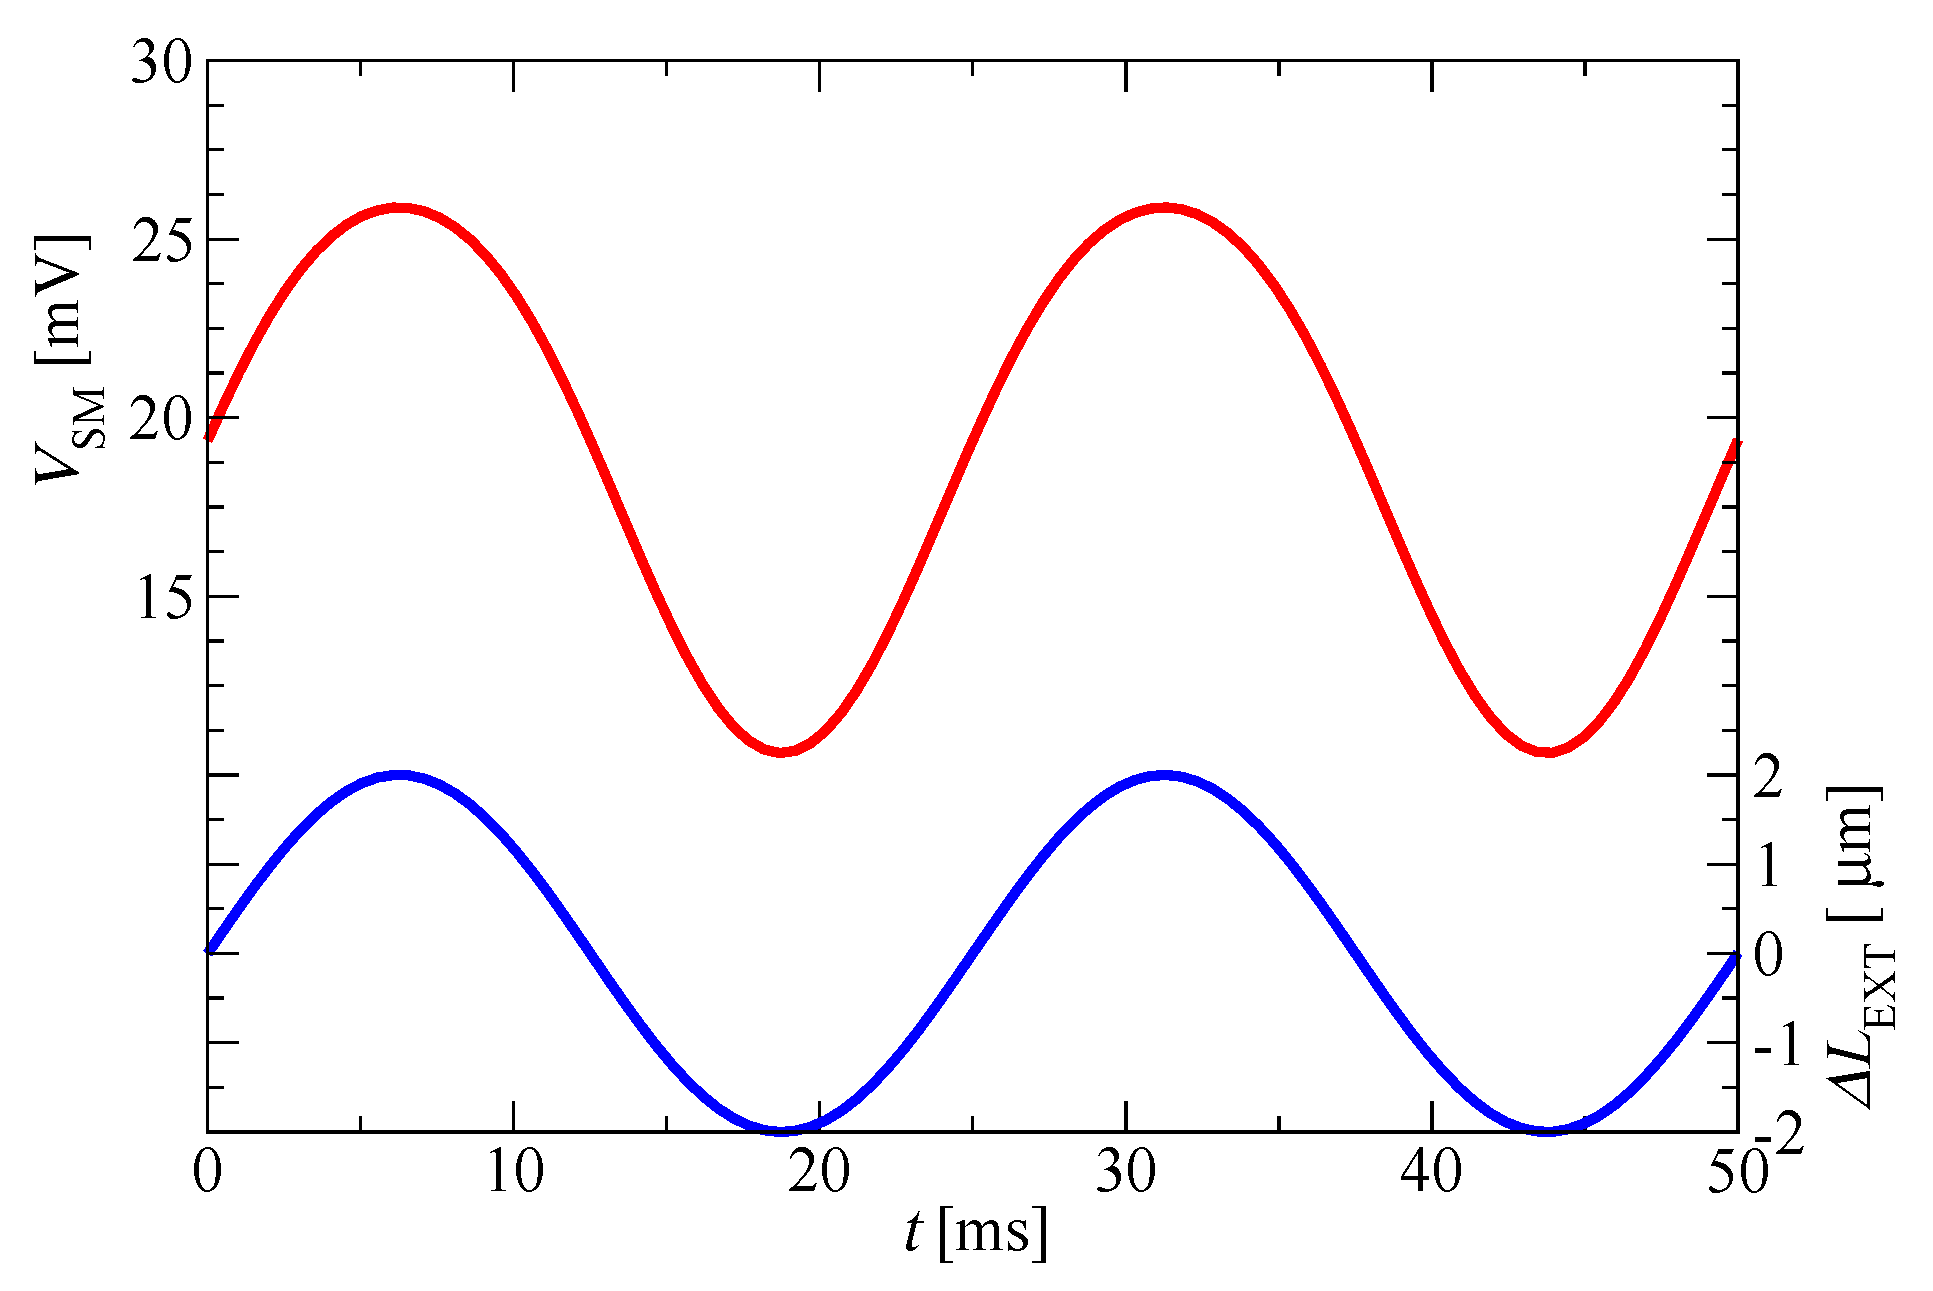
In Figure 5, we show the self-mixing (SM) voltage as a function of the external cavity length L ext = 0.7 m + Δ L ext for three different values of coupling loss. One common application of the SM effect is in displacement sensing [80], where an external mirror is periodically moved around a fixed position on the linear portion of the sinusoidal curve in Figure 5. In Figure 6, we present the response of the terminal voltage when the external mirror is displaced with a 2 μ m amplitude around L ext = 0.7 [ m ] + 70 [ μ m ] . The resulting terminal voltage is approximately 10 mV, which aligns well with experimental observations of this technique [75].
The results presented in Figure 4 and Figure 5 show the effects of three values of injection loss g c = κ / L , corresponding to weak, moderate, and strong optical feedback. In LK mode, moderate and strong feedback lead to asymmetry in the detected voltage [80], which is not captured in Figure 5. One limitation of this model is that it does not account for the temperature dependence of parameters, as discussed in [41]. However, the numerical complexity of this model is already moderately high, and its primary application is illustrated in Figure 4. Currently, no model exists that can determine which parameters affect the magnitude of the self-mixing (SM) signal in THz QCLs, and the existing LK model requires parameter fitting to match experimental data. The modeling framework we have presented and the results in Figure 4 provide a unique advantage: the ability to qualitatively assess the suitability of different THz QCL designs for SM applications. This allows us to estimate the magnitude of the SM voltage signal, the dynamic range of the THz QCL design, and its sensitivity to modulation.

4. Conclusions

We presented the reduced Liouvillian superoperator for the partitioned Hamiltonian introduced in [46,49]. The simplification in the equations in the system was achieved by exploiting the Hermiticity of the density matrix and its Hamiltonian. In Figure 2, we presented the modeled material gain dynamics of three exemplary THz QCLs. The high level of detail in the Bloch equations provides us with more accurate insights into the physics of THz QCLs, and this approach can further be extended to study various external modulation effects, gain recovery time calculation, and device performance optimization.
In Figure 3, we showcased the importance of incorporating the optical field dynamics with the transport model because the presence of the optical field affects the transport characteristics of the device. Nominally, transport characteristics, such as the current density, can be fitted to the experiment by using IFR parameters [46]; however, the optical field in the transport model should not be neglected. Setting the optical field manually to a low value only models the transport in a “single-pass” setup, which can show whether the device has material gain to support lasing; however, for the current density calculation, one must incorporate dynamics of the optical field with the transport equations in order to correctly fit the data to the experiment. This can be achieved via the model discussed in this paper or, since only the steady-state solution is of interest, via a root-finding algorithm, where one seeks the optical field value for which material gain clamps to the loss, as discussed in [46].
The key contribution of this work is the framework that generalizes the LK model beyond the two-level diode laser consideration in Equation (7), where any complex quantum systems can be examined via their medium polarization term. We considered the case of THz QCLs, where we coupled our transport model superoperator to the Maxwell wave equation, allowing us to study the pico-second dynamics of LK effect in THz QCLs. We demonstrated how the SM effect causes the change in the steady-state optical power and how it evolves in time. This enabled us to study the SM effect in any THz QCL device without a need for parametric two-level approaches [40], which, while crucial in determining the operational boundaries for the design of the overall system, do not offer a way to improve the design of the laser itself. In Figure 4, we considered the case of moderate and strong feedback on exemplary THz QCL. The key takeaway of these results is that re-injected light affects the quantum system on a pico-second scale, whereas the SM effect in practice is largely driven by temperature fluctuations of device parameters [80]. Since the temperature effects happen on a micro-second timescale, the model presented in this work can be used to tabulate the temperature dependence of the model parameters and generate an effective model in similar fashion as in [40]. However, the primary potential application of approach we presented is its ability to incorporate high-detail microscopic modeling of the THz QCL bandstructure, allowing us to select or engineer optimal devices. Unlike the effective two-level models for SM, the approach presented in Figure 4 can be repeated for arbitrary THz QCL design and allows us to evaluate their quality for SM applications in terms of the magnitude of SM voltage signal, dynamic range, or sensitivity.

Author Contributions

Conceptualization, A.D., Z.I., P.D., X.Q., T.T., K.B., A.D.R. and D.I.; data curation, A.D.; formal analysis, A.D.; funding acquisition, Z.I., P.D., X.Q., T.T., A.D.R. and D.I.; investigation, A.D.; methodology, A.D. and Z.I.; project administration, Z.I., P.D., A.D.R. and D.I.; software, A.D.; supervision, Z.I., P.D. and D.I.; validation, A.D.; writing—original draft, A.D.; writing—review and editing, A.D., Z.I., P.D., X.Q., T.T., K.B. and A.D.R. All authors have read and agreed to the published version of the manuscript.

Funding

This work was supported financially by the Engineering and Physical Sciences Research Council (EPSRC) UK. (Grants EP/T034246/1, EP/V004743/1, EP/V004751/1, EP/W028921/1), Australian Government Department of Industry, Science and Resources Critical Technologies Challenge Program (CTCF000040), the Australian National Health and Medical Research Council (NHMRC Development grant 2039614), Australian Government Department of Education through Australia’s Economic Accelerator Program (IG240100515).

Data Availability Statement

The data associated with this paper are openly available from the University of Leeds Data Repository at https://doi.org/10.5518/1786.

Acknowledgments

This work was undertaken on ARC4, part of the High Performance Computing facilities at the University of Leeds, UK. For the purpose of open access, the author has applied a Creative Commons Attribution (CC BY) licence to any Author Accepted Manuscript version arising from this submission.

Conflicts of Interest

The authors have no conflicts of interest to disclose.

Appendix A. Liouvilian Superoperator Linearization

The linearization of the commutator system of equations in Equation (3) can be carried out algebraically by introducing the following banded matrices:
H = H DC H AC + 0 H 1 0 H AC H DC H AC + 0 H 1 0 H AC H DC 0 0 H 1 0 0 H DC H AC + 0 H 1 0 H AC H DC 5 N × 5 N I U = I I I I I I I I I I I I I I I I I I I I I I I I I 5 N × 5 N Υ = e K L P I N 2 0 0 0 0 0 e K L P I N 2 0 0 0 0 0 e K L P I N 2 M 1 0 0 0 M 1 0 0 0 M 1 0 M AC + 0 5 N 2 × 5 N 2 D = D 1 0 0 0 0 0 D 1 0 0 0 0 0 D 1 0 0 0 0 0 D 0 0 0 0 0 0 D 0 5 N 2 × 5 N 2 Ω = I N 2 0 0 0 0 0 0 0 0 0 0 0 I N 2 0 0 0 0 0 I N 2 0 0 0 0 0 0 5 N 2 × 5 N 2 ρ = ρ 1 + ρ 1 D C ρ 1 ρ 0 + ρ 0 D C 5 N 2 × 1
where I denotes an N × N identity matrix, and I N 2 refers to an N 2 × N 2 identity matrix. The zero blocks in H red are of size N × N , while all other zero blocks are of size N 2 × N 2 . The matrices M 1 and M AC + represent special sub-Liouville superoperators, which correspond to the linearization of the commutators involving H 1 and H AC + , respectively, and are associated with the red-colored terms in Equation (3).
The main challenge with these terms is that they target the conjugate transpose of the unknown, whereas all other commutators are linearized by row-wise vectorization of the original (non-transposed) density matrix blocks. For example, the commutator [ A , X ] can be directly linearized using the Kronecker product as A I I A T , where X is linearized by row-wise vectorization. However, the linearization of the commutator [ A , X T ] must preserve the order of the equations obtained by linearizing [ A , X ] . This vectorization does not have a straightforward algebraic transformation in the literature, but it can be derived by mathematical induction, as shown in Appendix B.
The matrices in Equation (A1) enable the algebraic linearization of Equation (3), following a similar approach to the formalism introduced in [49]:
d ρ d t = L ρ L = i H I U I U H . T + Υ i D + ω Ω
To match the matrix dimensions, the Khatri–Rao products must be computed before adding other terms.
The system in Equation (A2) is formulated in the complex plane. However, many C++ libraries (e.g., GSL [73]) require a system of real equations. By separating the real and imaginary parts in Equation (A2), one would obtain a system of 10 N 2 real equations. Fortunately, an algebraic expansion rule is available. Consider a commutator i [ H k , ρ k ] , where both are complex: H k = H k R + i H k I and ρ k = ρ k R + i ρ k I . The commutator results in two separate equations:
: [ H k I , ρ k I ] [ H k R , ρ k R ] : [ H k I , ρ k R ] + [ H k R , ρ k I ]
The linear form of Equation (A3) is as follows:
H k I H k R H k R H k I I I I I I I I I H k I T H k R T H k R T H k I T ρ k I ρ k R
We now define a complex expansion rule for terms of the form i [ H k , ρ k ] :
H k rot H k I H k R H k R H k I
Additionally, the terms highlighted in red in Equation (3) correspond to the complex conjugate of the density matrix partitions. This is equivalent to multiplying by 1 , and the expansion rule for the linearized form of [ H k , ρ k T ] = M k ρ k is the following:
M k rot M k I M k R M k R M k I
The expanded superoperator of real equations derived from Equation (A3) is then
d ρ rot d t = L rot ρ rot L rot = 1 H rot I U rot I U rot H rot . T + Υ rot + D rot + ω Ω rot
where
  • H rot is a 10 N × 10 N partitioned matrix derived from the one in Equation (A1) by applying the expansion rule in Equation (A5). Note that only the H AC block has an imaginary part, and the real basis of wavefunctions was used to derive the H ± 1 blocks.
  • I U rot is a 10 N × 10 N partitioned matrix, where each partition is an identity matrix I. It can be algebraically formed as U 10 × 10 I N × N .
  • Υ rot is a 10 N 2 × 10 N 2 partitioned matrix, obtained by applying the rule in Equation (A3) to the terms e K L P I N 2 × N 2 , treating them as purely real, and using the rule in Equation (A6) for the terms M 1 and M AC .
  • D rot is a 10 N × 10 N partitioned matrix, obtained by applying the rule in Equation (A5), treating this matrix as purely imaginary, since it contains an additional imaginary unit in Equation (A3). This also causes the sign change in front of this term. Simply put, D rot is a block-diagonal matrix with D 1 , D 1 , D 1 , D 1 , D 1 , D 1 , D 0 , D 0 , D 0 , D 0 on the main diagonal.
  • Ω rot is a 10 N × 10 N partitioned matrix, derived from the one in Equation (A1) by applying the rule in Equation (A5) to each I N 2 element, treating it as purely real.
  • ρ rot is a 10 N 2 column vector consisting of the stacked vectorized elements:
    ρ 1 I + , ρ 1 R + , ρ 1 I DC , ρ 1 R DC , ρ 1 I , ρ 1 R , ρ 0 I + , ρ 0 R + , ρ 0 I DC , ρ 0 R DC .
This system is almost identical to the one in Equation (4). The only remaining task is to implement the normalization condition i ρ 0 i i D C = 1 , which can be achieved by substituting one of the equations in the system, for example, ρ 0 N N D C = 1 i N ρ 0 i i D C , directly into the system. The vector ρ dyn is of length 10 N 2 2 for the steady-state solution. This transforms the equation to L rot L dyn and ρ rot ρ dyn , resulting in Equation (4).
The vector ρ dyn lacks the real and imaginary parts of ρ 0 N N DC ; otherwise, it is identical to ρ rot from Equation (A7). The matrix L dyn is similar to L red rot but differs in the removal of rows and columns (corresponding to the real and imaginary parts) that target the ρ 0 N N DC element in the original system (i.e., the ( 5 N 2 1 ) -th row and column). Furthermore, each column targeting ρ 0 i i DC , i N , is altered by subtracting the columns targeting the real and imaginary parts of ρ 0 N N DC from the original system. As a result, the matrix L dyn has dimensions ( 10 N 2 2 ) × ( 10 N 2 2 ) .
The vector B N is a 10 N 2 2 column vector, which is actually a column from the original superoperator that targeted the real part of ρ 0 N N DC , while the two rows are omitted since the equations targeting the real and imaginary parts of ρ 0 N N DC are deleted. The detailed explanation of how L dyn and B N are generated from the initial system is provided in Appendix C.

Appendix B. Linearization of AXT B

The Kronecker product can be used to linearize the equation A X B = C as ( A B T ) x = c , where x and c represent the row-wise vectorized forms of X and C, respectively. If vectorization is performed column-wise, the linearization takes the form ( B T A ) x c = c c . However, when the equation involves both X and X T , linearizing A X T B via the Kronecker product is not straightforward due to the differences in the vectorization of X and the order of equations in A X T B .
Consider the 2 × 2 case where we have A X T = E and X T B = F , where
a 11 a 12 a 21 a 22 x 11 x 21 x 12 x 22 = e 11 e 12 e 21 e 22 x 11 x 21 x 12 x 22 b 11 b 12 b 21 b 22 = f 11 f 12 f 21 f 22
The products in Equation (A8) are as follows:
a 11 x 11 + a 12 x 12 a 11 x 21 + a 12 x 22 a 21 x 11 + a 22 x 12 a 21 x 21 + a 22 x 22 = e 11 e 12 e 21 e 22 x 11 b 11 + x 21 b 21 x 11 b 12 + x 21 b 22 x 12 b 11 + x 22 b 21 x 12 b 12 + x 22 b 22 = f 11 f 12 f 21 f 22
If we formulate x through row-wise vectorization and write the equations in Equation (A9) in row-wise order, the resulting system is
a 11 a 12 0 0 0 0 a 11 a 12 a 21 a 22 0 0 0 0 a 21 a 22 x 11 x 12 x 21 x 22 = e 11 e 12 e 21 e 22 b 11 0 b 21 0 b 12 0 b 22 0 0 b 11 0 b 21 0 b 12 0 b 22 x 11 x 12 x 21 x 22 = d 11 d 12 d 21 d 22
The 4 × 4 matrices in Equation (A10) do not directly correspond to any specific algebraic operation like the Kronecker product. In a more visual sense, linearizing A X T shifts the rows of A diagonally, while X T B results in the shifting of columns of B. These types of operations can be efficiently achieved using the Khatri–Rao product as follows:
I 2 × 2 I 2 × 2 A R 1 A R 2 x 11 x 12 x 21 x 22 = e 11 e 12 e 21 e 22 = ( I R A R ) x = e I 2 × 2 I 2 × 2 B C 1 B C 2 x 11 x 12 x 21 x 22 = f 11 f 12 f 21 f 22 = ( I C B C ) x = f
This also gives
( I C B C ) = ( I R B R ) T
where A R is a partitioned matrix where each partition corresponds to a row from the original matrix, while I R is a partitioned matrix where each partition is an identity matrix. Similarly, B C is a partitioned matrix where each partition corresponds to a column of the original matrix, and I C has identity matrices as its column partitions. It is important to note that the identity in Equation (A12) is directly derived from Equation (A10) by setting the a and b elements equal and transposing the 4 × 4 matrices.
This formulation can be generalized for matrices A and B as
A X T B A R ( B T ) C ,
where ( B T ) C represents the partitioning of the matrix B T into columns.
A X T B A R 1 A R 2 A R N B C 1 T B C 2 T B C N T x = A R 1 B C 1 T A R 2 B C 2 T A R N B C N T x
It is important to ensure that the number of columns in B T corresponds to the number of rows in A.
In the context of the density matrix model, Equation (A11) becomes applicable when linearizing terms of the form [ A , ρ ] + [ B , ρ T ] :
[ A , ρ ] + [ B , ρ T ] = C ( A I I A T ) ρ + ( I R B R ( I R B R ) T ) ρ = c

Appendix C. Normalization of DM Superoperator

The normalization condition in the density matrix formalism dictates that the sum of the diagonal elements of the density matrix must equal one, ensuring probability conservation within the chosen basis. There are different ways to implement this condition. One simple method is to remove one of the equations corresponding to a diagonal element of the density matrix and replace it with the normalization condition. This would introduce a constant term into the system’s superoperator, enabling a straightforward solution in the steady state. However, this approach is not suitable for dynamic models, as most solvers require a specific vector of equations with derivatives on one side.
Alternatively, the normalization condition can be reformulated by rearranging the terms and setting one diagonal element of the density matrix equal to one minus the sum of all other diagonal elements:
ρ j j = 1 i j ρ 0 i i DC
This equation must be substituted throughout the entire system wherever the chosen ρ j j appears. This substitution causes the system to “shrink” by eliminating the row and column corresponding to the ρ j j element. To illustrate this, consider a linear system of differential equations L X = d X d t :
a 11 a 12 a 13 a 21 a 22 a 23 a 31 a 32 a 33 x 1 x 2 x 3 = d d t x 1 x 2 x 3
If we implement the relation x 3 = Y x 2 x 1 (with Y = 1 , though we will retain the general form), and eliminate the third equation, the system in Equation (A16) simplifies to the following:
a 11 a 13 a 12 a 13 a 21 a 23 a 22 a 23 x 1 x 2 + Y a 13 a 23 = d d t x 1 x 2
Two effects can be observed in Equation (A17):
  • The column corresponding to x 3 in the initial system in Equation (A17), excluding the a 33 element, remains as a free term in Equation (A17) multiplied by the constant Y.
  • The same column is subtracted from the columns corresponding to the x 1 and x 2 variables.
If we partition the system in Equation (A16) by columns as ( A 1 A 2 A 3 ) X = d X d t , the condition x 3 = 1 x 2 x 1 modifies the system as follows:
( A 1 R A 3 R A 2 R A 3 R ) X R + Y A 3 R = d X R d t
where the R notation refers to the fact that the last equation in Equation (A16) is removed, and the original columns are “shrunk” by the last element. The ⊙ symbol indicates a dot product when the partitioned form is used.
The normalization condition for the DM model used in this thesis follows the outline in Equations (A17) and (A18); however, there is a slight complication regarding which columns and rows need to be altered. The system in Equation (A7) has a size of 10 N 2 × 10 N 2 , but the normalization condition only affects the diagonal elements of ρ 0 DC located in the N 2 × N 2 partition in the 10th (real part) and 9th (imaginary part) rows of the overall system. The selected diagonal element corresponds to the last state in the basis, whose equation is written in the 10 N 2 -th (real part) and 9 N 2 -th (imaginary part) rows.
The normalization condition ρ 0 N N DC = 1 i N ρ 0 i i DC affects the system created in Equation (A7) as follows:
  • Rows 10 N 2 and 9 N 2 are deleted from the system.
  • Columns 10 N 2 and 9 N 2 (after the previous removal) are also deleted from the system and stored in column vectors C R and C I , respectively.
  • Each column that targets the real part of diagonal elements ρ 0 i i DC , i N , is subtracted by column C R .
  • Each column that targets the imaginary part of diagonal elements ρ 0 i i DC , i N , is subtracted by column C I .
  • Column C R is added as a free term to the system (note that C I is not added, since in that case Y = 0 in Equation (A18)).
The system can then be written as in Equation (3). Note that the overall Maxwell–Bloch system is coupled, and the optical electric field equations can be added either at the bottom of the DM system or at the position of the deleted equations due to the normalization condition. In either case, the overall system will have 10 N 2 differential equations, which can be solved by various packages within the C++ GSL library.

References

  1. King, P.; Steward, G. Metrology with an optical maser. New Sci. 1963, 17, 14. [Google Scholar]
  2. Ashby, D.E.T.; Jephcott, D. Measurement of plasma density using a gas laser as an infrared interferometer. Appl. Phys. Lett. 1963, 3, 13–16. [Google Scholar] [CrossRef]
  3. Crowe, J.; Craig, R., Jr. GaAs laser linewidth measurements by heterodyne detection. Appl. Phys. Lett. 1964, 5, 72–74. [Google Scholar] [CrossRef]
  4. Seko, A.; Mitsuhashi, Y.; Morikawa, T.; Shimada, J.; Sakurai, K. Self-quenching in semiconductor lasers and its applications in optical memory readout. Appl. Phys. Lett. 1975, 27, 140–141. [Google Scholar] [CrossRef]
  5. Mitsuhashi, Y.; Morikawa, T.; Sakurai, K.; Seko, A.; Shimada, J. Self-coupled optical pickup. Opt. Commun. 1976, 17, 95–97. [Google Scholar] [CrossRef]
  6. Otsuka, K. Highly sensitive measurement of Doppler-shift with a microchip solid-state laser. Jpn. J. Appl. Phys. 1992, 31, L1546–L1548. [Google Scholar] [CrossRef]
  7. Okamoto, S.; Takeda, H.; Kannari, F. Ultrahighly sensitive laser-Doppler velocity meter with a diode-pumped Nd: YVO4 microchip laser. Rev. Sci. Instruments 1995, 66, 3116–3120. [Google Scholar] [CrossRef]
  8. Nerin, P.; Puget, P.; Besesty, P.; Chartier, G. Self-mixing using a dual-polarisation Nd: YAG microchip laser. Electron. Lett. 1997, 33, 491–492. [Google Scholar] [CrossRef]
  9. Blaize, S.; Bérenguier, B.; Stéfanon, I.; Bruyant, A.; Lérondel, G.; Royer, P.; Hugon, O.; Jacquin, O.; Lacot, E. Phase sensitive optical near-field mapping using frequency-shifted laser optical feedback interferometry. Opt. Express 2008, 16, 11718–11726. [Google Scholar] [CrossRef]
  10. Hao, H.; Guo, D.; Wang, M.; Xia, W.; Ni, X. Micro-displace sensor based on self-mixing interference of the fiber laser with phase modulation. Photonic Sens. 2014, 4, 379–384. [Google Scholar] [CrossRef]
  11. Han, D.; Wang, M.; Zhou, J. Self-mixing speckle in an erbium-doped fiber ring laser and its application to velocity sensing. IEEE Photonics Technol. Lett. 2007, 19, 1398–1400. [Google Scholar]
  12. Wang, M.; Xia, W.; Dai, X.; Zhao, Y. Self-mixing interference in fiber ring laser and its multiplexing. In Proceedings of the 21st International Conference on Optical Fiber Sensors, Ottawa, ON, Canada, 15–19 May 2011; International Society for Optics and Photonics: Bellingham, WA, USA, 2011; Volume 7753, p. 77531Z. [Google Scholar]
  13. Von Staden, J.; Gensty, T.; Elsäßer, W.; Giuliani, G.; Mann, C. Measurements of the α factor of a distributed-feedback quantum cascade laser by an optical feedback self-mixing technique. Opt. Lett. 2006, 31, 2574–2576. [Google Scholar] [CrossRef]
  14. Green, R.P.; Xu, J.H.; Mahler, L.; Tredicucci, A.; Beltram, F.; Giuliani, G.; Beere, H.E.; Ritchie, D.A. Linewidth enhancement factor of terahertz quantum cascade lasers. Appl. Phys. Lett. 2008, 92, 071106. [Google Scholar] [CrossRef]
  15. Dean, P.; Lim, Y.L.; Valavanis, A.; Kliese, R.; Nikolić, M.; Khanna, S.P.; Lachab, M.; Indjin, D.; Ikonić, Z.; Harrison, P.; et al. Terahertz imaging through self-mixing in a quantum cascade laser. Opt. Lett. 2011, 36, 2587–2589. [Google Scholar] [CrossRef] [PubMed]
  16. Dean, P.; Valavanis, A.; Keeley, J.; Bertling, K.; Leng Lim, Y.; Alhathlool, R.; Chowdhury, S.; Taimre, T.; Li, L.H.; Indjin, D.; et al. Coherent three-dimensional terahertz imaging through self-mixing in a quantum cascade laser. Appl. Phys. Lett. 2013, 103, 181112. [Google Scholar] [CrossRef]
  17. Dean, P.; Valavanis, A.; Keeley, J.; Bertling, K.; Lim, Y.; Alhathlool, R.; Burnett, A.; Li, L.; Khanna, S.; Indjin, D.; et al. Terahertz imaging using quantum cascade lasers—a review of systems and applications. J. Phys. D Appl. Phys. 2014, 47, 374008. [Google Scholar] [CrossRef]
  18. Dean, P.; Mitrofanov, O.; Keeley, J.; Kundu, I.; Li, L.; Linfield, E.H.; Giles Davies, A. Apertureless near-field terahertz imaging using the self-mixing effect in a quantum cascade laser. Appl. Phys. Lett. 2016, 108, 091113. [Google Scholar] [CrossRef]
  19. Taimre, T.; Bertling, K.; Lim, Y.L.; Dean, P.; Indjin, D.; Rakić, A.D. Methodology for materials analysis using swept-frequency feedback interferometry with terahertz frequency quantum cascade lasers. Opt. Express 2014, 22, 18633–18647. [Google Scholar] [CrossRef]
  20. Bertling, K.; Lim, Y.; Taimre, T.; Indjin, D.; Dean, P.; Weih, R.; Höfling, S.; Kamp, M.; Von Edlinger, M.; Koeth, J.; et al. Demonstration of the self-mixing effect in interband cascade lasers. Appl. Phys. Lett. 2013, 103, 231107. [Google Scholar] [CrossRef]
  21. Köhler, R.; Tredicucci, A.; Beltram, F.; Beere, H.E.; Linfield, E.H.; Davies, A.G.; Ritchie, D.A.; Iotti, R.C.; Rossi, F. Terahertz semiconductor-heterostructure laser. Nature 2002, 417, 156–159. [Google Scholar] [CrossRef]
  22. Williams, B.S. Terahertz quantum-cascade lasers. Nat. Photonics 2007, 1, 517. [Google Scholar] [CrossRef]
  23. Kumar, S. Recent Progress in Terahertz Quantum Cascade Lasers. IEEE J. Sel. Top. Quantum Electron. 2011, 17, 38–47. [Google Scholar] [CrossRef]
  24. Walther, C.; Fischer, M.; Scalari, G.; Terazzi, R.; Hoyler, N.; Faist, J. Quantum cascade lasers operating from 1.2 to 1.6 THz. Appl. Phys. Lett. 2007, 91, 131122. [Google Scholar] [CrossRef]
  25. Scalari, G.; Walther, C.; Fischer, M.; Terazzi, R.; Beere, H.; Ritchie, D.; Faist, J. THz and sub-THz quantum cascade lasers. Laser Photon. Rev. 2009, 3, 45–66. [Google Scholar] [CrossRef]
  26. Chan, C.W.I.; Hu, Q.; Reno, J.L. Ground state terahertz quantum cascade lasers. Appl. Phys. Lett. 2012, 101, 151108. [Google Scholar] [CrossRef]
  27. Wienold, M.; Röben, B.; Lü, X.; Rozas, G.; Schrottke, L.; Biermann, K.; Grahn, H.T. Frequency Dependence of the Maximum Operating Temperature for Quantum-cascade Lasers up to 5.4 THz. Appl. Phys. Lett. 2015, 107, 202101. [Google Scholar] [CrossRef]
  28. Li, L.; Chen, L.; Zhu, J.; Freeman, J.; Dean, P.; Valavanis, A.; Davies, A.; Linfield, E. Terahertz Quantum Cascade Lasers with >1 W Output powers. Electron. Lett. 2014, 50, 309–311. [Google Scholar] [CrossRef]
  29. Khalatpour, A.; Tam, M.C.; Addamane, S.J.; Reno, J.; Wasilewski, Z.; Hu, Q. Enhanced operating temperature in terahertz quantum cascade lasers based on direct phonon depopulation. Appl. Phys. Lett. 2023, 122, 161101. [Google Scholar] [CrossRef]
  30. Wienold, M.; Röben, B.; Schrottke, L.; Sharma, R.; Tahraoui, A.; Biermann, K.; Grahn, H.T. High-temperature, continuous-wave operation of terahertz quantum-cascade lasers with metal-metal waveguides and third-order distributed feedback. Opt. Express 2014, 22, 3334–3348. [Google Scholar] [CrossRef]
  31. Tonouchi, M. Cutting-edge terahertz technology. Nat. Photonics 2007, 1, 97. [Google Scholar] [CrossRef]
  32. Gmachl, C.; Capasso, F.; Sivco, D.L.; Cho, A.Y. Recent progress in quantum cascade lasers and applications. Rep. Prog. Phys. 2001, 64, 1533. [Google Scholar] [CrossRef]
  33. Kosterev, A.A.; Tittel, F.K. Chemical sensors based on quantum cascade lasers. IEEE J. Quantum Electron. 2002, 38, 582–591. [Google Scholar] [CrossRef]
  34. Wysocki, G.; Lewicki, R.; Curl, R.F.; Tittel, F.K.; Diehl, L.; Capasso, F.; Troccoli, M.; Hofler, G.; Bour, D.; Corzine, S.; et al. Widely tunable mode-hop free external cavity quantum cascade lasers for high resolution spectroscopy and chemical sensing. Appl. Phys. B 2008, 92, 305–311. [Google Scholar] [CrossRef]
  35. McManus, J.B.; Shorter, J.H.; Nelson, D.D.; Zahniser, M.S.; Glenn, D.E.; McGovern, R.M. Pulsed quantum cascade laser instrument with compact design for rapid, high sensitivity measurements of trace gases in air. Appl. Phys. B 2008, 92, 387. [Google Scholar] [CrossRef]
  36. Woolard, D.L.; Loerop, W.R.; Shur, M. Terahertz Sensing Technology: Emerging Scientific Applications & Novel Device Concepts; World Scientific: Singapore, 2003; Volume 2. [Google Scholar]
  37. Leng Lim, Y.; Dean, P.; Nikolić, M.; Kliese, R.; Khanna, S.P.; Lachab, M.; Valavanis, A.; Indjin, D.; Ikonić, Z.; Harrison, P.; et al. Demonstration of a self-mixing displacement sensor based on terahertz quantum cascade lasers. Appl. Phys. Lett. 2011, 99, 081108. [Google Scholar] [CrossRef]
  38. Rakić, A.D.; Taimre, T.; Bertling, K.; Lim, Y.L.; Dean, P.; Indjin, D.; Ikonić, Z.; Harrison, P.; Valavanis, A.; Khanna, S.P.; et al. Swept-frequency feedback interferometry using terahertz frequency QCLs: A method for imaging and materials analysis. Opt. Express 2013, 21, 22194–22205. [Google Scholar] [CrossRef]
  39. Lim, Y.L.; Taimre, T.; Bertling, K.; Dean, P.; Indjin, D.; Valavanis, A.; Khanna, S.P.; Lachab, M.; Schaider, H.; Prow, T.W.; et al. High-contrast coherent terahertz imaging of porcine tissue via swept-frequency feedback interferometry. Biomed. Opt. Express 2014, 5, 3981–3989. [Google Scholar] [CrossRef]
  40. Agnew, G.; Grier, A.; Taimre, T.; Lim, Y.L.; Nikolić, M.; Valavanis, A.; Cooper, J.; Dean, P.; Khanna, S.P.; Lachab, M.; et al. Efficient prediction of terahertz quantum cascade laser dynamics from steady-state simulations. Appl. Phys. Lett. 2015, 106, 161105. [Google Scholar] [CrossRef]
  41. Agnew, G.; Grier, A.; Taimre, T.; Lim, Y.L.; Bertling, K.; Ikonić, Z.; Valavanis, A.; Dean, P.; Cooper, J.; Khanna, S.P.; et al. Model for a pulsed terahertz quantum cascade laser under optical feedback. Opt. Express 2016, 24, 20554–20570. [Google Scholar] [CrossRef]
  42. Valavanis, A.; Dean, P.; Lim, Y.L.; Alhathlool, R.; Nikolic, M.; Kliese, R.; Khanna, S.P.; Indjin, D.; Wilson, S.J.; Rakic, A.D.; et al. Self-mixing interferometry with terahertz quantum cascade lasers. IEEE Sens. J. 2012, 13, 37–43. [Google Scholar] [CrossRef]
  43. Lang, R.; Kobayashi, K. External optical feedback effects on semiconductor injection laser properties. IEEE J. Quantum Electron. 1980, 16, 347–355. [Google Scholar] [CrossRef]
  44. Jirauschek, C.; Kubis, T. Modeling techniques for quantum cascade lasers. Appl. Phys. Rev. 2014, 1, 011307. [Google Scholar] [CrossRef]
  45. Indjin, D.; Harrison, P.; Kelsall, R.W.; Ikonic, Z. Self-consistent scattering model of carrier dynamics in GaAs-AlGaAs terahertz quantum-cascade lasers. IEEE Photonics Technol. Lett. 2003, 15, 15–17. [Google Scholar] [CrossRef]
  46. Demić, A.; Grier, A.; Ikonić, Z.; Valavanis, A.; Evans, C.A.; Mohandas, R.; Li, L.; Linfield, E.H.; Davies, A.G.; Indjin, D. Infinite-Period Density-Matrix Model for Terahertz-Frequency Quantum Cascade Lasers. IEEE Trans. Terahertz Sci. Technol. 2017, 7, 368–377. [Google Scholar] [CrossRef]
  47. Yasuda, H.; Kubis, T.; Vogl, P.; Sekine, N.; Hosako, I.; Hirakawa, K. Nonequilibrium Green’s function calculation for four-level scheme terahertz quantum cascade lasers. Appl. Phys. Lett. 2009, 94, 151109. [Google Scholar] [CrossRef]
  48. Wacker, A.; Lindskog, M.; Winge, D.O. Nonequilibrium Green’s Function Model for Simulation of Quantum Cascade Laser Devices Under Operating Conditions. IEEE J. Sel. Top. Quantum Electron. 2013, 19, 1–11. [Google Scholar] [CrossRef]
  49. Demić, A.; Ikonić, Z.; Kelsall, R.W.; Indjin, D. Density matrix superoperator for periodic quantum systems and its application to quantum cascade laser structures. AIP Adv. 2019, 9, 095019. [Google Scholar] [CrossRef]
  50. Burnett, B.A.; Williams, B.S. Density matrix model for polarons in a terahertz quantum dot cascade laser. Phys. Rev. B 2014, 90, 155309. [Google Scholar] [CrossRef]
  51. Burnett, B.A.; Pan, A.; Chui, C.O.; Williams, B.S. Robust density matrix simulation of terahertz quantum cascade lasers. IEEE Trans. Terahertz Sci. Technol. 2018, 8, 492–501. [Google Scholar] [CrossRef]
  52. Jonasson, O.; Karimi, F.; Knezevic, I. Partially coherent electron transport in terahertz quantum cascade lasers based on a Markovian master equation for the density matrix. J. Comput. Electron. 2016, 15, 1192–1205. [Google Scholar] [CrossRef]
  53. Jirauschek, C. Density matrix Monte Carlo modeling of quantum cascade lasers. J. Appl. Phys. 2017, 122, 133105. [Google Scholar] [CrossRef]
  54. Harrison, P.; Valavanis, A. Quantum Wells, Wires and Dots: Theoretical and Computational Physics of Semiconductor Nanostructures; John Wiley & Sons: Hoboken, NJ, USA, 2016. [Google Scholar]
  55. Pan, A.; Burnett, B.A.; Chui, C.O.; Williams, B.S. Density matrix modeling of quantum cascade lasers without an artificially localized basis: A generalized scattering approach. Phys. Rev. B 2017, 96, 085308. [Google Scholar] [CrossRef]
  56. Jonasson, O.; Knezevic, I. Dissipative transport in superlattices within the Wigner function formalism. J. Comput. Electron. 2015, 14, 879–887. [Google Scholar] [CrossRef]
  57. Freeman, J.R.; Marshall, O.; Beere, H.E.; Ritchie, D.A. Improved wall plug efficiency of a 1.9 THz quantum cascade laser by an automated design approach. Appl. Phys. Lett. 2008, 93, 191119. [Google Scholar] [CrossRef]
  58. Tzenov, P.; Burghoff, D.; Hu, Q.; Jirauschek, C. Time domain modeling of terahertz quantum cascade lasers for frequency comb generation. Opt. Express 2016, 24, 23232–23247. [Google Scholar] [CrossRef] [PubMed]
  59. Boyd, R.W. Nonlinear Optics; Academic Press: Cambridge, MA, USA, 2008. [Google Scholar]
  60. Castin, Y.; Mo, K. Maxwell-Bloch equations: A unified view of nonlinear optics and nonlinear atom optics. Phys. Rev. A 1995, 51, R3426. [Google Scholar] [CrossRef] [PubMed]
  61. Van Tartwijk, G.; Lenstra, D. Semiconductor lasers with optical injection and feedback. Quantum Semiclassical Opt. J. Eur. Opt. Soc. Part B 1995, 7, 87. [Google Scholar] [CrossRef]
  62. Riesch, M.; Jirauschek, C. mbsolve: An open-source solver tool for the Maxwell-Bloch equations. Comput. Phys. Commun. 2021, 268, 108097. [Google Scholar] [CrossRef]
  63. Silvestri, C.; Qi, X.; Taimre, T.; Rakić, A.D. Multimode dynamics of terahertz quantum cascade lasers: Spontaneous and actively induced generation of dense and harmonic coherent regimes. Phys. Rev. A 2022, 106, 053526. [Google Scholar] [CrossRef]
  64. Lindblad, G. On the generators of quantum dynamical semigroups. Commun. Math. Phys. 1976, 48, 119–130. [Google Scholar] [CrossRef]
  65. Kossakowski, A. On quantum statistical mechanics of non-Hamiltonian systems. Rep. Math. Phys. 1972, 3, 247–274. [Google Scholar] [CrossRef]
  66. Gorini, V.; Kossakowski, A.; Sudarshan, E.C.G. Completely positive dynamical semigroups of N-level systems. J. Math. Phys. 1976, 17, 821–825. [Google Scholar] [CrossRef]
  67. Banks, T.; Susskind, L.; Peskin, M.E. Difficulties for the evolution of pure states into mixed states. Nucl. Phys. B 1984, 244, 125–134. [Google Scholar] [CrossRef]
  68. Siegman, A. Lasers; University Science Books: Melville, NY, USA, 1986. [Google Scholar]
  69. Evans, C.A.; Indjin, D.; Ikonic, Z.; Harrison, P.; Vitiello, M.S.; Spagnolo, V.; Scamarcio, G. Thermal modeling of terahertz quantum-cascade lasers: Comparison of optical waveguides. IEEE J. Quantum Electron. 2008, 44, 680–685. [Google Scholar] [CrossRef]
  70. Qi, X.; Bertling, K.; Taimre, T.; Agnew, G.; Lim, Y.L.; Gillespie, T.; Robinson, A.; Brünig, M.; Demić, A.; Dean, P.; et al. Observation of optical feedback dynamics in single-mode terahertz quantum cascade lasers: Transient instabilities. Phys. Rev. A 2021, 103, 033504. [Google Scholar] [CrossRef]
  71. Kane, D.M.; Shore, K.A. Unlocking Dynamical Diversity: Optical Feedback Effects on Semiconductor Lasers; John Wiley & Sons: Hoboken, NJ, USA, 2005. [Google Scholar]
  72. Grier, A. Modelling the Optical and Electronic Transport Properties of AlGaAs and AlGaN Intersubband Devices and Optimisation of Quantum Cascade Laser Active Regions. Ph.D. Thesis, University of Leeds, Leeds, UK, 2015. [Google Scholar]
  73. Galassi, M.; Davies, J.; Theiler, J.; Gough, B.; Jungman, G.; Alken, P.; Booth, M.; Rossi, F.; Ulerich, R. GNU Scientific Library; Network Theory Limited Godalming: Godalming, UK, 2002. [Google Scholar]
  74. Demić, A.; Ikonić, Z.; Dean, P.; Indjin, D. Dual resonance phonon–photon–phonon terahertz quantum-cascade laser: Physics of the electron transport and temperature performance optimization. Opt. Express 2020, 28, 38788–38812. [Google Scholar] [CrossRef]
  75. Rubino, P. Near-Field Imaging Using Self Mixing in Terahertz frequency Quantum Cascade Lasers. Ph.D. Thesis, University of Leeds, Leeds, UK, 2019. Available online: http://etheses.whiterose.ac.uk/25163/ (accessed on 26 October 2025).
  76. Barbieri, S.; Maineult, W.; Dhillon, S.S.; Sirtori, C.; Alton, J.; Breuil, N.; Beere, H.E.; Ritchie, D.A. 13 GHz direct modulation of terahertz quantum cascade lasers. Appl. Phys. Lett. 2007, 91, 143510. [Google Scholar] [CrossRef]
  77. Green, R.P.; Tredicucci, A.; Vinh, N.Q.; Murdin, B.; Pidgeon, C.; Beere, H.E.; Ritchie, D.A. Gain recovery dynamics of a terahertz quantum cascade laser. Phys. Rev. B 2009, 80, 075303. [Google Scholar] [CrossRef]
  78. Bacon, D.R.; Freeman, J.R.; Mohandas, R.A.; Li, L.; Linfield, E.H.; Davies, A.G.; Dean, P. Gain recovery time in a terahertz quantum cascade laser. Appl. Phys. Lett. 2016, 108, 081104. [Google Scholar] [CrossRef]
  79. Derntl, C.G.; Scalari, G.; Bachmann, D.; Beck, M.; Faist, J.; Unterrainer, K.; Darmo, J. Gain dynamics in a heterogeneous terahertz quantum cascade laser. Appl. Phys. Lett. 2018, 113, 181102. [Google Scholar] [CrossRef]
  80. Taimre, T.; Nikolić, M.; Bertling, K.; Lim, Y.L.; Bosch, T.; Rakić, A.D. Laser feedback interferometry: A tutorial on the self-mixing effect for coherent sensing. Adv. Opt. Photon. AOP 2015, 7, 570–631. [Google Scholar] [CrossRef]
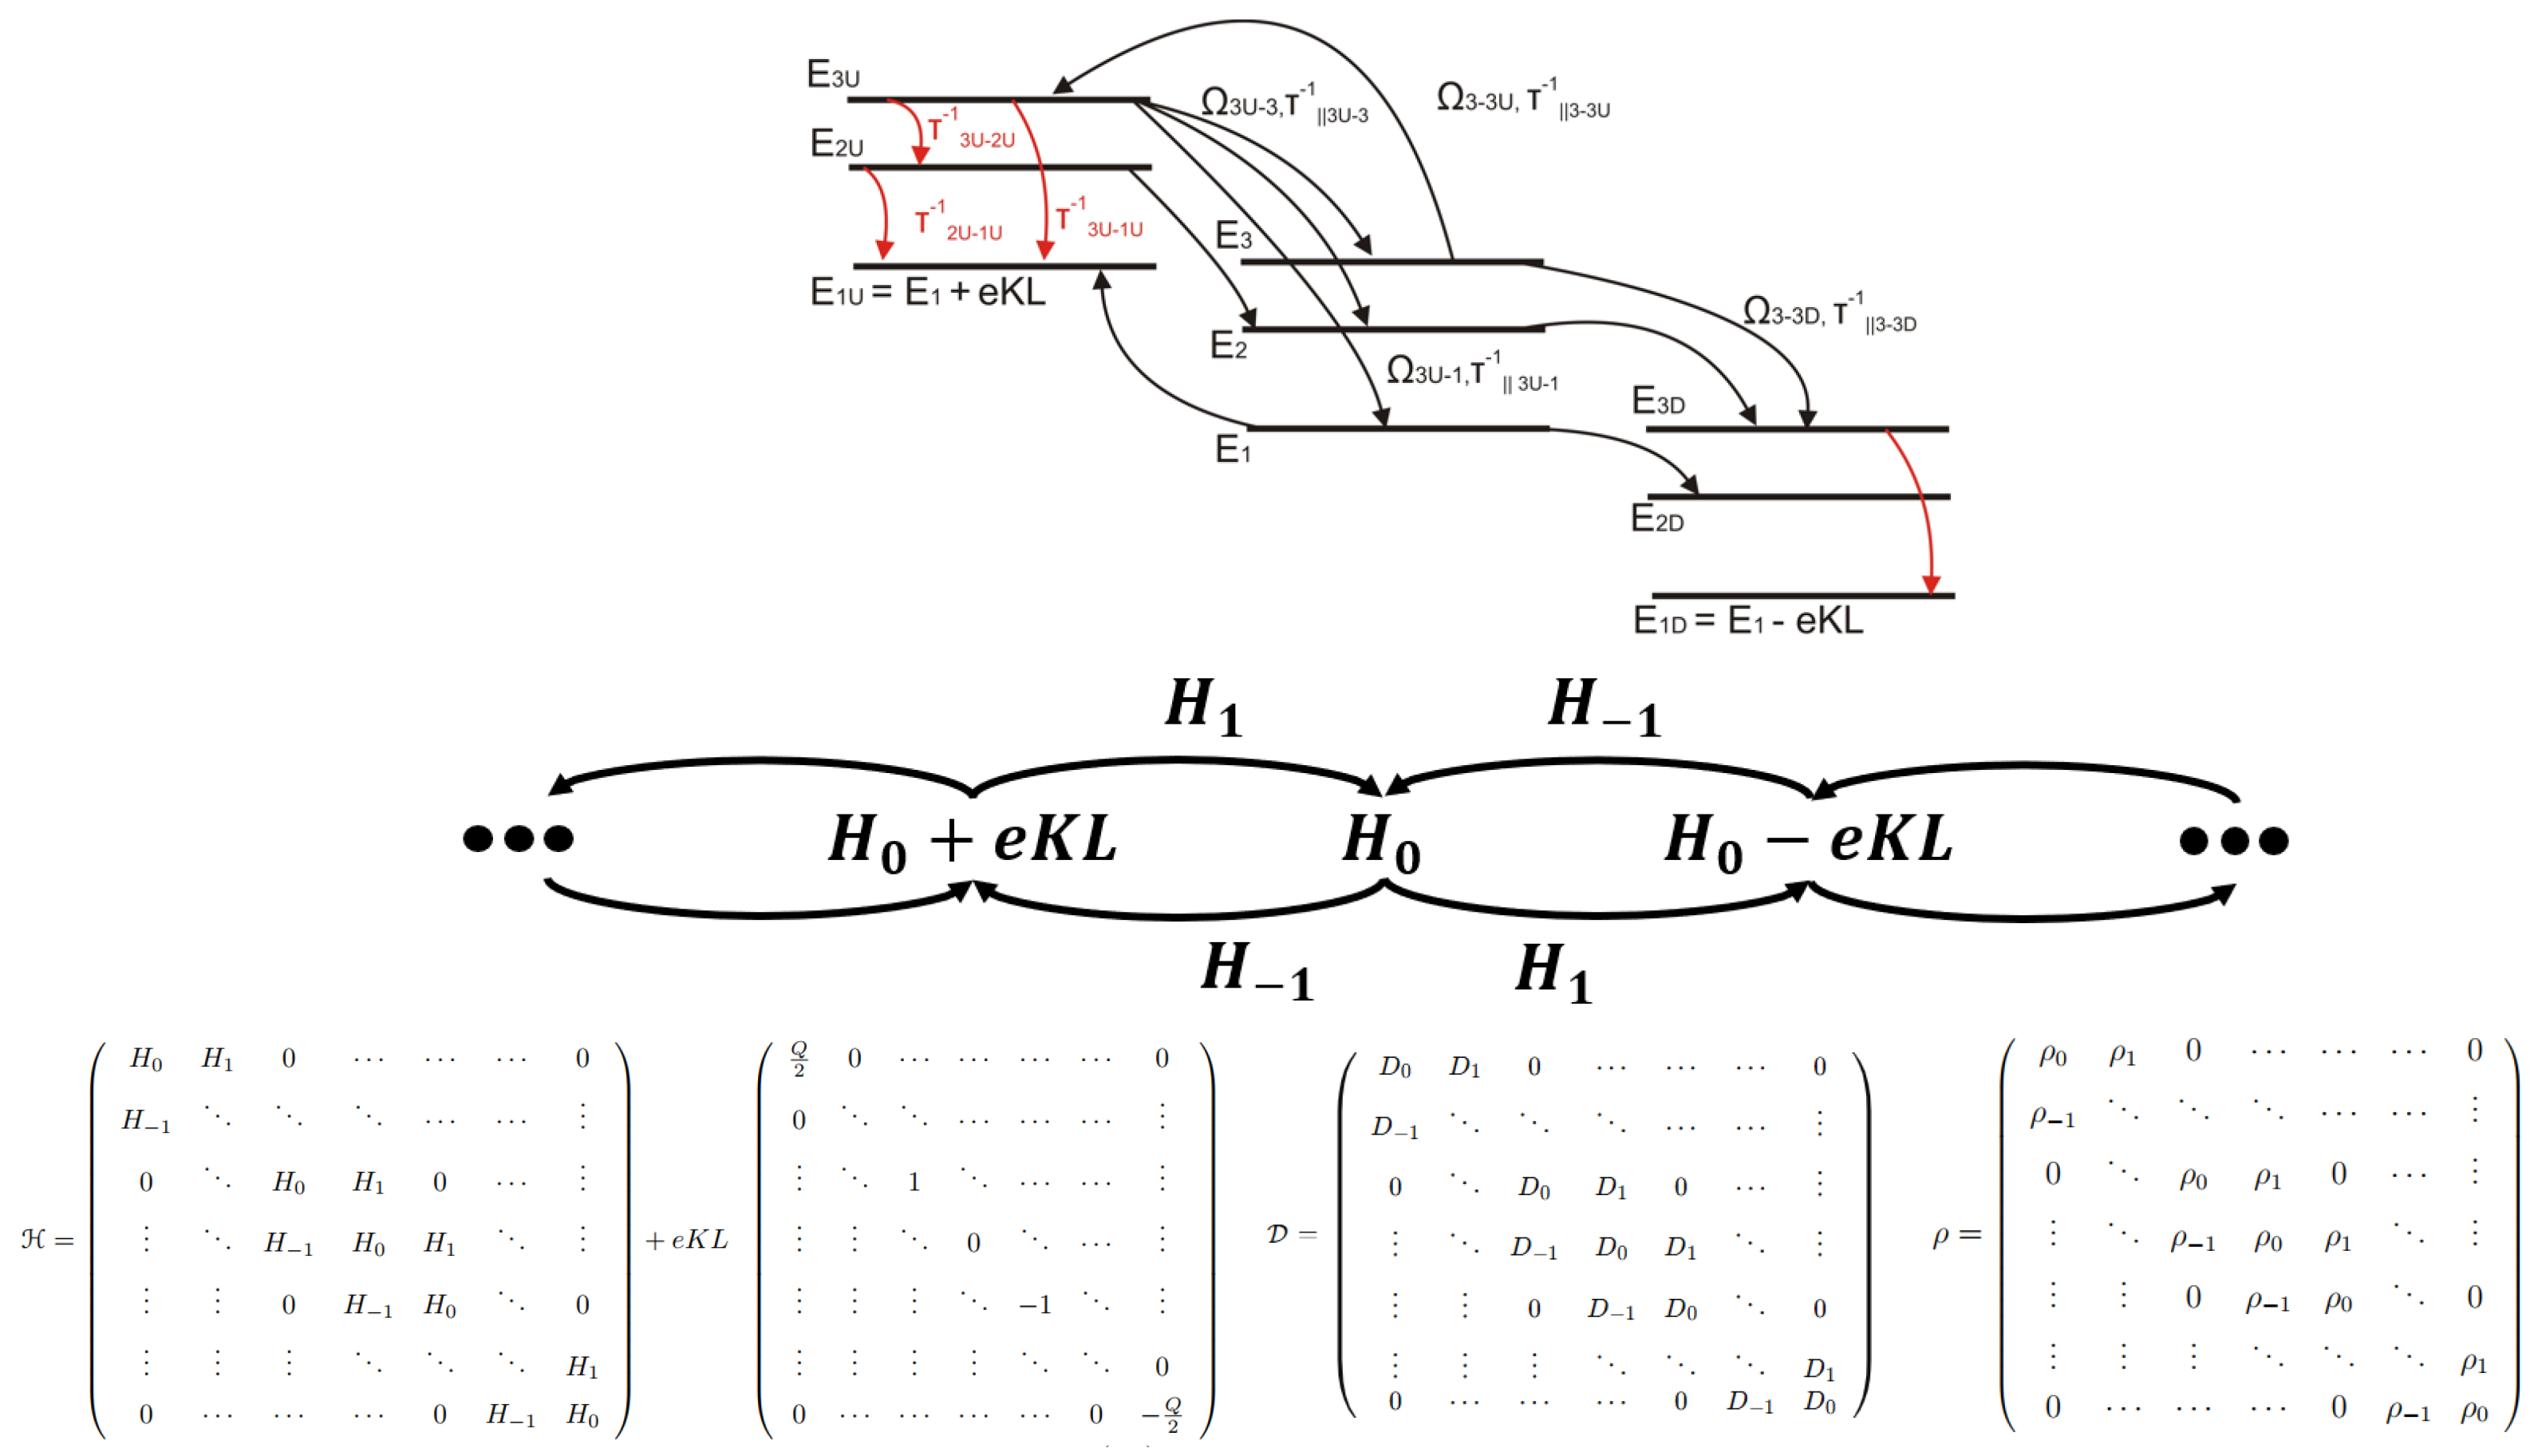
Figure 1. Illustration of DM Hamiltonian under infinitely periodic, tight-binding, and the nearest-neighbor approximation for THz QCL presented in [46,49]. Central period of THz QCL, denoted by its tight-binding Hamiltonian H 0 , interacts with its two nearest-neighboring periods via Hamiltonian blocks H 1 and H 1 . The upstream and downstream periods are shifted by ± e K L due to the application of external electrical field bias K across period of length L, and each interact with their nearest neighbor in a similar fashion. The overall system Hamiltonian ( H ) is an infinite ( Q ) tri-diagonal banded matrix. The H 0 block accounts for sub-band energies and dipole approximation for interaction with optical electrical field, while a coherent inter-period interaction is modeled via Rabi terms Ω i j that form H ± 1 matrix blocks. In addition to the Hamiltonian, the system’s dissipator is also a tri-diagonal banded matrix, where central block corresponds to scattering rates τ i j and lifetimes τ i in central period, while inter-period coherences are modeled via dephasing times τ | | i j . We can assume a similar tri-diagonal banded form of the density matrix.
Photonics 12 01134 g001
Figure 2. Simulated time-dependent material gain for three representative QCL designs at their respective resonant biases at 20 K. (a) LO-phonon based 3.4 THz QCL [28] with K = 8.8 kV cm , (b) BTC QCL [46,57] with K = 1.95 kV cm , (c) Hybrid THz QCL [75] with K = 4.7 kV cm . The insets on the left show the temporal evolution of the optical electric field (real part in blue, imaginary part in red), while the insets on the right display the time evolution of optical power. The central inset (green) displays spectral profile of the material gain at respective external electric field bias for each design. All three designs use a surface plasmon waveguide, with the threshold gain calculated using the model from [69].
Photonics 12 01134 g002aPhotonics 12 01134 g002b
Figure 3. Modeled current density as a function of external bias K within the range of 3.8–5 kV/cm at 20 K for device C [75]. The purple data points represent steady-state solutions derived from the dynamics model shown in Figure 2. The green data points were obtained using the steady-state model [46,49], assuming a negligible optical field in the quantum system. The inset illustrates the single-pass material gain as a function of the applied electric field.
Photonics 12 01134 g003
Figure 4. Simulated time evolution of optical power for varying values of the coupling loss g c . The self-mixing feedback is applied at 50 ps, using the operating bias from device C [75] at 4.56 kV cm , with the cavity length set to the value yielding maximum SM sensitivity at L ext = 0.7 [ m ] + 80 [ μ m ] .
Photonics 12 01134 g004
Figure 5. Modeled dependence of self-mixing voltage on external cavity length, L ext = 0.7 [ m ] + Δ L ext , for various values of coupling loss g c in device C [75]. The self-mixing voltage was calculated by inverse interpolating the steady-state current density using the experimental current–voltage (I–V) curve at 20 K under continuous-wave (CW) operation.
Photonics 12 01134 g005
Figure 6. Self-mixing voltage signal (red) corresponding to the variation in external cavity length (blue), where L ext = 0.7 [ m ] + 75 [ μ m ] + Δ , for a coupling loss of g c = 0.6 cm 1 .
Photonics 12 01134 g006
Disclaimer/Publisher’s Note: The statements, opinions and data contained in all publications are solely those of the individual author(s) and contributor(s) and not of MDPI and/or the editor(s). MDPI and/or the editor(s) disclaim responsibility for any injury to people or property resulting from any ideas, methods, instructions or products referred to in the content.